2.1. Video Database of the NIDA Network
The Italian Network for early Detection of Autism spectrum disorder (ASD) (NIDA network) is the largest Italian cohort of infants at risk for AS. The NIDA network enrolls high risk infants (i.e., siblings of children with a diagnosis of ASD, preterm newborns, and small for gestational age newborns) and low risk infants (i.e., siblings of typically developing children) after delivery with the aim of recording and assessing infant crying and spontaneous movements at 10 days, and 6, 12, 18, and 24 weeks of age. In addition, a comprehensive clinical evaluation of the infants/toddlers was performed at 6, 12, 18, 24, and 36 months. The study was carried out according to the standards for good ethical practice and the guidelines of the Declaration of Helsinki. The study protocol was approved by the Ethics Committee of the Istituto Superiore di Sanità (Approval Number: Pre 469/2016). Written informed consent from a parent/guardian of each participant was obtained.
The video recording of the infant’s movements was generally performed at home while the child was lying on a bed, upon a green blanket provided by the NIDA network. The camera was placed 50 cm above the child, at chest height. The recording took place for at least 5 min with the aim of acquiring images of spontaneous movement of the full body of the child. To be analyzed with Movidea, each video recording was edited offline. A preliminary analysis of the videos showed that the high-quality video of all segments (i.e., without external interferences) did not exceed 3 min. Thus, we decided to save a 3 min video segment that represented the shorter high-quality frame for each recording. One author cut each video to ensure the same properties: 3 min length, infant in supine position, in a condition of well-being and spontaneous motor activity, without crying episodes. If videos showed more than 3 min of high quality frame, we decided to analyze the first high quality 3 min. Videoframes containing interferences by the operator and parents, as well as accidental movements of the camera, were excluded from the analysis.
For this study, 300 videos from the NIDA database were analyzed. A total of 90 infants were video recorded (mean gestational age at birth = 39.05 ± 1.35 weeks, mean body weight at birth 3300.98 ± 383.78 g, mean body length at birth = 50.27 ± 1.76 cm). Infant risk status, sex, and age at recording are reported in
Table 1.
Infant risk status, sex, and age at recording using a 3D camera are reported in
Table 2.
2.2. Movidea Software
Movidea develops upon the arising need to identify early markers of neurodevelopmental disorders in infants, obtained through objective measures taken outside the clinical settings. In order to respond to this need, the software was designed to extract kinematic features of limbs from single-camera video recordings acquired in free movement conditions. The features were computed using two different approaches. On one hand, the trajectories covered by the infant’s limbs during the free movement were extracted using a semi-automatic limbs’ tacking procedure. On the other hand, movement quantification was performed through image processing techniques applied to the video frames. The software was developed using MATLAB ver. R2017a and its standard tools. The Movidea software was implemented for and is owned by the Italian research governmental institution, Istituto Superiore di Sanità, and by the Ministry of Health that funded the NIDA Network project. The software was implemented exclusively for research purposes.
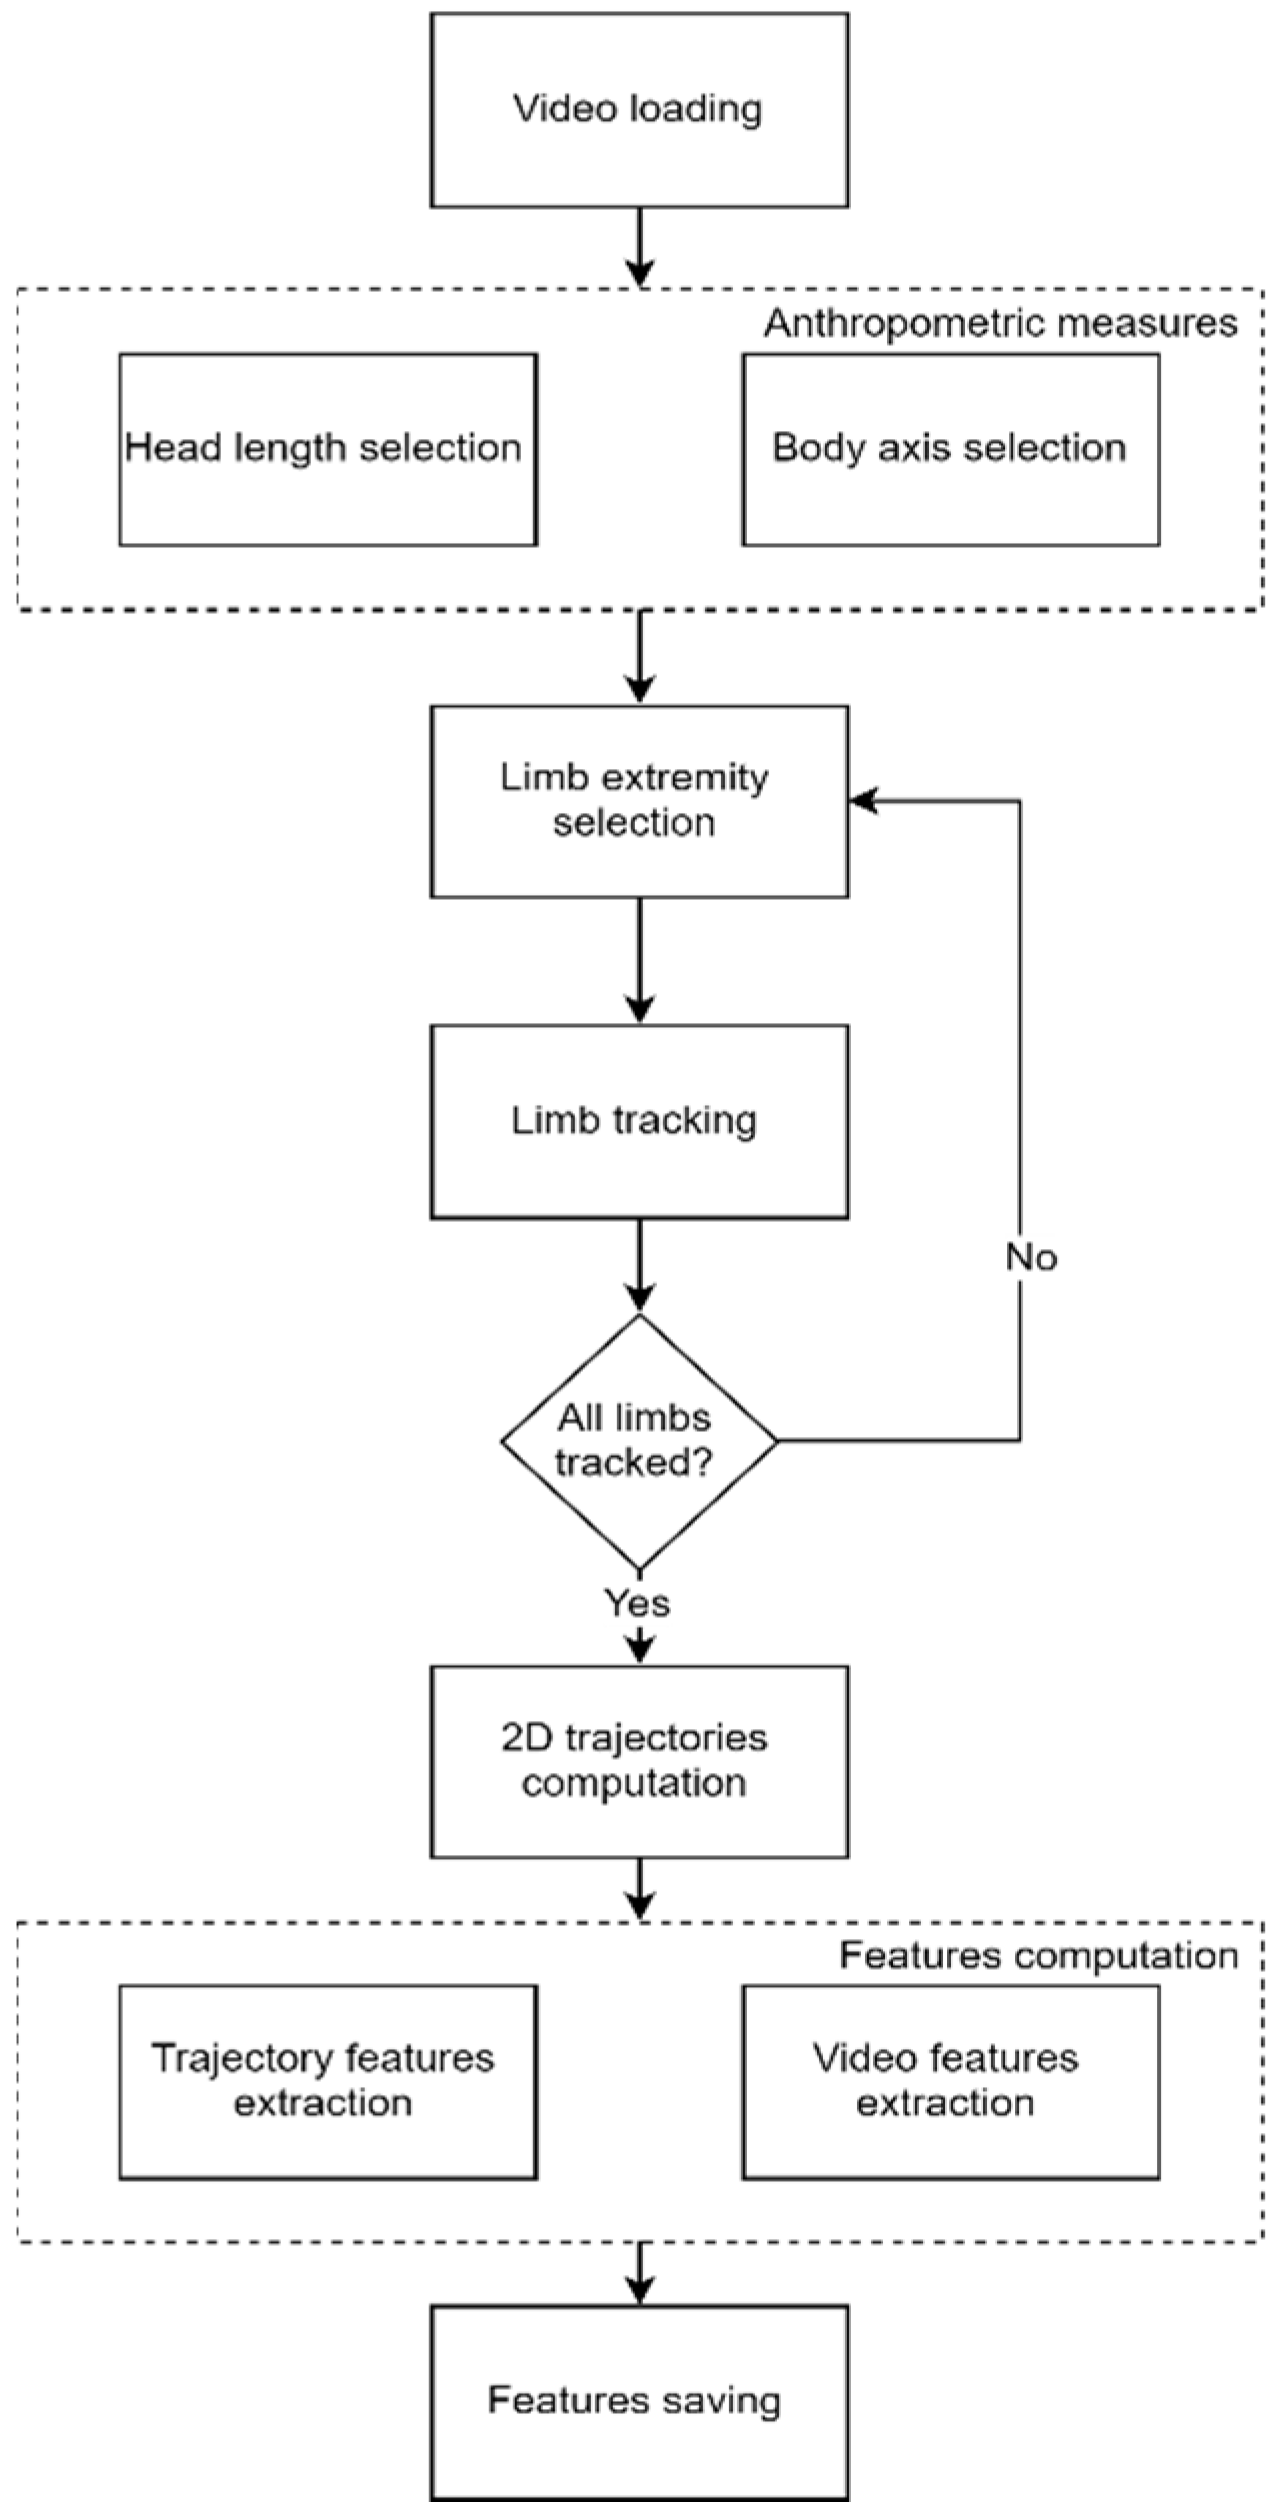
The overall workflow of the software is reported in
Figure 1.
The software was designed to allow the operators to go easily through the complete software workflow. A Graphical User Interface was developed to guide the software operator through each step. The operators were equipped with a user manual describing the software and all the interaction modalities, but no specific training was provided by technical experts. This aspect highlights the general usability of the software and easiness of operation deriving from the proposed approach.
2.3. Movement Tracking
The absolute distance could not be measured using one camera setup, and thus the 2D tracked trajectories needed to be measured in pixels. Indeed, the relation between the pixel and the actual distance measure depended on several factors such as camera resolution and camera–subject distance, making this relation not constant outside the single video framework. Thus, using the pixel as the measurement unit did not allow for the comparison of the data among different videos.
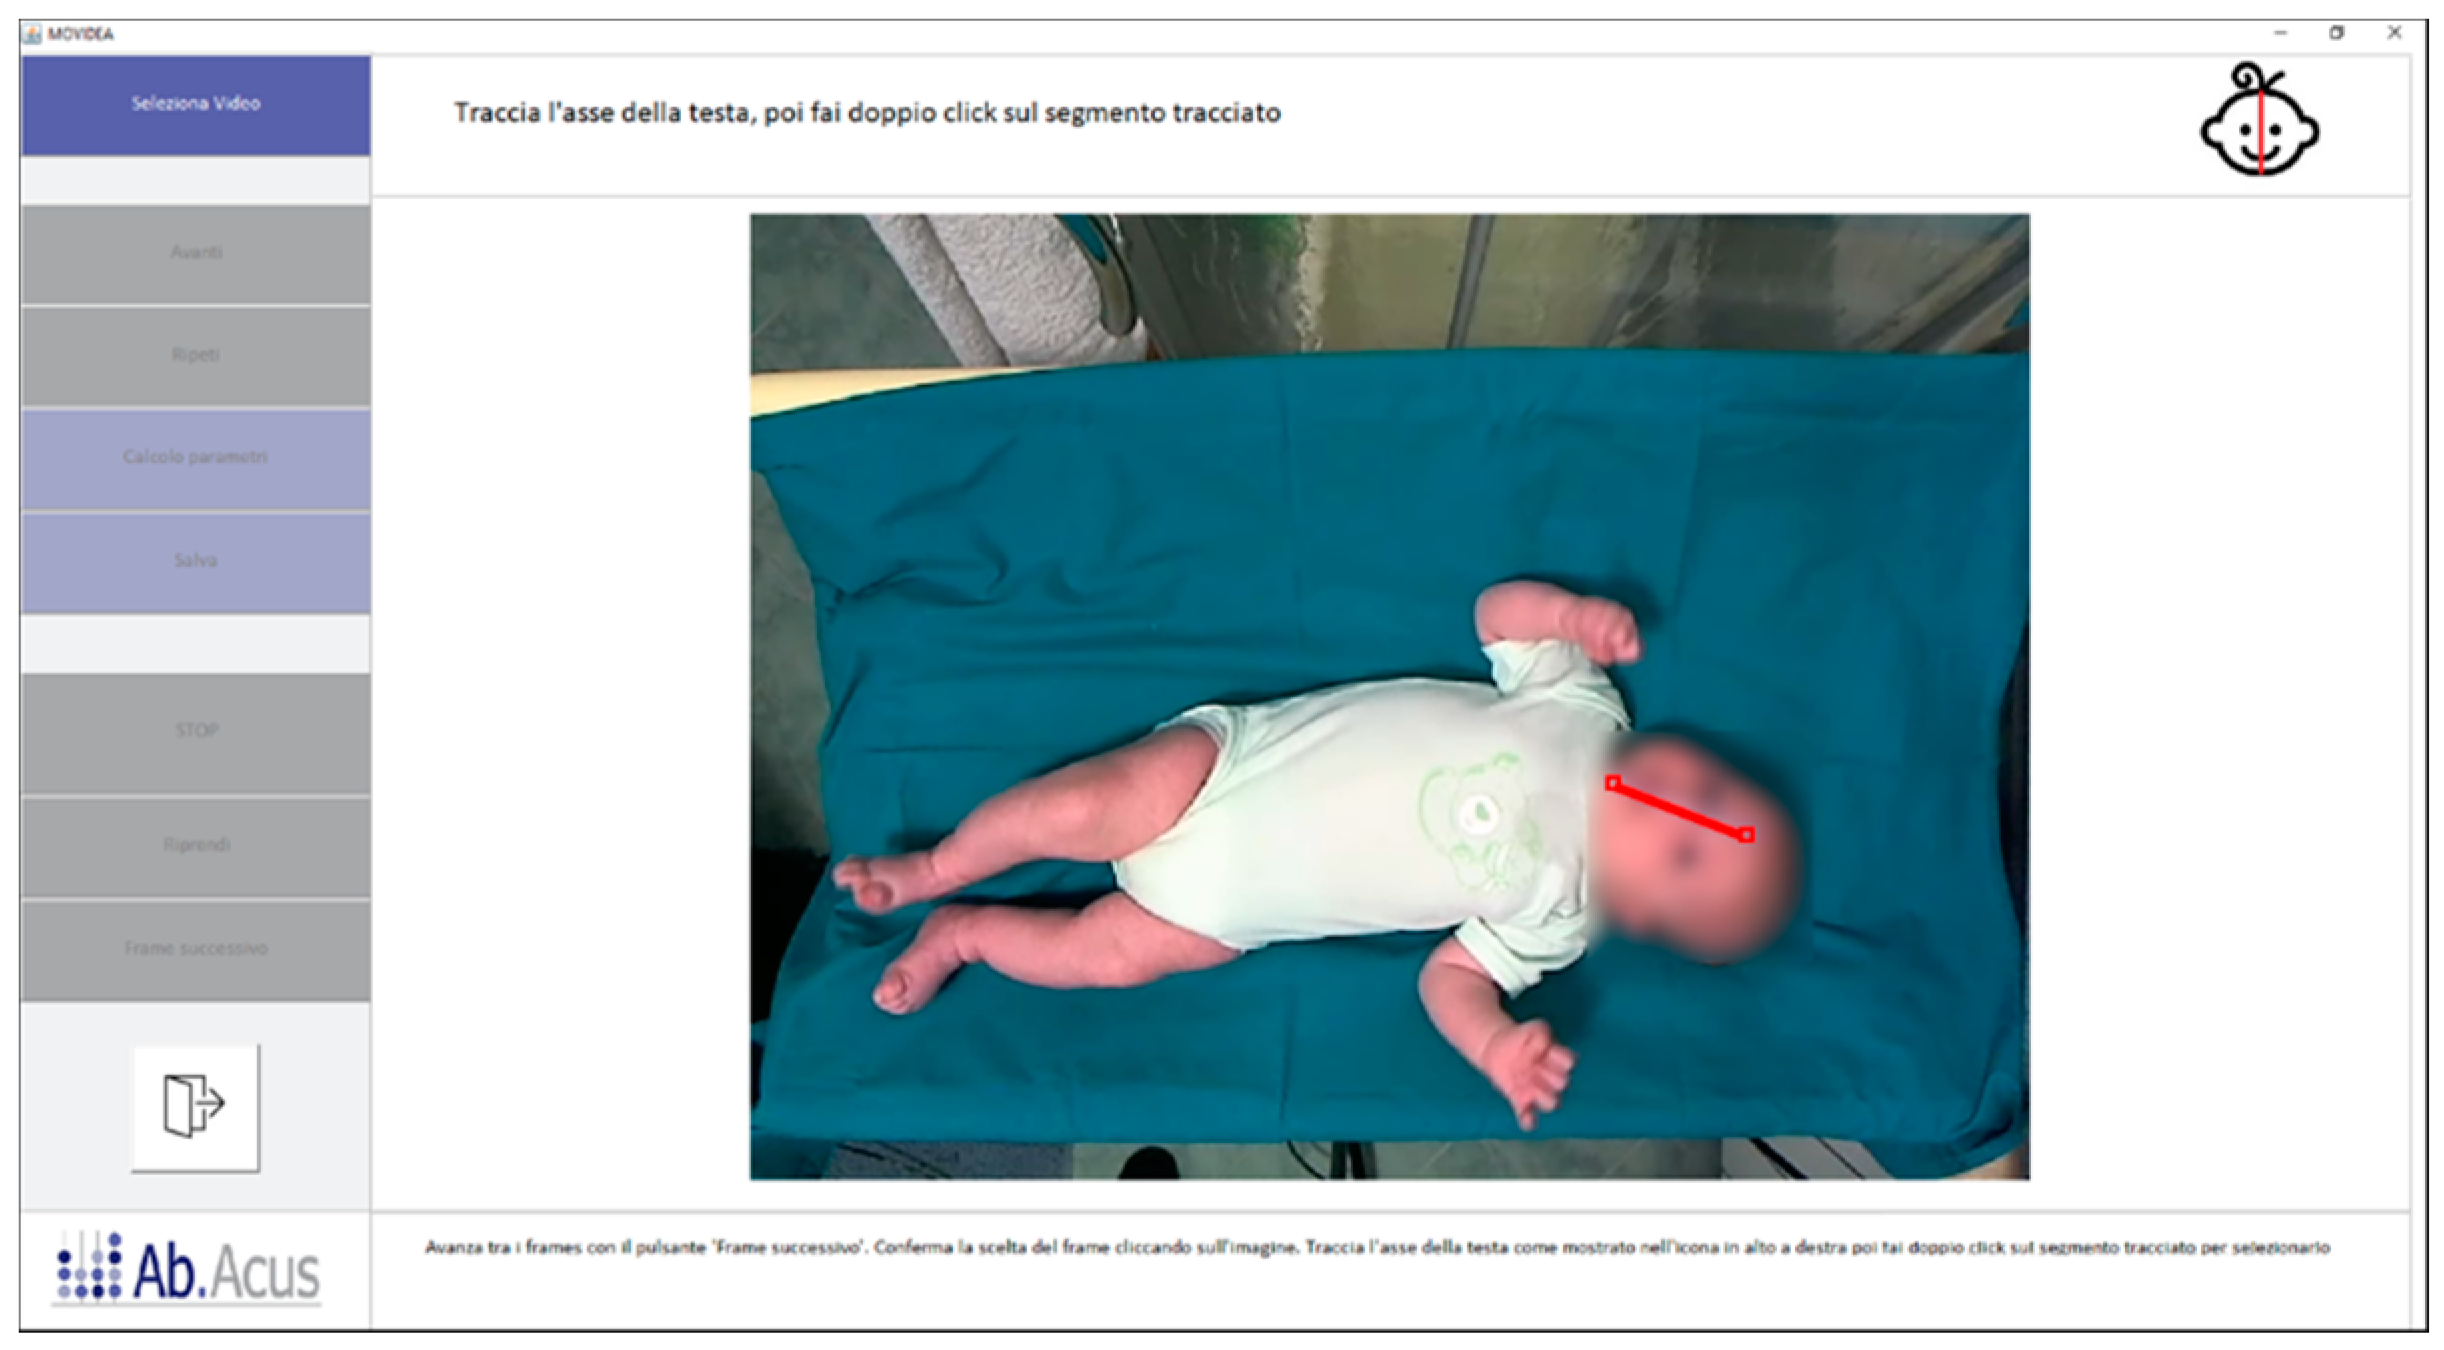
To overcome this issue, the measure, in pixels, of the head length was used to normalize the data as anthropometric-related information suitable for allowing comparisons along time and subjects. The selection of the head length measure was the first step required by the software before proceeding with the tracking, and it was performed by manually setting the starting and the ending point of the line connecting the forehead and the chin of the infant in a video frame where both the points were clearly visible (
Figure 2).
Besides the head length, the operator was requested to select the central line of infant’s body (symmetry line) as the perpendicular line running down the surface of the body passing from the midpoint of the clavicle-line to the midpoint of inferior margin of the pelvis (
Figure 3). This operation allowed the operator to compute the body orientation in the image frame and, therefore, to represent the trajectories with standard orientation and to perform a final visual check of the data quality.
Once the reference measures were taken, the limbs tracking can be performed. For each limb, the tracking required the operator first to identify the limb by selecting the central point of the end effector (i.e., hand, foot). The selected point was then tracked frame by frame using the Kanade–Lucas–Tomasi (KLT) algorithm [
21]. To reduce the computational load and false positives, the algorithm was configured to search for the matching point in a squared area with a side size equal to 25% of the head length, centered in the coordinates of the point identified in the previous frame. In case the algorithm failed to locate the point in a frame, the operator could manually re-set the point to be tracked. If the tracked end effector was not visible in the frame (e.g., hidden by other body segments), the operator could skip the frame, avoiding producing invalid data.
The result of the tracking process for each limb was a
N × 2 matrix containing the coordinates of the end effector’s reference point in the image for each of the
N frames of the video (
Figure 4).
The trajectories were then normalized by the head length, and a linear interpolation was applied to compensate the missing values corresponding to the skipped frames. Indeed, if a limb was not tracked for a long time period, the interpolation may produce an artificial trend in the data and may compromise the informative content. For this reason, the data were not interpolated in case the limb presented more than five consecutive missing values. As the sampling rate of the analyzed videos was 12.5 Hz, the maximum time interval for the interpolation of missing data was equal to 400 ms.
The preprocessed trajectories were used for the computation of a set of movement features meaningful for the identification of pathological motion patterns [
17]:
Velocity and Acceleration—The velocity was computed for each limb as the Euclidian distance of the reference point’s location between two subsequent frames. The fast oscillations of the velocity profiles were then canceled through a third order low-pass Butterworth filter, with a cut-off frequency equal to the 95% of the Nyquist frequency. The acceleration of each limb was computed as the difference between two subsequent velocity samples. The mean velocity and mean acceleration of each limb was computed.
Cross-correlation (CC)—The zero-lag cross correlation between the velocity of each pair of limbs was computed as reported in [
14], using the following equation:
where
CCv1v2 is the cross-correlation between the velocity
v1 and the velocity
v2, σ
v1v2 is the covariance of
v1 and
v2,
is the variance of
v1, and
is the variance of
v2.
CC is a measure of the synchronicity of the movements of the limbs, and it is a suitable marker of neurodevelopmental disorders in infants [
17].
Area differing from moving average (Ama)—For both the
x and
y components of the trajectory of each limb, the moving average was computed over the whole recording by using a window with a size of 30 samples according to the following equation:
where
is the moving average computed at the
i-th frame,
k is the window’s size, and
x is the point position in the
j-th frame.
The window size was chosen to average over 2 s, as reported in [
17]. For each sample of the trajectory, the difference between the trajectory and the moving average was computed according to the following equation:
where
Amax is the area differing from the moving average of the
x component and
l is the total number of frames of the recording.
Moreover, the total
Ama was calculated for the lower and the upper limbs as the sum of the area differing from the moving average of the two components of the two hands and the two feet, respectively. The
Ama represents an index of the smoothness of the movements and it is a marker of neurodevelopmental disorders in infants [
17].
Periodicity (P)—Periodicity is a parameter defined in [
17] aimed at measuring the presence of repetitive movements in the motion of the limbs. To compute the periodicity, the recording was split into windows of 500 samples. In [
17], the size of the window corresponded to one third of the total recording duration. To keep the computation coherent independently from the video length, the window’s size was chosen to guarantee the same time span of 40 s used in [
17]. For both the components of the movement of each limb, the mean of the trajectory was computed over each window, and the intersections of the trajectory with the mean were detected. The mean distance
and the standard deviation
between consecutive intersections were computed. Finally, the periodicity
P was computed by combining the parameters mentioned above, according to the following equation:
2.4. Image Processing
The image processing approach leverages on the movement quantification from the changes occurring in the image from one frame to the next one. To this goal, the first step of the processing was the creation of motion images where only the pixels changed in one frame with respect to the previous one due to the infant’s movement were represented. In motion images, each pixel can assume only a value of 1 or 0, 1 (white) representing the occurrence of movement, and 0 (black) representing the absence of movement.
To obtain the motion images, the image of each frame was converted to black and white, and the difference with the black and white image of the previous frame was computed, resulting in a new image representing the changes occurring between the two frames. In order to account only for the changes related to the infant’s movement, a 2D median filter was applied to 5 × 5 pixel areas to remove salt and pepper noise. The pixels overcoming a predefined threshold were then set to 1, and all the other pixels were set to 0. The threshold was chosen as the optimal value for reducing the noise due to change in the light conditions and presence of blurry images, avoiding at the same time the suppression of actual movements of the limbs. For removing the residual noise present on the images, a convolutional filter with a 3 × 3 equally weighted kernel was finally applied.
The motion images were used to compute several features related to the pathological conditions [
22]:
Quantity of motion (Q)—is the number of pixels where the movement has occurred, divided by the total number of pixels in the image. The mean (
Qmean), the standard deviation (
Qsd), and the maximum value (
Qmax) are computed [
22].
Centroid of motion (C)—is a parameter representing the central point of the infant’s movement in a given motion image. C is computed as the centroid of the cluster resulting from the application of a one-cluster
k-means to the movement pixels of each motion image. The mean values C
xmean and C
ymean of C in
x and
y directions are computed over the recording together with the standard deviations C
xsd and C
ysd [
14]. The mean and the standard deviation of the velocity (V
mean, V
sd) and the acceleration (A
mean, A
sd) of the centroid are also computed.
2.5. Software Validation
In order to verify the independence of measures extracted from the operator, a subset of 10 videos was analyzed through Movidea by two independent users, sharing the same instructions on how to operate the software.
The trajectories obtained by the scoring were compared between the two operators by computing the zero-lag correlation coefficient. Indeed, this approach allowed for a trend comparison rather than a comparison of the absolute position of the tracked point, which did not affect the final measures.
In addition, the consistency of the features extracted by the two operators was tested. To this scope, the intraclass correlation coefficient (ICC) [
23] was computed using a two-way random single measure absolute agreement model [
24]. The ICC was computed only for the features extracted from the trajectories, as the image processing features were automatically extracted and were independent of the operator intervention.
The tracking failure rate was computed as the percentage of the number of times the operator had to manually re-set the tracking point, with respect to the total number of frames. This score was computed on a sample of 300 analyzed video segments.
Another important issue to be verified involving assessing the methodology that was implemented in Movidea was the dimensionality of the information. The single camera setup resulted in a reduction of the three-dimensional motion of the limbs to a bidimensional space implying a reduction of information. Given these considerations, it is useful to quantify the information loss. For this purpose, we recorded five infants’ videos using a 3D camera (RealSense D435, Intel, Santa Clara, CA, USA). Through the 3D camera, the RGB video and the depth information were recorded. The depth and RGB images were registered to obtain the 3D coordinates of the recorded points. The RGB videos were analyzed using Movidea, and the tracked trajectories were mapped in the new 3D space. The features previously described were computed on the 3D trajectories. The z-axis contribution was estimated on the features computed on the single axes (i.e., Ama, , , and P) as the percentage of the feature computed on z with respect to the sum of the features computed on x, y, and z.

 ,
, 


