
Bimodal Data Fusion of Simultaneous Measurements of EEG and fNIRS during Lower Limb Movements

 , , , and
Abstract
:1. Introduction
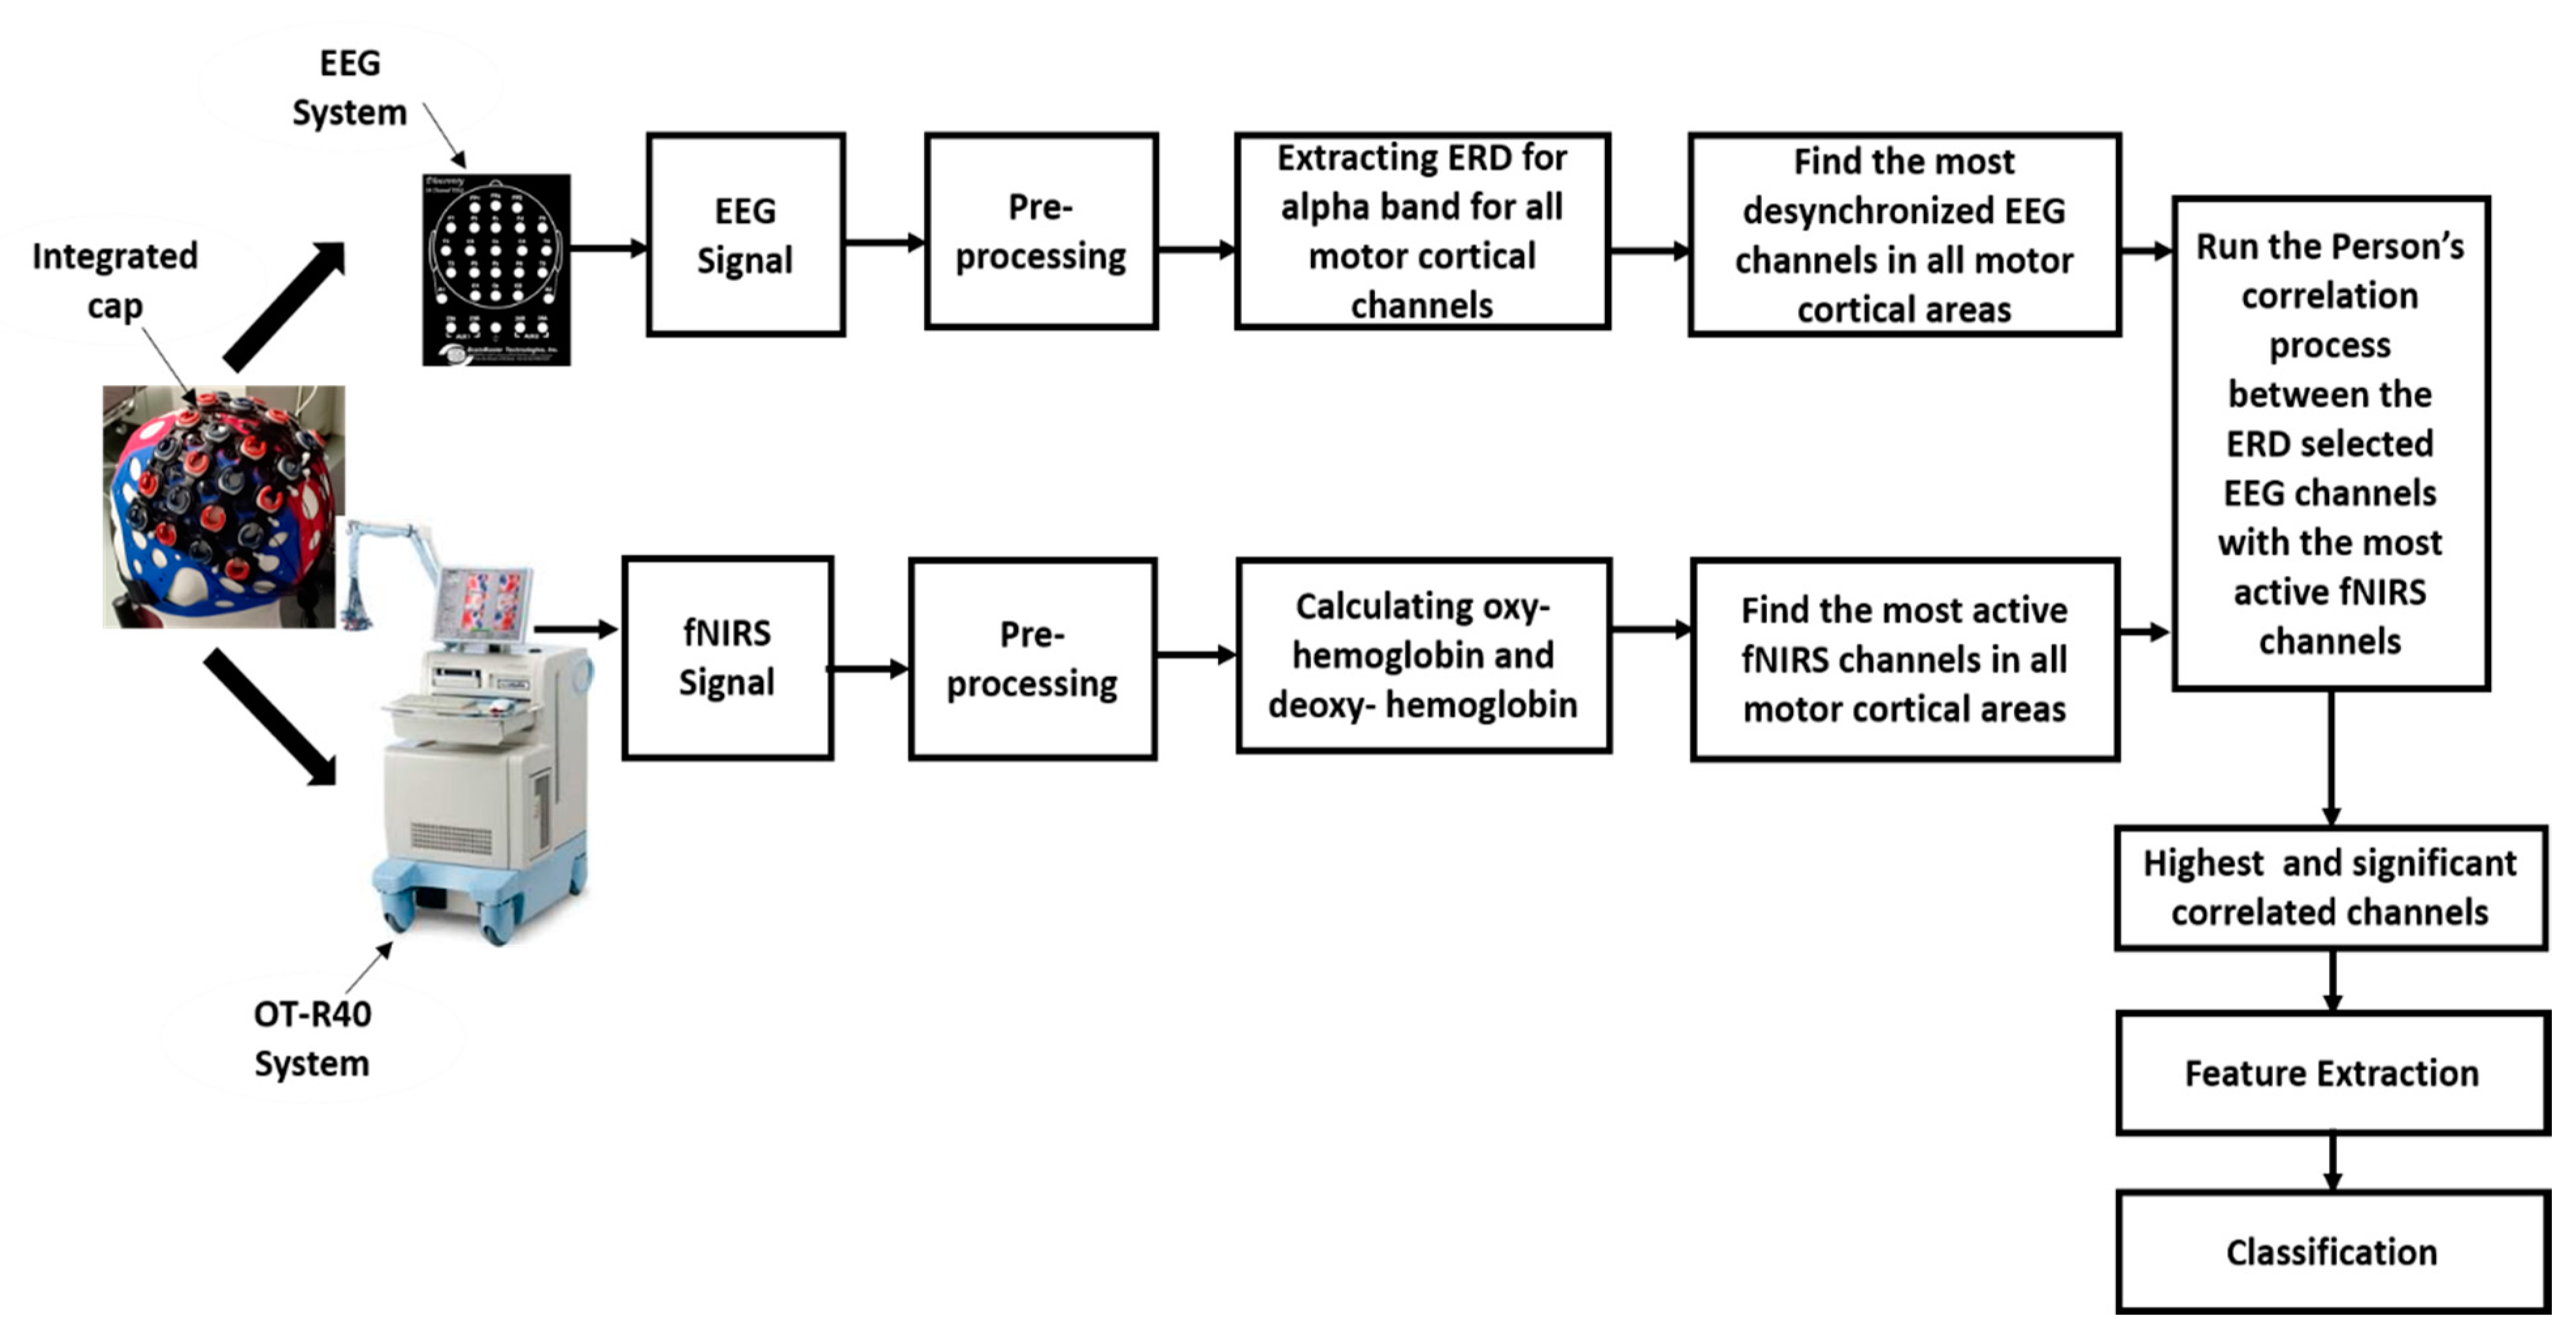
2. Materials and Methods
2.1. Participants
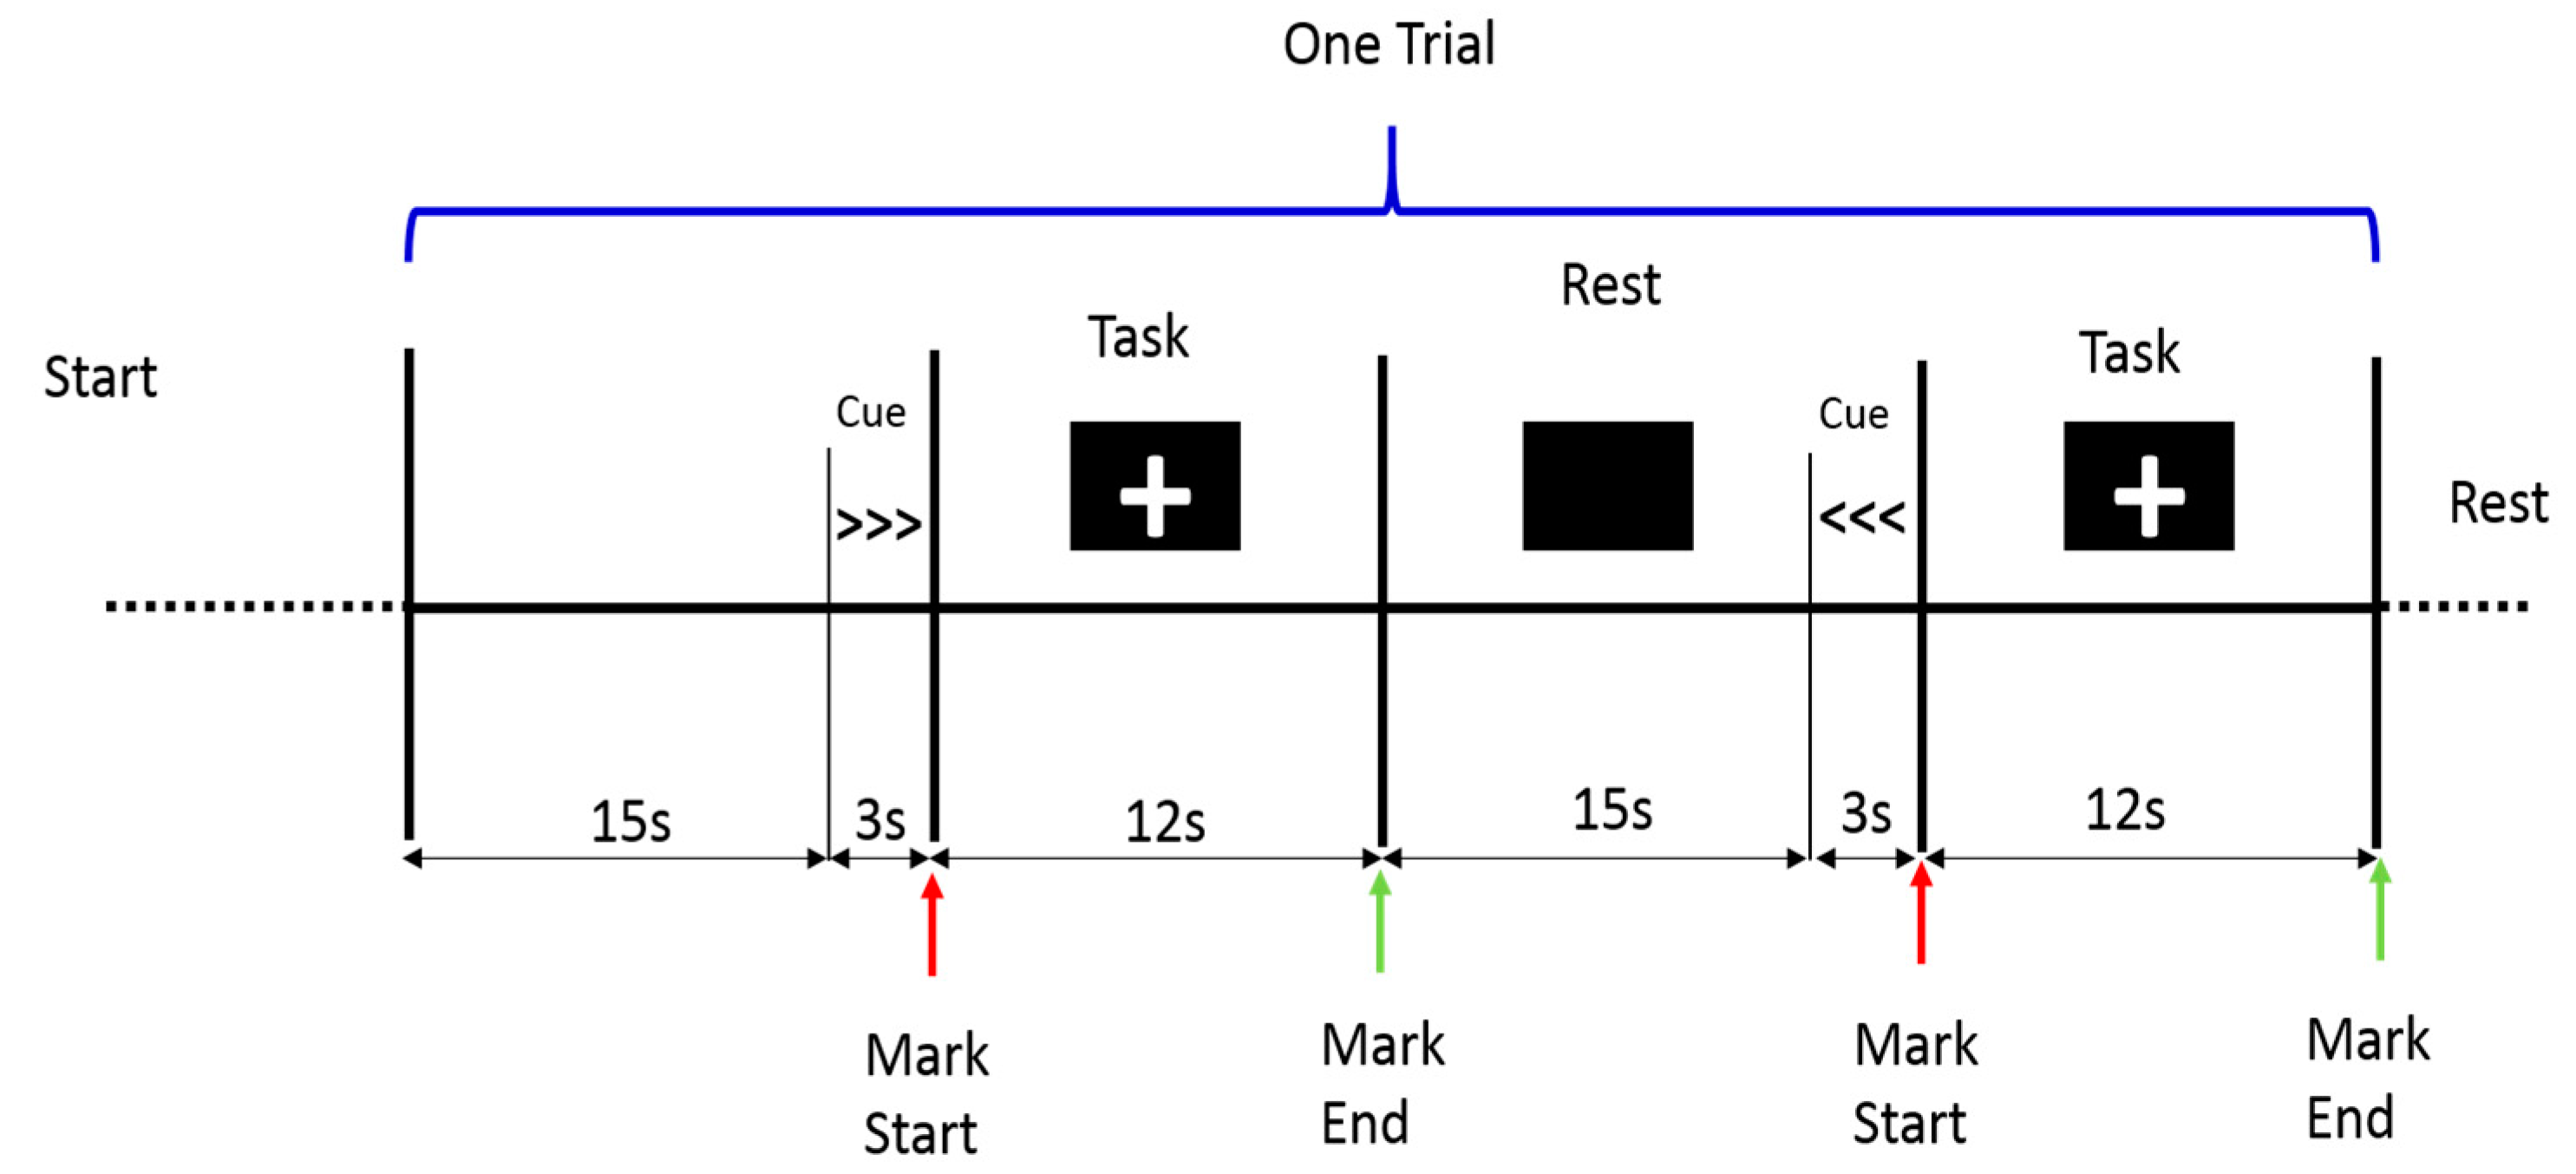
2.2. Procedure
2.3. EEG Data Acquisition Procedure
2.4. fNIRS Data Acquisition Procedure
2.5. EEG Data Processing
2.6. fNIRS Data Processing
2.7. EEG and fNIRS Correlation Analysis
2.8. Feature Extraction and Classification
3. Results
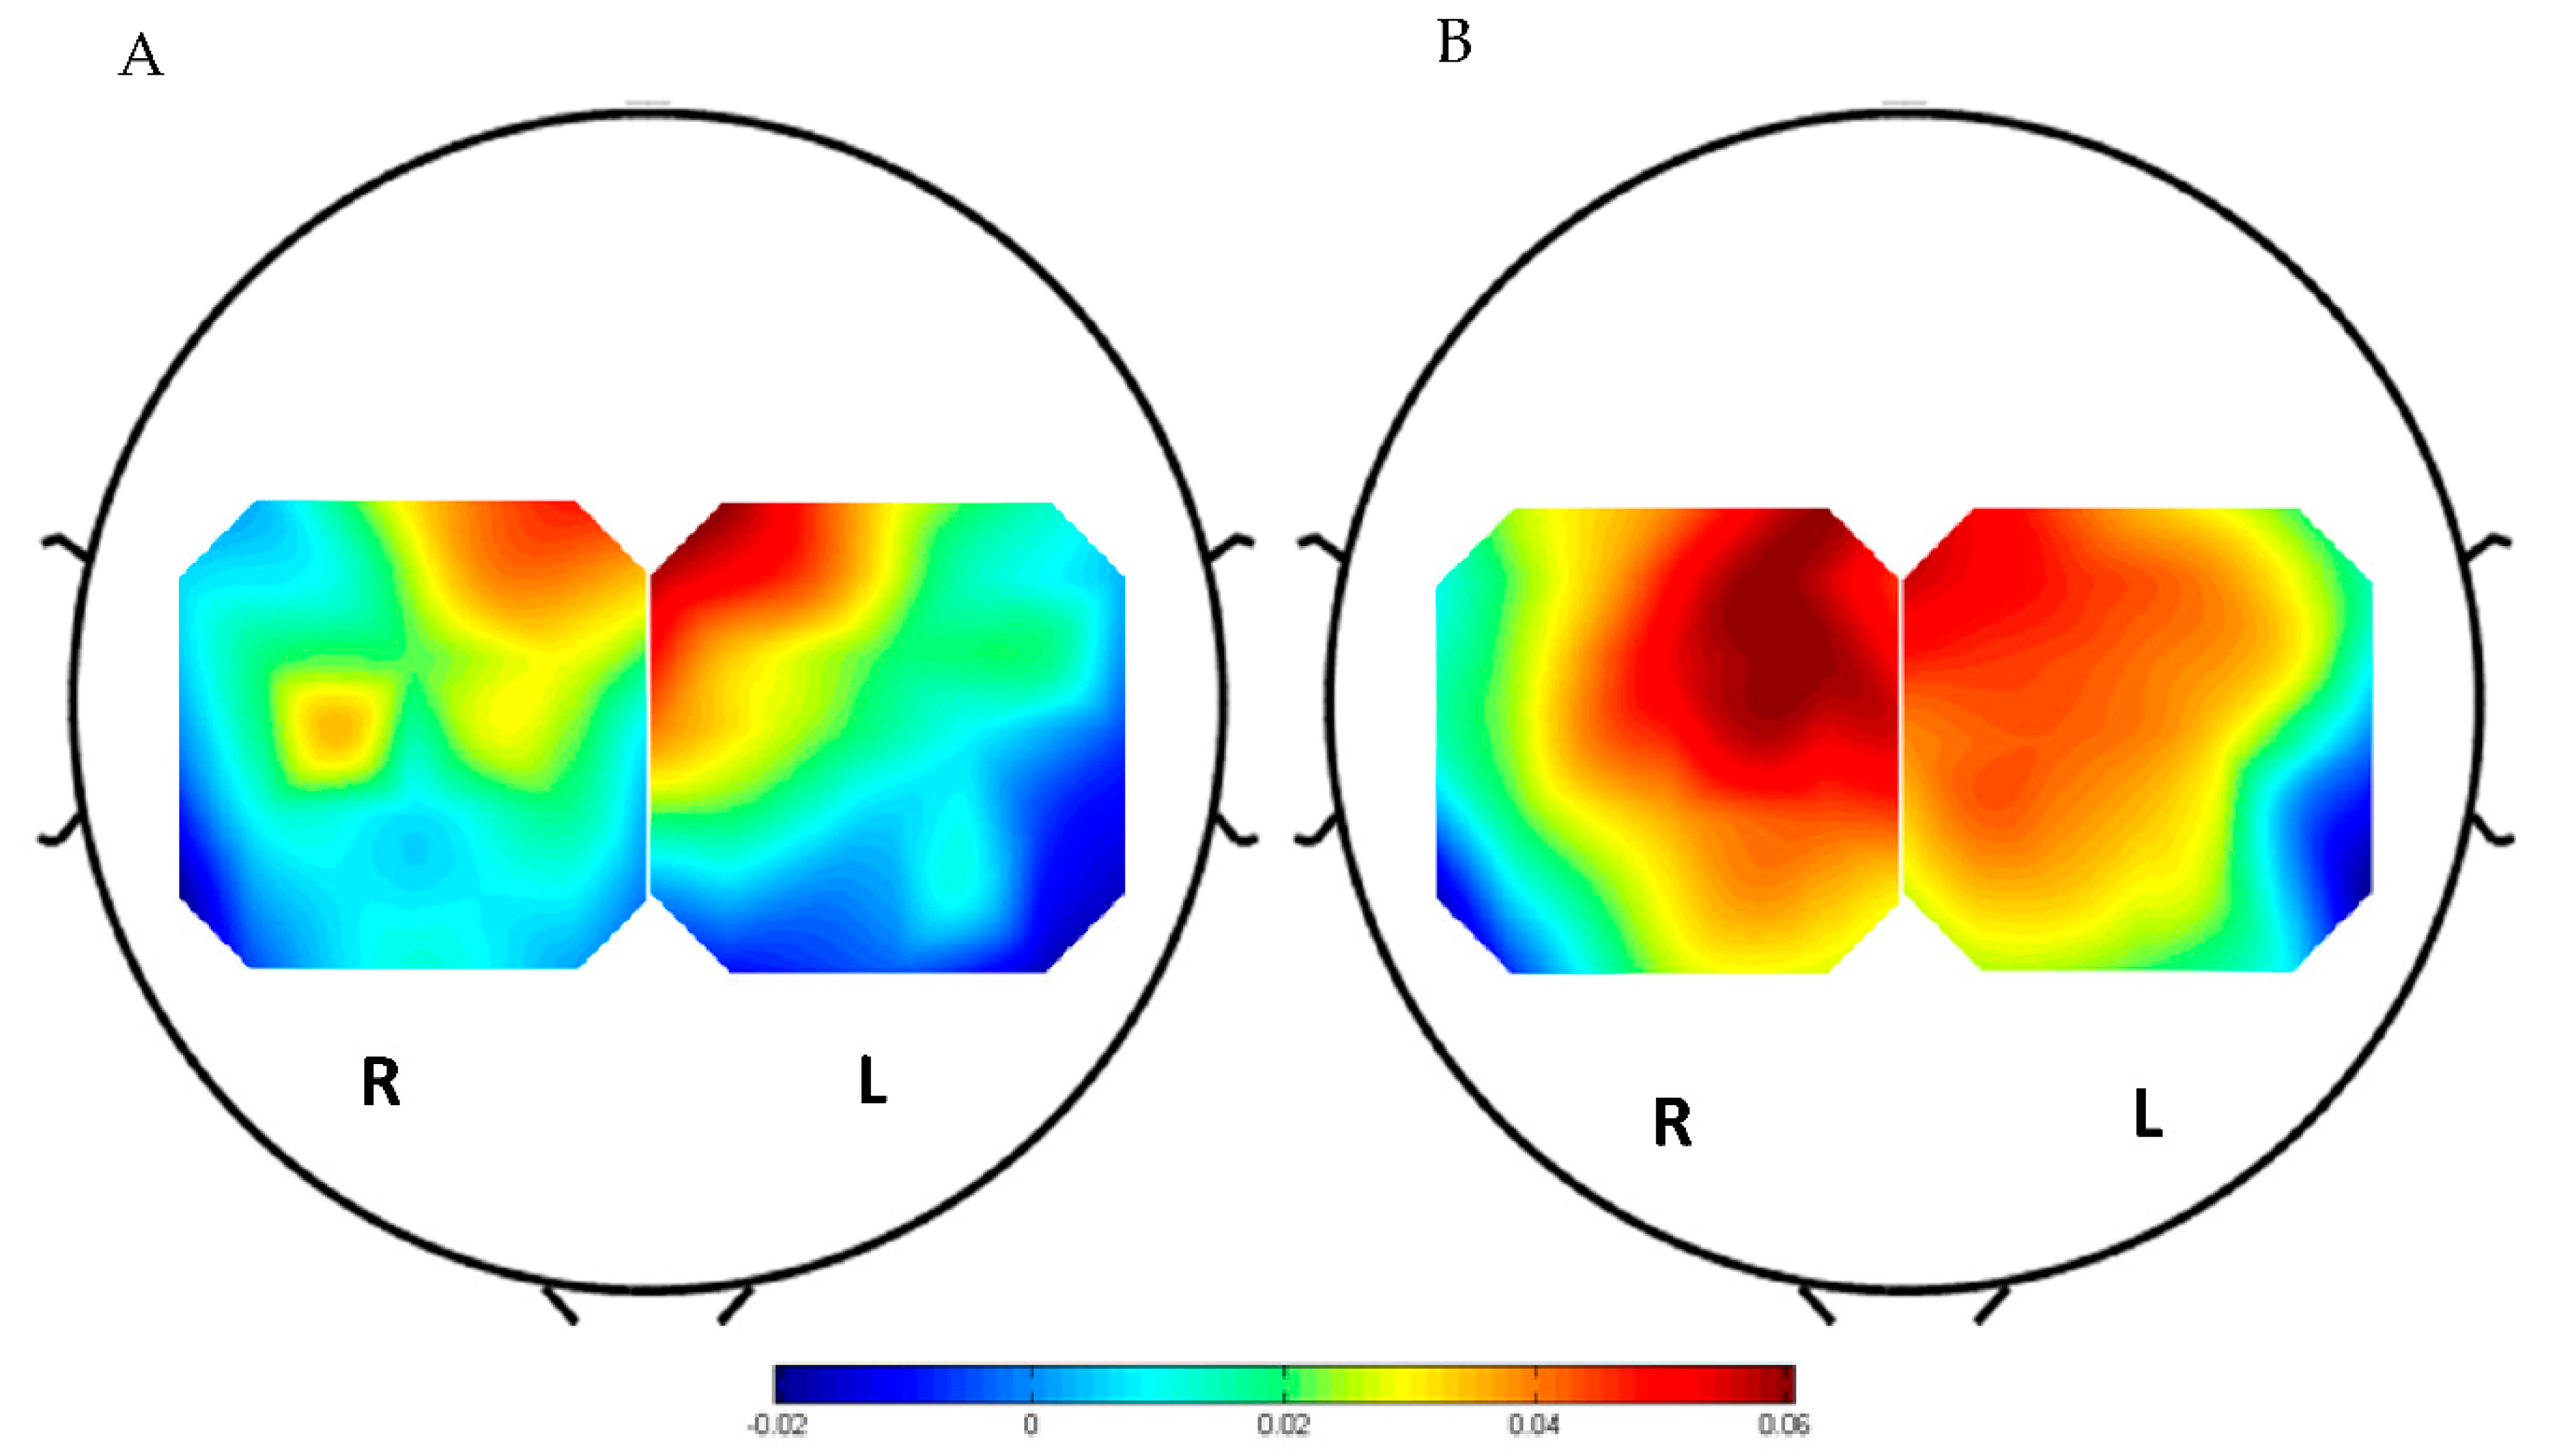
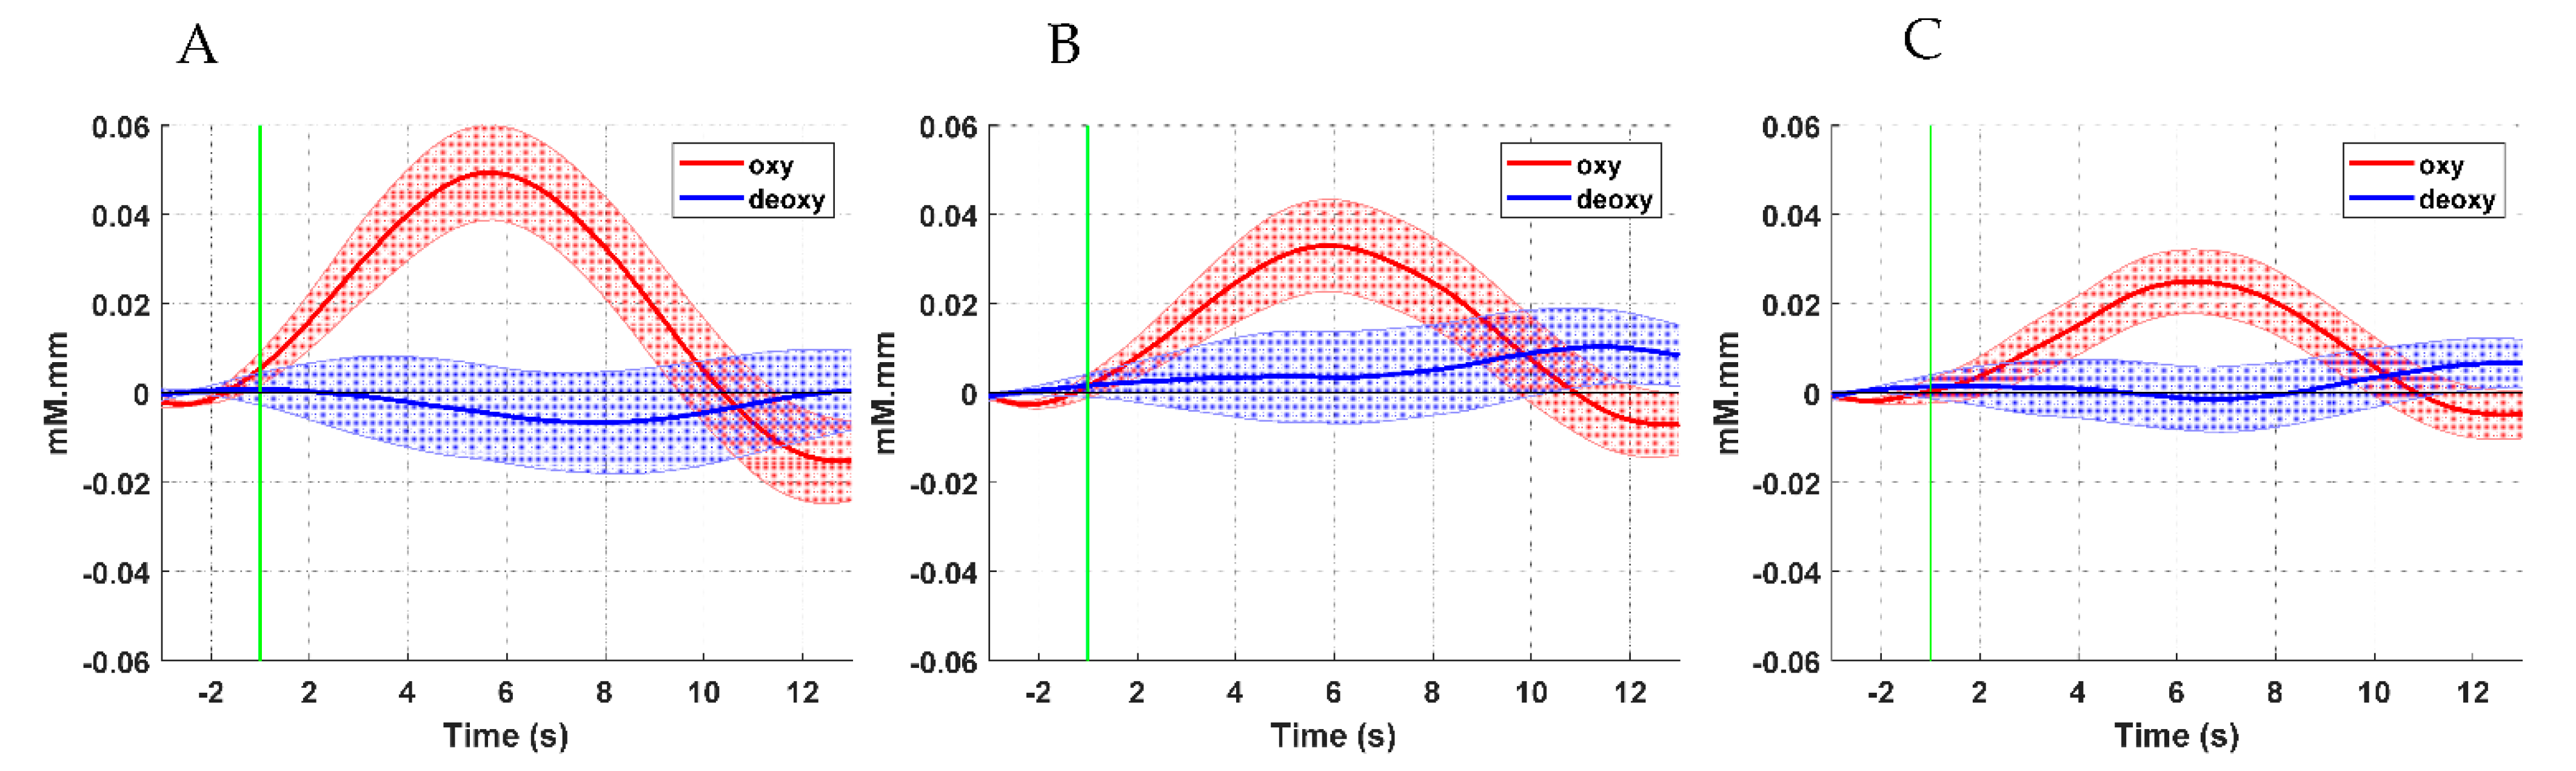
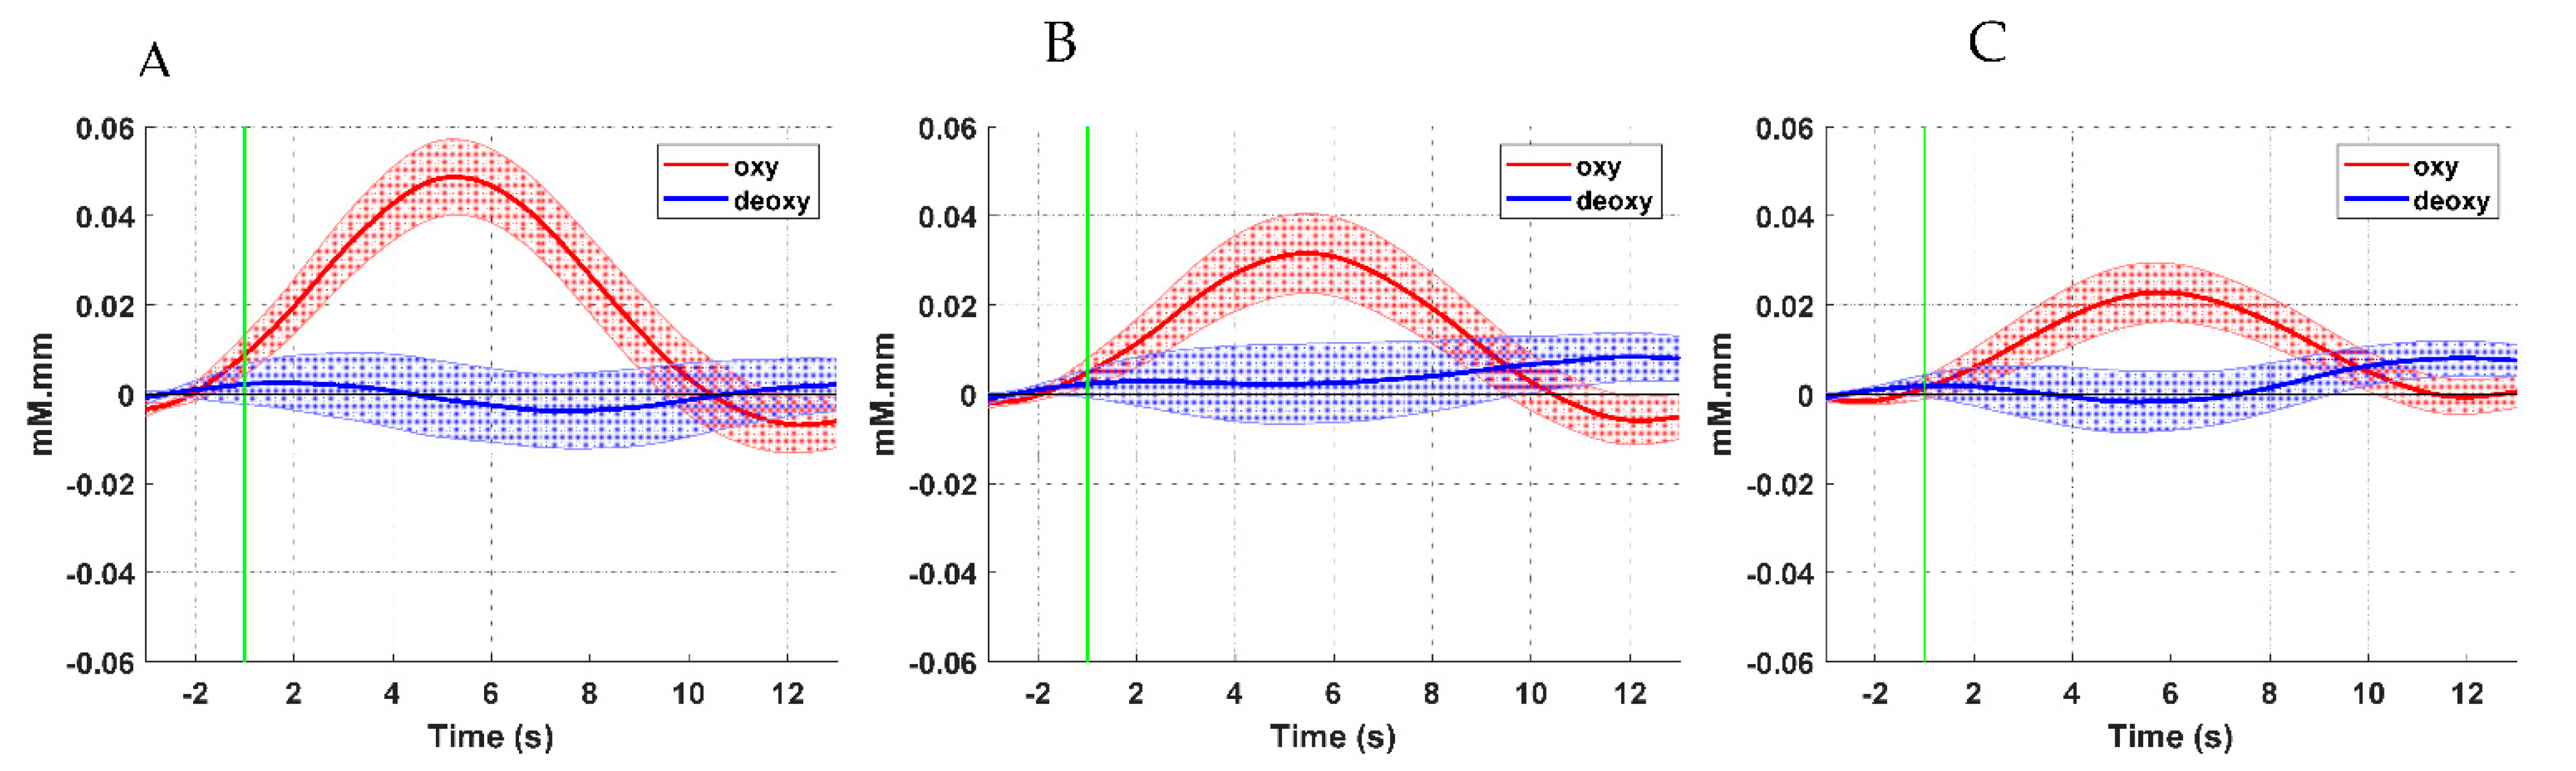
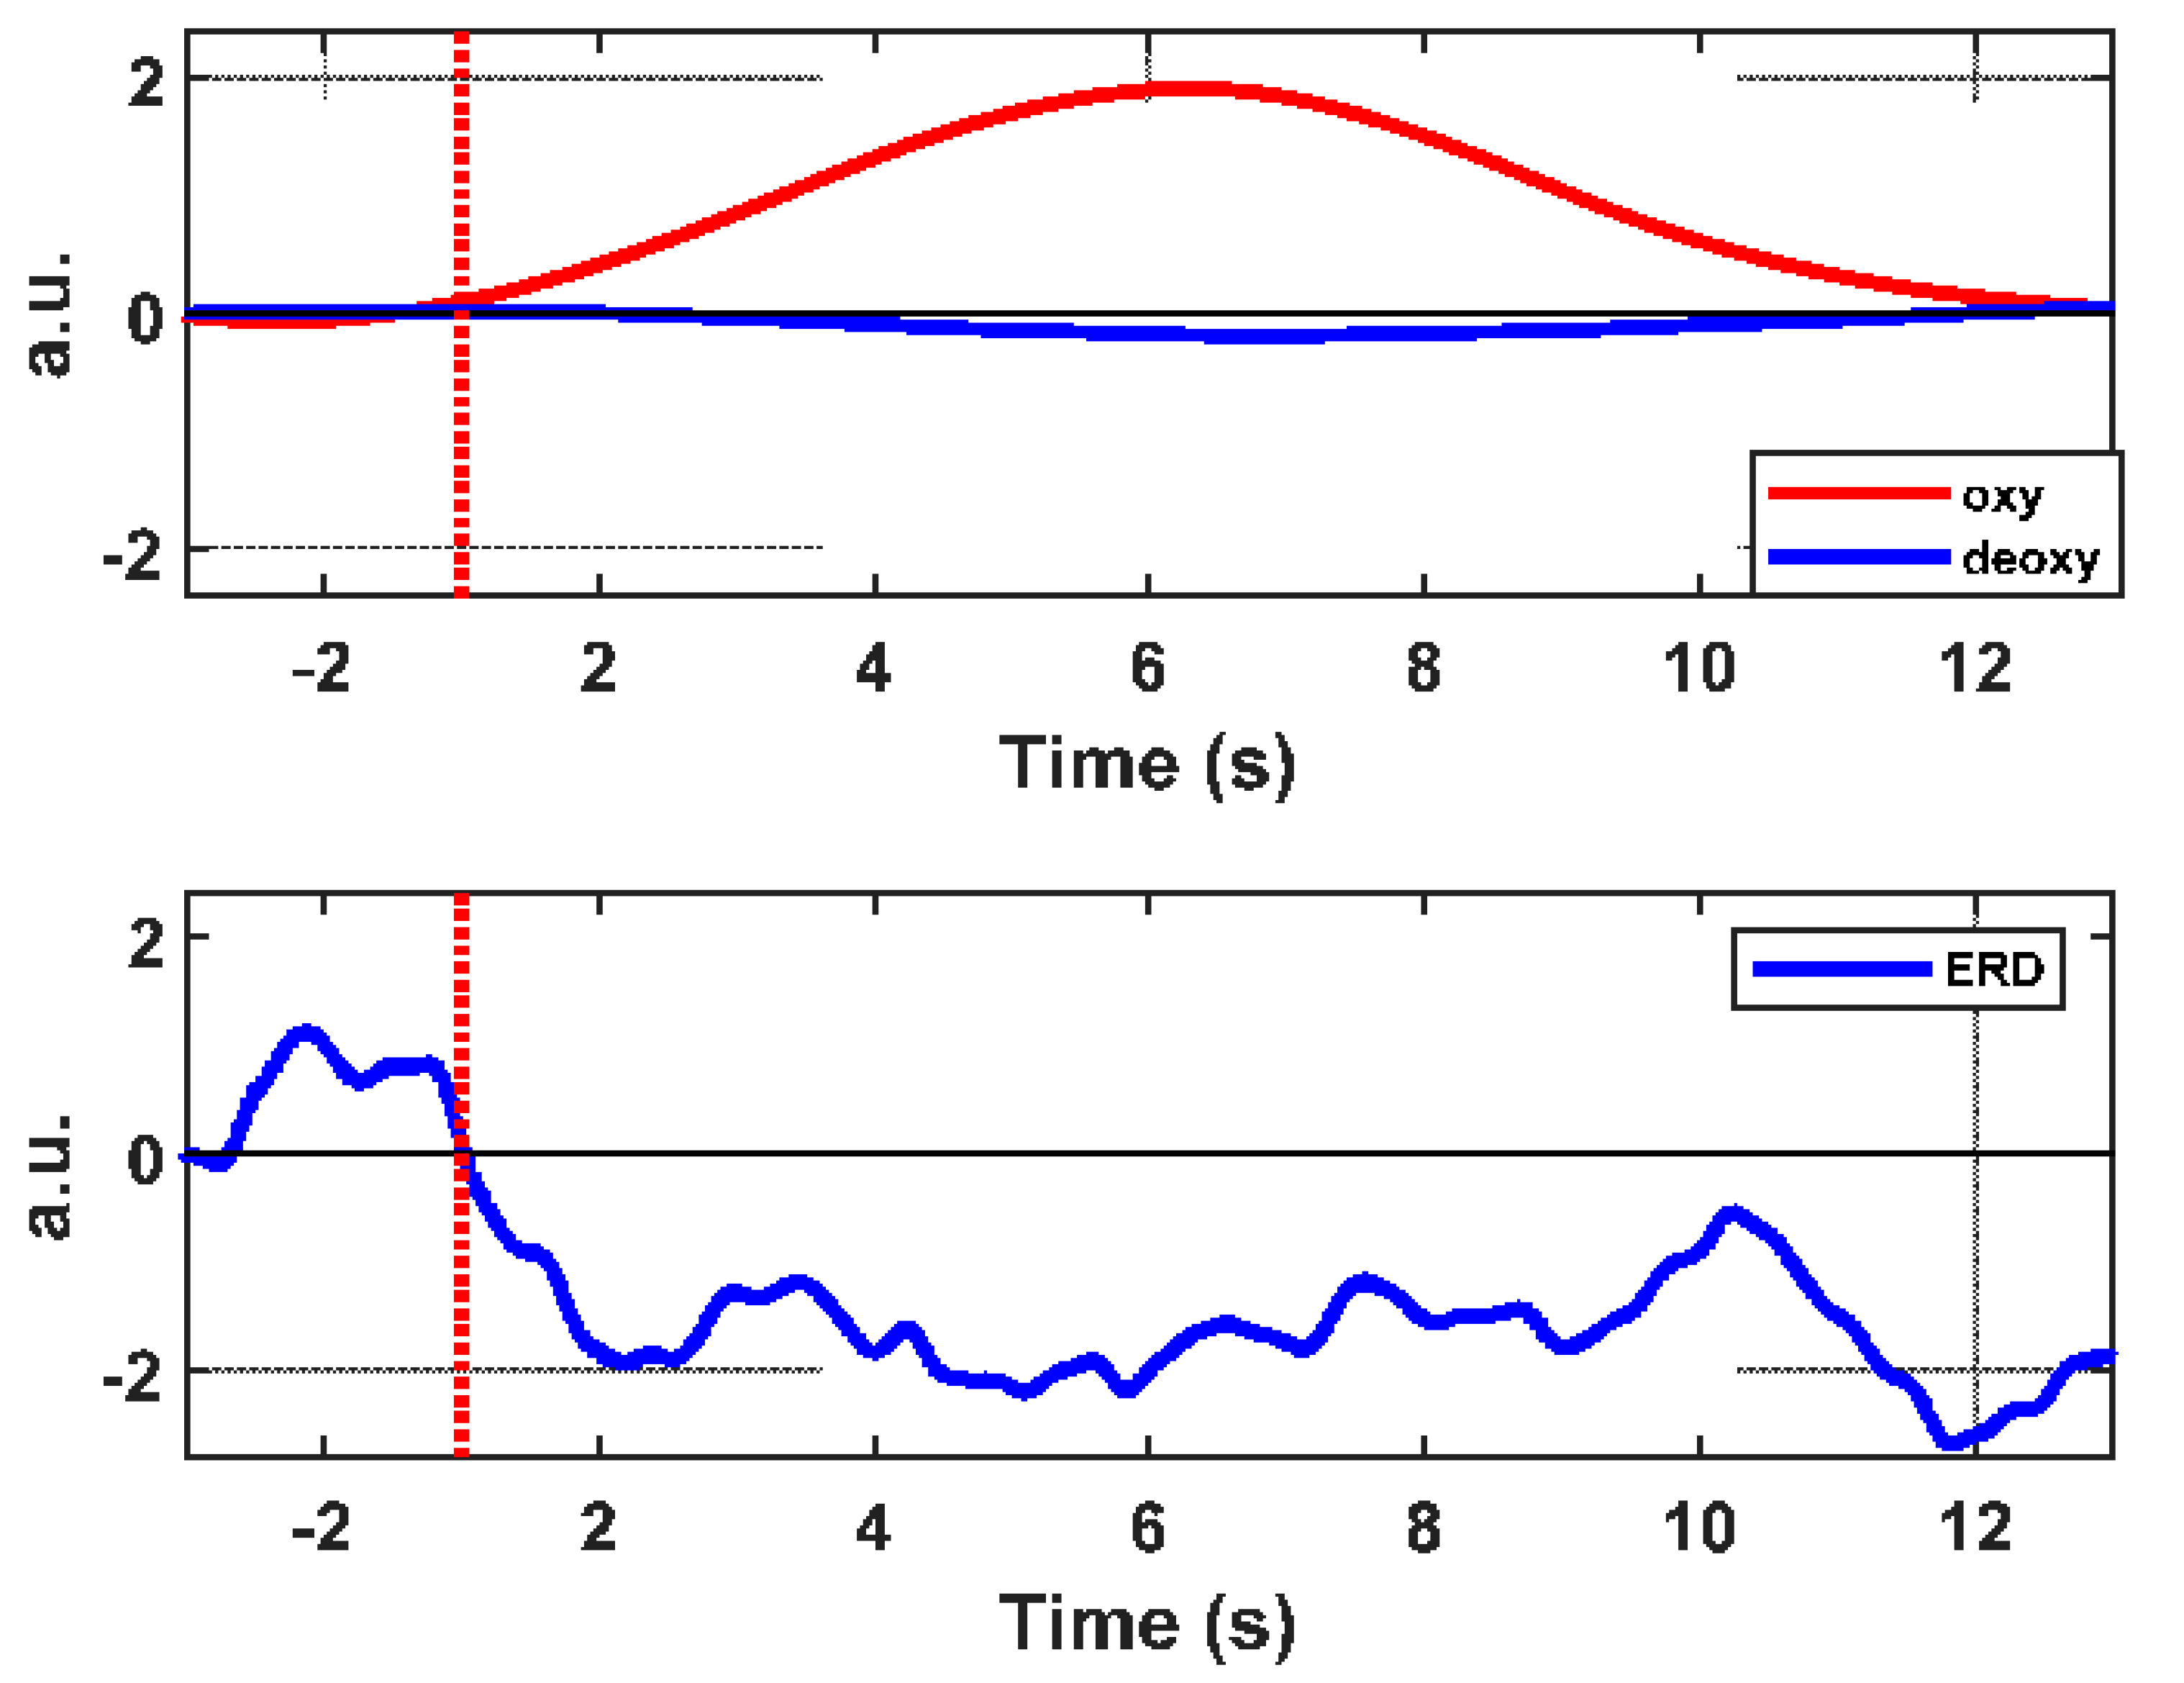
3.1. Hemodynamic Response Analysis Results
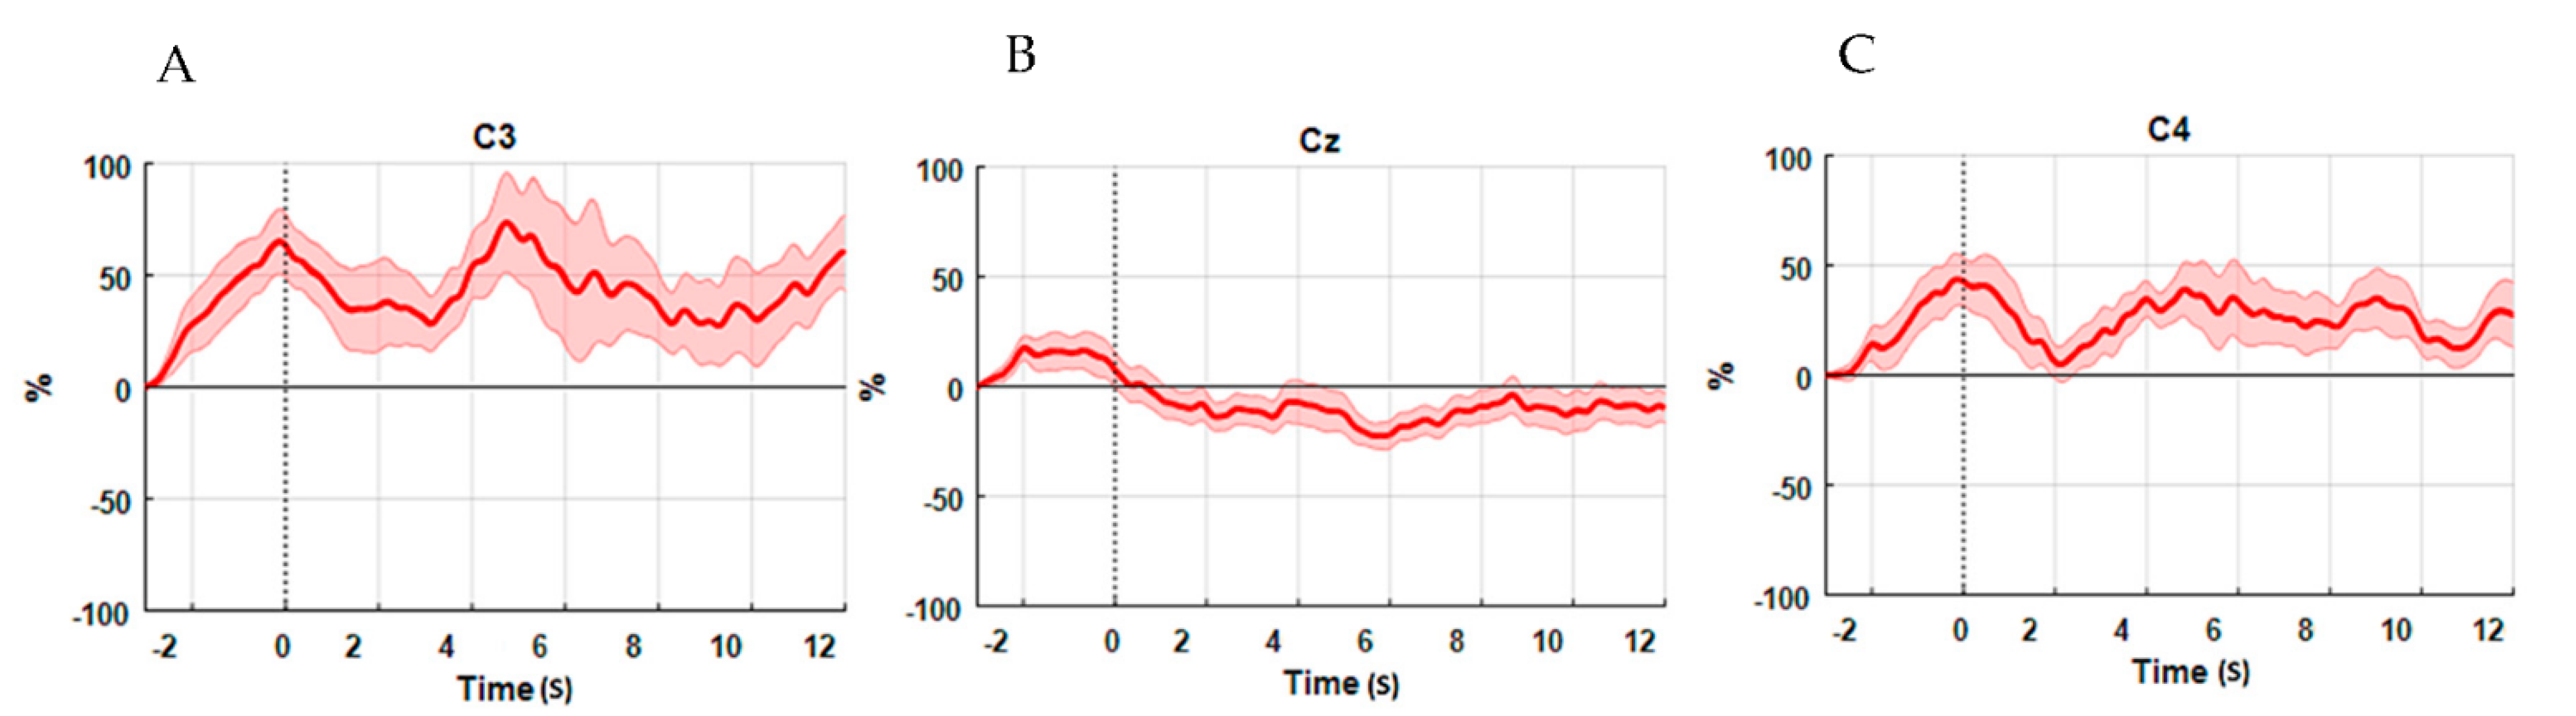
3.2. ERD Analysis Results
3.3. Results of Comparisons between ERD and fNIRS Data
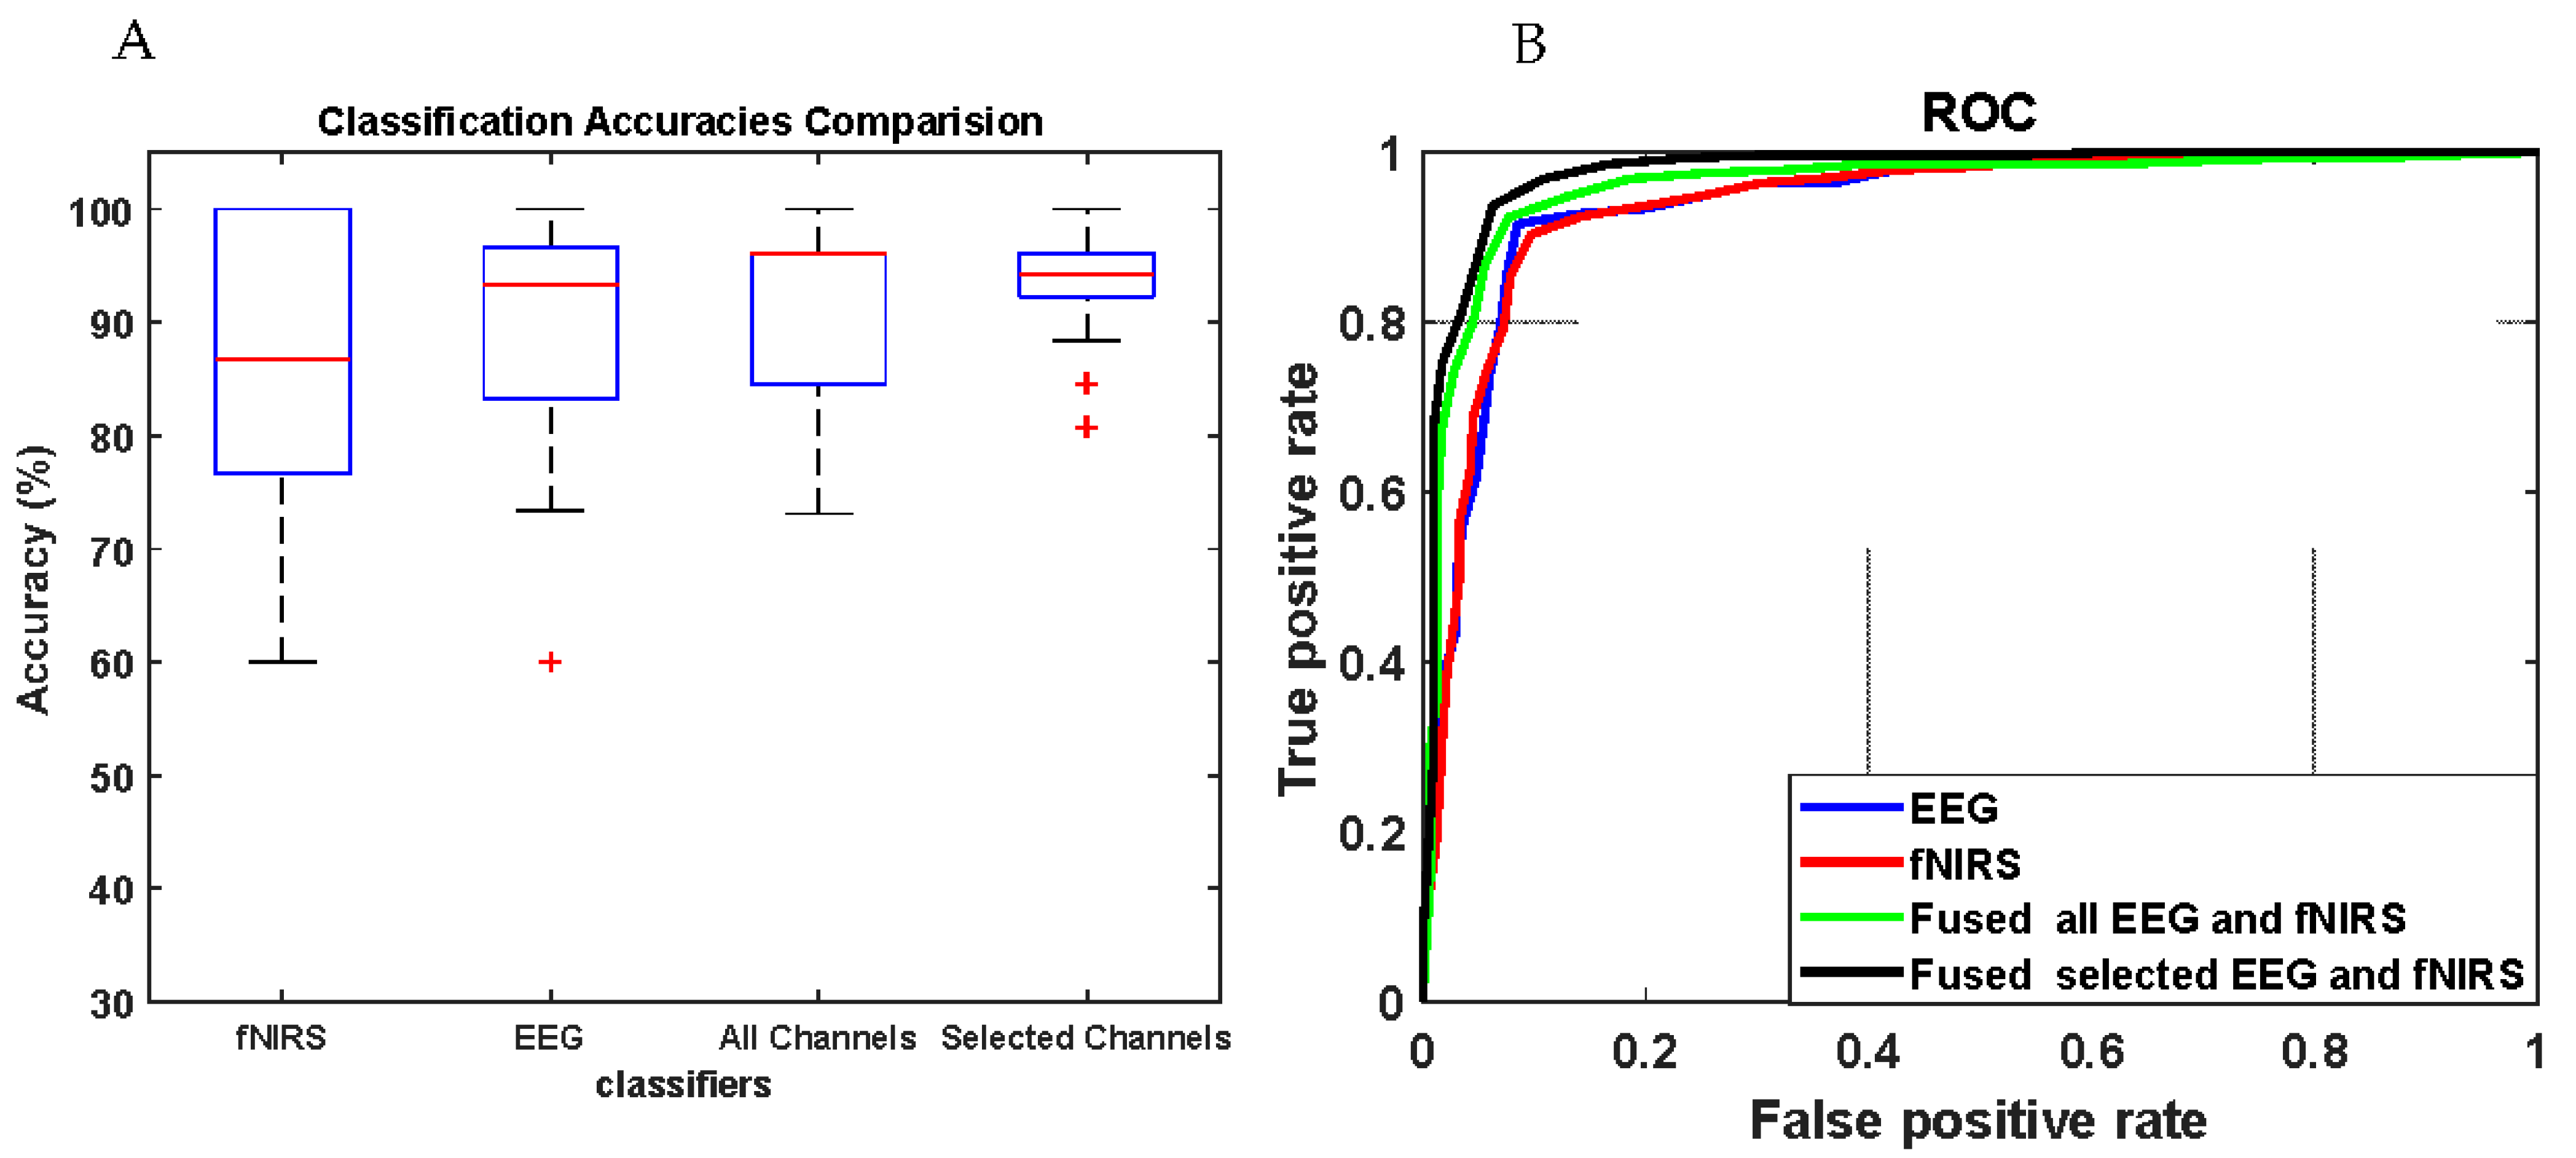
3.4. Results of Movement Classification
4. Discussion
5. Conclusions
Author Contributions
Funding
Institutional Review Board Statement
Informed Consent Statement
Data Availability Statement
Acknowledgments
Conflicts of Interest
References
- Eichele, T.; Specht, K.; Moosmann, M.; Jongsma, M.L.A.; Quiroga, R.Q.; Nordby, H.; Hugdahl, K. Assessing the spatiotemporal evolution of neuronal activation with single-trial event-related potentials and functional MRI. Proc. Natl. Acad. Sci. USA 2005, 102, 17798–17803. [Google Scholar] [CrossRef] [PubMed] [Green Version]
- Debener, S.; Ullsperger, M.; Siegel, M.; Engel, A.K. Single-trial EEG-fMRI reveals the dynamics of cognitive function. Trends Cogn. Sci. 2006, 10, 558–563. [Google Scholar] [CrossRef] [Green Version]
- Dale, A.M.; Halgren, E. Spatiotemporal mapping of brain activity by integration of multiple imaging modalities. Curr. Opin. Neurobiol. 2001, 11, 202–208. [Google Scholar] [CrossRef]
- Vulliemoz, S.; Carmichael, D.W.; Rosenkranz, B.; Rodionov, R.; Walker, M.C.; McEvoy, A.W.; Lemieux, L. Simultaneous intracranial EEG and fMRI of interictal epileptic discharges in humans. NeuroImage 2011, 54, 182–190. [Google Scholar] [CrossRef] [PubMed] [Green Version]
- Fazli, S.; Mehnert, J.; Steinbrink, J.; Curio, G.; Villringer, A.; Müller, K.R.; Blankertz, B. Enhanced performance by a hybrid NIRS-EEG brain computer interface. NeuroImage 2012, 59, 519–529. [Google Scholar] [CrossRef] [PubMed]
- Perpetuini, D.; Chiarelli, A.M.; Filippini, C.; Cardone, D.; Croce, P.; Rotunno, L.; Anzoletti, N.; Zito, M.; Zappasodi, F.; Merla, A. Working memory decline in Alzheimer’s disease is detected by complexity analysis of multimodal EEG-fnirs. Entropy 2020, 22, 1380. [Google Scholar] [CrossRef]
- Chiarelli, A.M.; Perpetuini, D.; Croce, P.; Greco, G.; Mistretta, L.; Rizzo, R.; Vinciguerra, V.; Romeo, M.F.; Zappasodi, F.; Merla, A.F. Multi-Channel fNIRS-EEG System Based on Silicon Photomultipliers: Towards Sensitive and Ecological Mapping of Brain Activity and Neurovascular Coupling. Sensors 2020, 20, 2831. [Google Scholar] [CrossRef]
- Bießssmann, F.; Plis, S.; Meinecke, F.C.; Eichele, T.; Müller, K.R. Analysis of multimodal neuroimaging data. IEEE Rev. Biomed. Eng. 2011, 4, 26–58. [Google Scholar] [CrossRef]
- Friston, K.J. Modalities, modes, and models in functional neuroimaging. Science 2009, 326, 399–403. [Google Scholar] [CrossRef] [Green Version]
- Shibasaki, H. Human brain mapping: Hemodynamic response and electrophysiology. Clin. Neurophysiol. 2008, 119, 731–743. [Google Scholar] [CrossRef]
- Huneau, C.; Benali, H.; Chabriat, H. Investigating human neurovascular coupling using functional neuroimaging: A critical review of dynamic models. Front. Neurosci. 2015, 9, 467. [Google Scholar] [CrossRef] [Green Version]
- Chiarelli, A.M.; Zappasodi, F.; Di Pompeo, F.; Merla, A. Simultaneous functional near-infrared spectroscopy and electroencephalography for monitoring of human brain activity and oxygenation: A review. Neurophotonics 2017, 4, 041411. [Google Scholar] [CrossRef] [PubMed]
- Logothetis, N.K.; Pauls, J.; Augath, M.; Trinath, T.; Oeltermann, A. Neurophysiological investigation of the basis of the fMRI signal. Nature 2001, 412, 150–157. [Google Scholar] [CrossRef]
- Liu, Z.; Shore, J.; Wang, M.; Yuan, F.; Buss, A.; Zhao, X. A systematic review on hybrid EEG/fNIRS in brain-computer interface. Biomed. Signal Process. Control 2021, 68, 102595. [Google Scholar] [CrossRef]
- Pinti, P.; Siddiqui, M.F.; Levy, A.D.; Jones, E.J.H.; Tachtsidis, I. An analysis framework for the integration of broadband NIRS and EEG to assess neurovascular and neurometabolic coupling. Sci. Rep. 2021, 11, 3977. [Google Scholar] [CrossRef] [PubMed]
- Hong, K.S.; Khan, M.J.; Hong, M.J. Feature Extraction and Classification Methods for Hybrid fNIRS-EEG Brain-Computer Interfaces. Front. Hum. Neurosci. 2018, 12, 246. [Google Scholar] [CrossRef]
- Zama, T.; Shimada, S. Simultaneous measurement of electroencephalography and near-infrared spectroscopy during voluntary motor preparation. Sci. Rep. 2015, 5, 16438. [Google Scholar] [CrossRef] [Green Version]
- Lövblad, K.O.; Thomas, R.; Jakob, P.M.; Scammell, T.; Bassetti, C.; Griswold, M.; Ives, J.; Matheson, J.; Edelman, R.R.; Warach, S. Silent functional magnetic resonance imaging demonstrates focal activation in rapid eye movement sleep. Neurology 1999, 53, 2193–2195. [Google Scholar] [CrossRef] [PubMed]
- Lemieux, L.; Krakow, K.; Fish, D.R. Comparison of spike-triggered functional MRI BOLD activation and EEG dipole model localization. NeuroImage 2001, 14, 1097–1104. [Google Scholar] [CrossRef] [PubMed]
- Goldman, R.I.; Stern, J.M.; Engel, J.; Cohen, M.S. Simultaneous EEG and fMRI of the alpha rhythm. NeuroReport 2002, 13, 2487–2492. [Google Scholar] [CrossRef] [PubMed]
- Laufs, H.; Kleinschmidt, A.; Beyerle, A.; Eger, E.; Salek-Haddadi, A.; Preibisch, C.; Krakow, K. EEG-correlated fMRI of human alpha activity. NeuroImage 2003, 19, 1463–1476. [Google Scholar] [CrossRef]
- Kilner, J.M.; Mattout, J.; Henson, R.; Friston, K.J. Hemodynamic correlates of EEG: A heuristic. NeuroImage 2005, 28, 280–286. [Google Scholar] [CrossRef]
- Lachert, P.; Janusek, D.; Pulawski, P.; Liebert, A.; Milej, D.; Blinowska, K.J. Coupling of Oxy- and Deoxyhemoglobin concentrations with EEG rhythms during motor task. Sci. Rep. 2017, 7, 15414. [Google Scholar] [CrossRef]
- Mai, A.; Commuri, S. Intelligent Control of a Prosthetic Ankle Joint Using Gait Recognition. Control Eng. Pract. 2016, 49, 1–3. [Google Scholar] [CrossRef]
- Al-Shargie, F.; Kiguchi, M.; Badruddin, N.; Dass, S.C.; Hani, A.F.M.; Tang, T.B. Mental stress assessment using simultaneous measurement of EEG and fNIRS. Biomed. Opt. Express 2016, 7, 3882. [Google Scholar] [CrossRef] [Green Version]
- Cohen, M.X. Analyzing Neural Time Series Data: Theory and Practice; Massachusetts Institute of Technology: Cambridge, MA, USA, 2014. [Google Scholar]
- Formaggio, E.; Masiero, S.; Bosco, A.; Izzi, F.; Piccione, F.; Del Felice, A. Quantitative EEG Evaluation during Robot-Assisted Foot Movement. IEEE Trans. Neural Syst. Rehabil. Eng. 2017, 25, 1633–1640. [Google Scholar] [CrossRef]
- Pfurtscheller, G.; Neuper, C. Motor imagery activates primary sensorimotor area in humans. Neurosci. Lett. 1997, 239, 65–68. [Google Scholar] [CrossRef]
- Villringer, A.; Chance, B. Non-invasive optical spectroscopy and imaging of human brain function. Trends Neurosci. 1997, 20, 435–442. [Google Scholar] [CrossRef]
- Sutoko, S.; Sato, H.; Maki, A.; Kiguchi, M.; Hirabayashi, Y.; Atsumori, H.; Obata, A.; Funane, T.; Katura, T. Tutorial on platform for optical topography analysis tools. Neurophotonics 2016, 3, 010801. [Google Scholar] [CrossRef] [PubMed] [Green Version]
- Strangman, G.; Culver, J.P.; Thompson, J.H.; Boas, D.A. A quantitative comparison of simultaneous BOLD fMRI and NIRS recordings during functional brain activation. NeuroImage 2002, 17, 719–731. [Google Scholar] [CrossRef]
- Hoshi, Y.; Kobayashi, N.; Tamura, M. Interpretation of near-infrared spectroscopy signals: A study with a newly developed perfused rat brain model. J. Appl. Physiol. 2001, 90, 1657–1662. [Google Scholar] [CrossRef] [Green Version]
- Buccino, A.P.; Keles, H.O.; Omurtag, A. Hybrid EEG-fNIRS asynchronous brain-computer interface for multiple motor tasks. PLoS ONE 2016, 11, e0146610. [Google Scholar] [CrossRef] [Green Version]
- Zafar, A.; Hong, K.-S. Detection and classification of three-class initial dips from prefrontal cortex. Biomed. Opt. Express 2017, 8, 367–383. [Google Scholar] [CrossRef] [PubMed]
- Zafar, A.; Hong, K.S. Reduction of Onset Delay in Functional Near-Infrared Spectroscopy: Prediction of HbO/HbR Signals. Front. Neurorobot. 2020, 14, 10. [Google Scholar] [CrossRef] [PubMed] [Green Version]
- Nunez, P.L.; Srinivasan, R. Electric Fields of the Brain: The Neurophysics of EEG; Oxford University Press: Oxford, UK, 2006. [Google Scholar]
- Pfurtscheller, G.; Solis-Escalante, T. Could the beta rebound in the EEG be suitable to realize a “brain switch”? Clin. Neurophysiol. 2009, 120, 24–29. [Google Scholar] [CrossRef]
- Volkmann, J.; Schnitzler, A.; Witte, O.W.; Freund, H.J. Handedness and asymmetry of hand representation in human motor cortex. J. Neurophysiol. 1998, 79, 2149–2154. [Google Scholar] [CrossRef] [PubMed] [Green Version]
- Obrig, H.; Hirth, C.; Junge-Hülsing, J.G.; Döge, C.; Wolf, T.; Dirnagl, U.; Villringer, A. Cerebral oxygenation changes in response to motor stimulation. J. Appl. Physiol. 1996, 81, 1174–1183. [Google Scholar] [CrossRef]
- Wriessnegger, S.C.; Kurzmann, J.; Neuper, C. Spatio-temporal differences in brain oxygenation between movement execution and imagery: A multichannel near-infrared spectroscopy study. Int. J. Psychophysiol. 2008, 67, 54–63. [Google Scholar] [CrossRef]
- Kim, S.G.; Ashe, J.; Hendrich, K.; Ellermann, J.M.; Merkle, H.; Uǧurbil, K.; Georgopoulos, A.P. Functional magnetic resonance imaging of motor cortex: Hemispheric asymmetry and handedness. Science 1993, 261, 615–617. [Google Scholar] [CrossRef] [Green Version]
- Singh, L.N.; Higano, S.; Takahashi, S.; Kurihara, N.; Furuta, S.; Tamura, H.; Shimanuki, Y.; Mugikura, S.; Fujii, T.; Yamadori, A.; et al. Comparison of ipsilateral activation between right and left handers: A functional MR imaging study. NeuroReport 1998, 9, 1861–1866. [Google Scholar] [CrossRef]
- Näsi, T.; Kotilahti, K.; Noponen, T.; Nissilä, I.; Lipiäinen, L.; Meriläinen, P. Correlation of visual-evoked hemodynamic responses and potentials in human brain. Exp. Brain Res. 2010, 202, 561–570. [Google Scholar] [CrossRef]
- Toma, K.; Matsuoka, T.; Immisch, I.; Mima, T.; Waldvogel, D.; Koshy, B.; Hanakawa, T.; Shill, H.; Hallett, M. Generators of movement-related cortical potentials: fMRI-constrained EEG dipole source analysis. NeuroImage 2002, 17, 161–173. [Google Scholar] [CrossRef]
- Takeuchi, M.; Hori, E.; Takamoto, K.; Tran, A.H.; Satoru, K.; Ishikawa, A.; Ono, T.; Endo, S.; Nishijo, H. Brain cortical mapping by simultaneous recording of functional near infrared spectroscopy and electroencephalograms from the whole brain during right median nerve stimulation. Brain Topogr. 2009, 22, 197–214. [Google Scholar] [CrossRef] [PubMed] [Green Version]
- Horovitz, S.G.; Gore, J.C. Simultaneous event-related potential and near-infrared spectroscopic studies of semantic processing. Hum. Brain Mapp. 2004, 22, 110–115. [Google Scholar] [CrossRef] [PubMed]
- Saager, R.; Berger, A. Measurement of layer-like hemodynamic trends in scalp and cortex: Implications for physiological baseline suppression in functional near-infrared spectroscopy. J. Biomed. Opt. 2008, 13, 034017. [Google Scholar] [CrossRef] [PubMed]
- Katura, T.; Sato, H.; Fuchino, Y.; Yoshida, T.; Atsumori, H.; Kiguchi, M.; Maki, A.; Abe, M.; Tanaka, N. Extracting task-related activation components from optical topography measurement using independent components analysis. J. Biomed. Opt. 2008, 13, 054008. [Google Scholar] [CrossRef]
- Tachtsidis, I.; Scholkmann, F. False positives and false negatives in functional near-infrared spectroscopy: Issues, challenges, and the way forward. Neurophotonics 2016, 3, 031405. [Google Scholar] [CrossRef] [PubMed] [Green Version]


| EEG Electrodes | ||||||
|---|---|---|---|---|---|---|
| Cz | C1 | Cpz | Cp1 | FCz | FC1 | |
| rho | −0.64061 | −0.56344 | −0.63779 | −0.63173 | −0.46765 | −0.37868 |
| p value | 7.54 × 10⁻⁴ | 1.59 × 10⁻² | 1.04 × 10⁻⁴ | 5.49 × 10⁻¹⁰ | 1.09 × 10⁻⁴ | 4.47 × 10⁻⁴ |
| EEG Electrodes | ||||||
|---|---|---|---|---|---|---|
| Cz | C2 | Cpz | Cp2 | FCz | FC2 | |
| rho | −0.45656 | −0.46217 | −0.42304 | −0.40145 | −0.44859 | −0.37647 |
| p value | 9.97 × 10⁻⁵ | 5.95 × 10⁻³ | 6.96 × 10⁻³ | 1.54 × 10⁻² | 2.62 × 10⁻² | 1.26 × 10⁻² |
| EEG Electrodes | ||||||
|---|---|---|---|---|---|---|
| Cz | C1 | Cpz | Cp1 | FCz | FC1 | |
| rho | 0.52406 | 0.43188 | 0.51047 | 0.50175 | 0.35362 | 0.35397 |
| p value | 1.18 × 10⁻⁶ | 5.38 × 10⁻⁵ | 2.11 × 10⁻⁵ | 3.31 × 10⁻⁷ | 2.08 × 10⁻⁴ | 8.66 × 10⁻⁷ |
| EEG Electrodes | ||||||
|---|---|---|---|---|---|---|
| Cz | C2 | Cpz | Cp2 | FCz | FC2 | |
| rho | 0.42972 | 0.38649 | 0.43163 | 0.49299 | 0.35336 | 0.19462 |
| p value | 5.69 × 10⁻⁵ | 3.94 × 10⁻⁴ | 3.49 × 10⁻⁶ | 2.31 × 10⁻⁷ | 7.59 × 10⁻³ | 1.47 × 10⁻³ |
| Modalities | ||||
|---|---|---|---|---|
| fNIRS | EEG | fNIRS and EEG All Channels | fNIRS and EEG Selected Channels | |
| Accuracy % | 85.61 | 89.39 | 92.13 | 93.01 |
| Sensitivity % | 86.04 | 92.49 | 94.49 | 94.98 |
| Specificity % | 85.26 | 87.16 | 90.05 | 91.36 |
Publisher’s Note: MDPI stays neutral with regard to jurisdictional claims in published maps and institutional affiliations. |
© 2021 by the authors. Licensee MDPI, Basel, Switzerland. This article is an open access article distributed under the terms and conditions of the Creative Commons Attribution (CC BY) license (https://creativecommons.org/licenses/by/4.0/).
Share and Cite
AL-Quraishi, M.S.; Elamvazuthi, I.; Tang, T.B.; Al-Qurishi, M.; Adil, S.H.; Ebrahim, M. Bimodal Data Fusion of Simultaneous Measurements of EEG and fNIRS during Lower Limb Movements. Brain Sci. 2021, 11, 713. https://doi.org/10.3390/brainsci11060713
AL-Quraishi MS, Elamvazuthi I, Tang TB, Al-Qurishi M, Adil SH, Ebrahim M. Bimodal Data Fusion of Simultaneous Measurements of EEG and fNIRS during Lower Limb Movements. Brain Sciences. 2021; 11(6):713. https://doi.org/10.3390/brainsci11060713
Chicago/Turabian StyleAL-Quraishi, Maged S., Irraivan Elamvazuthi, Tong Boon Tang, Muhammad Al-Qurishi, Syed Hasan Adil, and Mansoor Ebrahim. 2021. "Bimodal Data Fusion of Simultaneous Measurements of EEG and fNIRS during Lower Limb Movements" Brain Sciences 11, no. 6: 713. https://doi.org/10.3390/brainsci11060713