Article

Acid Precipitation and the Prevalence of Parkinson’s Disease: An Ecologic Study in U.S. States

by
Gary G. Schwartz
* and
Mark R. Williamson
Department of Population Health, School of Medicine & Health Sciences, University of North Dakota, Grand Forks, ND 58203, USA
*
Author to whom correspondence should be addressed.
Brain Sci. 2021, 11(6), 779; https://doi.org/10.3390/brainsci11060779
Submission received: 17 May 2021 / Revised: 9 June 2021 / Accepted: 10 June 2021 / Published: 12 June 2021
(This article belongs to the Section Neurodegenerative Diseases)

Abstract

:
Although the etiology of Parkinson’s disease (PD) is unknown, potentially informative clues lie in its geographic distribution. PD prevalence rates within the U.S. are significantly higher in the Midwest and Northeast, a pattern that resembles the geographic distribution of acid precipitation (“acid rain”). Using linear and multivariable regression, we examined state-wide data on PD prevalence in relation to environmental factors including total precipitation, the acidity of precipitation, the use of well water, and industrial releases of sulfuric acid. In multivariate analyses, age-, race-, and gender-adjusted prevalence rates for PD were inversely correlated with well water use and positively correlated with industrial releases of sulfuric acid and with the quantity of acid precipitation (p < 0.0001). To our knowledge, this is the first report of an association between PD and acid rain. Because acid rain is known to leach metals from soils and pipes into drinking water, acid rain’s association with PD prevalence adds support for a role for metals in the etiology of PD.

1. Introduction

With more than 6 million affected persons in 2016, Parkinson’s disease (PD) is the second most common neurodegenerative disease. The incidence and prevalence of PD worldwide has increased markedly in the past 20 years. The increase is greatest in countries that have experienced rapid modernization, suggesting that PD may be related to some by-product of industrialization [1,2].
PD is characterized pathologically by the loss of dopamine-producing neurons in the substantia nigra and by the presence of intracytoplasmic inclusions (Lewy bodies) that contain α-synuclein. Approximately 5–15% of PD cases are familial [3]. The remaining 85–95% are sporadic (idiopathic), and their causes are believed to be environmental. Established risk factors for idiopathic PD include exposure to the synthetic toxin MPTP and to some pesticides [4]. Other possible risk factors include exposure to solvents, heavy metals, and well water [5]. However, the cause of most PD cases is unknown.
Clues to the etiology of idiopathic PD may lie in its geography. For example, PD prevalence rates within the U.S. are significantly higher in the Midwest and Northeast [6]. This pattern is reminiscent of the geography of acid precipitation (aka “acid rain” and “acid deposition”) [7,8]. Acid rain, i.e., precipitation with a pH < 5.6, results when sulfur and nitrogen compounds mix in the atmosphere. The principal sources of these compounds are coal-burning power plants, automobile exhausts, and industrial chemical releases [9].
Acid precipitation could play a role in the etiology of PD via the leaching of metals that are present in soil and in water reservoirs into drinking water [10]. This study examined the association of acid precipitation and other environmental factors with PD prevalence rates in U.S. states. We report that PD prevalence rates are highly correlated with measures of acid rain.

2. Materials and Methods

2.1. PD Prevalence

Data on PD prevalence in U.S. states were obtained from Mantri and colleagues [11], who calculated age-, race-, and sex-adjusted PD prevalence rates using a population-based sample of >27,000,000 Medicare beneficiaries [11].

2.2. Exposure Variables

2.2.1. Annual Precipitation

We used data from publicly available sources on the average quantity of precipitation per state [12].

2.2.2. pH of Precipitation

Data on the pH of precipitation were obtained from the National Atmospheric Deposition Program [13]. The dataset included pH concentrations across various U.S. sites for multiple years. We calculated the mean pH per state for the year 1994. We selected 1994 because of the long latency period of PD and because maps of acid rain for that year were available via the Encyclopedia Britannica (https://www.britannica.com/science/acid-rain/History, accessed on 25 March 2021).
The pH scale goes from 0 to 14, with values < 7 (neutral) being acidic and values > 7 alkaline (basic). The scale is logarithmic; a change in one unit reflects a 10-fold difference in acidity/alkalinity.

2.2.3. Acid Precipitation Index

We reasoned that the effects of acid precipitation would depend upon the acidity of the precipitation and its quantity. We created a variable, the “Acid Precipitation Index” (API), to reflect this. To form the API, we subtracted a state’s mean pH from neutral pH (i.e., 7) and multiplied that quantity by the state’s annual precipitation (i.e., (7-observed pH of precipitation of State “A”) × (annual precipitation of State ”A”)).

2.2.4. Well Water Use

Data on the percentage of public water use by state were obtained from the U.S. Geological Survey [14] as described previously [15]. We calculated the percentage of the population using well water by subtracting the percentage using public water from 100.

2.2.5. Sulfuric Acid

Data on sulfuric acid releases for the year 1994 were obtained from the Toxics Release Inventory (TRI). Briefly, the TRI is a database of releases of chemicals that may pose a threat to human health and the environment [16]. Facilities that manufacture, use, or process these chemicals are required to report their releases to the Environmental Protection Agency. The data for sulfuric acid represents the total sulfuric acid release in pounds, including aerosol, land, and water releases.

2.2.6. Ultraviolet Index

Several studies reported that low levels of exposure to sunlight may increase PD risk [17]. We examined sunlight using a validated measure of ultraviolet radiation, the UV Index [18].

2.2.7. Smoking

Smoking is well-known to be inversely associated with PD. We included data on the prevalence of smoking to evaluate potential confounding by this variable. Data on smoking prevalence by state were obtained from the CDC [19].

2.3. Statistical Analysis

PD prevalence was modeled using linear regression. To determine the best fit model, model selection was run with PD prevalence as the outcome and each predictor variable separately. We generated a correlation matrix for all predictor variables and performed post hoc tests for collinearity. Only a single variable was retained among sets of highly inter-correlated predictor variables by comparing adjusted R2 values. Akaike information criterion (AIC) scores were used to select variables for a multivariable model. The AIC measures model quality compared with similar models by estimating goodness-of-fit penalized by the number of estimated parameters.
PD may have a subclinical period of decades [20]. Thus, individuals may be exposed to some etiologic factor(s) early life but be diagnosed at older ages, after they have migrated. We therefore repeated the analyses after censoring the data from Florida and Arizona, the states with the greatest number of migrant retirees.

3. Results

The mean, standard deviation, range, and locations for the highs and lows for the predictor variables are shown in Table 1. Briefly, the mean age-, race-, and sex-adjusted PD prevalence rate (calculated by Mantri et al. [11]), was 1325.0 (SD = 185.4) and ranged from 802.9 in Minnesota to 1719.8 in New York. The pH of precipitation ranged from 4.22 in Ohio to 5.43 in South Dakota (mean = 4.81, SD = 0.4). pH values were not available for four states (Connecticut, Delaware, Hawaii, and Rhode Island). The mean state-level precipitation was 37.5 inches (SD = 13.6) and ranged from 9.46 in Nevada to 59.15 in Louisiana. The API ranged nearly 10-fold, from 15.23 in Nevada to 131.6 in Alabama. Because the linearity assumption for the regression of sulfuric acid and PD prevalence was not met, the sulfuric acid data were log-transformed prior to analysis.
In univariate models, mean precipitation, the UV Index, and log sulfuric acid showed significant positive relationships with PD prevalence (p = 0.0001, p = 0.0249, p = 0.0381, respectively). Similarly, the API was significantly positively correlated with PD prevalence (β = 2.7, t = 4.48, p < 0.0001). Mean pH showed a significant negative correlation (i.e., the more acidic the precipitation, the higher the PD prevalence; p = 0.0002). Well water use was negatively correlated with PD prevalence (p = 0.0193). Because well water use was calculated as the difference between municipal water use and 100, this indicates that PD was positively correlated with the use of municipal water. The prevalence of smoking was not significantly associated with PD prevalence rates.
Mean pH and mean precipitation were highly correlated with the API (r > 0.8). Because the API had a higher adjusted R2 than did mean pH and mean precipitation, it was retained in the model, and pH and precipitation were removed. In the final model, PD prevalence was significantly related to the API and (inversely) to well-water use (p < 0.001). Sulfuric acid releases stayed in the model because they significantly improved the model fit (Table 2). Analysis of the data after censoring data for Florida and Arizona produced results that were virtually unchanged. Figure 1 shows the scatter plot of PD prevalence and the API.

4. Discussion

In this ecologic study, we utilized published data on age-, race-, and sex-adjusted PD prevalence rates for U.S. states to examine suspected environmental risk factors for PD [11]. Our most important finding is that in multivariate analyses, PD prevalence rates were positively correlated with the quantity of acid precipitation (“acid rain”) (p < 0.0001). To our knowledge, this is the first study to report an association between PD and acid rain.
The state level prevalence of PD was positively correlated with the API, with industrial releases of sulfuric acid, and (inversely), with well-water use. Conversely, ultraviolet light was not significant when adjusted for other factors. The prevalence of smoking was not an important confounder in these relationships.
We observed a negative correlation between PD prevalence and well-water use. Well-water use has been reported to be positively associated with PD in many case-control studies. The literature also contains reports of null findings as well as protective effects for well water (see [21,22] for reviews). The majority of these studies were clinic-based and are susceptible to bias caused by the greater likelihood of cases to travel longer distances (i.e., from rural locations where wells are more common) to obtain care [23]. The inverse correlation that we observed is consistent with the largest of these studies, performed by Silver et al. [23]. These authors conducted a population-based case-control study among Medicare beneficiaries that included 89,790 incident PD cases and nearly 22,000,000 controls. They reported a robustly protective effect for well-water use (OR = 0.87, 95% C.I. = 0.85–0.89) with little evidence of increased risk from well water in any state. The inverse correlation we observed could reflect some (unknown) contaminant that is more common in municipal water. Alternately, as suggested by Silver et al., this finding may be a surrogate marker for other exposures that are more common in urban environments, e.g., pollution, that are associated with an increased risk for PD.
Each of our predictor variables that are characterized by acidity—the pH of precipitation, the quantity of precipitation, the API, and emissions of sulfuric acid—were significantly correlated with PD in univariate models. We note that even in non-polluted areas, “normal” rain has a pH of 5.0–5.5 and is thus acidic, a result of the atmospheric combination of moisture with carbon dioxide [24]. The fit of our final model was significantly improved by the inclusion of data on releases of sulfuric acid, which is a major component of air pollution and acid precipitation [25].
How can we understand the robust correlation of acid precipitation with PD prevalence? A plausible explanation involves the effects of acid rain on the aqueous concentration of metals. Metals, particularly lead, have been implicated repeatedly in Parkinson’s disease [26,27]. Acid rain is well-known to leach metals from watersheds and from plumbing into drinking water [28,29]. For example, the lead concentration of water that contains lead more than doubles as the pH drops from 7 to 6 [30]. This phenomenon is potentially important because lead is a major component of many water service lines, i.e., the underground pipes that connect homes to the municipal water main. It is noteworthy that the majority of the 6.1 million lead service lines in use in the U.S. are located in the Midwest [31].
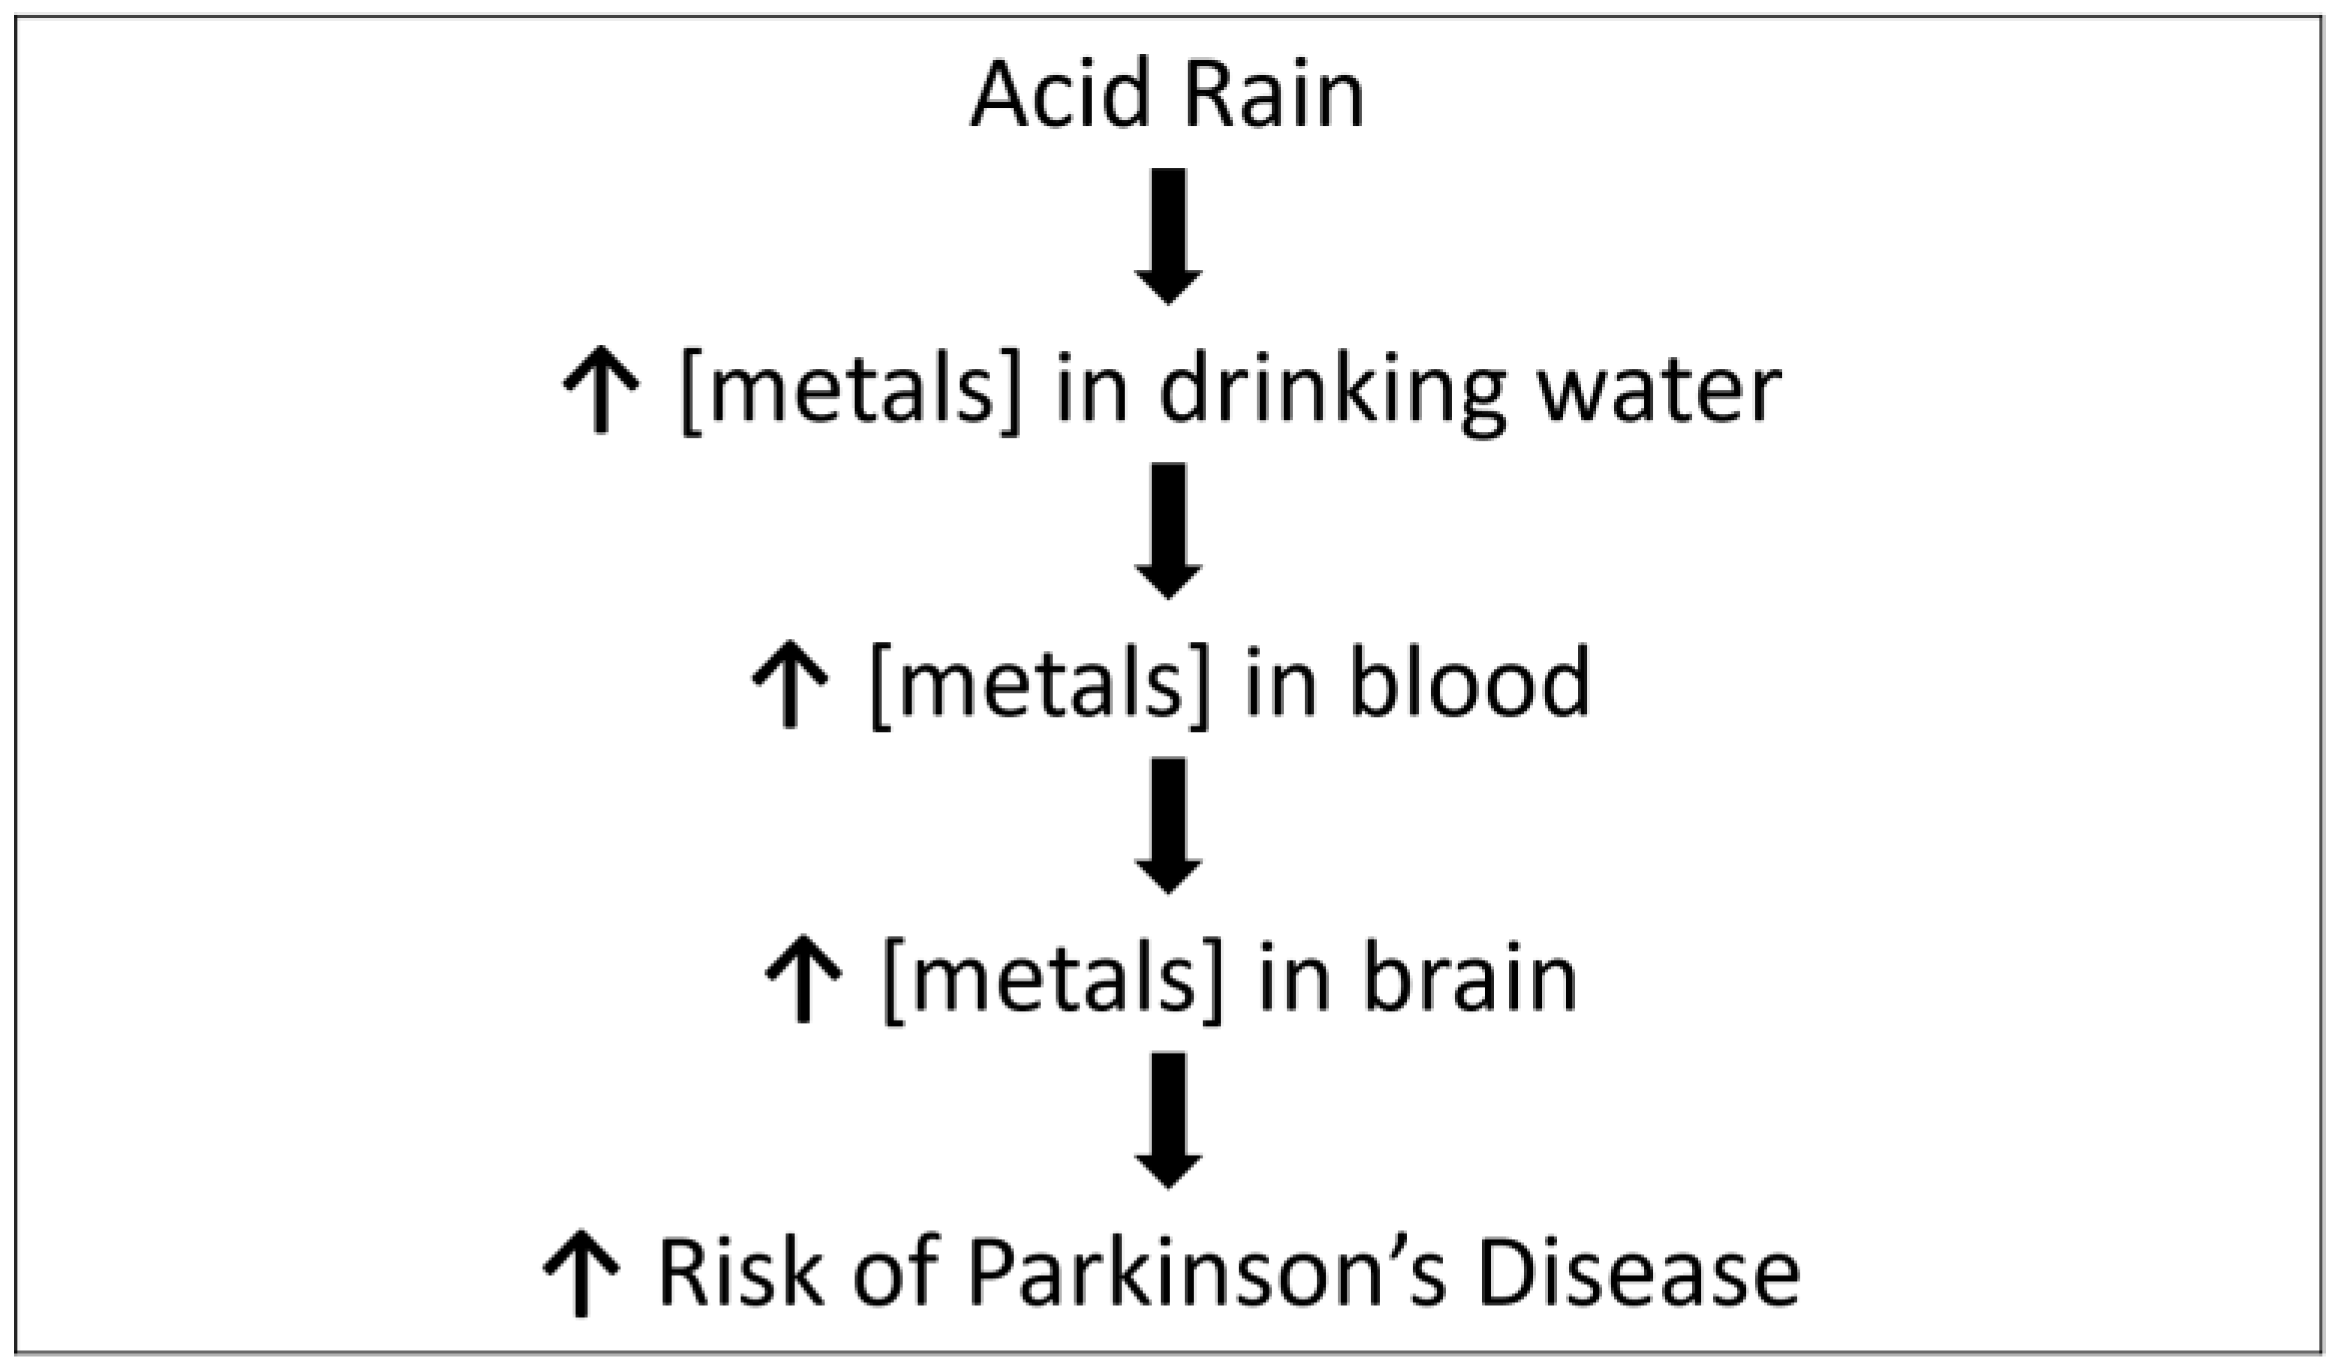
For many metals, their concentrations in blood and in drinking water are highly correlated. For example, lead levels in blood increase as the cube root of lead levels in water [32]. Several reports indicate an increased body burden of lead in PD patients [33,34]. In animal models, lead reduces dopamine synthesis and promotes the accumulation of synuclein (reviewed in [5]). The aqueous concentration of other metals, e.g., iron, is also increased by acid rain, and these metals also may accumulate in the brain [5,35,36]. The acid rain hypothesis is summarized schematically in Figure 2.
Our study has several limitations. First, we used age-, race-, and sex-adjusted prevalence data for our measure of PD frequency. Because prevalence is influenced by disease duration, these data might exaggerate the occurrence of PD in more affluent states where PD longevity is greater. Additionally, data at the level of the state may be insensitive to capture potentially important variability that occurs at a finer scale. Second, we used the API as the principal measure of acid precipitation. The validity of this index as a measure of the effects of acid precipitation is unknown. However, acid precipitation is strongly associated with PD since both the quantity of precipitation and its pH (the component variables of the API) significantly predicted PD prevalence separately. Thirdly, we had no data on potential confounders such as pesticide use. Inspection of pesticide use maps for 1994 (and other years) for the pesticides most strongly implicated in PD, paraquat and rotenone, do not greatly resemble those of PD prevalence [37,38]. Additionally, it is likely that many individuals were exposed to etiologic factors in one state but were diagnosed after they migrated to another. This is likely to bias any correlation toward the null. The most important limitation of this study is that these are findings at the ecologic (group) level. As such, they indicate that PD prevalence rates are higher in states with higher exposure to acid precipitation and not that individuals who experience these exposures are at increased risk. Finally, we emphasize that we made no measures of metals; rather, the acid rain hypothesis is an effort to interpret our findings in the context of the published literature.
A strength of our study is that, although a role for acid rain in the etiology of neurodegenerative diseases has often been suggested (e.g., [39,40]), that hypothesis has never been tested. To our knowledge, this is the first study to provide evidence that acid precipitation is associated with PD. A role for acid precipitation in PD is biologically plausible and provides a mechanism for the frequently reported elevations of metals in the blood and tissues of patients with PD who do not report occupational exposure to metals [41].
The acid rain hypothesis suggests novel analytic studies. For example, in a population that uses municipal water, PD cases might show a history of greater water use than controls, a hypothesis that is testable using tax records. Similarly, exposures such as the use of metal premise plumbing may be more prevalent among PD cases than controls. Additionally, the metal contents of water samples from the homes of cases and controls could be compared directly. One such study has been reported (in Abstract), but the sample size (7 case-control pairs) is too small to permit meaningful conclusions [42,43].

5. Conclusions

This ecologic study of PD prevalence in U.S. states showed a positive association between PD and the quantity and the acidity of precipitation per state. Because acid precipitation is known to increase the concentration of metals in drinking water, these findings add support for a potential role of metals in the etiology of PD.

Author Contributions

Conceptualization, G.G.S.; methodology, G.G.S. and M.R.W.; software, M.R.W.; formal analysis, M.R.W.; writing—original draft preparation, G.G.S.; writing—review and editing, G.G.S. and M.R.W. All authors have read and agreed to the published version of the manuscript.

Funding

This research was funded, in part, by the National Institute of General Medical Sciences of the National Institutes of Health, grant number U54GM128729.

Data Availability Statement

The datasets generated for this study are available from the corresponding author on reasonable request.

Acknowledgments

We thank Allison Ranisate, Manager of Interlibrary Loan at the University of North Dakota School of Medicine & Health Sciences, for help in retrieving publications from the medical literature.

Conflicts of Interest

The funders had no role in the design of the study; in the collection, analyses, or interpretation of data; in the writing of the manuscript; or in the decision to publish the results.

References

  1. GBD 2016 Parkinson’s Disease Collaborators. Global, regional, and national burden of Parkinson’s disease, 1990–2016: A systematic analysis for the Global Burden of Disease Study 2016. Lancet Neurol. 2018, 17, 939–953. [Google Scholar] [CrossRef] [Green Version]
  2. Dorsey, E.R.; Sherer, T.; Okun, M.S.; Bloem, B.R. The emerging evidence of the Parkinson pandemic. J. Parkinson Dis. 2018, 8, S3–S8. [Google Scholar] [CrossRef] [Green Version]
  3. Balestrino, R.; Shapira, A.H.V. Parkinson disease. Eur. J. Neurol. 2020, 27, 27–42. [Google Scholar] [CrossRef] [PubMed]
  4. Langston, J.W. The MPTP story. J. Parkinsons’s Dis. 2017, 7 (Suppl. 1), 511–519. [Google Scholar] [CrossRef] [PubMed] [Green Version]
  5. Goldman, S.M. Environmental toxins and Parkinson’s Disease. Annu. Rev. Pharmacol. Toxicol. 2014, 54, 141–164. [Google Scholar] [CrossRef] [PubMed]
  6. Wright-Willis, A.; Evanoff, B.A.; Lian, M.; Criswell, S.R.; Racette, B.A. Geographic and ethnic variation in Parkinson Disease: A population-based study of US Medicare beneficiaries. Neuroepidemiology 2010, 34, 143–151. [Google Scholar] [CrossRef] [PubMed]
  7. U.S. Geologic Survey, pH of Rainfall in the USA, 2002. 2002. Available online: https://www.usgs.gov/media/images/ph-rainfall-usa-2002 (accessed on 1 April 2021).
  8. Goyer, R.A.; Bachmann, J.; Clarkson, T.W.; Ferris, B.G., Jr.; Graham, J.; Mushak, P.; Perl, D.P.; Rall, D.P.; Schlesinger, R.; Sharpe, W.; et al. Potential human health effects of acid rain: Report of a workshop. Environ. Health Perspect. 1985, 60, 355–368. [Google Scholar] [CrossRef]
  9. Acid Rain and Water. Available online: https://www.usgs.gov/special-topic/water-science-school/science/acid-rain-and-water?qt-science_center_objects=0#qt-science_center_objects (accessed on 1 April 2021).
  10. Bensyrd, I.; Rylander, L.; Högstedt, B.; Aprea, P.; Bratt, I.; Fåhraéus, C.; Holmén, A.; Karlsson, A.; Nilsson, A.; Svensson, B.-L.; et al. Effect of acid precipitation on retention and excretion of elements in man. Sci. Total Environ. 1994, 145, 81–102. [Google Scholar] [CrossRef]
  11. Mantri, S.; Fullard, M.E.; Beck, J.; Willis, A.W. State-level prevalence, health service use, and spending vary widely among Medicare beneficiaries with Parkinson disease. NPJ Parkinson’s Dis. 2019, 5, 1. [Google Scholar] [CrossRef] [Green Version]
  12. U.S. Average Precipitation State Rank. Available online: http://www.usa.com/rank/us--average-precipitation--state-rank.htm (accessed on 15 April 2021).
  13. National Atmospheric Deposition Program. Available online: https://nadp.slh.wisc.edu/data/NTN/ntnAllsites.aspx (accessed on 15 April 2021).
  14. Kenny, J.F.; Barber, N.L.; Hutson, S.S.; Linsey, K.S.; Lovelace, J.K.; Maupin, M.A. Estimated Use of Water in the United States in 2005. Circular 1344; U.S. Department of the Interior, U.S. Geological Survey: Reston, VA, USA, 2009.
  15. Schwartz, G.G.; Klug, M.G. Motor neuron disease mortality rates in U.S. states are associated with well water use. Amyotroph. Lateral Scler. Front. Degener. 2016, 17, 528–534. [Google Scholar] [CrossRef] [PubMed] [Green Version]
  16. EPA TRI Explorer. Available online: https://enviro.epa.gov/triexplorer/tri_release.chemical (accessed on 19 April 2021).
  17. Zhou, Z.; Zhou, R.; Zhang, Z.; Li, K. The association between vitamin D status, vitamin D supplementation, sunlight exposure, and Parkinson’s Disease: A systematic review and meta-analysis. Med. Sci. Monit. 2019, 25, 666–674. [Google Scholar] [CrossRef]
  18. Elwood, J.M.; Lee, J.A.; Walter, S.D.; Mo, T.; Green, A.E. Relationship of melanoma and other skin cancer mortality to latitude and ultraviolet radiation in the United States and Canada. Int. J. Epidemiol. 1974, 3, 325–352. [Google Scholar] [CrossRef]
  19. CDC. State-specific prevalence of current cigarette smoking among adults, and policies and attitudes about secondhand smoke, United States, 2000. MMWR 2001, 50, 1101–1106. [Google Scholar]
  20. Hawles, C.H.; Tredici, K.D.; Braak, H. A timeline for Parkinson’s disease. Parkinsonism Relat. Disord. 2010, 16, 79–84. [Google Scholar]
  21. Pezzoli, G.; Careda, E. Exposure to pesticides or solvents and risk of Parkinson disease. Neurology 2013, 80, 2035–2041. [Google Scholar] [CrossRef] [PubMed]
  22. Breckenridge, C.B.; Berry, C.; Chang, E.T.; Sielken, R.L., Jr.; Mandel, J.S. Association between Parkinson’s disease and cigarette smoking, rural living, well-water consumption, farming, and pesticide use: Systematic review and meta-analysis. PLoS ONE 2016. [Google Scholar] [CrossRef] [Green Version]
  23. Silver, M.R.; Racette, B.A.; Dube, U.; Faust, I.M.; Nielsen, S.S. Well water and Parkinson Disease in Medicare beneficiaries: A nationwide case-control study. J. Parkinsons Dis. 2020, 10, 693–705. [Google Scholar] [CrossRef]
  24. EPA. Acid Rain, Students Site. Available online: https://www3.epa.gov/acidrain/education/site_students/phscale.html#:~:text=Normal%2C%20clean%20rain%20has%20a,a%20pH%20value%20of%204.0 (accessed on 1 April 2021).
  25. Driscoll, C.T.; Lawrence, G.B.; Bulger, A.J.; Butler, T.J.; Cronan, C.S.; Eager, C.; Lambert, K.F.; Likens, G.E.; Stoddard, J.L.; Weathers, K.C. Acidic deposition in the Northeastern United States: Sources and inputs, ecosystem effects, and management strategies. BioScience 2001, 51, 180–198. [Google Scholar] [CrossRef] [Green Version]
  26. Montgomery, E.B., Jr. Heavy metals and the etiology of Parkinson’s disease and other movement disorders. Toxicology 1995, 97, 3–9. [Google Scholar] [CrossRef]
  27. Willis, A.W.; Evanoff, B.A.; Galarza, A.; Wegrzyn, A.; Shootman, M.; Racette, B.A. Metal emissions and urban incident Parkinson disease: A community health study of Medicare beneficiaries by using Geographic Information Systems. Am. J. Epidemiol. 2010, 172, 1357–1363. [Google Scholar] [CrossRef] [Green Version]
  28. Nordberg, G.F.; Goyer, R.A.; Clarkson, T.W. Impact of effects of acid precipitation on toxicity of metals. Environ. Health Perspect. 1985, 62, 169–180. [Google Scholar] [CrossRef] [PubMed]
  29. Lei, I.-L.; Ng, D.-Q.; Sable, S.S.; Lin, Y.-P. Evaluation of lead release potential of new premise plumbing materials. Environ. Sci. Pollut. Res. 2018, 25, 27972–27981. [Google Scholar] [CrossRef] [PubMed]
  30. McDonald, M.E. Acid deposition and drinking water. Environ. Sci. Technol. 1985, 10, 772–776. [Google Scholar] [CrossRef] [PubMed]
  31. Cornwell, D.A.; Brown, R.A.; Via, S. National survey of lead service line occurrence. J. Am. Water Works Assoc. 2016, 108, E182–E191. [Google Scholar] [CrossRef]
  32. Moore, M.R. Influence of acid rain upon water plumbosolvency. Environ. Health Perspect. 1985, 63, 121–126. [Google Scholar] [CrossRef]
  33. Weisskopf, M.G.; Weuve, J.; Nie, H.; Sanit-Hilaire, M.-H.; Sudarsky, L.; Simon, D.K.; Hersh, B.; Schwartz, J.; Wright, R.O.; Hu, H. Association of cumulative lead exposure with Parkinson’s disease. Environ. Health Perspect. 2010, 118, 1609–1613. [Google Scholar] [CrossRef]
  34. Cicero, C.E.; Mostile, G.; Vasta, R.; Rapisarda, V.; Signorerlli, S.S.; Ferrante, M.; Zappia, M.; Nicoletti, A. Metals and neurodegenerative diseases. A systematic review. Environ. Res. 2017, 159, 82–94. [Google Scholar] [CrossRef]
  35. An, H.; Zeng, X.; Niu, T.; Li, G.; Yang, J.; Zheng, L. Quantifying iron deposition within the substantia nigra of Parkinson’s disease by quantitative susceptibility mapping. J. Neurol. Sci. 2018, 386, 46–52. [Google Scholar] [CrossRef]
  36. Barnham, K.J.; Bush, A.I. Biological metals and metal-targeting compounds in major neurodegenerative diseases. Chem. Soc. Rev. 2014, 43, 6727–6749. [Google Scholar] [CrossRef] [PubMed] [Green Version]
  37. Nandipati, S.; Litvan, I. Environmental exposures and Parkinson’s disease. Int. J. Environ. Res. Public Health 2016, 13, 881. [Google Scholar] [CrossRef] [PubMed]
  38. US Geological Survey National Water-Quality Assessment (NAWQA) Project. Available online: https://water.usgs.gov/nawqa/pnsp/usage/maps/ (accessed on 1 April 2021).
  39. Nishida, Y. Elucidation of endemic neurodegenerative diseases—A commentary. Z. Naturforsch C. 2003, 58, 752–758. [Google Scholar] [CrossRef] [PubMed]
  40. Perl, D.P. Relationship of aluminum to Alzheimer’s disease. Environ. Health Perspect. 1985, 63, 149–153. [Google Scholar] [CrossRef] [PubMed]
  41. Bjørklund, G.; Stejskal, V.; Urbina, M.; Dadar, M.; Chirumbolo, S.; Mutter, J. Metals and Parkinson’s disease: Mechanisms and biochemical processes. Curr. Med. Chem. 2018, 25, 2198–2214. [Google Scholar] [CrossRef]
  42. Rajput, A.H.; Uitti, R.J.; O’Donnell, D.; O’Donnell, K. Metal concentrations in drinking water in Parkinson’s disease and controls. Can. J. Neurol. Sci. 1986, 13, 185. [Google Scholar]
  43. Rajput, A.H.; Ryan, J.; Uitti, W.; Stern, W.; Laverty, W.; O’Donnell, K.; O’Donnell, D.; Yuen, W.K.; Dua, A. Geography, drinking water chemistry, pesticides and herbicides and the etiology of Parkinson’s disease. Can. J. Neurol. Sci. 1987, 14, 414–418. [Google Scholar] [CrossRef] [PubMed] [Green Version]
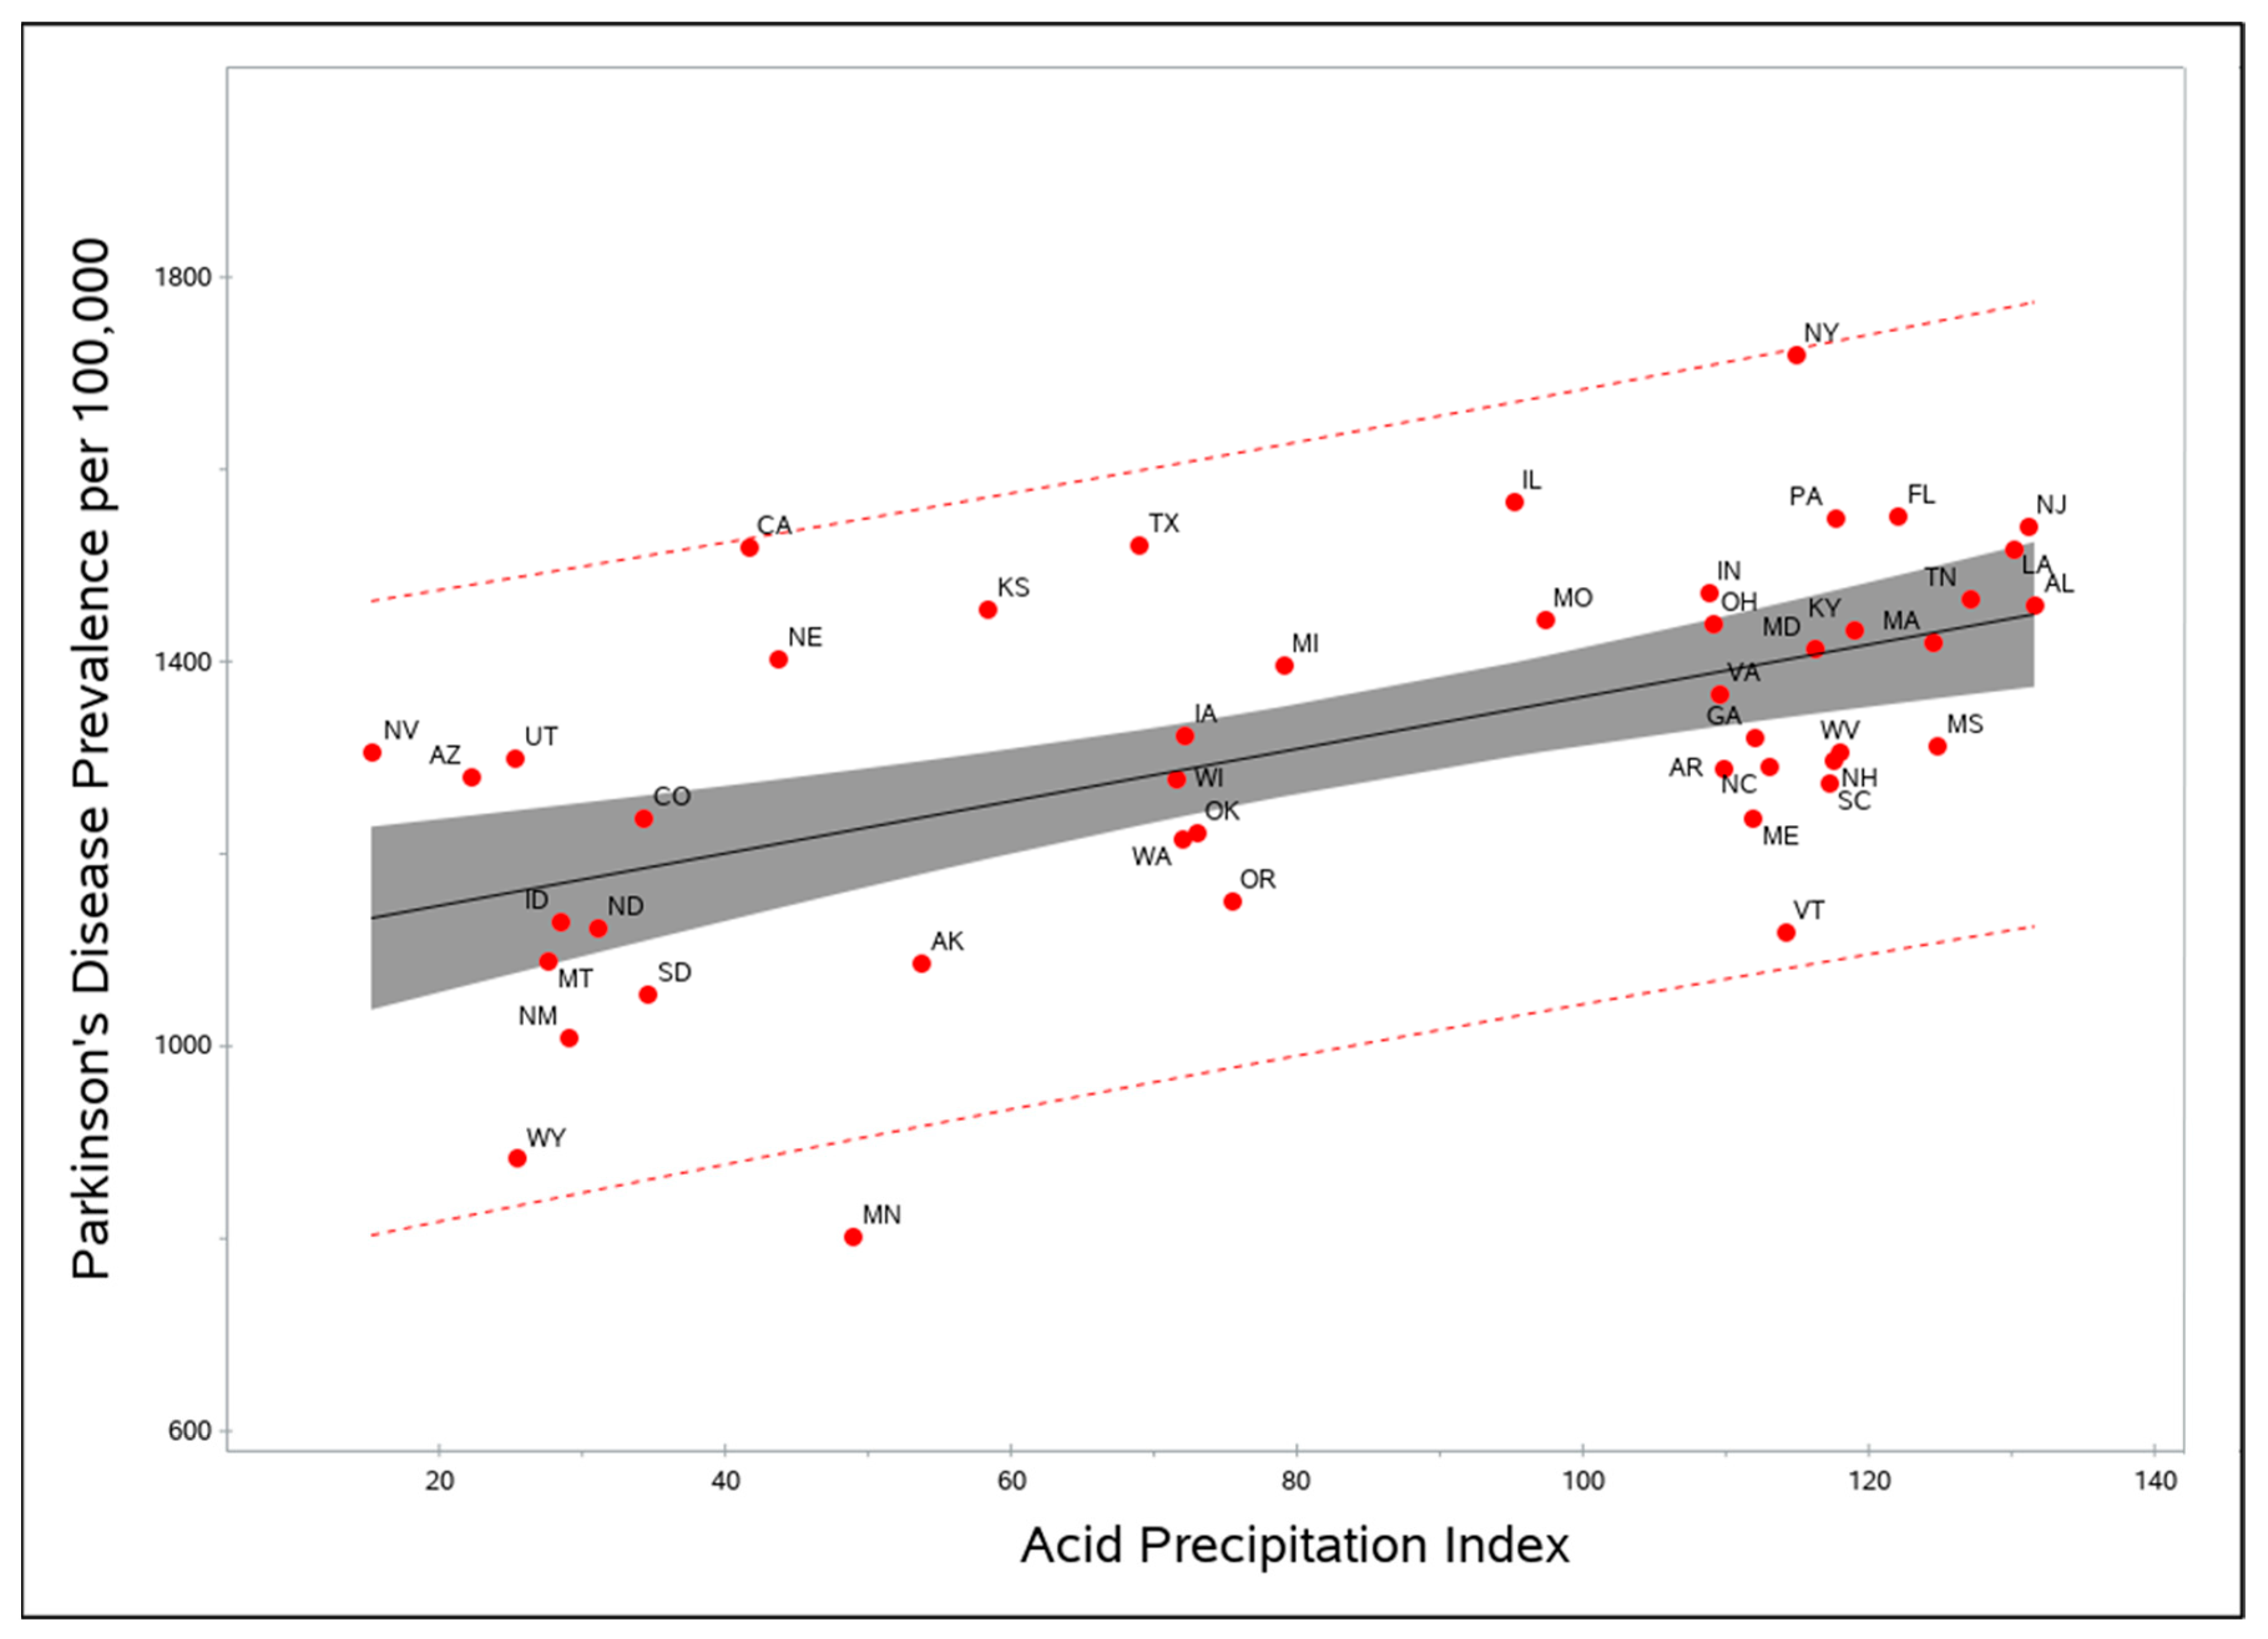
Figure 1. State-level prevalence of Parkinson’s disease vs. the quantity of acid rain, measured by the Acid Precipitation Index. Confidence limits of the mean and dotted lines are 95% confidence intervals.
Brainsci 11 00779 g001
Figure 2. Hypothesized biological model of the acid rain hypothesis, “[]” indicates concentration.
Brainsci 11 00779 g002
Table 1. Summary statistics for predictor variables.
Variable Mean (SD)Range (State)
Parkinson’s disease prevalence rates1325.0 (185.4)802.9 (MN)–1719.8 (NY)
Sulfuric acid release amount846,954.5 (1,299,945.3)250 (SD)–7,609,755 (TN)
pH value4.81 (0.4) 5.43 (SD)–4.22 (OH)
Precipitation amount37.5 (13.6) 9.46 (NV)–59.15 (LA)
Acid Precipiation Index (API)83.12 (38.5) 15.23 (NV)–131.6 (AL)
Well-water usage rate17.3% (9.9) 3% (UT)–44% (ME)
Smoking prevalence rate22.9% (3.0) 12.9% (UT)–30.5% (KY)
UV Index25.1 (6.3) 14.63 (WA)–39.72 (FL)
Table 2. Regression models results for predicting PD prevalence.
ModelPredictorβ-Coefficientt-Valuep-ValueAIC 1
pH aloneMean pH−255.7−4.010.0002469.90
Precipitation aloneMean Precipitation7.04.140.0001509.95
Well water aloneWell-water use−6.2−2.420.0193519.48
UV aloneUV Index9.62.320.0249499.23
Smoking aloneSmoking prevalence6.00.690.4965524.75
Sulfuric acid aloneLog sulfuric acid24.32.130.0381520.71
API aloneAPI2.74.48<0.0001466.95
Full (API + well water + UV + smoking + sulfuric acid)API2.63.90.0004447.85
Well-water use−7.7−2.80.0078
UV Index1.90.50.6532
Smoking prevalence0.0100.9989
Log sulfuric acid15.81.30.1996
Final (API + well water + sulfuric acid)API2.64.43<0.0001452.79
Well-water use−8.4 0.0001
Log sulfuric acid18.0 0.0968
1 AIC scores used in model selection with PROC GLMSELECT differed from the output of PROC REG for the models. AKI = Akaike information criterion; API = Acid Precipitation Index; UV = Ultraviolet.
Publisher’s Note: MDPI stays neutral with regard to jurisdictional claims in published maps and institutional affiliations.