
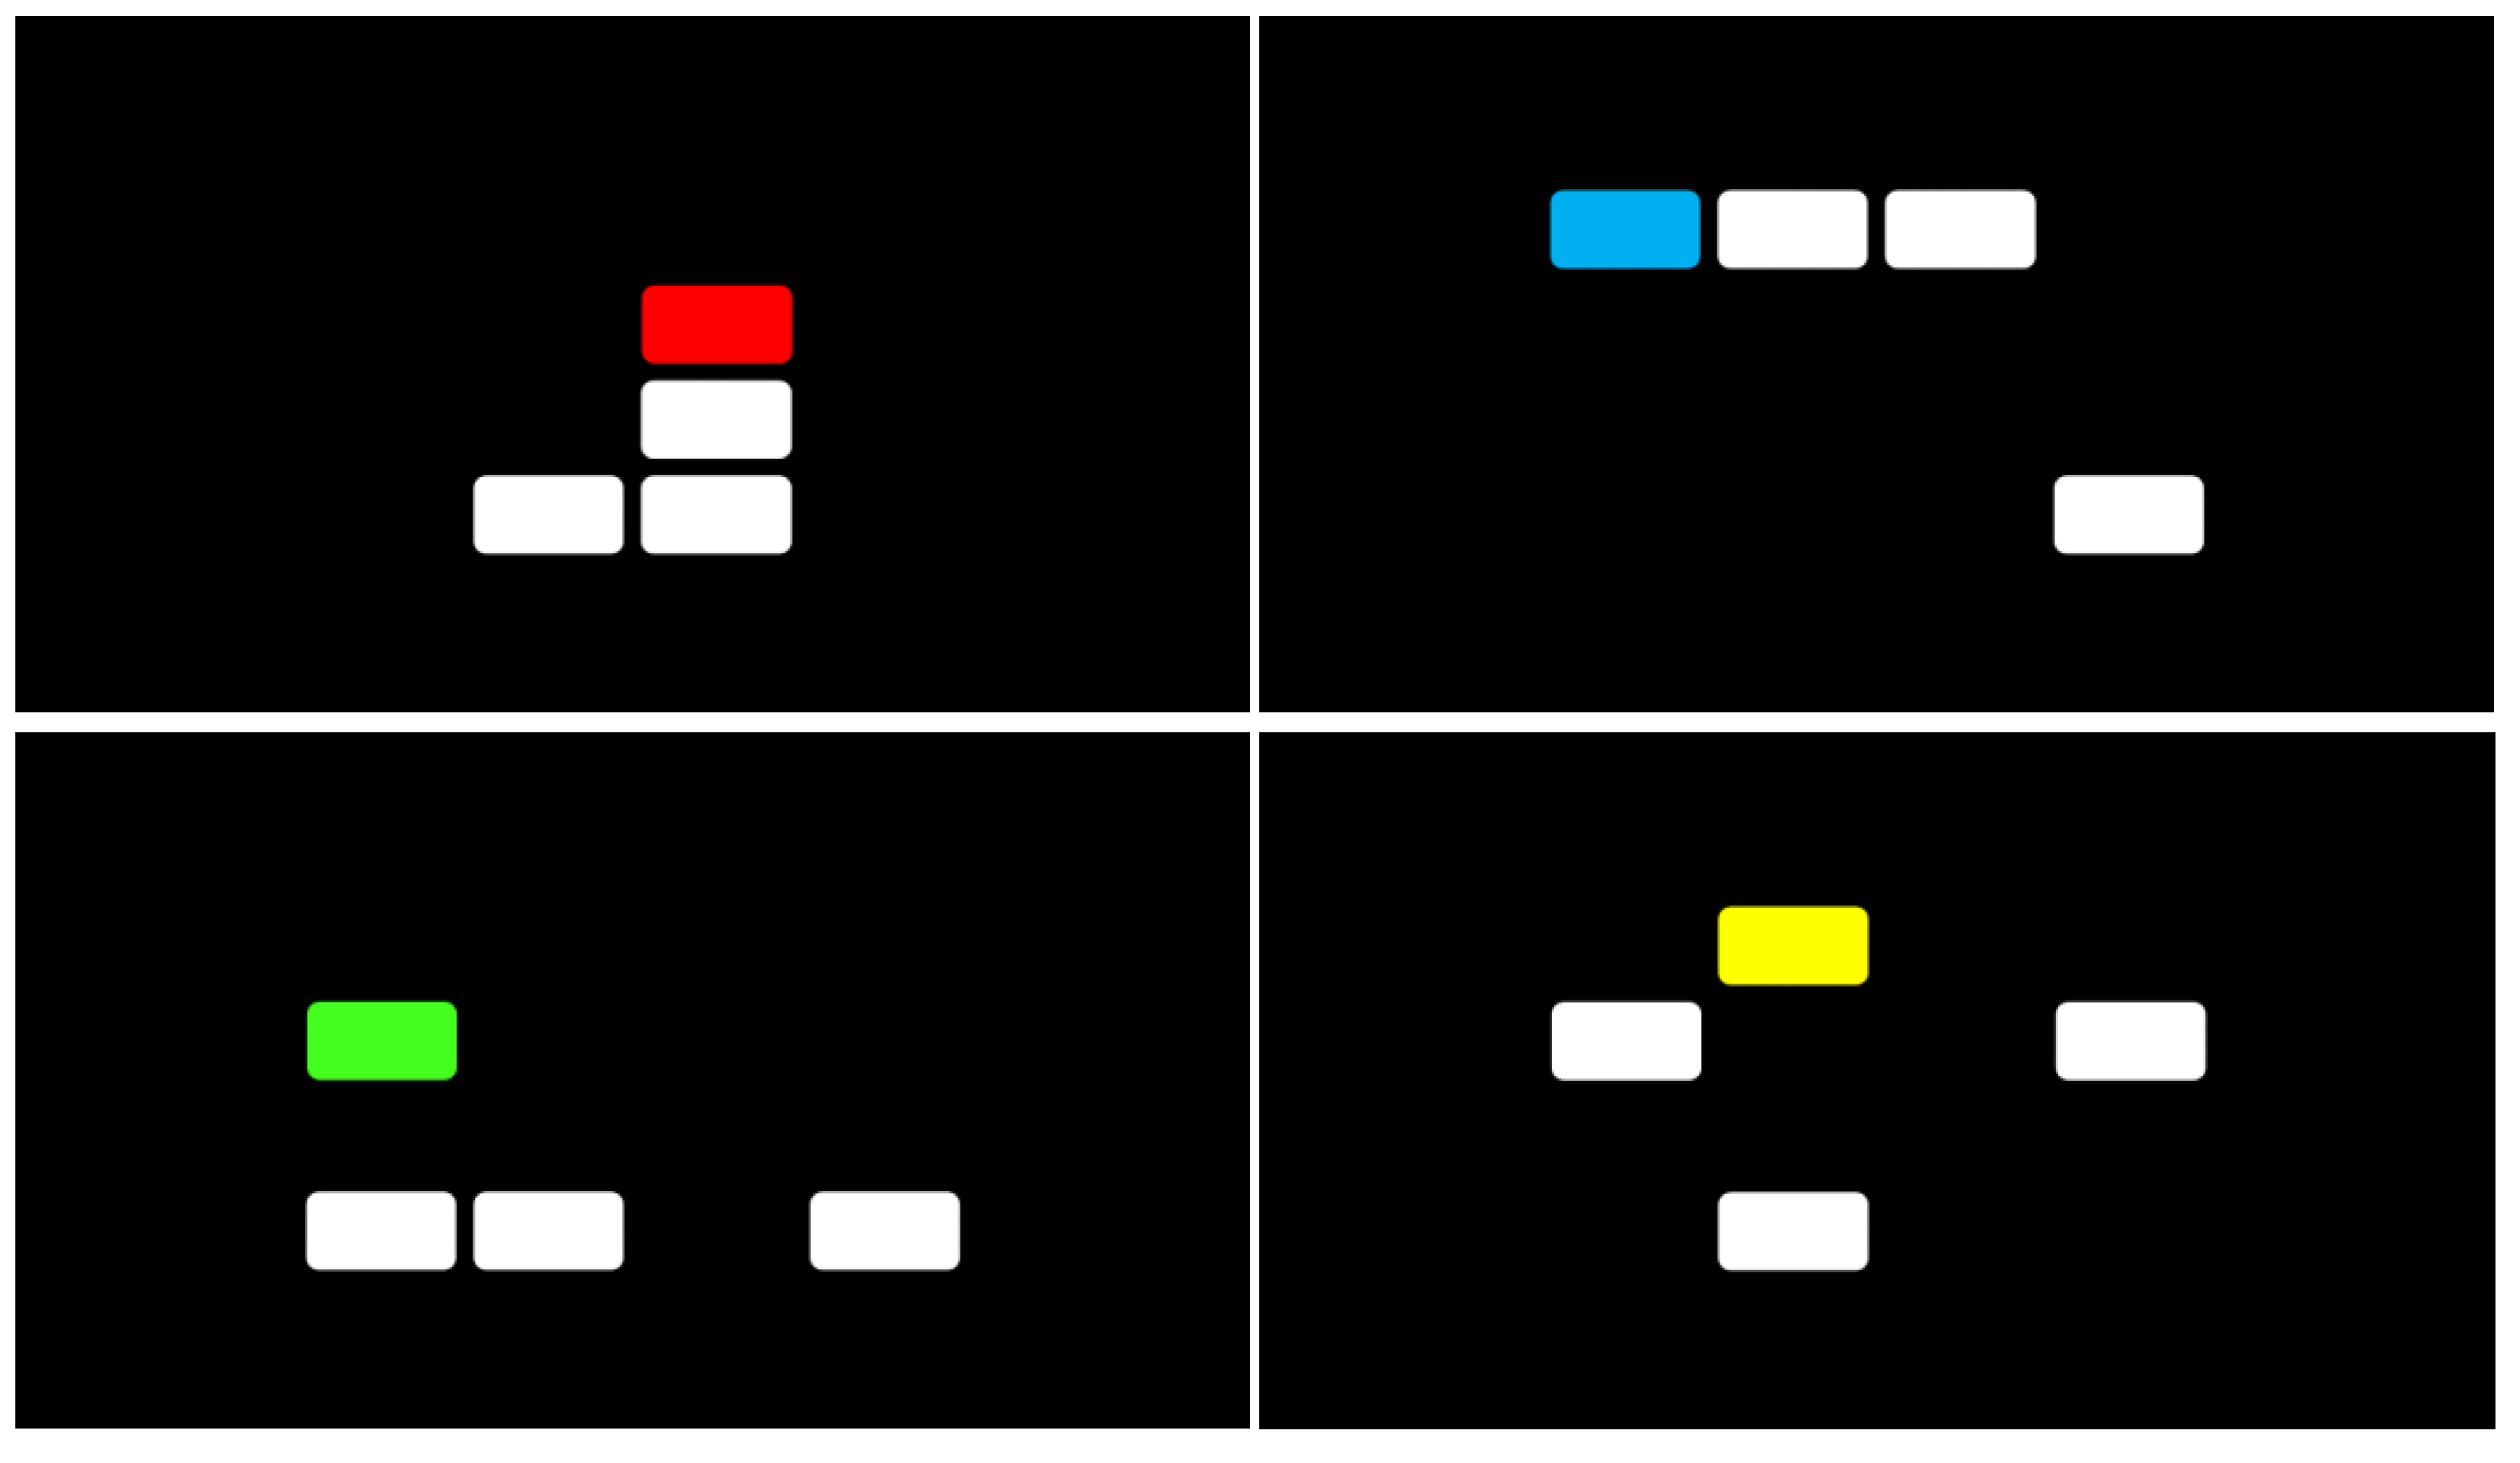
The Multi-Level Pattern Memory Test (MPMT): Initial Validation of a Novel Performance Validity Test

Abstract
:1. Introduction
2. Experiment 1
2.1. Materials and Methods
2.1.1. Participants
2.1.2. Measures
2.1.3. Procedure
2.1.4. Data Analysis
2.2. Results
3. Experiment 2
3.1. Materials and Methods
3.1.1. Participants
3.1.2. Measures
3.1.3. Procedure
3.1.4. Data Analysis
3.2. Results
4. General Discussion
5. Conclusions
Author Contributions
Funding
Institutional Review Board Statement
Informed Consent Statement
Data Availability Statement
Acknowledgments
Conflicts of Interest
References
- Lippa, S.M. Performance validity testing in neuropsychology: A clinical guide, critical review, and update on a rapidly evolving literature. Clin. Neuropsychol. 2018, 32, 391–421. [Google Scholar] [CrossRef]
- Sherman, E.M.S.; Slick, D.J.; Iverson, G.L. Multidimensional malingering criteria for neuropsychological assessment: A 20-year update of the malingered neuropsychological dysfunction criteria. Arch. Clin. Neuropsychol. 2020, 35, 735–764. [Google Scholar] [CrossRef] [PubMed]
- Young, G. Malingering in Forensic Disability-Related Assessments: Prevalence 15 ± 15 %. Psychol. Inj. Law 2015, 8, 188–199. [Google Scholar] [CrossRef]
- Bush, S.S.; Ruff, R.M.; Tröster, A.I.; Barth, J.T.; Koffler, S.P.; Pliskin, N.H.; Silver, C.H. Symptom validity assessment: Practice issues and medical necessity: NAN Policy Planning Committee. Arch. Clin. Neuropsychol. 2005, 20, 419–426. [Google Scholar] [CrossRef] [PubMed]
- Heilbronner, R.L.; Sweet, J.J.; Morgan, J.E.; Larrabee, G.J.; Millis, S.R. American academy of clinical neuropsychology consensus conference statement on the neuropsychological assessment of effort, response bias, and malingering. Clin. Neuropsychol. 2009, 23, 1093–1129. [Google Scholar] [CrossRef]
- Dandachi-fitzgerald, B.; Merckelbach, H.; Ponds, R.W.H.M. Neuropsychologists’ ability to predict distorted symptom presentation. J. Clin. Exp. Neuropsychol. 2017, 39, 257–264. [Google Scholar] [CrossRef] [Green Version]
- Boone, K.B. Assessment of neurocognitive performance validity. In Textbook of Clinical Neuropsychology, 2nd ed.; Morgan, J.E., Ricker, J.H., Eds.; Routledge: New York, NY, USA, 2018; pp. 39–50. [Google Scholar]
- Larrabee, G.J. Performance Validity and Symptom Validity in Neuropsychological Assessment. J. Int. Neuropsychol. Soc. 2012, 18, 625–631. [Google Scholar] [CrossRef]
- Rickards, T.A.; Cranston, C.C.; Touradji, P.; Bechtold, K.T. Embedded performance validity testing in neuropsychological assessment: Potential clinical tools. Appl. Neuropsychol. Adult 2018, 25, 219–230. [Google Scholar] [CrossRef]
- Rogers, R.; Bender, S.D. Clinical Assessment of Malingering and Deception; Guilford Press: New York, NY, USA, 2018. [Google Scholar]
- Suhr, J.A.; Gunstad, J. Coaching of Malingering: A Review. In Assessment of Malingered Neuropsychological Deficits; Larrabee, G.J., Ed.; Oxford University Press: New York, NY, USA, 2007; pp. 287–311. [Google Scholar]
- Chafetz, M.D.; Williams, M.A.; Ben-Porath, Y.S.; Bianchini, K.J.; Boone, K.B.; Kirkwood, M.W.; Ord, J.S. Official Position of the American Academy of Clinical Neuropsychology Social Security Administration Policy on Validity Testing: Guidance and Recommendations for Change. Clin. Neuropsychol. 2015, 29, 723–740. [Google Scholar] [CrossRef] [Green Version]
- Green, P. Manual for the Nonverbal Medical Symptom Validity Test; Green’s Publications: Edmonton, AB, Canada, 2008. [Google Scholar]
- Brunyé, T.T.; Drew, T.; Weaver, D.L.; Elmore, J.G. A review of eye tracking for understanding and improving diagnostic interpretation. Cogn. Res. Princ. Implic. 2019, 4, 7. [Google Scholar] [CrossRef]
- Wager, J.G.; Howe, L.L.S. Nonverbal medical symptom validity test: Try faking now! Appl. Neuropsychol. 2010, 17, 305–309. [Google Scholar] [CrossRef]
- Rogers, R. Detection strategies for malingering and defensiveness. In Clinical Assessment of Malingering and Deception, 4th ed.; Rogers, R., Bender, S.D., Eds.; Guilford Press: New York, NY, USA, 2018; pp. 18–41. [Google Scholar]
- Faul, F.; Erdfelder, E.; Lang, A.G.; Buchner, A. G*Power 3: A flexible statistical power analysis program for the social, behavioral, and biomedical sciences. Behav. Res. Methods 2007, 39, 175–191. [Google Scholar] [CrossRef]
- Ayres, P.; Paas, F. Cognitive load theory: New directions and challenges. Appl. Cogn. Psychol. 2012, 26, 827–832. [Google Scholar] [CrossRef]
- SR Research. EyeLink Data Viewer User’s Manual 4.1.1; SR Research Ltd.: Mississauga, ON, Canada, 2019. [Google Scholar]
- R Core Team. R: A Language and Environment for Statistical Computing; R Foundation for Statistical Computing: Vienna, Austria, 2019; Available online: https://www.r-project.org/ (accessed on 3 August 2021).
- Tombaugh, T.N. Test of Memory Malingering: TOMM; Multi-Health Systems: North Tonawanda, NY, USA, 1996. [Google Scholar]
- Martin, P.K.; Schroeder, R.W.; Olsen, D.H.; Maloy, H.; Boettcher, A.; Ernst, N.; Okut, H. A systematic review and meta-analysis of the Test of Memory Malingering in adults: Two decades of deception detection. Clin. Neuropsychol. 2020, 34, 88–119. [Google Scholar] [CrossRef]
- Denning, J.H. The efficiency and accuracy of the test of memory malingering trial 1, errors on the first 10 items of the test of memory malingering, and five embedded measures in predicting invalid test performance. Arch. Clin. Neuropsychol. 2012, 27, 417–432. [Google Scholar] [CrossRef]
- Denning, J.H. Combining the test of memory malingering trial 1 with behavioral responses improves the detection of effort test failure. Appl. Neuropsychol. Adult 2014, 21, 269–277. [Google Scholar] [CrossRef] [PubMed]
- Hosmer, D.W.; Lemeshow, S.; Sturdivant, R.X. Applied Logisitic Regression, 3rd ed.; John Wiley Sons: Hoboken, NJ, USA, 2013. [Google Scholar]
- Boone, K.B. Clinical Practice of Forensic Neuropsychology; Guilford Press: New York, NY, USA, 2013. [Google Scholar]
- Chelune, G.J. Evidence-based research and practice in clinical neuropsychology. Clin. Neuropsychol. 2010, 24, 454–467. [Google Scholar] [CrossRef]
- O’Bryant, S.E.; Lucas, J.A. Estimating the predictive value of the Test of Memory Malingering: An illustrative example for clinicians. Clin. Neuropsychol. 2006, 20, 533–540. [Google Scholar] [CrossRef]
- Larrabee, G.J.; Millis, S.R.; Meyers, J.E. 40 plus or minus 10, a new magical number: Reply to russell. Clin. Neuropsychol. 2009, 23, 841–849. [Google Scholar] [CrossRef] [PubMed]
- Schmitz, N.; Kruse, J.; Heckrath, C.; Alberti, L.; Tress, W. Diagnosing mental disorders in primary care: The general health questionnaire (GHQ) and the symptom check list (SCL-90-R) as screening instruments. Soc. Psychiatry Psychiatr. Epidemiol. 1999, 34, 360–366. [Google Scholar] [CrossRef] [PubMed]
- Faust, D.; Ackley, M.A. Did You Think It Was Going to Be Easy? In Detection of Malingering during Head Injury Litigation; Reynolds, C.R., Ed.; Springer: Boston, MA, USA, 1998; pp. 1–54. [Google Scholar] [CrossRef]
- Green, P. Green’s Word Memory Test for Microsoft Windows: User’s Manual; Green’s Publications: Edmonton, AB, Canada, 2005. [Google Scholar]
- Larrabee, G.J. Detection of Malingering Using Atypical Performance Patterns on Standard Neuropsychological Tests. Clin. Neuropsychol. 2012, 17, 410–425. [Google Scholar] [CrossRef]
- McGuire, C.; Crawford, S.; Evans, J.J. Effort Testing in Dementia Assessment: A Systematic Review. Arch. Clin. Neuropsychol. 2019, 34, 114–131. [Google Scholar] [CrossRef] [PubMed] [Green Version]
- Omer, E.; Braw, Y. The Effects of Cognitive Load on Strategy Utilization in a Forced-Choice Recognition Memory Performance Validity Test. Eur. J. Psychol. Assess. 2021. [Google Scholar] [CrossRef]
- Paas, F.G.W.C. Training Strategies for Attaining Transfer of Problem-Solving Skill in Statistics: A Cognitive-Load Approach. J. Educ. Psychol. 1992, 84, 429–434. [Google Scholar] [CrossRef]
- Tan, J.E.; Slick, D.J.; Strauss, E.; Hultsch, D.F. How’d they do it? Malingering strategies on symptom validity tests. Clin. Neuropsychol. 2002, 16, 495–505. [Google Scholar] [CrossRef] [PubMed]
- Robinson, J.S.; Collins, R.L.; Miller, B.I.; Pacheco, V.H.; Wisdom, N.M. The Severe Impairment Profile: A Conceptual Shift. Arch. Clin. Neuropsychol. 2018, 33, 238–246. [Google Scholar] [CrossRef] [Green Version]
- An, K.Y.; Kaploun, K.; Erdodi, L.A.; Abeare, C.A. Performance validity in undergraduate research participants: A comparison of failure rates across tests and cutoffs. Clin. Neuropsychol. 2017, 31, 193–206. [Google Scholar] [CrossRef]
- Bauer, L.; McCaffrey, R.J. Coverage of the Test of Memory Malingering, Victoria Symptom Validity Test, and Word Memory Test on the Internet: Is test security threatened? Arch. Clin. Neuropsychol. 2006, 21, 121–126. [Google Scholar] [CrossRef] [Green Version]
- Braw, Y. Response Time Measures as Supplementary Validity Indicators in Forced-Choice Recognition Memory Performance Validity Tests: A Systematic Review. Neuropsychol. Rev. 2021, 1–28. [Google Scholar] [CrossRef]
- Bauer, R.M.; Iverson, G.L.; Cernich, A.N.; Binder, L.M.; Ruff, R.M.; Naugle, R.I. Computerized neuropsychological assessment devices: Joint position paper of the American academy of clinical neuropsychology and the national academy of neuropsychology. Arch. Clin. Neuropsychol. 2012, 27, 362–373. [Google Scholar] [CrossRef] [Green Version]
- Moret-Tatay, C.; Beneyto-Arrojo, M.J.; Gutierrez, E.; Boot, W.R.; Charness, N. A Spanish adaptation of the computer and mobile device proficiency questionnaires (CPQ and MDPQ) for older adults. Front. Psychol. 2019, 10, 1165. [Google Scholar] [CrossRef] [PubMed]
- Aberson, C.L. Within Subjects Designs with ANOVA and Linear Mixed Models. In Applied Power Analysis for the Behavioral Sciences, 2nd ed.; Routledge: New York, NY, USA, 2019; pp. 88–99. [Google Scholar]


| Measures | Simulators (SIM) | Honest Controls (HC) | Statistical Analyses | Post-Hoc Tests | Effect Size | |
|---|---|---|---|---|---|---|
| Demographic | Age (years) [mean ± SD (range)] | 23.38 ± 2.26 (20–31) | 22.68 ± 1.79 (19–27) | t(65) = −1.41, p = 0.162 | ____ | d = 0.34 |
| Education (years) [mean ± SD] | 12.00 ± 0.25 | 11.97 ± 0.17 | t(65) = −0.56, p = 0.575 | ____ | d = 0.14 | |
| Gender (women) [number (%)] | 26 (78.80%) | 31 (91.20%) | χ2(1) = 2.02, p = 0.155 | ____ | OR = 0.36 | |
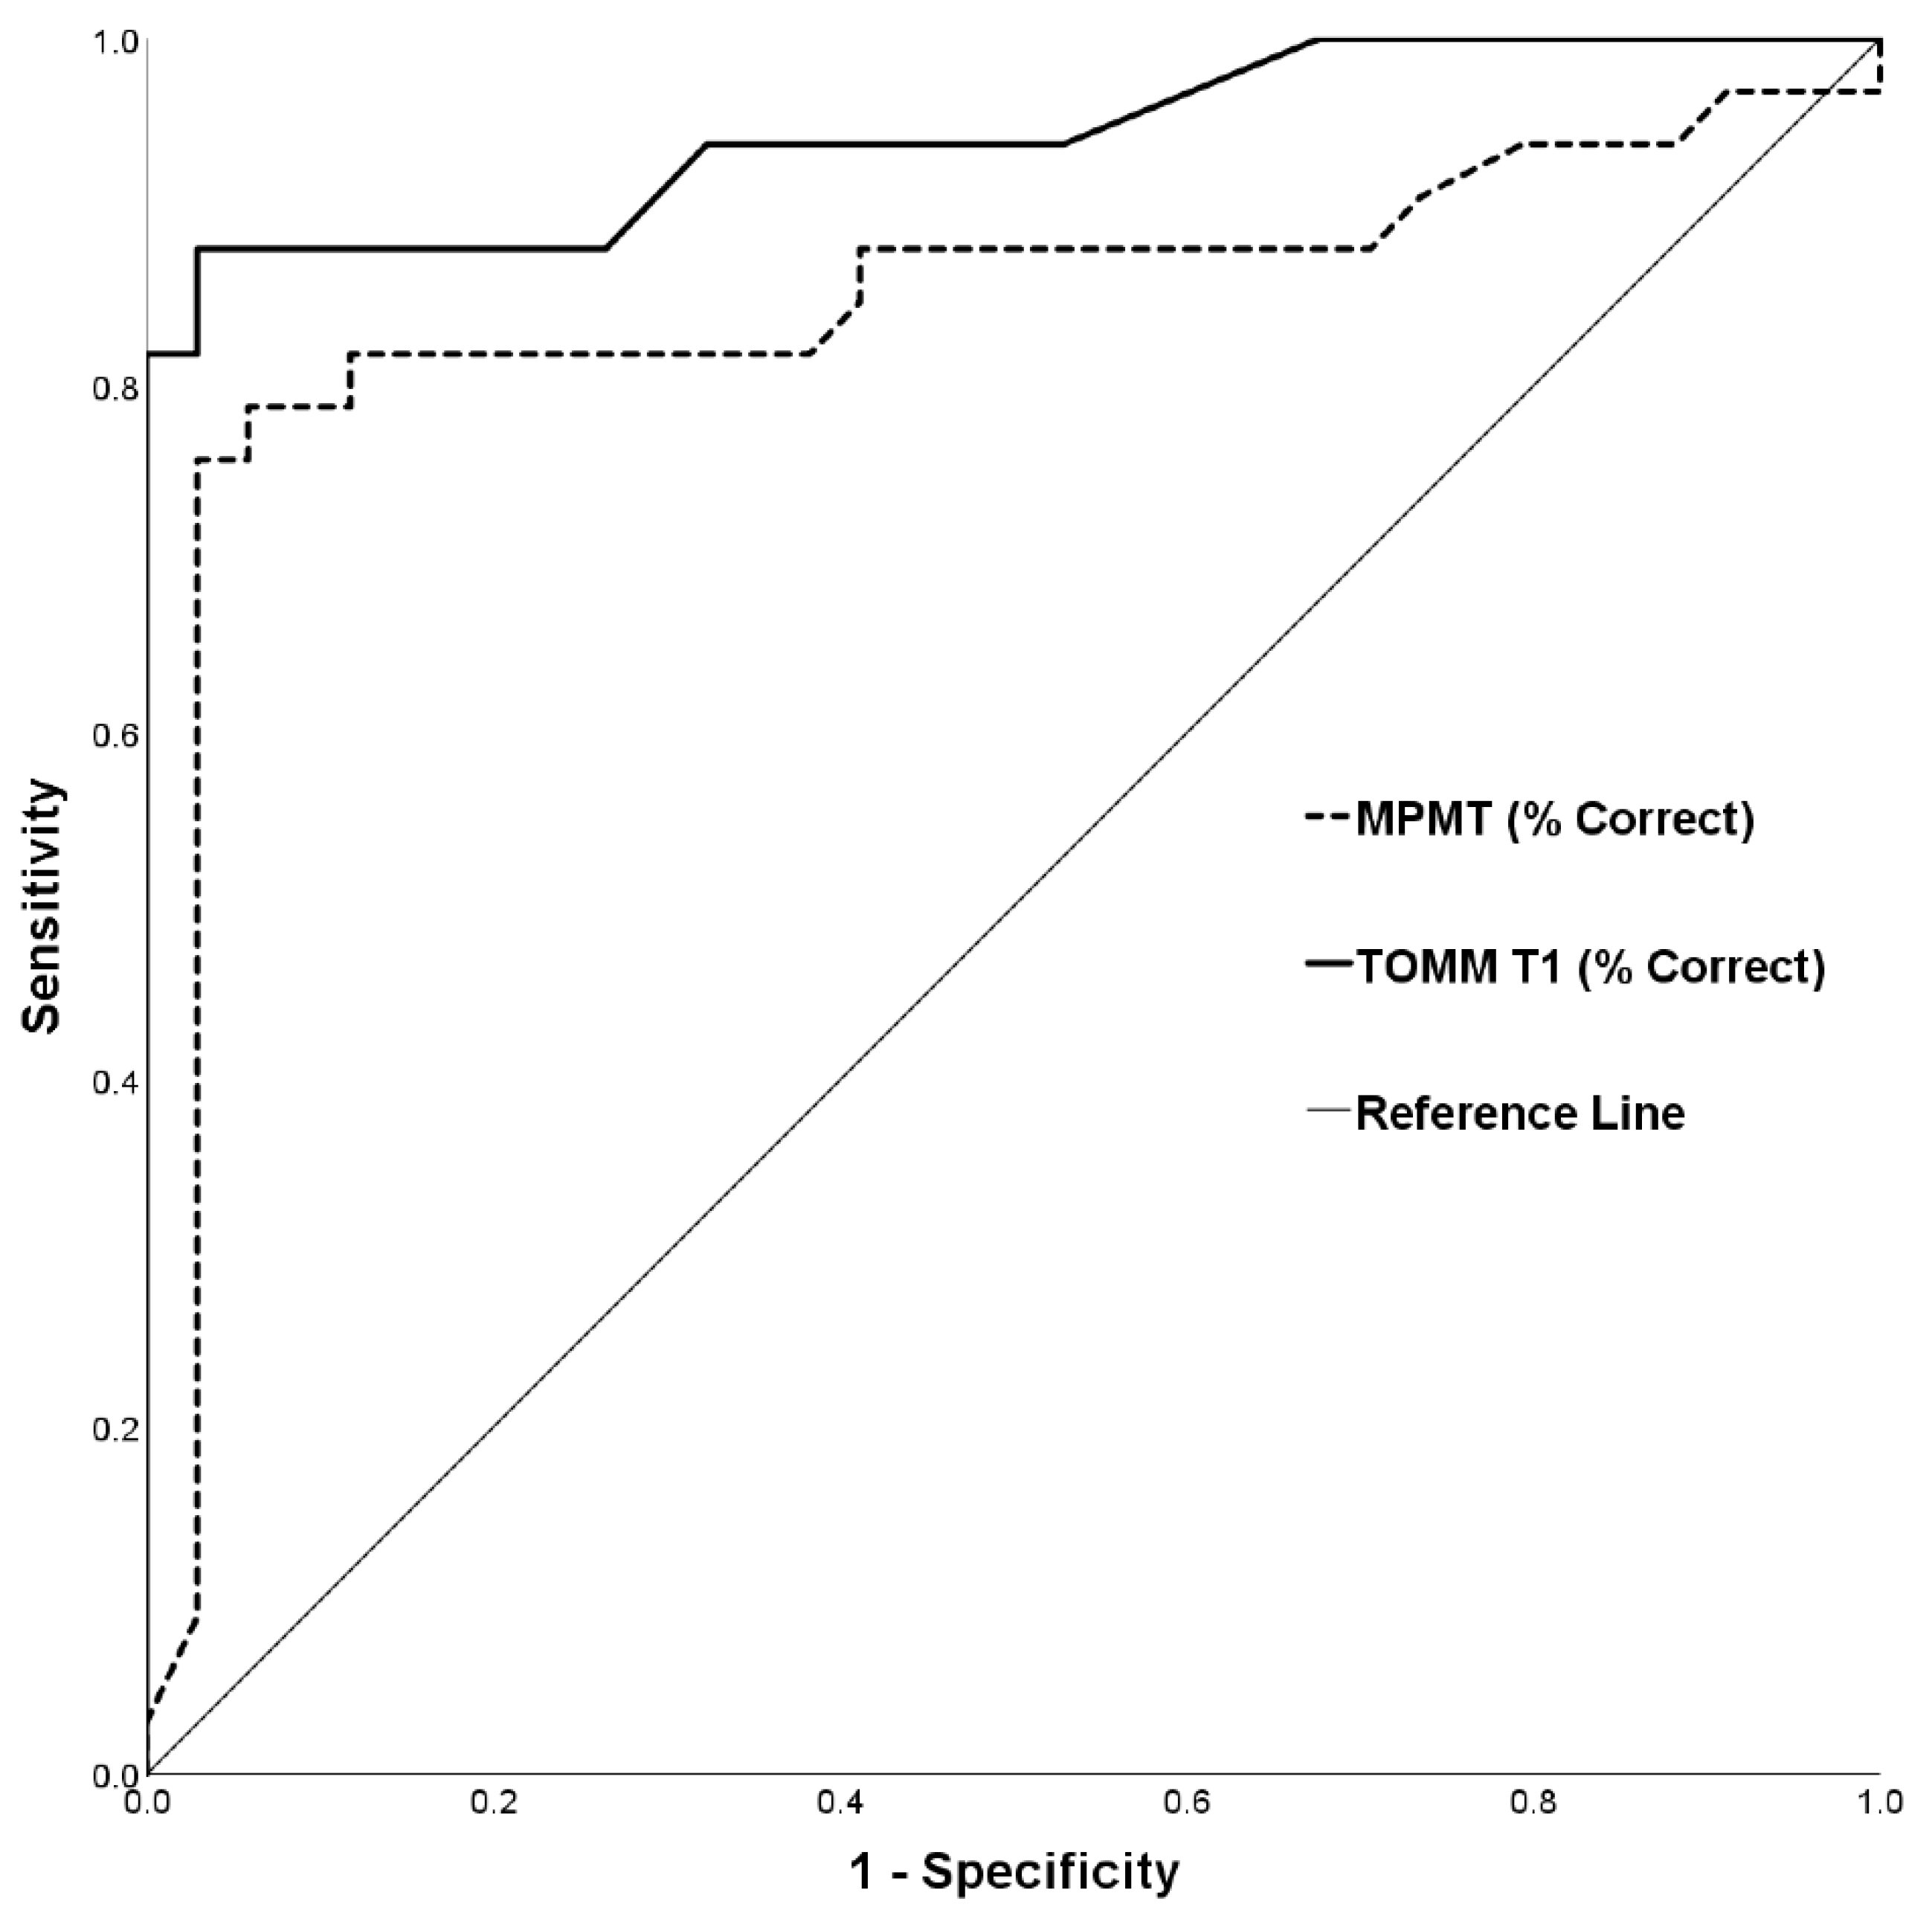
| TOMM T1 | Accuracy (% correct) | 57.45 ± 21.15 | 94.88 ± 5.53 | t(65) = 9.97, p < 0.001 | HC > SIM | d = 2.42 |
| MPMT | Total accuracy (% correct) | 53.17 ± 14.21 | 73.30 ± 10.76 | t(65) = 6.55, p < 0.001 | HC > SIM | d = 1.60 |
| Cutoff (%) | Specificity (%) | Sensitivity (%) | PPP (%) | NPP (%) | ||||
|---|---|---|---|---|---|---|---|---|
| Base Rates | Base Rates | |||||||
| 20% | 30% | 40% | 20% | 30% | 40% | |||
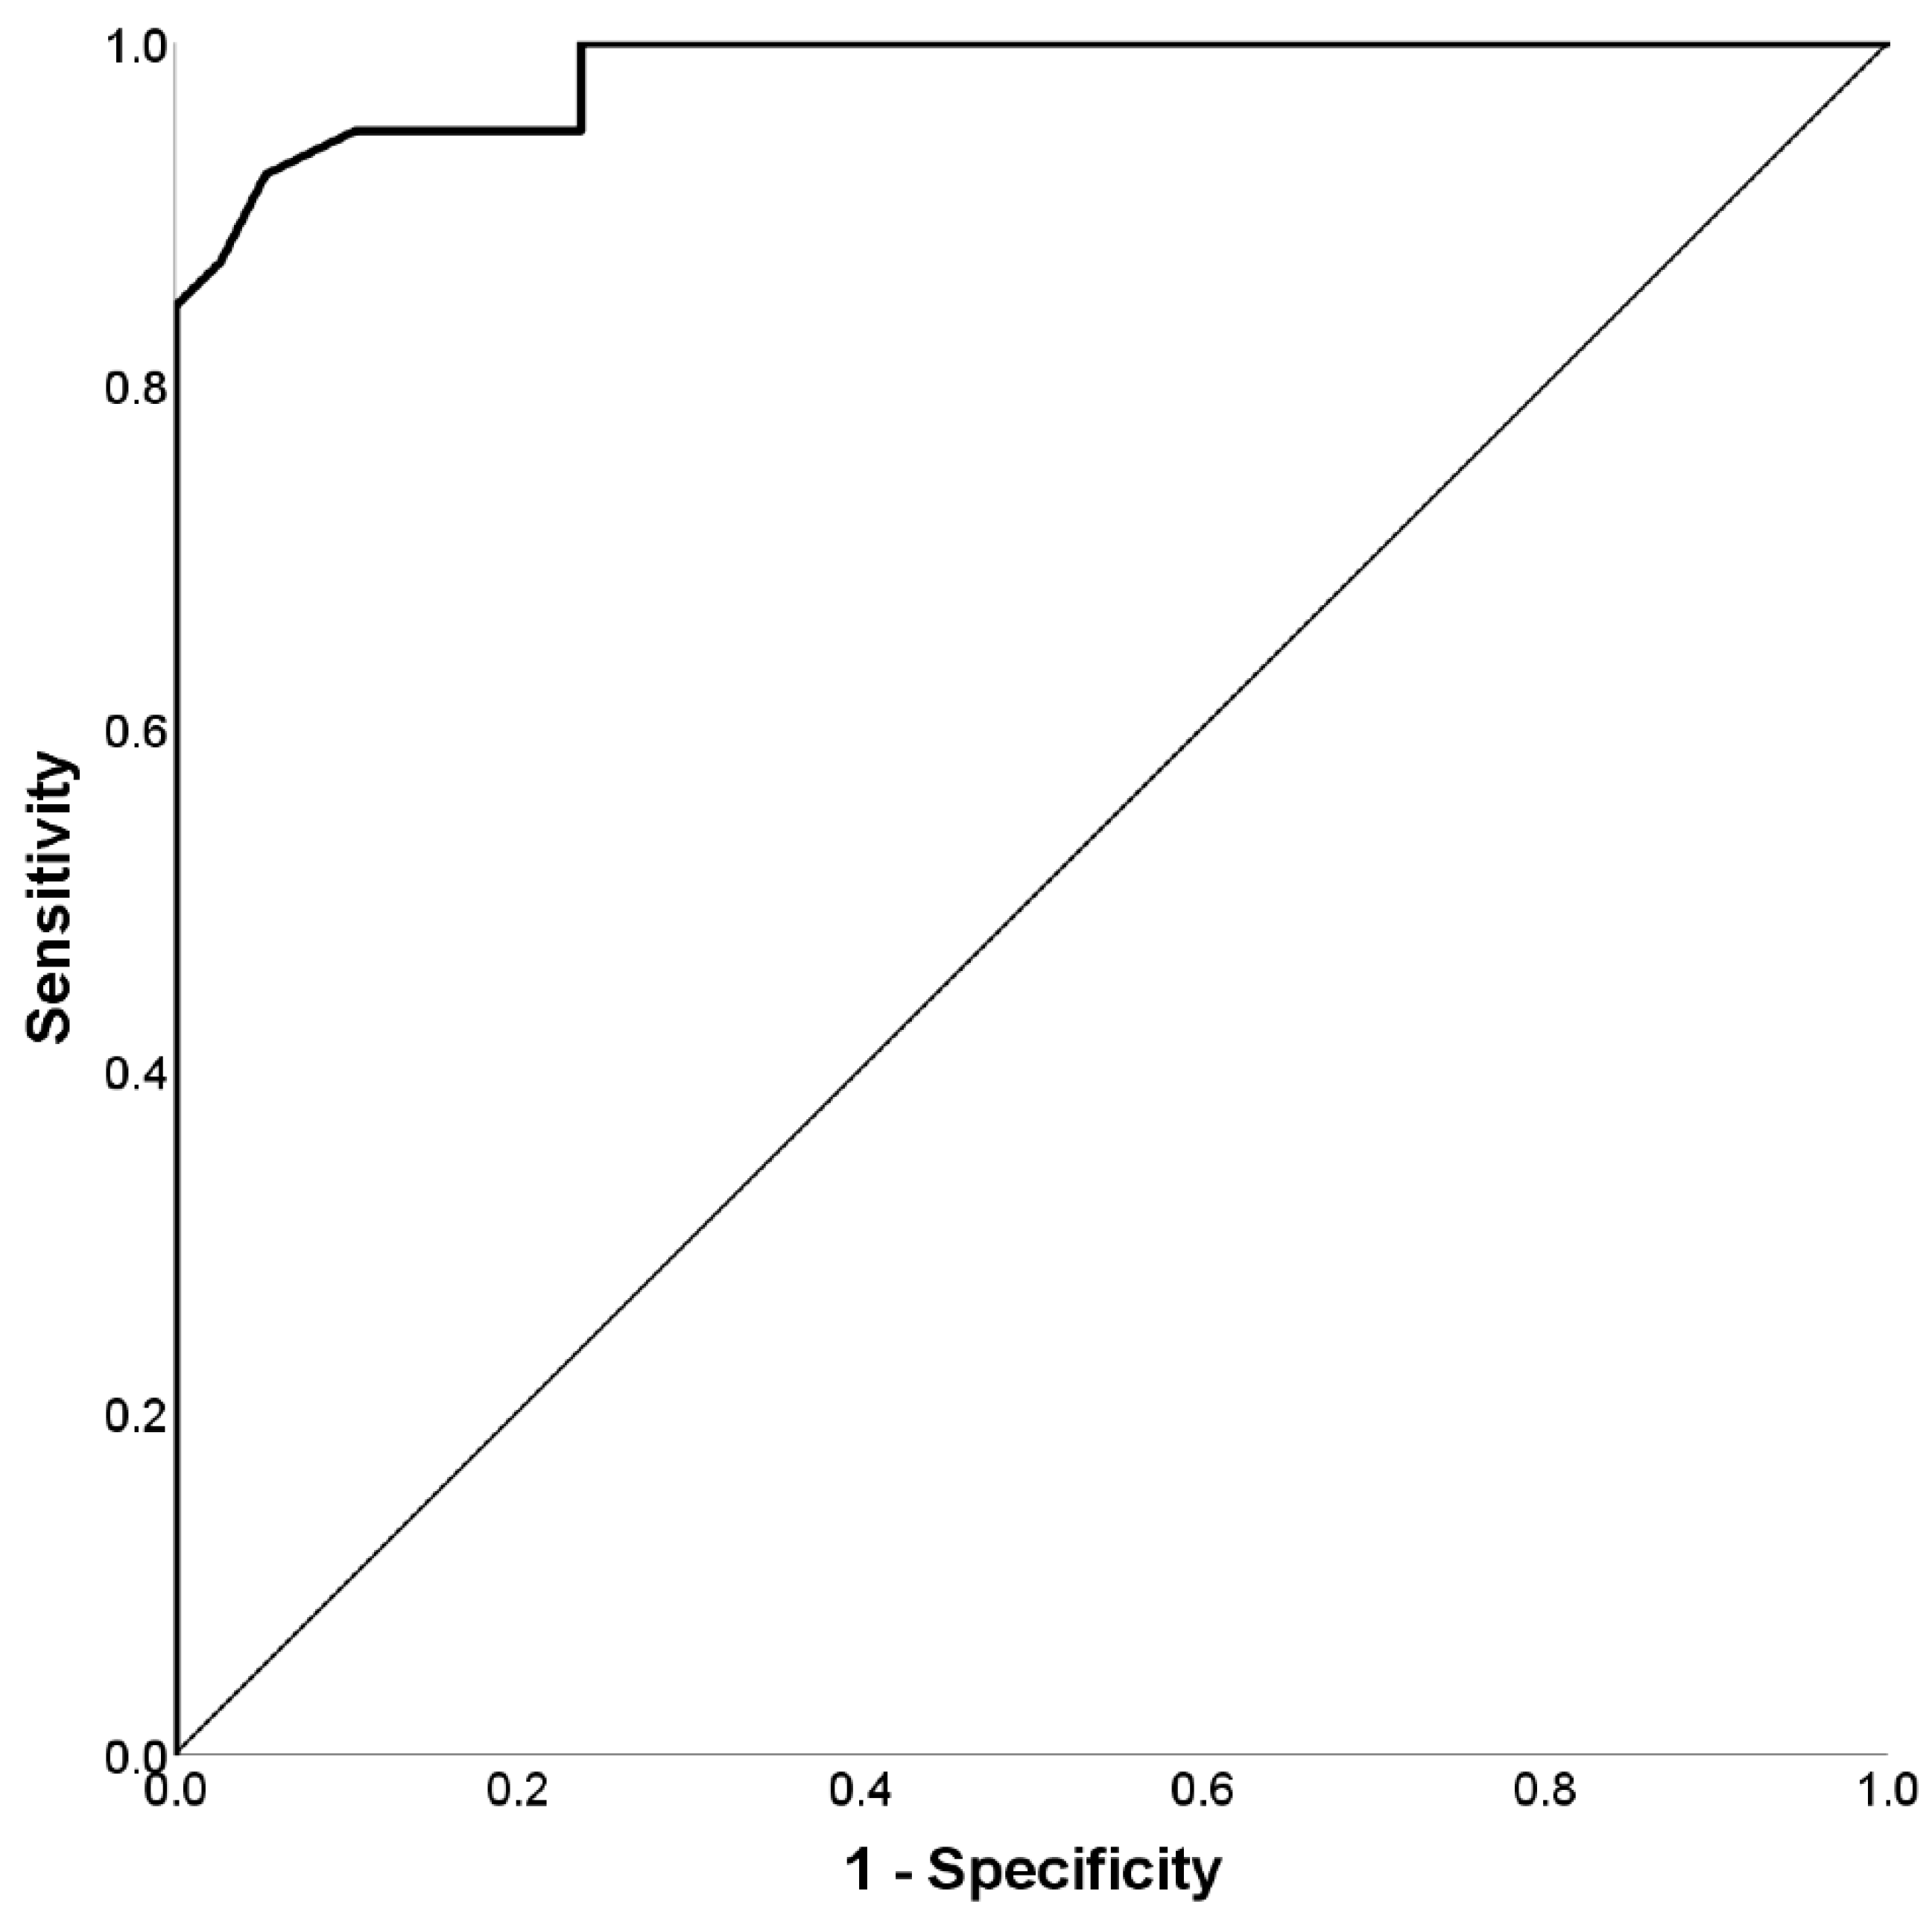
| 48.2 | 97.2 | 41.2 | 78.7 | 86.4 | 90.8 | 86.9 | 79.4 | 71.3 |
| 48.9 | 97.2 | 47.1 | 80.9 | 87.9 | 91.9 | 88.0 | 81.1 | 73.4 |
| 49.7 | 97.2 | 52.9 | 82.7 | 89.1 | 92.7 | 89.2 | 82.8 | 75.6 |
| 50.4 | 97.2 | 55.9 | 83.4 | 89.6 | 93.1 | 89.8 | 83.7 | 76.8 |
| 51.4 | 97.2 | 64.7 | 85.3 | 90.9 | 94.0 | 91.7 | 86.5 | 80.5 |
| 52.4 | 97.2 | 67.6 | 85.9 | 91.3 | 94.2 | 92.3 | 87.5 | 81.8 |
| 53.5 | 97.2 | 73.5 | 86.9 | 91.9 | 94.6 | 93.6 | 89.6 | 84.6 |
| 54.9 | 97.2 | 76.5 | 87.3 | 92.2 | 94.8 | 94.3 | 90.6 | 86.1 |
| 56.0 | 94.4 | 76.5 | 77.5 | 85.5 | 90.2 | 94.1 | 90.4 | 85.8 |
| 57.3 | 94.4 | 79.4 | 78.1 | 86.0 | 90.5 | 94.8 | 91.5 | 87.3 |
| 59.4 | 91.7 | 79.4 | 70.4 | 80.3 | 86.4 | 94.7 | 91.2 | 87.0 |
| 60.8 | 88.9 | 79.4 | 64.1 | 75.4 | 82.7 | 94.5 | 91.0 | 86.6 |
| 61.8 | 86.1 | 79.4 | 58.8 | 71.0 | 79.2 | 94.4 | 90.7 | 86.3 |
| 63.2 | 86.1 | 82.4 | 59.7 | 71.8 | 79.8 | 95.1 | 91.9 | 88.0 |
| Measures | Simulators (SIM) | Honest Controls (HC) | Statistical Analyses | Effect Size | |
|---|---|---|---|---|---|
| Demographic | Age (years) [mean ± SD (range)] | 23.79 ± 3.48 (18–38) | 23.00 ± 2.01 (20–28) | t(75) = −1.22, p = 0.225 | d = 0.28 |
| Education (years) [mean ± SD] | 12.46 ± 0.91 | 12.21 ± 0.70 | t(75) = −1.35, p = 0.182 | d = 0.31 | |
| Gender (women) [number (%)] | 32 (82.05%) | 36 (94.73%) | χ2(1) = 3.00, p = 0.083 | OR = 0.25 |
Publisher’s Note: MDPI stays neutral with regard to jurisdictional claims in published maps and institutional affiliations. |
© 2021 by the authors. Licensee MDPI, Basel, Switzerland. This article is an open access article distributed under the terms and conditions of the Creative Commons Attribution (CC BY) license (https://creativecommons.org/licenses/by/4.0/).
Share and Cite
Omer, E.; Braw, Y. The Multi-Level Pattern Memory Test (MPMT): Initial Validation of a Novel Performance Validity Test. Brain Sci. 2021, 11, 1039. https://doi.org/10.3390/brainsci11081039
Omer E, Braw Y. The Multi-Level Pattern Memory Test (MPMT): Initial Validation of a Novel Performance Validity Test. Brain Sciences. 2021; 11(8):1039. https://doi.org/10.3390/brainsci11081039
Chicago/Turabian StyleOmer, Elad, and Yoram Braw. 2021. "The Multi-Level Pattern Memory Test (MPMT): Initial Validation of a Novel Performance Validity Test" Brain Sciences 11, no. 8: 1039. https://doi.org/10.3390/brainsci11081039