
Prevalence of Developmental Dyslexia in Primary School Children: A Systematic Review and Meta-Analysis

Abstract
:1. Introduction
2. Materials and Methods
2.1. Search Strategy and Selection Criteria
2.2. Data Extraction and Quality Assessment
2.3. Overall Pooled Prevalence of DD
2.4. Subgroup Meta-Analysis and Meta-Regression of DD Prevalence
3. Results
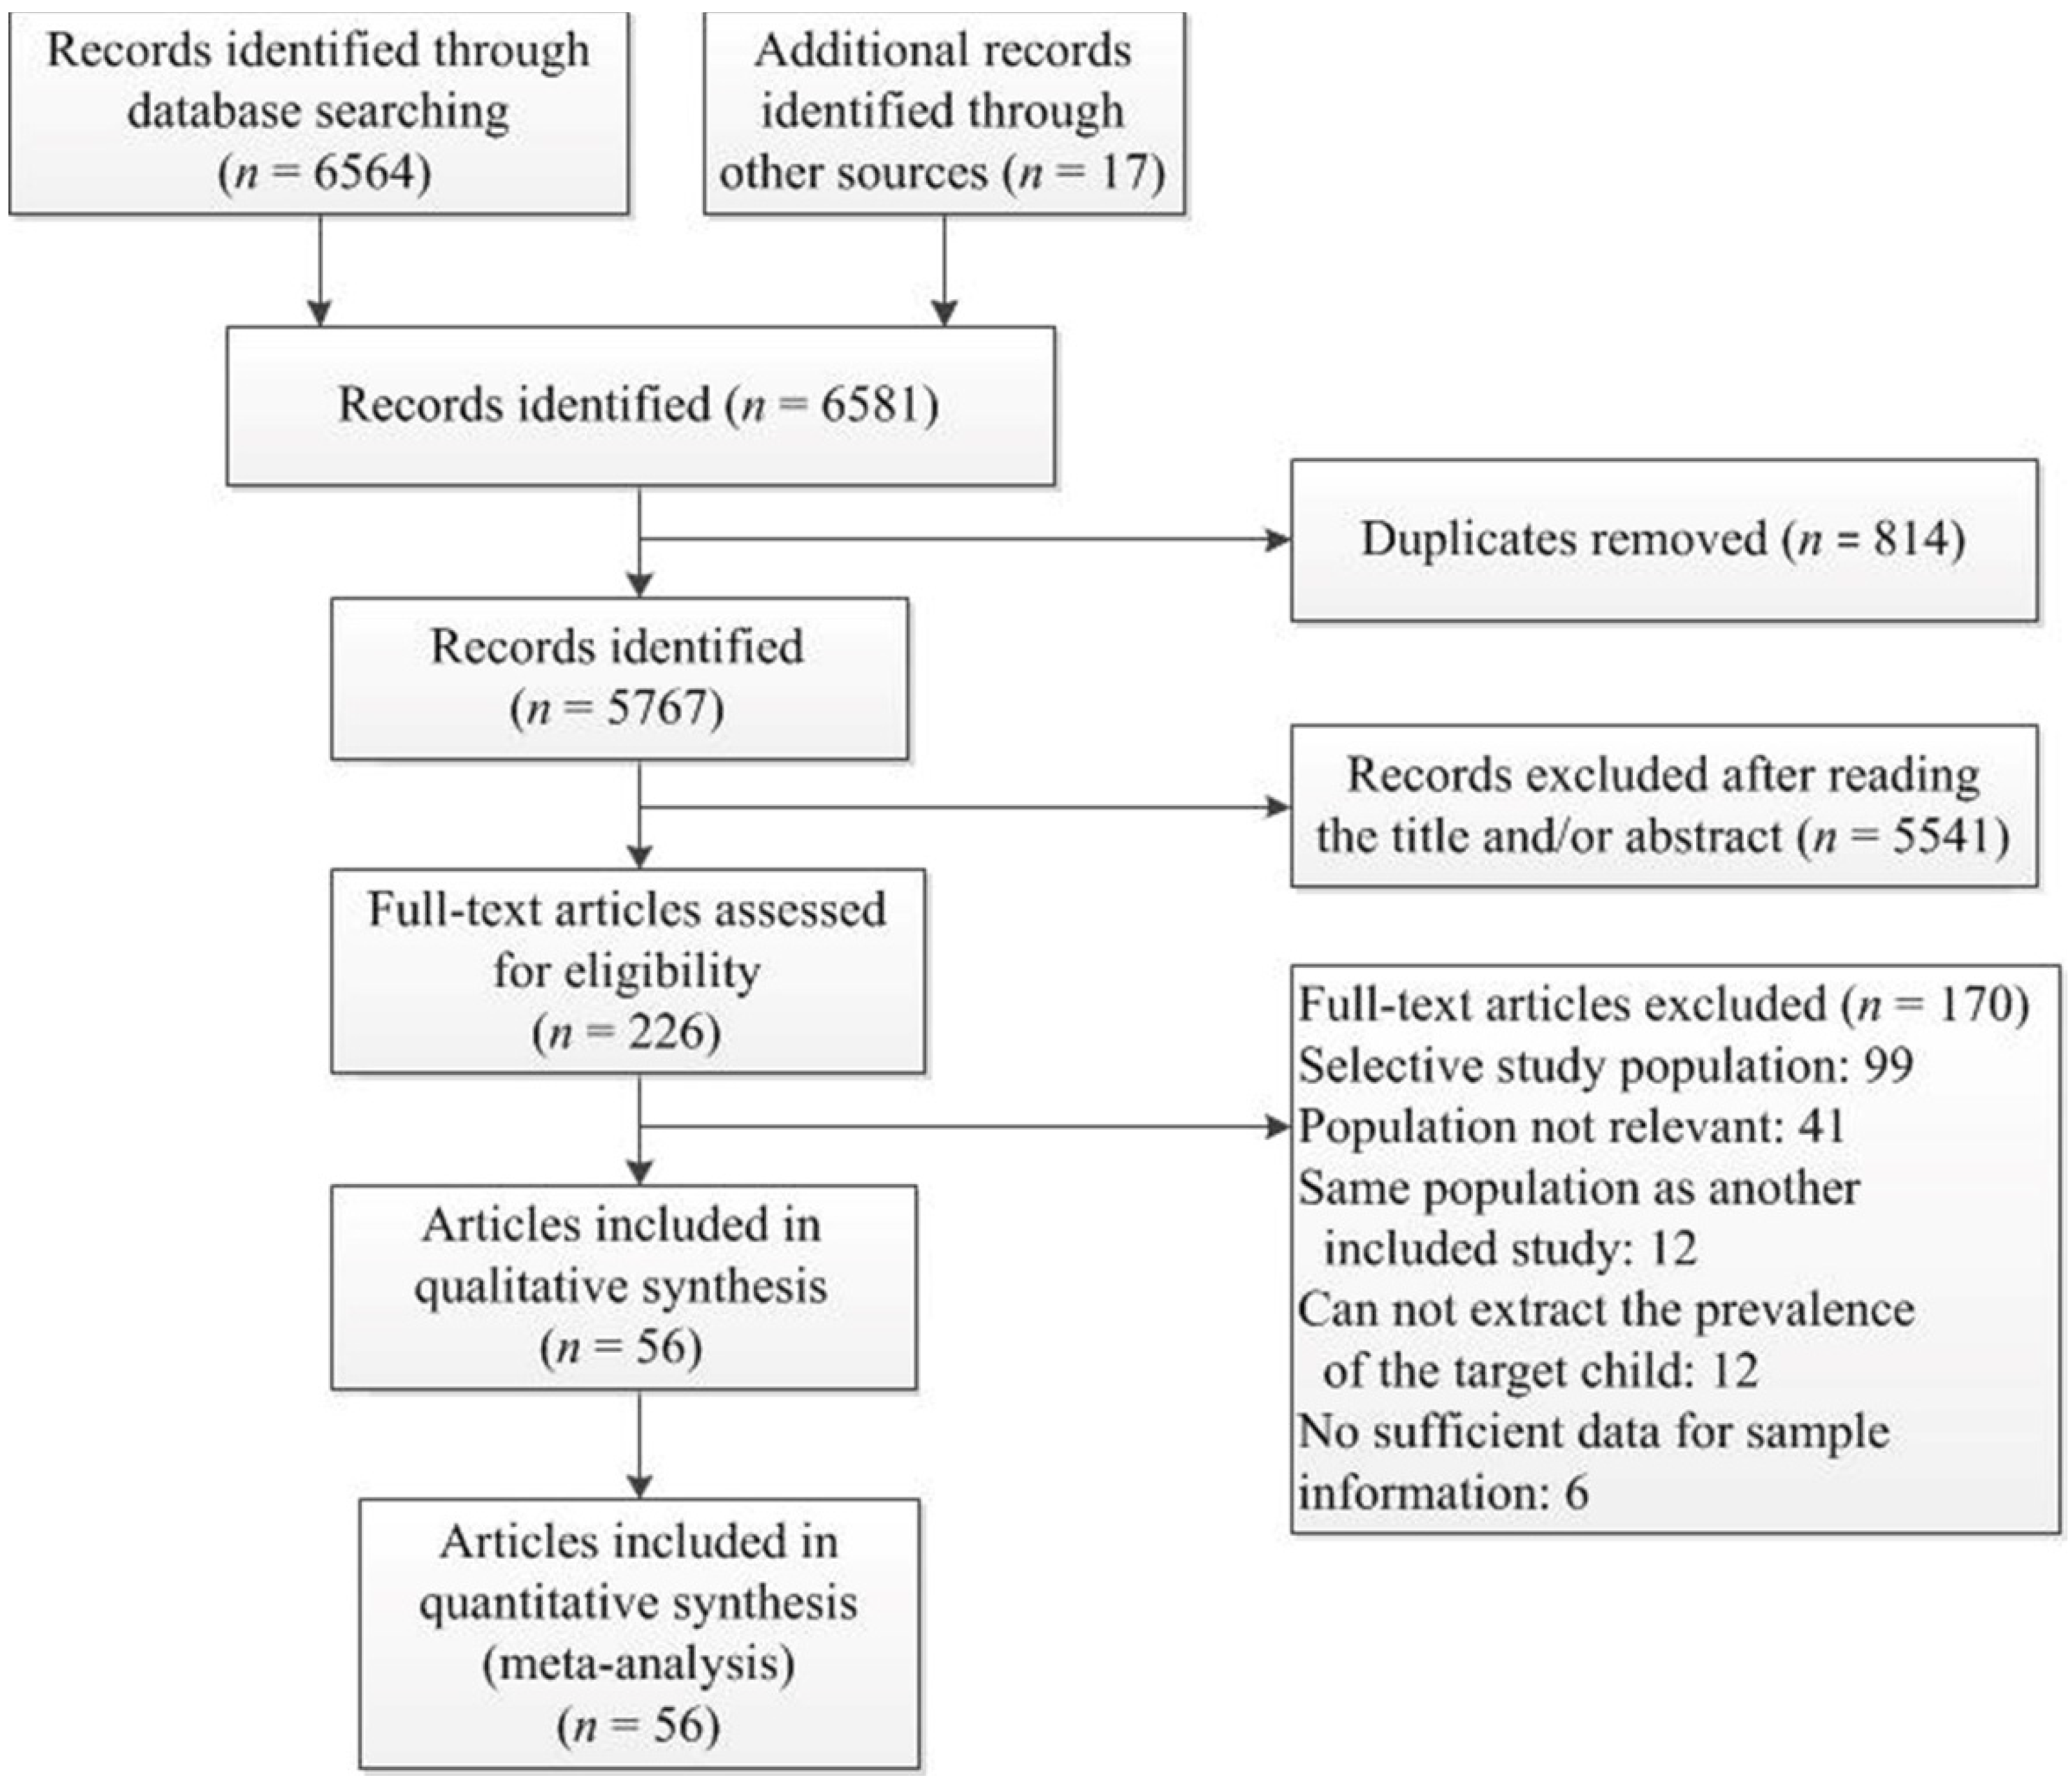
3.1. Study Selection and Characteristics
3.2. Pooled Prevalence of DD
3.3. Sensitivity Analysis and Publication Bias
3.4. Subgroup Meta-Analysis and Meta-Regression of DD
4. Discussion
5. Conclusions
Author Contributions
Funding
Institutional Review Board Statement
Informed Consent Statement
Data Availability Statement
Conflicts of Interest
Appendix A

| Database | Search Strategy |
|---|---|
| China National Knowledge Infrastructure | TI = ‘阅读障碍’ + ’发展性阅读障碍’ + ’特异性阅读障碍’ + ’词盲’ + ’阅读困难’ + ’学习障碍’ AND AB = ‘流行病学’ + ’患病率’ + ’检出率’ + ’发生率’ + ’发病率’ (TI = ‘Dyslexia’ + ‘reading disabilit*’ + ‘reading disorder*’ + ‘word blindness’ + ‘specific reading retardation’ + ‘backward reading’ + ‘reading difficult*’ + ‘learning disabilit*’ AND AB = ‘prevalence’ + ‘detectable rate’ + ‘incidence rate’ + ‘epidemiology’) |
| Wanfang | 题名:(“阅读障碍” or “发展性阅读障碍” or “特异性阅读障碍” or “词盲” or “阅读困难” or “学习障碍”) and 摘要:(“患病率” or “检出率” or “发病率” or “流行病学” or “发生率”) [title: (“Dyslexia” or “reading disabilit*” or “reading disorder*” or “word blindness” or “specific reading retardation” or “backward reading” or “reading difficult*” or “learning disabilit*”) and abstract: (“prevalence” or “detectable rate” or “incidence rate” or “epidemiology”)] |
| CQ-VIP | (R = 阅读障碍 + R = 发展性阅读障碍 + R = 特异性阅读障碍 + R = 词盲 + R = 阅读困难 + R = 学习障碍) AND (U = 患病率 + U = 检出率 + U = 发病率 + U = 流行病学 + U = 发生率) [(R = Dyslexia + R = reading disabilit* + R = reading disorder* + R = word blindness + R = specific reading retardation + R = backward reading + R = reading difficult* + R = learning disabilit*) AND (U = prevalence + U = detectable rate + U = incidence rate + U = epidemiology)] |
| China Hospital Knowledge Database | TI = ‘阅读障碍’ + ’发展性阅读障碍’ + ’特异性阅读障碍’ + ’词盲’ + ’阅读困难’ + ’学习障碍’ AND TI = ‘流行病学’ + ’患病率’ + ’检出率’ + ’发生率’ + ’发病率’ (TI = ‘Dyslexia’ + ‘reading disabilit*’ + ‘reading disorder*’ + ‘word blindness’ + ‘specific reading retardation’ + ‘backward reading’ + ‘reading difficult*’ + ‘learning disabilit*’ AND TI = ‘prevalence’ + ‘detectable rate’ + ‘incidence rate’ + ‘epidemiology’) |
| EBSCO Host | TI ((Dyslexia OR (reading disabilit*) OR (reading disorder*) OR (word blindness) OR (specific reading retardation) OR (backward reading) OR (reading difficult*) OR (learning disabilit*)) AND AB ((prevalence OR (detectable rate) OR (incidence rate) OR epidemiology)) |
| Proquest | ((dyslexia) [SU] OR (reading disabilit*) [SU] OR (reading disorder*) [SU] OR (word blindness) [SU] OR (specific reading retardation) [SU] OR (backward reading) [SU] OR (reading difficult*) [SU] OR (learning disabilit*) [SU]) AND ((prevalence) [FT°] OR (detectable rate) [FT°] OR (incidence rate) [FT°] OR (epidemiology) [FT°]) |
| PubMed | (“dyslexia” [Title] OR “reading disabilit*” [Title] OR “reading disorder*” [Title] OR “word blindness” [Title] OR “specific reading retardation” [Title] OR “backward reading” [Title] OR “reading difficult*” [Title] OR “learning disabilit*” [Title]) AND (“prevalence” [Title/Abstract] OR “detectable rate” [Title/Abstract] OR “incidence rate” [Title/Abstract] OR “epidemiology” [Title/Abstract]) |
| Web of Science | TI = (Dyslexia OR (reading disabilit*) OR (reading disorder*) OR (word blindness) OR (specific reading retardation) OR (backward reading) OR (reading difficult*) OR (learning disabilit*)) AND AB = (prevalence OR (detectable rate) OR (incidence rate) OR epidemiology) |
| OATD database | abstract:(dyslexia OR “reading disabilit*” OR “reading disorder*” OR “word blindness” OR “specific reading retardation” OR “backward reading” OR “reading difficult*” OR “learning disabilit*” OR “reading difficult*”) AND (prevalence OR “detectable rate” OR “incidence rate” OR epidemiology) |
| Cochrane | (‘dyslexia’ OR ‘reading disabilit*’ OR ‘reading disorder*’ OR ‘word blindness’ OR ‘specific reading retardation’ OR ‘backward reading’ OR ‘reading difficult*’ OR ‘learning disabilit*’) in Title Abstract Keyword AND (‘prevalence’ OR ‘detectable rate’ OR ‘incidence rate’ OR ‘epidemiology’) in Abstract |
| Springerlink | TI(“dyslexia” OR “reading disabilit*” OR “reading disorder*” OR “word blindness” OR “specific reading retardation” OR “backward reading” OR “reading difficult*” OR “learning disabilit*”) AND AB(“prevalence” OR “detectable rate” OR “incidence rate” OR “epidemiology”) |
| EMBASE | ((dyslexia OR ‘reading disabilit*’ OR ‘reading disorder*’ OR ‘word blindness’ OR ‘specific reading retardation’ OR ‘backward reading’ OR ‘reading difficult*’ OR ‘learning disabilit*’):ti) AND ((prevalence OR ‘detectable rate’ OR ‘incidence rate’ OR epidemiology):ab) |
| ID | Author | Year Published | Quality Score | |||||
|---|---|---|---|---|---|---|---|---|
| Sample Population | Sample Size | Participation | Outcome Assessment | Analytical Methods | Total Score | |||
| 1 | Bruininks et al., 1971 | 1971 | 2 | 1 | 2 | 2 | 2 | 9 |
| 2 | Berger et al., 1975 | 1975 | 2 | 1 | 2 | 2 | 2 | 9 |
| 3 | Nathlie A. Badian, 1984 | 1984 | 1 | 0 | 2 | 2 | 2 | 7 |
| 4 | Lindgren et al., 1985 | 1985 | 2 | 1 | 1 | 2 | 2 | 8 |
| 5 | Farrag et al., 1988 | 1988 | 2 | 1 | 2 | 2 | 2 | 9 |
| 6 | Tonnessen et al., 1993 | 1993 | 2 | 1 | 2 | 2 | 2 | 9 |
| 7 | Lewis et al., 1994 | 1994 | 2 | 1 | 2 | 2 | 2 | 9 |
| 8 | Prior et al., 1995 | 1995 | 2 | 1 | 2 | 2 | 2 | 9 |
| 9 | Zhang et al., 1996 | 1996 | 2 | 1 | 2 | 2 | 2 | 9 |
| 10 | Miles et al., 1998 | 1998 | 2 | 1 | 2 | 2 | 2 | 9 |
| 11 | Nathlie A. Badian, 1999 | 1999 | 1 | 1 | 2 | 2 | 2 | 8 |
| 12 | Lv et al., 2000 | 2000 | 1 | 0 | 2 | 1 | 2 | 6 |
| 13 | Flannery et al., 2000 | 2000 | 2 | 1 | 2 | 2 | 2 | 9 |
| 14 | Bhakta et al., 2002 | 2002 | 2 | 1 | 1 | 2 | 2 | 8 |
| 15 | Yao et al., 2003 | 2003 | 2 | 0 | 2 | 1 | 2 | 7 |
| 16 | Han Juan, 2005 | 2005 | 1 | 0 | 2 | 2 | 2 | 7 |
| 17 | Pan et al., 2006 | 2006 | 1 | 0 | 2 | 1 | 2 | 6 |
| 18 | Song Ranran, 2006 | 2006 | 2 | 0 | 2 | 1 | 2 | 7 |
| 19 | Yu Yizhen, 2006 | 2006 | 1 | 0 | 2 | 1 | 2 | 6 |
| 20 | Chan et al., 2007 | 2007 | 2 | 0 | 2 | 2 | 2 | 8 |
| 21 | Lu Shan, 2007 | 2007 | 2 | 0 | 2 | 1 | 2 | 7 |
| 22 | Fluss et al., 2008 | 2008 | 2 | 2 | 2 | 2 | 2 | 10 |
| 23 | Wang Zhong, 2008 | 2008 | 2 | 0 | 2 | 1 | 2 | 7 |
| 24 | Zou Yuliang, 2008 | 2008 | 2 | 0 | 2 | 1 | 2 | 7 |
| 25 | Shaheen, H.A., 2010 | 2010 | 1 | 0 | 2 | 2 | 1 | 6 |
| 26 | Zou et al., 2010 | 2010 | 1 | 0 | 2 | 1 | 2 | 6 |
| 27 | Daseking et al., 2011 | 2011 | 1 | 0 | 2 | 2 | 1 | 6 |
| 28 | Jiménez et al., 2011 | 2011 | 2 | 1 | 2 | 2 | 2 | 9 |
| 29 | Pouretemad et al., 2011 | 2011 | 2 | 0 | 2 | 2 | 2 | 8 |
| 30 | Vale et al., 2011 | 2011 | 2 | 1 | 2 | 2 | 2 | 9 |
| 31 | Zhu Dongmei, 2011 | 2011 | 2 | 0 | 2 | 2 | 2 | 8 |
| 32 | Mogasale et al., 2012 | 2011 | 2 | 1 | 2 | 2 | 2 | 9 |
| 33 | Luo Yan, 2012 | 2012 | 1 | 0 | 2 | 1 | 2 | 6 |
| 34 | Zhao Xiaochen, 2013 | 2013 | 1 | 0 | 2 | 2 | 2 | 7 |
| 35 | Zuo et al., 2013 | 2013 | 1 | 0 | 2 | 1 | 2 | 6 |
| 36 | Liu et al., 2014 | 2014 | 1 | 0 | 2 | 2 | 2 | 7 |
| 37 | Irene Jepkoech Cheruiyot, 2015 | 2015 | 1 | 1 | 2 | 2 | 2 | 8 |
| 38 | Liu et al., 2016 | 2016 | 1 | 0 | 2 | 1 | 2 | 6 |
| 39 | Padhy et al., 2016 | 2016 | 2 | 2 | 2 | 1 | 1 | 8 |
| 40 | Sheikh et al., 2016 | 2016 | 2 | 1 | 2 | 2 | 2 | 9 |
| 41 | Song Yi, 2016 | 2016 | 2 | 0 | 2 | 1 | 2 | 7 |
| 42 | Zhang et al., 2016 | 2016 | 2 | 0 | 2 | 1 | 2 | 7 |
| 43 | Zhao et al., 2016 | 2016 | 1 | 0 | 2 | 1 | 2 | 6 |
| 44 | Cuadro et al., 2017 | 2017 | 1 | 0 | 2 | 2 | 2 | 7 |
| 45 | Qian Lizhu, 2017 | 2017 | 1 | 0 | 2 | 1 | 2 | 6 |
| 46 | Wang Rui, 2017 | 2017 | 1 | 0 | 2 | 2 | 1 | 6 |
| 47 | Yan Nairui, 2018 | 2018 | 1 | 0 | 2 | 1 | 2 | 6 |
| 48 | Yoo et al., 2018 | 2018 | 1 | 0 | 2 | 2 | 2 | 7 |
| 49 | Zhou et al., 2018 | 2018 | 1 | 0 | 2 | 1 | 2 | 6 |
| 50 | Barbiero et al., 2019 | 2019 | 1 | 2 | 2 | 2 | 1 | 8 |
| 51 | Fan et al., 2019 | 2019 | 1 | 0 | 2 | 2 | 1 | 6 |
| 52 | Gu et al., 2019 | 2019 | 1 | 0 | 2 | 1 | 2 | 6 |
| 53 | Zhu et al., 2019 | 2019 | 1 | 0 | 2 | 1 | 2 | 6 |
| 54 | Cai et al., 2020 | 2020 | 1 | 2 | 2 | 2 | 2 | 9 |
| 55 | Su et al., 2020 | 2020 | 1 | 0 | 2 | 1 | 2 | 6 |
| 56 | Yilizhati Maimaiti et al. 2020 | 2020 | 1 | 0 | 2 | 2 | 2 | 7 |
| ID | Author (Year) | Country | Sampling Strategy | Writng System | Ozone (WHO) | Income (WB) | Diagnostic Materials | Diagnostic Criteria | Sample Size | Prevalence Number | Prevalence Rate |
|---|---|---|---|---|---|---|---|---|---|---|---|
| 1 | Bruininks et al., 1971 | USA | random sampling | alphabetic script | Americas | HIC | (1) The Lorge-Thorndike intelligence tests; (2) the reading comprehension and arithmetic computation subtest of the Iowa Tests of Basic Skills | (1) IQ ≥ 80; (2) one grade or more below the expected achievement in a reading test | Total = 2486 boys = 1233 girls = 1253 3rd = 1303 6th = 1183 | Total = 287 boys = 186 girls = 101 3rd = 202 6th = 85 | Total = 11.54% boys = 15.09% girls = 8.06% 3rd = 15.50% 6th = 7.19% |
| 2 | Berger et al., 1975 | Great Britain | random sampling | alphabetic script | Europe | HIC | (1) The NFER test NV5; (2) the Watts-Vernon test SRI; (3) the NFER test SRA; (4) the short form of the WISC; (5) the Neale Analysis of Reading Ability | (1) SRA ≤ 15 or SRI ≤ 10; (2) scores on either the accuracy or comprehension scales on the Neale Test fell 30 months or more below those predicted | Total = 2802 boys = 1428 girls = 1374 | Total = 209 boys = 156 girls = 53 | Total = 7.46% boys = 10.92% girls = 3.86% |
| 3 | Nathlie A. Badian, 1984 | USA | random sampling | alphabetic script | Americas | HIC | (1) The Stanford achievement test, SAT; (2) the Wechsler intelligence scale for children–revised, WISC-R | (1) Total reading score ≤ 20 percentile on SAT; (2) IQ ≥ 85 | Total = 550 boys = 284 girls = 266 | Total = 22 boys = 16 girls = 6 | Total = 4.00% boys = 5.63% girls = 2.26% |
| 4 | Lindgren et al., 1985 (study1) | USA | cluster sampling | alphabetic script | Americas | HIC | (1) The IEA reading test; (2) the short form of the Wechsler intelligence scale for children | Reading score < 85 and either VIQ or PIQ ≥ 90 | Total = 895 | Total = 106 | Total = 11.84% |
| 4 | Lindgren et al., 1985 (study2) | Italy | stratified sampling | alphabetic script | Europe | HIC | (1) The IEA reading test; (2) the short form of the Wechsler intelligence scale for children | Reading score < 85 and either VIQ or PIQ ≥ 90 | Total = 448 | Total = 38 | Total = 8.48% |
| 5 | Farrag et al., 1988 | Egypt | stratified sampling | alphabetic script | Eastern Mediterranean | MIC | (1) The modified Alaska letters identification test (ALIT); (2) the Assiut dyslexia screening test (ADST); (3) the Stanford–Binet IQ test | Reading scores of less than 142 and IQ levels of 90 or more. | Total = 2878 boys = 1610 girls = 1268 | Total = 84 boys = 57 girls = 27 | Total = 2.92% boys = 3.54% girls = 2.13% |
| 6 | Tønnessen et al., 1993 | Norway | cluster sampling | alphabetic script | Europe | HIC | (1) The silent word recognition test; (2) the phonological decoding test | Scored below 20% on two tests | Total = 734 boys = 394 girls = 340 | Total = 75 boys = 50 girls = 25 | Total = 10.22% boys = 12.69% girls = 7.35% |
| 7 | Lewis et al., 1994 | Great Britain | cluster sampling | alphabetic script | Europe | HIC | (1) Young’s (1970) group mathematics test (GMT); (2) Young’s (1976) SPAR (spelling and reading) test; (3) Raven’s colored progressive matrices (CPM) | Scored above 90 on arithmetic and nonverbal intelligence tests, but scored below 85 on reading, have no sensory or perceptual handicap, no psychiatric disturbance history, and English is the first language | Total = 1056 boys = 559 girls = 497 | Total = 42 boys = 32 girls = 10 | Total = 3.98% boys = 5.72% girls = 2.01% |
| 8 | Prior et al., 1995 | Australia | random sampling | alphabetic script | Western Pacific | HIC | (1) ACER word knowledge test; (2) Rurrer child behavior scales A and B | Scored more than 1 SD below the grade-2 mean on the reading test | Total = 1219 | Total = 195 | Total = 16.00% |
| 9 | Zhang et al., 1996 | China | stratified sampling | logographic script | Western Pacific | MIC | (1) A self-compiled reading achievement inventory; (2) combined Raven’s test (city edition) | Children’s reading achievement was more than 2SD below the average for their grade | Total = 967 | Total = 44 | Total = 4.55% |
| 10 | Miles et al., 1998 | Great Britain | cluster sampling | alphabetic script | Europe | HIC | (1) The shortened Edinburgh reading test; (2) the Bangor dyslexia test (left–right, months forward, and months reversed); (3) the recall of digits subtest from the British ability scales (BAS) | (1) On the word recognition test, outliers beyond 1.5 standard deviations from the mean were excluded; (2) those children whose residuals were ≥ 1.0 SD were described as “underachievers” | Total = 11,804 boys = 5995 girls = 5809 | Total = 269 boys = 223 girls = 46 | Total = 2.28% boys = 3.72% girls = 0.79% |
| 11 | Nathlie A. Badian, 1999 | USA | cluster sampling | alphabetic script | Americas | HIC | (1) The Wechsler preschool and primary scale of intelligence (WPPSI); (2) the Stanford achievement test (SAT); (3) the Wechsler intelligence scale for children–revised (WISC-R) | (1) A reading comprehension score of less than the 25th percentile (< 90) on the SAT; (2) scores were 1.5 SDs or more below the expected level, based on listening comprehension | Total = 5617 1st = 903 2nd = 919 3rd = 988 4th = 896 5th = 908 6th = 1003 | Total = 162 1st = 28 2nd = 27 3rd = 28 4th = 33 5th = 32 6th = 14 | Total = 2.88% 1st = 3.10% 2nd = 2.94% 3rd = 2.83% 4th = 3.68% 5th = 3.52% 6th = 1.40% |
| 12 | Flannery et al., 2000 | USA | random sampling | alphabetic script | Americas | HIC | (1) The Weschler intelligence scale for children (WISC); (2) the wide range achievement test (WRAT); (3) the NCPP behavioral checklist | (1) IQ ≥ 80 on WISC; (2) reading scores < 1.5 SD on WRAT; (3) in the first or second grade at the time of testing; (4) English was the primary language; (5) score was normal on the NCPP behavioral checklist | Total = 32,223 boys = 16,080 girls = 16,143 | Total = 1410 boys = 947 girls = 463 | Total = 4.38% boys = 5.89% girls = 2.87% |
| 13 | Lv et al., 2000 | China | random sampling | logographic script | Western Pacific | MIC | (1) A self-compiled children’s family environment questionnaire; (2) the Wechsler intelligence scale for children (WISC) | (1) IQ > 70; (2) 1 SD below the average score of their peers in one or more subjects; (3) equal learning opportunities with other children; (4) no nervous system diseases, visual, auditory, or motor disorders | Total = 688 boys = 357 girls = 331 | Total = 65 boys = 44 girls = 21 | Total = 9.45% boys = 12.32% girls = 6.34% |
| 14 | Bhakta et al., 2002 | India | stratified random sampling | alphabetic script | South-East Asia | MIC | (1) The Malayalam translation of the Rutter A2 parent-completed scale; (2) the Malayalam graded reading test (MGRT); (3) the Malayalam vocabulary test (MVT); (4) Raven’s colored progressive matrices, (CPM); (5) the short-form Oseretsky test of motor proficiency; 6) the Rutter B2 teacher-completed scale (Malayalam version) | A GMRT score of less than 20 | Total = 119 boys = 604 girls = 566 | Total = 98 boys = 71 girls = 27 | Total = 8.22% boys = 11.75% girls = 4.77% |
| 15 | Yao et al., 2003 | China | random sampling | logographic script | Western Pacific | MIC | (1) The pupil rating scale–revised screening for learning disabilities (PRS); (2) Conners parent symptom questionnaire (PSQ); (3) the YG personality scale; (4) a self-compiled questionnaire on the general conditions of parents and children | (1) A score of PRS < 60 (2) IQ > 80; (3) No history of congenital diseases and traumatic brain injury. | Total = 1151 boys = 605 girls = 546 | Total = 118 boys = 79 girls = 39 | Total = 10.25% boys = 13.06% girls = 7.14% |
| 16 | Han Juan, 2005 | China | random sampling | logographic script | Western Pacific | MIC | (1) The pupil rating scale–revised screening for learning disabilities (PRS); (2) general situation questionnaire; (3) Conners parent symptom questionnaire (PSQ); (4) revised children’s self-concept scale (PHCSS); (5) Wechsler intelligence scale for children–Chinese revision (WISC-CR); (6) Wechsler memory scale (WMS); (7) digital cancellation, digital connection test A and word fluency test; (8) children’s sensory integration development rating scale | (1) A score of PRS ≤ 60; (2) the average score of the main course (Chinese, mathematics) was below the 10 percentile of the class, with LD lasting more than one year, and it was considered difficult to complete the class and homework independently; (3) the reading test score was less than 1 SD of the mean of group test scores; (4) IQ ≥ 85; (5) no motivational problems, attention deficit hyperactivity disorder, emotional disorders and other psychological problems, no organic encephalopathy | Total = 800 | Total = 65 | Total = 8.13% |
| 17 | Pan et al., 2006 | China | random sampling | logographic script | Western Pacific | MIC | (1) IQ self-test; (2) learning disability behavior scale; (3) the learning motivation diagnostic test (MAAT); (4) the enhanced learning factor diagnostic test (FAT) | (1) The IQ score was between 85 and 140; (2) there were one or more cases of I value ≥ 24, II value ≥ 18, III value ≥ 21, IV value ≥ 9, V value ≥ 18, VI value ≥ 12, VII value ≥ 12 in the LD behavior scale | Total = 332 boys = 169 girls = 161 3rd = 164 5th = 168 | Total = 50 boys = 28 girls = 22 3rd = 27 5th = 23 | Total = 15.06% boys = 16.57% girls = 13.66% 3rd = 16.46% 5th = 13.69% |
| 18 | Song Ranran, 2006 | China | random sampling | logographic script | Western Pacific | MIC | (1) A family situation questionnaire compiled by the Shanghai Mental Health Center; (2) the pupil rating scale–revised screening for learning disabilities (PRS); (3) the dyslexia checklist for Chinese (DCCC); (4) the Wechsler intelligence scale for children–Chinese revision (WISC-CR) | (1) A score of PRS ≤ 60; (2) academic performance was in the bottom 10%; (3) the DCCC score was less than 2 SD of students in the same grade; (4) an IQ > 80 and no visual, auditory impairment, no organic lesions | Total = 1096 boys = 589 girls = 507 3rd = 533 4th = 370 5th = 193 | Total = 69 boys = 49 girls = 20 3rd = 36 4th = 22 5th = 11 | Total = 6.30% boys = 8.32% girls = 3.94% 3rd = 6.75% 4th = 5.95% 5th = 5.70% |
| 19 | Yu Yizhen, 2006 | China | random sampling | logographic script | Western Pacific | MIC | (1) The pupil rating scale–revised screening for learning disabilities (PRS); (2) Chinese classification and diagnostic criteria of mental disorders (2nd edition) (CCMD-2-R); (3) the second revision of the Chinese combined Raven’s test (CRT-C2); (4) a general situation questionnaire | (1) A score of PRS ≤ 60; (2) meeting the standard of LD in CCMD-2-R; (3) the average score of the main course (Chinese, Mathematics) was below the 10 percentile of the class, and it was difficult to complete the class and homework independently; (4) IQ > 70; (5) no visual or hearing impairment, no hyperactivity and organic lesions | Total = 903 boys = 496 girls = 407 | Total = 90 boys = 58 girls = 32 | Total = 9.97% boys = 11.69% girls = 7.86% |
| 20 | Chan et al., 2007 | China | stratified random sampling | logographic script | Western Pacific | HIC | (1) The Hong Kong test of specific learning difficulties in reading and writing (HKT-SpLD); (2) the Hong Kong Wechsler intelligence scale for children (HK-WISC) | (1) Scoring 7 or less on the literacy test domain and on one or more of the cognitive test domains; (2) IQ ≥ 85 | Total = 690 boys = 350 girls = 340 | Total = 67 boys = 45 girls = 22 | Total = 9.71% boys = 12.86% girls = 6.47% |
| 21 | Lu Shan, 2007 | China | random sampling | logographic script | Western Pacific | MIC | (1) A general situation questionnaire; (2) the pupil rating scale–revised screening for learning disabilities (PRS); (3) the second revision of the Chinese combined Raven’s test (CRT-C2); (4) the dyslexia checklist for Chinese (DCCC) | (1) A score of PRS < 65; (2) the Chinese score lags behind the average score of the same class by more than 1 SD, with LD lasting more than one year, and it was difficult to complete the class and homework independently; (3) the reading test score was less than 2 SD of the mean of group test scores; (4) IQ > 70; (5) excluding other disabilities and environmental factors | Total = 820 boys = 427 girls = 393 3rd = 332 4th = 213 5th = 275 | Total = 55 boys = 43 girls = 12 3rd = 23 4th = 15 5th = 17 | Total = 6.70% boys = 10.07% girls = 3.05% 3rd = 6.93% 4th = 7.04% 5th = 6.18% |
| 22 | Fluss et al., 2008 | France | stratified sampling | alphabetic script | Europe | HIC | (1) Reading comprehension; (2) spelling skill; (3) mathematical knowledge | On reading/spelling/mathematics (FL, FO, FM, respectively), children’ scores were below 1 SD | Total = 1020 boys = 544 girls = 476 | Total = 130 | Total = 12.70% |
| 23 | Wang Zhong, 2008 | China | stratified sampling | logographic script | Western Pacific | MIC | (1) The pupil rating scale–revised screening for learning disabilities (PRS); (2) the combined Raven’s test (CRT) | According to ICD-10, the total score of PRS was less than 60, or the score of verbal type (factor A and B) was less than 20, or the score of non-verbal type (factor C, D and E) was less than 40 | Total = 3934 boys = 2321 girls = 1613 1st = 601 2nd = 617 3rd = 668 4th = 689 5th = 669 6th = 690 | Total = 407 boys = 326 girls = 81 1st = 87 2nd = 63 3rd = 69 4th = 71 5th = 60 6th = 57 | Total = 10.35% boys = 14.05% girls = 5.02% 1st = 14.48% 2nd = 10.21% 3rd = 10.33% 4th = 10.30% 5th = 8.97% 6th = 8.26% |
| 24 | Zou Yuliang, 2008 | China | random sampling | logographic script | Western Pacific | MIC | (1) The dyslexia checklist for Chinese (DCCC); (2) The second revision of the Chinese combined Raven’s test (CRT-C2); (3) a students’ family situation questionnaire compiled by the research group | (1) T scores of each factor or the whole score of DCCC scale were above 98 percentile points; (2) IQ > 80 | Total = 255 boys = 123 girls = 132 | Total = 25 boys = 19 girls = 6 | Total = 9.80% boys = 15.45% girls = 4.55% |
| 25 | Shaheen, H. A., 2010 | Egypt | random sampling | alphabetic script | Eastern Mediterranean | MIC | Arabic reading tests (ART) | (1) With no visual, hearing problems, motor impairment, mental retardation (IQ less than 90%) or major psychological disorder; (2) scored 40 or less in ART | Total = 206 boys = 117 girls = 89 | Total = 22 boys = 12 girls = 10 | Total = 10.68% boys = 10.26% girls = 11.24% |
| 26 | Zou et al., 2010 | China | random sampling | logographic script | Western Pacific | MIC | (1) A family reading environment and reading ability questionnaire; (2) the dyslexia checklist for Chinese (DCCC); (3) the pupil rating scale–revised screening for learning disabilities (PRS); (4) the second revision of the Chinese combined Raven’s test (CRT-C2) | (1) The total score of DCCC was more than 2 SD higher than the mean score; (2) a score of PRS < 65; (3) academic achievement was at the bottom 10% of the class; (4) IQ > 80; (5) no visual, auditory impairment, no organic lesions | Total = 587 boys = 305 girls = 282 | Total = 23 boys = 18 girls = 5 | Total = 3.92% boys = 5.90% girls = 1.77% |
| 27 | Daseking et al., 2011 | Germany | random sampling | alphabetic script | Europe | HIC | The social–paediatric screening of developmental status for school entry (SOPESS) | A PR of no more than 10 on the SOPESS | Total = 372 | Total = 11 | Total = 2.96% |
| 28 | Jiménez et al., 2011 (study 1) | Spain | random sampling | alphabetic script | Europe | HIC | (1) Culture-fair (or -free) intelligence tests; (2) reading comprehension test; (3) fluency task; (4) working memory test | (1) No absence of sensory, acquired neurological and other problems; (2) a percentile score below 25 on accuracy on pseudoword reading from the naming task, or a percentile above 75 on reading time on pseudoword or word reading from the naming task; (3) IQ > 75 | Total = 1048 boys = 630 girls = 418 | Total = 164 boys = 98 girls = 66 | Total = 15.65% boys = 15.56% girls = 15.79% |
| 28 | Jiménez et al., 2011 (study 2) | Guatemalan | random sampling | alphabetic script | Americas | MIC | (1) Culture-fair (or -free) intelligence tests; (2) reading comprehension test; (3) fluency task; (4) working memory test | (1) No absence of sensory, acquired neurological and other problems; (2) a percentile score below 25 on accuracy on pseudoword reading from the naming task, or a percentile above 75 on reading time on pseudoword or word reading from the naming task; (3) IQ > 75 | Total = 557 boys = 316 girls = 241 | Total = 110 boys = 65 girls = 45 | Total = 19.90% boys = 20.57% girls = 18.67% |
| 29 | Pouretemad et al., 2011 | Iran | random sampling | alphabetic script | Eastern Mediterranean | MIC | (1) An analysis of Persian reading ability (APRA); (2) Wechsler intelligence scale for children–third edition (WISC-III) | (1) IQ ≥ 85; (2) reading scores in three trimesters of one academic year were more than 1.5 SD below that expected from their math scores; (3) no history of brain damage, hearing or visual problems | Total = 1562 boys = 773 girls = 789 1st = 298 2nd = 271 3rd = 309 4th = 330 5th = 354 | Total = 82 boys = 59 girls = 23 1st = 11 2nd = 9 3rd = 22 4th = 20 5th = 20 | Total = 5.20% boys = 7.63% girls = 2.92% 1st = 3.69% 2nd = 3.32% 3rd = 7.12% 4th = 6.06% 5th = 5.65% |
| 30 | Vale et al., 2011 | Portugal | random sampling | alphabetic script | Europe | HIC | (1) The TIL-reading age test; (2) the PRP–word recognition test; (3) the MPC Raven; (4) the phonological awareness tests of the ALEPE battery | (1) Achieved a result equal to or less than the percentage 5 in the TIL; (2) a result below the PRP mastery criteria; (3) normal IQ; (4) the phonological awareness score was significantly lower than those presented by control groups | Total = 1360 2nd = 493 3rd = 445 4th = 422 | Total = 74 boys = 45 girls = 29 2nd = 38 3rd = 15 4th = 21 | Total = 5.44% 2nd = 7.70% 3rd = 3.37% 4th = 4.98% |
| 31 | Zhu Dongmei, 2011 | China | random sampling | logographic script | Western Pacific | MIC | (1) A general situation questionnaire; (2) the pupil rating scale–revised screening for learning disabilities (PRS); (3) the dyslexia checklist for Chinese (DCCC); (4) Chinese reading ability test; (5) the second revision of the Chinese combined Raven’s test (CRT-C2) | (1) A score of PRS < 65; (2) Chinese scores were in the bottom 10 of the class. According to the head teacher’s evaluation, they had learning difficulties lasting more than one year, and had difficulties in completing the classroom and homework independently; (3) IQ > 80; (4) the converted T-score of DCCC was lower than the mean plus 2 SD; (5) scores 2 SD below the standard score on Chinese reading ability test; 6) no other diseases and environmental factors | Total = 1048 boys = 513 girls = 535 3rd = 425 4th = 426 5th = 197 | Total = 74 Boy = 44 girls = 30 3rd = 37 4th = 20 5th = 17 | Total = 7.10% boys = 8.6% girls = 5.6% 3rd = 8.7% 4th = 4.7% 5th = 8.6% |
| 32 | Mogasale et al., 2012 | India | stratified random sampling | alphabetic script | South-East Asia | MIC | (1) Rutter‘s proforma A; (2) Seguin form board test; (3) the specific learning disabilities (SpLD) battery test | (1) Poor grades (C or C+) of academic record in two consecutive examinations; (2) no visual, hearing disorders or severe physical conditions; (3) IQ ≥ 90 | Total = 1079 | Total = 121 | Total = 11.21% |
| 33 | Luo Yan, 2012 | China | random sampling | logographic script | Western Pacific | MIC | (1) The dyslexia checklist for Chinese (DCCC); (2) The pupil rating scale–revised screening for learning disabilities (PRS); (3) the second revision of the Chinese combined Raven’s test (CRT-C2) | (1) The transformed T-scord of DCCC > 70; (2) a score of PRS < 65; (3) Chinese score ranked in the bottom 10 of the class, with LD lasting more than one year, and it was difficult to complete the class and homework independently; (4) IQ ≥ 80; (5) no visual, auditory impairment, no organic lesions | Total = 435 boys = 221 girls = 214 3rd = 136 4th = 159 5th = 140 | Total = 33 boys = 23 girls = 10 3rd = 12 4th = 10 5th = 11 | Total = 7.59% boys = 10.41% girls = 4.68% 3rd = 8.82% 4th = 6.29% 5th = 7.86% |
| 34 | Zhao Xiaochen, 2013 | China | random sampling | logographic script | Western Pacific | MIC | (1) The Hong Kong behavior checklist of specific learning difficulties in reading and writing for primary school students (second edition) (BCL-P(II)); (2) Conners’ teacher rating scale; (3) Raven’s test; (4) the Hong Kong-specific learning difficulties behavior checklist (HKSLDBC); (5) the Hong Kong test of specific learning difficulties in reading and writing (HKT-SpLD) | (1) The students in the bottom 25% of each grade were selected according to their most recent grade scores in Chinese and math; (2) the score on the BCL scale was greater than or equal to 18; (3) IQ ≥85; (4) subjects performed 1 SD lower than the average level of the same grade in one-minute word reading task, Chinese word reading task, literacy task, and fast naming task; (5) no brain injury, emotional or behavioral problems | Total = 1069 | Total = 49 | Total = 4.58% |
| 35 | Zuo et al., 2013 | China | random sampling | logographic script | Western Pacific | MIC | (1) The pupil rating scale–revised screening for learning disabilities (PRS); (2) the dyslexia checklist for Chinese, (DCCC); (3) the Wechsler intelligence scale for children–Chinese revision (WISC-CR) | (1) A score of PRS < 65; (2) the DCCC score was lower than the standard score by 2 SD; (3) IQ > 70; (4) no visual or auditory impairment, no organic lesions | Total = 1206 boys = 621 girls = 585 3rd = 401 4th = 398 5th = 409 | Total = 82 boys = 55 girls = 27 3rd = 27 4th = 26 5th = 31 | Total = 6.80% boys = 8.86% girls = 4.62% 3rd = 6.73% 4th = 6.53% 5th = 7.58% |
| 36 | Liu et al., 2014 | China | random sampling | logographic script | Western Pacific | MIC | (1) The one-minute Chinese word reading test; (2) Raven’s standard progressive matrices (SPM) | (1) The Chinese teachers in the bilingual classes of each grade selected the bottom 10 students in the class, based on the children’s Chinese test scores; (2) the 10 students tested the self-compiled “One-minute Chinese Word Reading Test”, and then selected children whose scores were lower than the percentile grade corresponding to 1.5 SD from the average score of the grade norm; (3) no obvious physiological injury, behavioral and emotional disorders; (4) Raven percentile level above 25% on SPM | Total = 1397 3rd = 458 4th = 418 5th = 521 | Total = 46 3rd = 15 4th = 11 5th = 20 | Total = 3.29% 3rd = 3.28% 4th = 2.63% 5th = 3.84% |
| 37 | Irene Jepkoech Cheruiyot, 2015 | The Republic of Kenya | random sampling | alphabetic script | Africa | MIC | (1) The Burt reading test (1974) revised; (2) the Pearson dyslexia screening test for juniors (DST-J); (3) a socio-demographic questionnaire | (1) Reading age was way below chronological age (by 9 months or more) on the Burt reading test (1974)–revised; (2) an at-risk quotient of 0.6 or greater on the DST-J | Total = 120 boys = 63 girls = 57 | Total = 9 boys = 6 girls = 3 | Total = 7.50% boys = 9.52% girls = 5.26% |
| 38 | Liu et al., 2016 | China | random sampling | logographic script | Western Pacific | MIC | (1) The dyslexia checklist for Chinese children (DCCC); (2) the pupil rating scale–revised screening for learning disabilities (PRS) | (1) The score of DCCC was 2 SD higher than the mean score of all the students in the same grade; (2) a score of PRS < 65; (3) the Chinese language exam was below the 10% of all children in the same grade; (4) no intellectual disability, brain injury, visual and auditory disorders, epilepsy, or other neurological disorders. | Total = 34,748 boys = 16,752 girls = 16,645 3rd = 7901 4th = 8387 5th = 8591 6th = 8669 | Total = 1200 boys = 893 girls = 301 3rd = 316 4th = 332 5th = 297 6th = 255 | Total = 3.45% boys = 5.06% girls = 1.78% 3rd = 3.85% 4th = 3.81% 5th = 3.34% 6th = 2.86% |
| 39 | Padhy et al., 2016 | India | stratified random sampling | alphabetic script | South-East Asia | MIC | (1) The specific learning disability screening questionnaire (SLD-SQ); (2) Brigance diagnostic inventory (BDI)—part of NIMHANS index of specific learning disabilities | (1) Being considered by the teacher to have some form of learning difficulty; (2) scored above 4 on the SLD-SQ | Total = 3600 | Total = 108 | Total = 3.08% |
| 40 | Sheikh et al., 2016 | Egypt | stratified random sampling | alphabetic script | Eastern Mediterranean | MIC | (1) The reading disability test (RDT); (2) the Wechsler intelligence scale for children (WISC); (3) the “kiddie“ schedule for affective disorders and schizophrenia, present and lifetime versions (k-SADSPL) | Students whose reading scores were below the cut-off score (57 for fifth grade, 49 for fourth grade) of RDT and IQ levels of 90 or more | Total = 567 boys = 305 girls = 262 | Total = 64 boys = 37 girls = 27 | Total = 11.30% boys = 12.13% girls = 10.31% |
| 41 | Song Yi, 2016 | China | random sampling | logographic script | Western Pacific | MIC | (1) The pupil rating scale–revised screening for learning disabilities (PRS); (2) the second revision of the Chinese combined Raven’s test (CRT-C2); (3) the dyslexia checklist for Chinese (DCCC) | (1) The Chinese score was ranked in the bottom 15% of the grade; (2) the language part of the PRS scale scored less than 20 points; (3) normal IQ; (4) the transformed T-score of DCCC > 70; (5) no visual, auditory and other sensory disorders, no nervous system diseases | Total = 395 boys = 200 girls = 195 | Total = 23 boys = 16 girls = 7 | Total = 5.80% boys = 8.00% girls = 3.59% |
| 42 | Zhang et al., 2016 | China | stratified sampling | logographic script | Western Pacific | MIC | (1) A family economic environment and reading ability questionnaire; (2) the dyslexia checklist for Uygur children (DCUC); (3) the Wechsler intelligence scale for children–Chinese revision (WISC-CR) | (1) The transformed T-scored of DCUC > 70; (2) IQ > 80; (3) no visual, auditory impairment, no organic lesions | Total = 3508 boys = 1837 girls = 1671 3rd = 1281 4th = 1210 5th = 1017 | Total = 207 boys = 144 girls = 63 3rd = 85 4th = 75 5th = 47 | Total = 5.90% boys = 7.84% girls = 3.78% 3rd = 6.63% 4th = 6.20% 5th = 4.62% |
| 43 | Zhao et al., 2016 | China | stratified sampling | logographic script | Western Pacific | MIC | (1) The pupil rating scale–revised screening for learning disabilities (PRS); (2) the dyslexia checklist for Chinese children (DCCC); (3) the dyslexia checklist for Uyghur children (DCUC); (4) the home literacy environment and reading ability survey scale (HLE-RA); (5) the China–Wechsler intelligence scale for children (C-WISC) | (1) A score of PRS < 65; (2) the score of DCCC was 2 SD higher than the mean scores of Han Chinese children; DCUC score was 2 SD higher than the mean scores of Uyghur children; (3) IQ > 80; (4) no visual and/or auditory disorders or psychiatric diseases | Total = 2348 boys = 1163 girls = 1185 3rd = 623 4th = 719 5th = 798 6th = 208 | Total = 129 boys = 86 girls = 43 3rd = 39 4th = 48 5th = 39 6th = 3 | Total = 5.49% boys = 7.39% girls = 3.63% 3rd = 6.26% 4th = 6.68% 5th = 4.89% 6th = 1.44% |
| 44 | Cuadro et al., 2017 | Spain | stratified sampling | alphabetic script | Europe | HIC | (1) Reading efficiency test; (2) orthographic level test | A cut-off point of 1.5 SD below the mean of each school year in the reading efficiency test | Total = 1408 boys = 718 girls = 690 2nd = 308 3rd = 305 4th = 273 5th = 271 6th = 251 | Total = 75 boys = 47 girls = 28 2nd = 10 3rd = 12 4th = 12 5th = 22 6th = 19 | Total = 5.32% boys = 6.55% girls = 4.06% 2nd = 3.20% 3rd = 3.90% 4th = 4.40% 5th = 8.10% 6th = 7.60% |
| 45 | Qian Lizhu, 2017 | China | random sampling | Chinese | Western Pacific | MIC | The dyslexia checklist for Chinese children (DCCC) | T score of any factor or full scale ≥ 70 | Total = 325 boys = 179 girls = 146 5th = 221 6th = 104 | Total = 38 boys = 29 girls = 9 5th = 26 6th = 12 | Total = 11.69% boys = 16.20% girls = 6.16% 5th = 11.76% 6th = 11.54% |
| 46 | Wang Rui, 2017 | China | random sampling | logographic script | Western Pacific | MIC | (1) Chinese character literacy test for primary school students; (2) the pupil rating scale–revised screening for learning disabilities (PRS); (3) Raven’s standard progressive matrices (SPM); (4) the grade of Chinese | (1) The literacy level was 1.5 SD below the grade average, according to the Chinese character literacy test for primary school students; (2) a score of PRS < 65; (3) normal IQ; (4) The students’ Chinese score was lower than the grade average level in the past half a year | Total = 847 | Total = 66 | Total = 7.79% |
| 47 | Yan Nairui, 2018 | China | random sampling | logographic script | Western Pacific | MIC | (1) A parental rearing style assessment scale (EMBU); (2) the family environment scale (EFS); (3) a self-compiled specific learning disability screening questionnaire; (4) a self-compiled children’s mental development assessment questionnaire; (5) a self-compiled questionnaire on the risk factors of pregnancy, lactation and early childhood | (1) The students in the bottom 25% of each grade were selected according to their most recent grade scores in Chinese and math; (2) a score of the specific learning disability screening questionnaire ≥ 34 | Total = 1179 boys = 642 girls = 537 1st = 382 3rd = 465 5th = 332 | Total = 139 boys = 92 girls = 47 1st = 46 3rd = 55 5th = 38 | Total = 11.79% boys = 14.33% girls = 8.75% 1st = 12.04% 5th = 11.45% 3rd = 11.83% |
| 48 | Yoo et al., 2018 | South Korea | random sampling | alphabetic script | Western Pacific | MIC | (1) The dyslexia screening checklist (DySC); (2) Korean–Wechsler intelligence scale for children—fourth edition (K-WISC-IV); (3) the comprehensive learning test–reading (CLT-R); (4) the comprehensive learning test–math (CLT-M); (5) the comprehensive attention test (CAT) | Being in the bottom 15% on DySC and CLT-R, and having no intelligence or attention problems | Total = 659 boys = 340 girls = 319 | Total = 37 boys = 22 girls = 15 | Total = 5.61% boys = 6.473% girls = 4.70% |
| 49 | Zhou et al., 2018 | China | random sampling | logographic script | Western Pacific | MIC | (1) The dyslexia checklist for Chinese (DCCC); (2) the second revision of the Chinese combined Raven’s test (CRT-C2); (3) the pupil rating scale–revised screening for learning disabilities (PRS) | (1) The transformed T-scored of DCCC > 70; (2) the Chinese score ranked in the bottom 10 of the class, with LD lasting more than one year, and it was difficult to complete the class and homework independently; (3) a score of PRS > 65; (4) IQ ≥ 80; (5) no visual, auditory and other sensory disorders, no nervous system diseases | Total = 369 boys = 188 girls = 181 | Total = 15 boys = 13 girls = 2 | Total = 4.07% boys = 6.9% girls = 1.1% |
| 50 | Barbiero et al., 2019 | Italy | random sampling | alphabetic script | Europe | HIC | (1) A questionnaire derived from the validated questionnaire “RSR-DSA”; (2) a 4th-grade dictation task; (3) the DDE-2 battery (battery for the assessment of developmental dyslexia and dysorthographia-2); (4) the Wechsler intelligence scale for children (WISC-III); (5) battery for the evaluation of developmental dyslexia and dysorthography-2 (DDE-2); (6) the MT battery (prove di lettura MT per la scuola elementare-2); (7) Raven’s progressive matrices (PM47); (8) a strengths and difficulties questionnaire (SDQ) | (1) The total score was > 85% or the score on two subgroups of questions specifically addressing dyslexia > 90%; (2) children scoring ≥ 90% in the dictation task; (3) children failed in at least one of four scores in DDE-2; (4) WISC-III weighted score > 7; (5) Z-score ≤ −1.8 (speed) or percentile ≤ 5 (accuracy) in the DDE-2 non-word test | Total = 9964 | Total = 350 | Total = 3.51% |
| 51 | Fan et al., 2019 | China | random sampling | Chinese | Western Pacific | MIC | Multiple achievement tests (MATs) | (1) The scores of the last three Chinese mid-term and final exams were lower than the grade average level and the math scores were normal; (2) the evaluation results of Chinese teachers on students’ Chinese reading performance; (3) no brain damage or intellectual, visual or hearing impairment; (4) students scored 1.5 SD below the norm on standardized reading tests | Total = 834 boys = 444 girls = 390 | Total = 62 4th = 35 5th = 27 | Total = 7.43% |
| 52 | Gu et al. 2019 | China | Stratified cluster sampling | Chinese | Western Pacific | MIC | (1) The dyslexia checklist for Chinese children (DCCC); (2) the pupil rating scale–revised screening for learning disabilities (PRS); | (1) No brain diseases such as visual and hearing impairment, brain trauma, epilepsy, etc.; (2) the Chinese score was in the last 10% of the class; (3) one subscale or total score in the DCCC was 2 SD higher than that of children of the same age; (4) the score of the PRS was < 65 | Total = 11,668 boys = 6289 girls = 5369 2nd = 2916 3rd = 2743 4th = 2254 5th = 2537 6th = 1218 | Total = 302 boys = 233 girls = 69 2nd = 79 3rd = 66 4th = 58 5th = 665 6th = 33 | Total = 2.59% boys = 3.7% girls = 1.29% 2nd = 2.71% 3rd = 2.41% 4th = 2.57% 5th = 2.60% 6th = 2.71% |
| 53 | Zhu et al., 2019 | China | Stratified cluster sampling | Chinese | Western Pacific | MIC | (1) The dyslexia checklist for Chinese children (DCCC); (2) the pupil rating scale–revised screening for learning disabilities (PRS); | (1) No brain diseases such as visual and hearing impairment, brain trauma, epilepsy, etc.; (2) the Chinese score was in the last 10% of the class; (3) one subscale or total score in the DCCC was 2 SD higher than that of children of the same age; (4) score of the PRS < 65 | Total= 3673 boys= 2118 girls= 1555 3rd= 838 4th= 924 5th = 946 6th = 965 | Total= 119 boys= 95 girls= 24 3rd= 13 4th= 29 5th = 36 6th = 41 | Total= 3.24% boys= 4.49% girls= 1.54% 3rd= 1.55% 4th= 3.14% 5th= 3.81% 6th= 4.25% |
| 54 | Cai et al., 2020 | China | Stratified cluster sampling | Chinese | Western Pacific | MIC | (1) The pupil rating scale–revised screening for learning disabilities (PRS); (2) the Chinese character recognition measure and assessment scale for primary school children; (3) a combined Raven’s test | (1) PRS score below 65; (2) at least 1 SD below the average level of actual grade in Chinese character recognition; (3) IQ > 80; (4) according to the head-teachers’ reports, there was no suspected brain damage, uncorrected sensory impairment, or other external factors | Total = 1661 boys = 882 girls = 779 2nd = 452 3rd = 407 4th = 432 5th = 370 | Total = 81 boys = 66 girls = 15 2nd = 28 3rd = 13 4th = 24 5th = 16 | Total = 4.88% boys = 7.48% girls = 1.93% 2nd = 6.19% 3rd = 3.19% 4th = 5.56% 5th = 4.32% |
| 55 | Su et al., 2020 | China | Random sampling | Chinese | Western Pacific | MIC | Raven’s standard progressive matrices (SPM) | (1) The Chinese score was at the bottom 10% of the class; (2) an IQ score of above 25 percent on the SPM test; (3) no hearing impairment, attention deficit, hyperactivity disorder, autism or mood disorders | Total = 624 3rd = 217 4th = 224 5th = 183 | Total = 62 3rd = 22 4th = 22 5th = 18 | Total= 9.94% 3rd = 10.14% 4th = 9.82% 5th = 9.84% |
| 56 | YILIZHATI et al., 2020 | China | Random sampling | Chinese | Western Pacific | MIC | (1) One-minute word reading test; (2) Raven’s intelligence test | (1) Students whose reading level was considered by the teacher to be at the bottom 25% of the class; (2) the score of “one-minute word reading test” was 1 SD lower than the grade average; (3) no obvious physical injury, behavioral and emotional disorders; (4) an IQ score of above 25 percent on the SPM test | Total = 1233 | Total = 119 | Total = 9.65% |


References
- American Psychiatric Association. Diagnostic and Statistical Manual of Mental Disorders, 5th ed.; American Psychiatric Publishing: Arlington, VA, USA, 2013. [Google Scholar]
- World Health Organization. International Statistical Classification of Diseases and Related Health Problems, 10th Revision; World Health Organization: Geneva, Switzerland, 2016. [Google Scholar]
- Lerner, J.W. Educational interventions in learning disabilities. J. Am. Acad. Child. Adolesc. Psychiatry 1989, 28, 326–331. [Google Scholar] [CrossRef] [PubMed]
- Volkmer, S.; Schulte-Körne, G. Cortical responses to tone and phoneme mismatch as a predictor of dyslexia? A systematic review. Schizophr. Res. 2018, 191, 148–160. [Google Scholar] [CrossRef] [PubMed]
- Huntington, D.D.; Bender, W.N. Adolescents with learning disabilities at risk? Emotional well-being, depression, suicide. J. Learn. Disabil. 1993, 26, 159–166. [Google Scholar] [CrossRef] [PubMed] [Green Version]
- Tsovili, T.D. The relationship between language teachers’ attitudes and the state-trait anxiety of adolescents with dyslexia. J. Res. Read. 2004, 27, 69–86. [Google Scholar] [CrossRef]
- Carroll, J.M.; Iles, J.E. An assessment of anxiety levels in dyslexic students in higher education. Br. J. Educ. Psychol. 2006, 76, 651–662. [Google Scholar] [CrossRef] [Green Version]
- Casey, R.; Levy, S.E.; Brown, K.; Brooks-Gunn, J. Impaired Emotional Health in Children with Mild Reading Disability. J. Dev. Behav. Pediatr. 1992, 13, 256–260. [Google Scholar] [CrossRef]
- Hutton, J.S.; Dewitt, T.; Hoffman, L.; Horowitz-Kraus, T.; Klass, P. Development of an Eco-Biodevelopmental Model of Emergent Literacy before Kindergarten: A Review. JAMA Pediatr. 2021, 175, 730. [Google Scholar] [CrossRef]
- Greenberg, D.; Ehri, L.C.; Perin, D. Are word-reading processes the same or different in adult literacy students and third-fifth graders matched for reading level? J. Educ. Psychol. 1997, 89, 262–275. [Google Scholar] [CrossRef]
- Liebig, J.; Friederici, A.D.; Neef, N.E.; Friederici, A.D.; Emmrich, F.; Brauer, J.; Wilcke, A.; Neef, N.E.; Boltze, J.; Skeide, M.; et al. Auditory brainstem measures and genotyping boost the prediction of literacy: A longitudinal study on early markers of dyslexia. Dev. Cogn. Neurosci.-Neth. 2020, 46, 100869. [Google Scholar] [CrossRef]
- Cheruiyot, I.J. The Prevalence of Dyslexia among Children Aged 7 to 9 in a Nairobi School. Master’s Thesis, University of Nairobi, Nairobi, Kenya, 2015. [Google Scholar]
- Vellutino, F.R.; Fletcher, J.M.; Snowling, M.J.; Scanlon, D.M. Specific reading disability (dyslexia): What have we learned in the past four decades? J. Child Psychol. Psychol. 2004, 45, 2–40. [Google Scholar] [CrossRef]
- Shaywitz, S.E. Dyslexia. N. Engl. J. Med. 1998, 338, 307–312. [Google Scholar] [CrossRef] [PubMed]
- Peterson, R.L.; Pennington, B.F. Developmental dyslexia. Lancet 2012, 379, 1997–2007. [Google Scholar] [CrossRef] [Green Version]
- Wagner, R.K.; Zirps, F.A.; Edwards, A.A.; Wood, S.G.; Beal, B. The Prevalence of Dyslexia: A New Approach to Its Estimation. J. Learn. Disabil. 2020, 53, 354–365. [Google Scholar] [CrossRef] [PubMed]
- Barbiero, C.; Montico, M.; Lonciari, I.; Monasta, L.; Penge, R.; Vio, C.; Tressoldi, P.E.; Carrozzi, M.; Petris, A.D.; Cagno, A.G.D.; et al. The lost children: The underdiagnosis of dyslexia in Italy. A cross-sectional national study. PLoS ONE 2019, 14, e210448. [Google Scholar] [CrossRef] [Green Version]
- El Sheikh, M.M.; El Missiry, M.A.; Hatata, H.A.; Sabry, W.M.; El Fiky, A.A.A.; Essawi, H.I. Frequency of occurrence of specific reading disorder and associated psychiatric comorbidity in a sample of Egyptian primary school students. Child Adolesc. Ment. Health 2016, 21, 209–216. [Google Scholar] [CrossRef] [PubMed]
- Miles, T.R.; Haslum, M.N.; Wheeler, T.J. Gender Ratio in Dyslexia. Ann. Dyslexia 1998, 48, 27–55. [Google Scholar] [CrossRef]
- Fluss, J.; Ziegler, J.; Ecalle, J.; Magnan, A.; Warszawski, J.; Ducot, B.; Richard, G.; Billard, C. Prevalence of reading disabilities in early elementary school: Impact of socioeconomic environment on reading development in 3 different educational zones. Arch. Pediatr. 2008, 15, 1049–1057. [Google Scholar] [CrossRef]
- Prior, M.; Sanson, A.; Smart, D.; Oberklaid, F. Reading disability in an Australian community sample. Aust. J. Psychol. 1995, 47, 32–37. [Google Scholar] [CrossRef]
- Jiménez, J.E.; de la Cadena, C.G.; Siegel, L.S.; O’Shanahan, I.; García, E.; Rodríguez, C. Gender ratio and cognitive profiles in dyslexia: A cross-national study. Read. Writ. 2011, 24, 729–747. [Google Scholar] [CrossRef]
- Kuo, L.; Anderson, R.C. Morphological Awareness and Learning to Read: A Cross-Language Perspective. Educ. Psychol. 2006, 41, 161–180. [Google Scholar] [CrossRef]
- Anderson, R.C.; Li, W.; Ku, Y.-M.; Shu, H.; Wu, N. Use of partial information in learning to read Chinese characters. J. Educ. Psychol. 2003, 95, 52–57. [Google Scholar] [CrossRef]
- Hu, W.; Lee, H.L.; Zhang, Q.; Liu, T.; Geng, L.B.; Seghier, M.L.; Shakeshaft, C.; Twomey, T.; Green, D.W.; Yang, Y.M.; et al. Developmental dyslexia in Chinese and English populations: Dissociating the effect of dyslexia from language differences. Brain 2010, 133, 1694–1706. [Google Scholar] [CrossRef] [PubMed] [Green Version]
- Caravolas, M. The Nature and Causes of Dyslexia in Different Languages. In The Science of Reading: A Handbook; Snowling, M.J., Hulme, C., Eds.; Blackwell Publishing Ltd.: Oxford, UK, 2005; pp. 336–355. [Google Scholar]
- Stevenson, H.W.; Stigler, J.W.; Lucker, G.W.; Lee, S.; Hsu, C.; Kitamura, S. Reading Disabilities: The Case of Chinese, Japanese, and English. Child. Dev. 1982, 53, 1164. [Google Scholar] [CrossRef]
- Katz, L.; Frost, R. Reading in different orthographies: The orthographic depth hypothesis. In Orthography, Phonology, Morphology, and Meaning; Frost, R., Katz, L., Eds.; Elsevier North Holland Press: Amsterdam, The Netherlands, 1992; pp. 67–84. [Google Scholar]
- Ziegler, J.C.; Goswami, U. Reading acquisition, developmental dyslexia, and skilled reading across languages: A psycholinguistic grain size theory. Psychol. Bull. 2005, 131, 3–29. [Google Scholar] [CrossRef] [PubMed] [Green Version]
- Seidenberg, M.S. Reading in different writing systems: One architecture, multiple solutions. In Dyslexia across Languages: Orthography and the Brain–Gene–Behavior Link; McCardle, P., Miller, B., Lee, J.R., Tzeng, O.J.L., Eds.; Paul H Brookes Publishing: Baltimore, MD, USA, 2011; pp. 146–168. [Google Scholar]
- Cuadro, A.; von Hagen, A.; Costa Ball, D. Procedural differences in the calculation of the prevalence of reading difficulties in Spanish-speaking school children/Diferencias procedimentales en el cálculo de la prevalencia del retraso lector en escolares hispanoparlantes. Estudios de Psicología 2017, 38, 169–197. [Google Scholar] [CrossRef]
- De Groot, B.J.; Van den Bos, K.P.; Van der Meulen, B.F.; Minnaert, A.E. Rapid Naming and Phonemic Awareness in Children With Reading Disabilities and/or Specific Language Impairment: Differentiating Processes? J. Speech Lang. Hear. Res. 2015, 58, 1538–1548. [Google Scholar] [CrossRef] [PubMed] [Green Version]
- Shaheen, H.A. Reversing Letters, Asymmetric Tonic Neck, Neck Retraction Reflexes and Apraxia are Predictive of Dyslexia. Egypt. J. Neurol. Psychiatry Neurosurg. 2010, 47, 453–459. [Google Scholar]
- Berger, M.; Yule, W.; Rutter, M. Attainment and adjustment in two geographical areas. II—The prevalence of specific reading retardation. Br. J. Psychiatry 1975, 126, 510–519. [Google Scholar] [CrossRef]
- Liu, L.F.; Wang, J.; Shao, S.S.; Luo, X.; Kong, R.; Zhang, X.H.; Song, R.R. Descriptive epidemiology of prenatal and perinatal risk factors in a Chinese population with reading disorder. Sci. Rep. 2016, 6, 36697. [Google Scholar] [CrossRef] [Green Version]
- Bhakta, P.; Hackett, R.J.; Hackett, L. The prevalence and associations of reading difficulties in a population of South Indian children. J. Res. Read. 2002, 25, 191–202. [Google Scholar] [CrossRef]
- Shaywitz, S.E.; Morris, R.; Shaywitz, B.A. The education of dyslexic children from childhood to young adulthood. Annu. Rev. Psychol. 2008, 59, 451–475. [Google Scholar] [CrossRef] [PubMed] [Green Version]
- Page, M.J.; McKenzie, J.E.; Bossuyt, P.M.; Boutron, I.; Hoffmann, T.C.; Mulrow, C.D.; Shamseer, L.; Tetzlaff, J.M.; Akl, E.A.; Brennan, S.E.; et al. The PRISMA 2020 statement: An updated guideline for reporting systematic reviews. BMJ 2021, 372, n71. [Google Scholar] [CrossRef] [PubMed]
- von Elm, E.; Altman, D.G.; Egger, M.; Pocock, S.J.; Gøtzsche, P.C.; Vandenbroucke, J.P. The Strengthening the Reporting of Observational Studies in Epidemiology (STROBE) Statement: Guidelines for Reporting Observational Studies. Ann. Intern. Med. 2007, 147, 573. [Google Scholar] [CrossRef] [PubMed] [Green Version]
- Barendregt, J.J.; Doi, S.A.; Lee, Y.Y.; Norman, R.E.; Vos, T. Meta-analysis of prevalence. J. Epidemiol. Commun. Health 2013, 67, 974–978. [Google Scholar] [CrossRef] [PubMed]
- Higgins, J.P.T. Measuring inconsistency in meta-analyses. BMJ 2003, 327, 557–560. [Google Scholar] [CrossRef] [Green Version]
- Higgins, J.P.T.; Thompson, S.G. Quantifying heterogeneity in a meta-analysis. Stat. Med. 2002, 21, 1539–1558. [Google Scholar] [CrossRef]
- Wallace, B.C.; Schmid, C.H.; Lau, J.; Trikalinos, T.A. Meta-Analyst: Software for meta-analysis of binary, continuous and diagnostic data. BMC Med. Res. Methodol. 2009, 9, 80. [Google Scholar] [CrossRef] [Green Version]
- Egger, M.; Smith, G.D.; Schneider, M.; Minder, C. Bias in meta-analysis detected by a simple, graphical test. BMJ 1997, 315, 629–634. [Google Scholar] [CrossRef] [Green Version]
- Begg, C.B.; Mazumdar, M. Operating Characteristics of a Rank Correlation Test for Publication Bias. Biometrics 1994, 50, 1088–1101. [Google Scholar] [CrossRef]
- Peters, J.L.; Sutton, A.J.; Jones, D.R.; Abrams, K.R.; Rushton, L. Comparison of Two Methods to Detect Publication Bias in Meta-analysis. JAMA 2006, 295, 676–680. [Google Scholar] [CrossRef] [Green Version]
- Viechtbauer, W. Conducting Meta-Analyses in R with the metafor Package. J. Stat. Softw. 2010, 36, 1–48. [Google Scholar] [CrossRef] [Green Version]
- Baranyi, G.; Scholl, C.; Fazel, S.; Patel, V.; Priebe, S.; Mundt, A.P. Severe mental illness and substance use disorders in prisoners in low-income and middle-income countries: A systematic review and meta-analysis of prevalence studies. Lancet Glob. Health 2019, 7, e461–e471. [Google Scholar] [CrossRef] [Green Version]
- Song, P.G.; Zhang, Y.; Yu, J.Y.; Zha, M.M.; Zhu, Y.J.; Rahimi, K.; Rudan, I. Global Prevalence of Hypertension in Children: A Systematic Review and Meta-analysis. JAMA Pediatr. 2019, 173, 1154–1163. [Google Scholar] [CrossRef] [PubMed]
- Shaywitz, S.E.; Escobar, M.D.; Shaywitz, B.A.; Fletcher, J.M.; Makuch, R. Evidence That Dyslexia May Represent the Lower Tail of a Normal Distribution of Reading Ability. N. Engl. J. Med. 1992, 326, 145–150. [Google Scholar] [CrossRef] [PubMed]
- Saviour, P.; Padakannaya, P.; Nishanimutt, S.; Ramachandra, N.B. Familial Patterns and Biological Markers of Dyslexia. Int. J. Hum. Genet. 2009, 9, 21–29. [Google Scholar] [CrossRef]
- Shaywitz, S.E.; Shaywitz, B.A.; Fletcher, J.M.; Escobar, M.D. Prevalence of reading disability in boys and girls. Results of the Connecticut Longitudinal Study. JAMA 1990, 264, 998–1002. [Google Scholar] [CrossRef]
- Rutter, M.; Caspi, A.; Fergusson, D.; Horwood, L.J.; Goodman, R.; Maughan, B.; Moffitt, T.E.; Meltzer, H.; Carroll, J. Sex Differences in Developmental Reading Disability. JAMA 2004, 291, 2007. [Google Scholar] [CrossRef]
- Zhang, B.P.; Zhao, H.; Chen, Y.; Zhou, X.; Zuo, P.X. Research on environmental influencing factors of Uygur children with developmental dyslexia. Chin. J. Sch. Health 2016, 37, 325–327. [Google Scholar]
- Qian, L.Z. The Research on the Relationship between the Self-Esteem of Dyslexic Children and Loneliness and Social Anxiety. Master’s Thesis, Northwest Normal University, Lanzhou, China, 2017. [Google Scholar]
- Christopher, M.E.; Hulslander, J.; Byrne, B.; Samuelsson, S.; Keenan, J.M.; Pennington, B.; DeFries, J.C.; Wadsworth, S.J.; Willcutt, E.; Olson, R.K. The genetic and environmental etiologies of individual differences in early reading growth in Australia, the United States, and Scandinavia. J. Exp. Child Psychol. 2013, 115, 453–467. [Google Scholar] [CrossRef] [Green Version]
- Logan, J.A.; Hart, S.A.; Cutting, L.; Deater-Deckard, K.; Schatschneider, C.; Petrill, S. Reading Development in Young Children: Genetic and Environmental Influences. Child Dev. 2013, 84, 2131–2144. [Google Scholar] [CrossRef] [Green Version]
- Nass, R. Sex Differences in Learning Abilities and Disabilities. Ann. Dyslexia 1993, 43, 61–77. [Google Scholar] [CrossRef]
- Liederman, J.; Kantrowitz, L.; Flannery, K. Male vulnerability to reading disability is not likely to be a myth: A call for new data. J. Learn. Disabil. 2005, 38, 109–129. [Google Scholar] [CrossRef] [PubMed]
- Tønnessen, F.E.; Løkken, A.; Høien, T.; Lundberg, I. Dyslexia, left-handedness, and immune disorders. Arch. Neurol. 1993, 50, 411. [Google Scholar] [CrossRef] [PubMed]
- Su, L.Y.; Yan, X.F.; Lu, H.D. A Comparative Study of the Component Model and the Discrepancy Model in the Diagnosis of Reading Dyslexia. J. Mod. Spec. Educ. 2020, 4, 72–77. [Google Scholar]
- Flannery, K.A.; Liederman, J.; DALY, L.; Schultz, J. Male prevalence for reading disability is found in a large sample of Black and White children free from ascertainment bias. J. Int. Neuropsych. Soc. 2000, 6, 433–442. [Google Scholar] [CrossRef]
- Gu, H.T.; Zhu, B.; Hou, F.; Xie, X.Y.; Xue, Q.; Li, X.; Song, R.R. Association of learning and living style with dyslexia in school-aged children. Chin. J. Sch. Health 2019, 40, 1137–1140. [Google Scholar]
- Mansukhani, K.; Barretto, M.; Donde, S.; Wandrekar, J.; Nigudkar, A.; Nair, R. Epidemiological survey of neurological diseases in a tribal population cluster in Gujarat. Ann. Indian Acad. Neurol. 2018, 21, 294–299. [Google Scholar]
- Eliasen, E.H.; Ferrer, M.; Gaini, S.; Louis, E.D.; Petersen, M.S. Prevalence of Essential Tremor in the Faroe Islands: A Population-Based Study. Neuroepidemiology 2019, 52, 227–236. [Google Scholar] [CrossRef]
- Zhao, H.; Zhang, B.P.; Chen, Y.; Zhou, X.; Zuo, P.X. Environmental Risk Factors in Han and Uyghur Children with Dyslexia: A Comparative Study. PLoS ONE 2016, 11, e159042. [Google Scholar] [CrossRef] [Green Version]
- Ollikainen, M.; Smith, K.R.; Joo, E.J.H.; Ng, H.K.; Andronikos, R.; Novakovic, B.; Aziz, N.K.A.; Carlin, J.B.; Morley, R.; Saffery, R.; et al. DNA methylation analysis of multiple tissues from newborn twins reveals both genetic and intrauterine components to variation in the human neonatal epigenome. Hum. Mol. Genet. 2010, 19, 4176–4188. [Google Scholar] [CrossRef] [Green Version]
- Pouretemad, H.R.; Khatibi, A.; Zarei, M.; Stein, J. Manifestations of developmental dyslexia in monolingual Persian speaking students. Arch. Iran. Med. 2011, 14, 259–265. [Google Scholar] [PubMed]
- Shao, S.S. Research on the Roles of Genes in the Neuronal Migration and Outgrowth Network for Chinese Developmental Dyslexia. Ph.D. Thesis, Huazhong University of Science and Technology, Wuhan, China, 2016. [Google Scholar]
- Zuo, P.X.; Gu, Q.; Li, Z.C.; Jiao, P.P.; Zhang, J. Influence factor analysis of Uighur children with dyslexia. Chin. J. Child Health Care 2013, 21, 1254–1255. [Google Scholar]
- Zhu, D.M. Executive Functions for Chinese Developmental Dyslexia Children. Ph.D. Thesis, Huazhong University of Science and Technology, Wuhan, China, 2011. [Google Scholar]
- Olkin, I.; Dahabreh, I.J.; Trikalinos, T.A. GOSH—A graphical display of study heterogeneity. Res. Synth. Methods 2012, 3, 214–223. [Google Scholar] [CrossRef] [PubMed]
- Peterson, R.L.; Pennington, B.F. Developmental dyslexia. Annu. Rev. Clin. Psychol. 2015, 11, 283–307. [Google Scholar] [CrossRef]
- MacDonald Wer, B.M. Comparison of Reading Development across Socioeconomic Status in the United States. Ph.D. Thesis, University of Denver, Denver, CO, USA, 2014. [Google Scholar]


| Variable | No. of Studies | Prevalence (95% CI) | I2, % | p-Value | |||
|---|---|---|---|---|---|---|---|
| Q Test | Egger Test | Begg Test | Subgroup Difference | ||||
| Global Analysis for DD | |||||||
| DD | 56 | 7.10 [6.27; 7.97] | 97.60 | <0.001 | <0.001 | 0.05 | NA |
| Gender | |||||||
| boy | 41 | 9.22 [8.07; 10.44] | 95.80 | <0.001 | <0.001 | 0.35 | <0.001 |
| girl | 41 | 4.66 [3.84; 5.54] | 95.20 | <0.001 | <0.001 | 0.17 | |
| Writing system | |||||||
| alphabetic scripts | 27 | 7.26 [5.94; 8.71] | 98.10 | <0.001 | <0.05 | 0.06 | 0.74 |
| logographic writing system | 31 | 6.97 [5.86; 8.16] | 96.90 | <0.001 | <0.001 | 0.27 | |
| Orthography depth | |||||||
| shallow orthography | 17 | 7.13 [5.23; 9.30] | 98.30 | <0.001 | <0.05 | 0.19 | 0.83 |
| deep orthography | 10 | 7.55 [4.66; 11.04] | 97.80 | <0.001 | <0.05 | 0.24 | |
| Operational definition | |||||||
| 1 SD | 11 | 7.10 [4.51; 10.22] | 98.40 | <0.001 | <0.01 | 0.14 | <0.01 |
| 1.5 SD | 6 | 5.36 [4.28; 6.55] | 87.70 | <0.001 | NA | NA | |
| 2 SD | 18 | 5.32 [4.56; 6.13] | 93.70 | <0.001 | <0.01 | 0.18 | |
| Without reporting SD | 23 | 9.10 [7.18; 11.21] | 97.20 | <0.001 | 0.03 | 0.58 | |
| Grade | |||||||
| 1 | 4 | 7.59 [2.65; 14.72] | 96.40 | <0.001 | NA | NA | 0.40 |
| 2 | 7 | 4.88 [2.94; 7.28] | 92.00 | <0.001 | NA | NA | |
| 3 | 21 | 6.35 [4.78; 8.13] | 95.20 | <0.001 | 0.06 | 0.15 | |
| 4 | 18 | 5.25 [4.31; 6.27] | 85.00 | <0.001 | 0.03 | 0.12 | |
| 5 | 20 | 7.44 [4.59; 10.90] | 98.20 | <0.001 | 0.47 | 0.01 | |
| 6 | 9 | 4.48 [2.96; 6.29] | 93.20 | <0.001 | NA | NA | |
| Sample size | <0.001 | ||||||
| <500 | 10 | 7.97 [5.75; 10.51] | 84.00 | <0.001 | 0.50 | 0.53 | |
| 500–1000 | 16 | 8.43 [6.83; 10.18] | 90.90 | <0.001 | 0.59 | 0.72 | |
| 1000–1500 | 16 | 8.25 [6.43; 10.27] | 95.80 | <0.001 | 0.15 | 0.22 | |
| 1500–3000 | 6 | 6.01 [3.84; 8.63] | 97.20 | <0.001 | NA | NA | |
| 3000–10,000 | 6 | 4.53 [2.81; 6.63] | 98.40 | <0.001 | NA | NA | |
| 10,000– | 4 | 3.13 [2.32; 4.06] | 98.10 | <0.001 | NA | NA | |
| Sampling method | |||||||
| cluster sampling | 5 | 5.55 [3.13; 8.60] | 98.10 | <0.001 | NA | NA | 0.25 |
| random sampling | 37 | 7.66 [6.60; 8.80] | 97.20 | <0.001 | <0.001 | 0.80 | |
| stratified sampling | 16 | 6.43 [4.84; 8.21] | 97.80 | <0.001 | <0.05 | 0.05 | |
| Sub-deficits | |||||||
| accuracy | 8 | 5.43 [3.91; 7.18] | 97.80 | <0.001 | NA | NA | 0.50 |
| accuracy or comprehension | 4 | 7.60 [5.46; 10.06] | 88.00 | <0.001 | NA | NA | |
| accuracy or fluency | 5 | 9.71 [4.29; 16.99] | 98.80 | <0.001 | NA | NA | |
| comprehension | 8 | 7.97 [4.60; 12.15] | 98.30 | <0.001 | NA | NA | |
| fluency | 6 | 6.64 [4.34; 9.37] | 92.40 | <0.001 | NA | NA | |
| Unclassified | 27 | 6.97 [5.77; 8.27] | 97.30 | <0.001 | <0.001 | 0.44 | |
| WHO region | |||||||
| Americas | 6 | 8.11 [4.97; 11.93] | 98.80 | <0.001 | NA | NA | 0.97 |
| Eastern Mediterranean | 4 | 6.88 [3.50; 11.27] | 95.90 | <0.001 | NA | NA | |
| Europe | 11 | 6.55 [4.49; 8.97] | 98.20 | <0.001 | <0.05 | 0.31 | |
| South-East Asia and Africa | 4 | 7.11 [3.04; 12.66] | 97.50 | <0.001 | NA | NA | |
| Western Pacific | 33 | 7.16 [6.01; 8.41] | 97.30 | <0.001 | <0.001 | 0.44 | |
| WB region | |||||||
| HIC | 18 | 7.09 [5.54; 8.82] | 98.40 | <0.001 | <0.01 | 0.43 | 0.97 |
| MIC | 40 | 7.11 [6.08; 8.20] | 97.00 | <0.001 | <0.001 | 0.07 | |
Publisher’s Note: MDPI stays neutral with regard to jurisdictional claims in published maps and institutional affiliations. |
© 2022 by the authors. Licensee MDPI, Basel, Switzerland. This article is an open access article distributed under the terms and conditions of the Creative Commons Attribution (CC BY) license (https://creativecommons.org/licenses/by/4.0/).
Share and Cite
Yang, L.; Li, C.; Li, X.; Zhai, M.; An, Q.; Zhang, Y.; Zhao, J.; Weng, X. Prevalence of Developmental Dyslexia in Primary School Children: A Systematic Review and Meta-Analysis. Brain Sci. 2022, 12, 240. https://doi.org/10.3390/brainsci12020240
Yang L, Li C, Li X, Zhai M, An Q, Zhang Y, Zhao J, Weng X. Prevalence of Developmental Dyslexia in Primary School Children: A Systematic Review and Meta-Analysis. Brain Sciences. 2022; 12(2):240. https://doi.org/10.3390/brainsci12020240
Chicago/Turabian StyleYang, Liping, Chunbo Li, Xiumei Li, Manman Zhai, Qingqing An, You Zhang, Jing Zhao, and Xuchu Weng. 2022. "Prevalence of Developmental Dyslexia in Primary School Children: A Systematic Review and Meta-Analysis" Brain Sciences 12, no. 2: 240. https://doi.org/10.3390/brainsci12020240
APA StyleYang, L., Li, C., Li, X., Zhai, M., An, Q., Zhang, Y., Zhao, J., & Weng, X. (2022). Prevalence of Developmental Dyslexia in Primary School Children: A Systematic Review and Meta-Analysis. Brain Sciences, 12(2), 240. https://doi.org/10.3390/brainsci12020240