
Positive and Negative Symptoms Are Associated with Distinct Effects on Predictive Saccades


Abstract
:1. Introduction
Relationship between Prediction Deficits and Schizophrenia Symptoms
2. Materials and Methods
2.1. Participant Selection
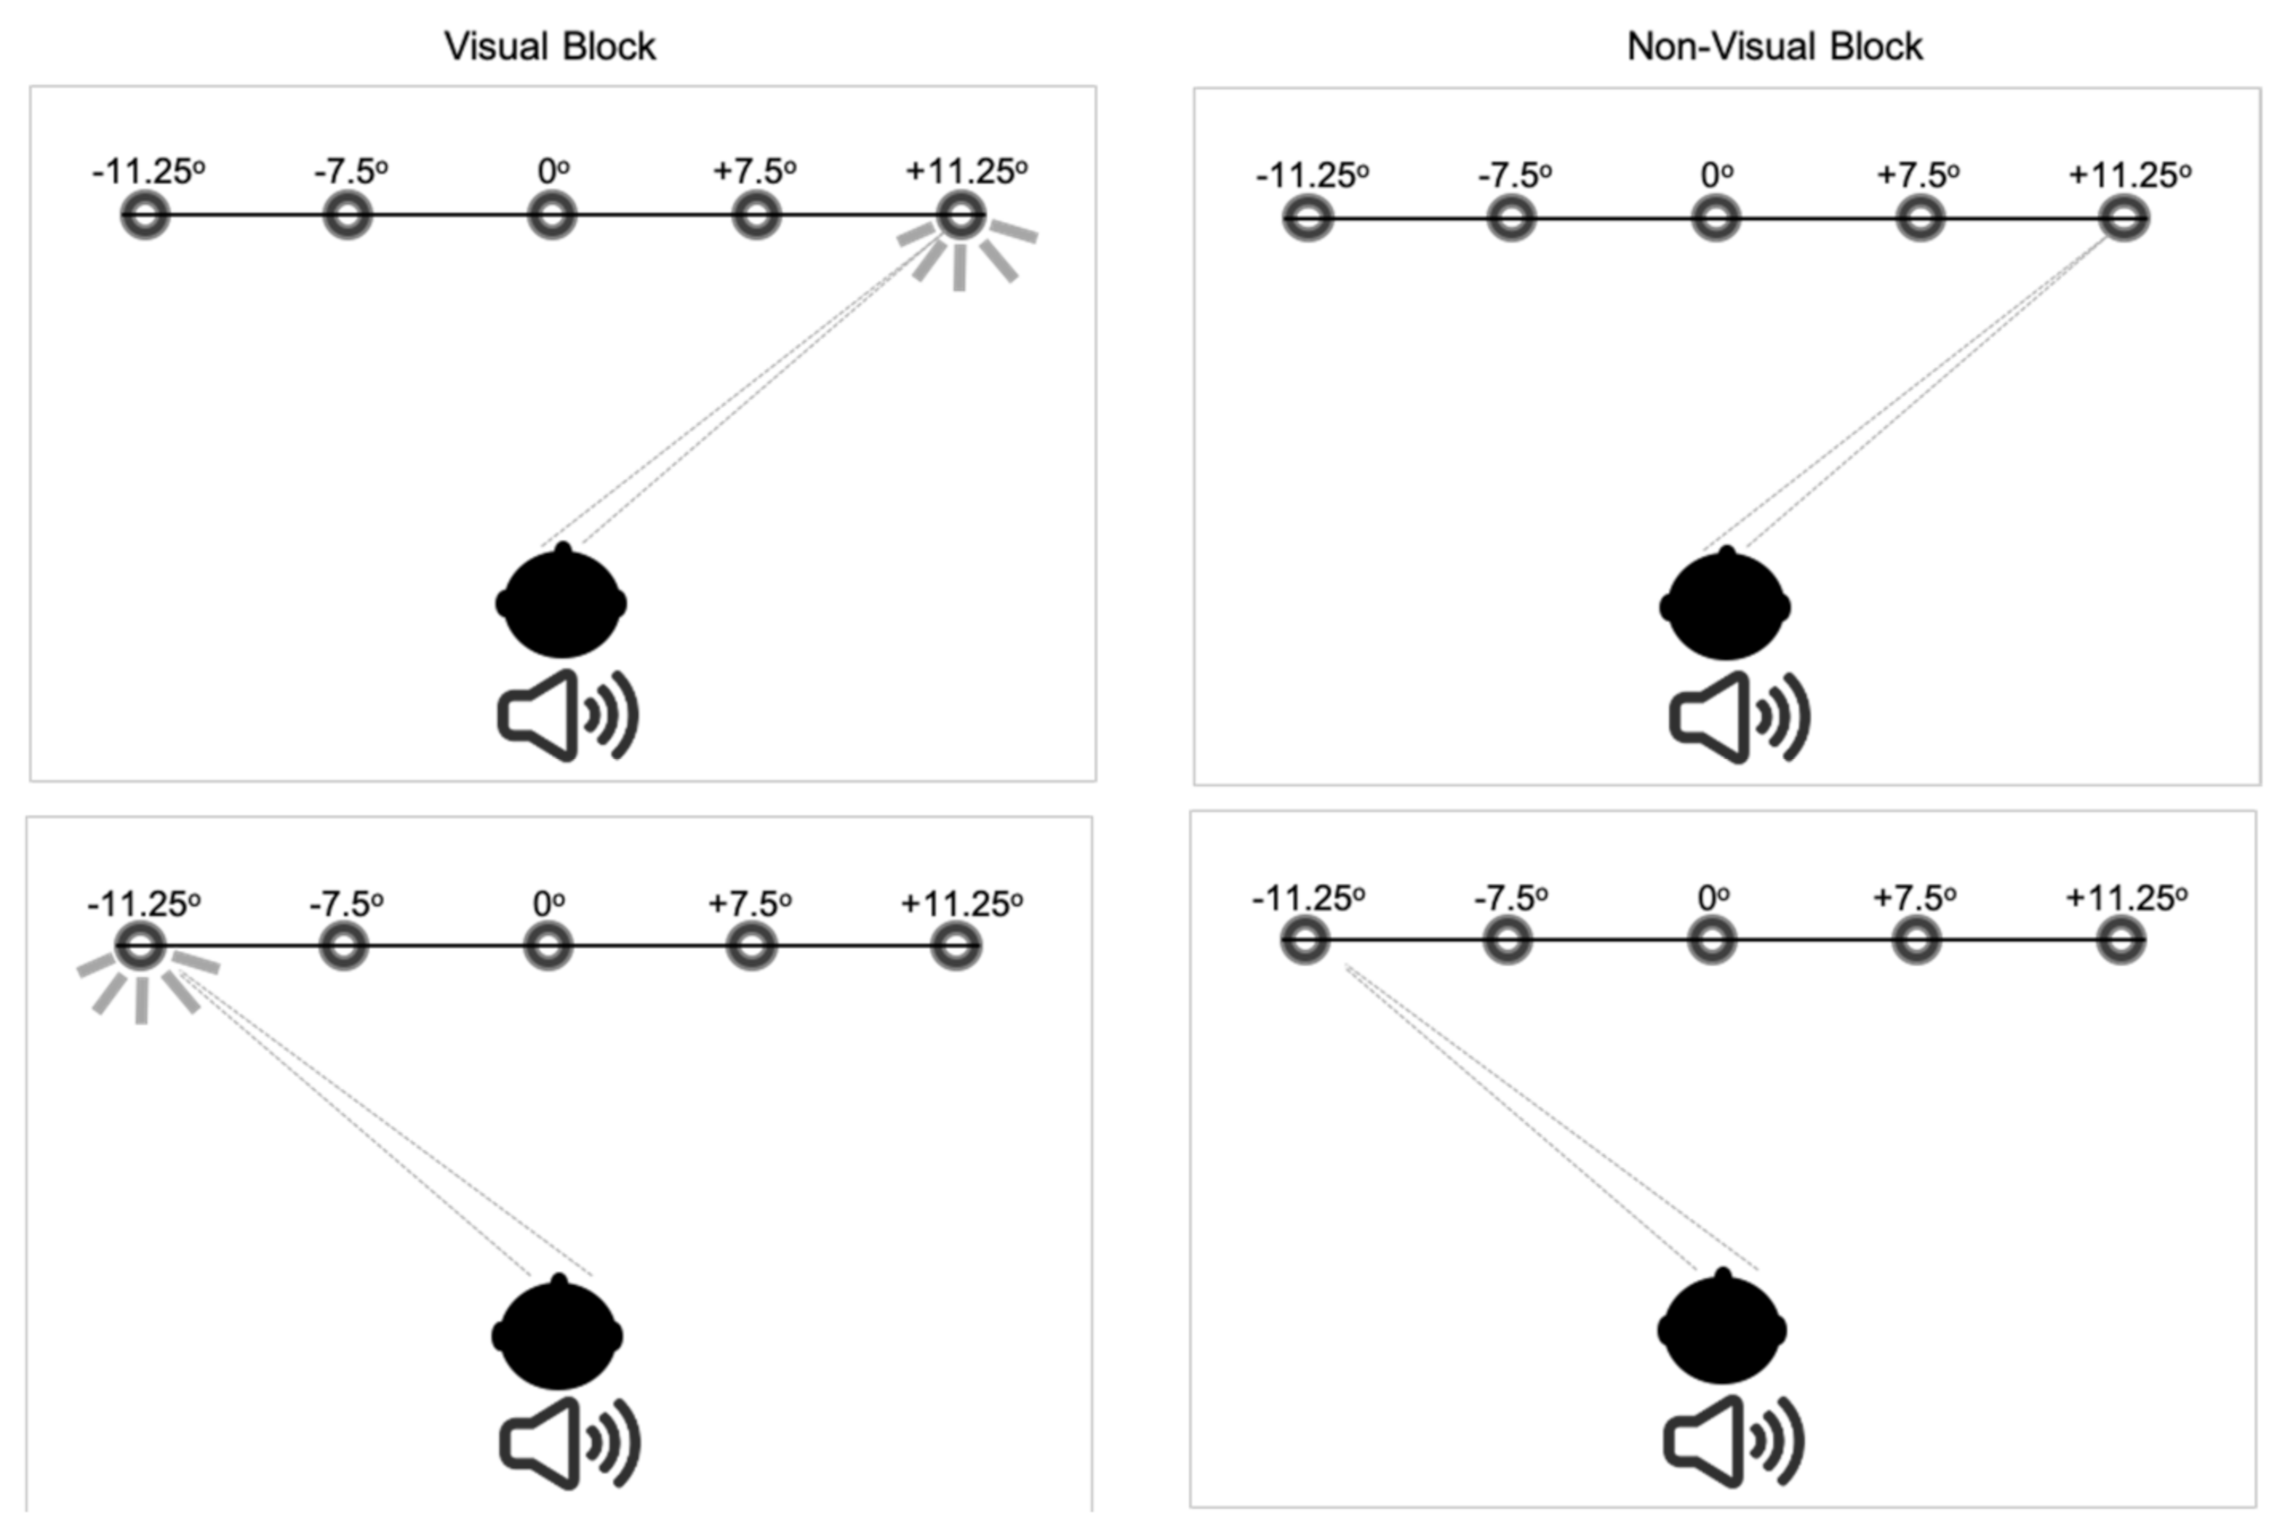
2.2. Measurement of Saccades
2.3. Data Processing and Statistical Analysis
3. Results
3.1. Symptom-Based Analysis
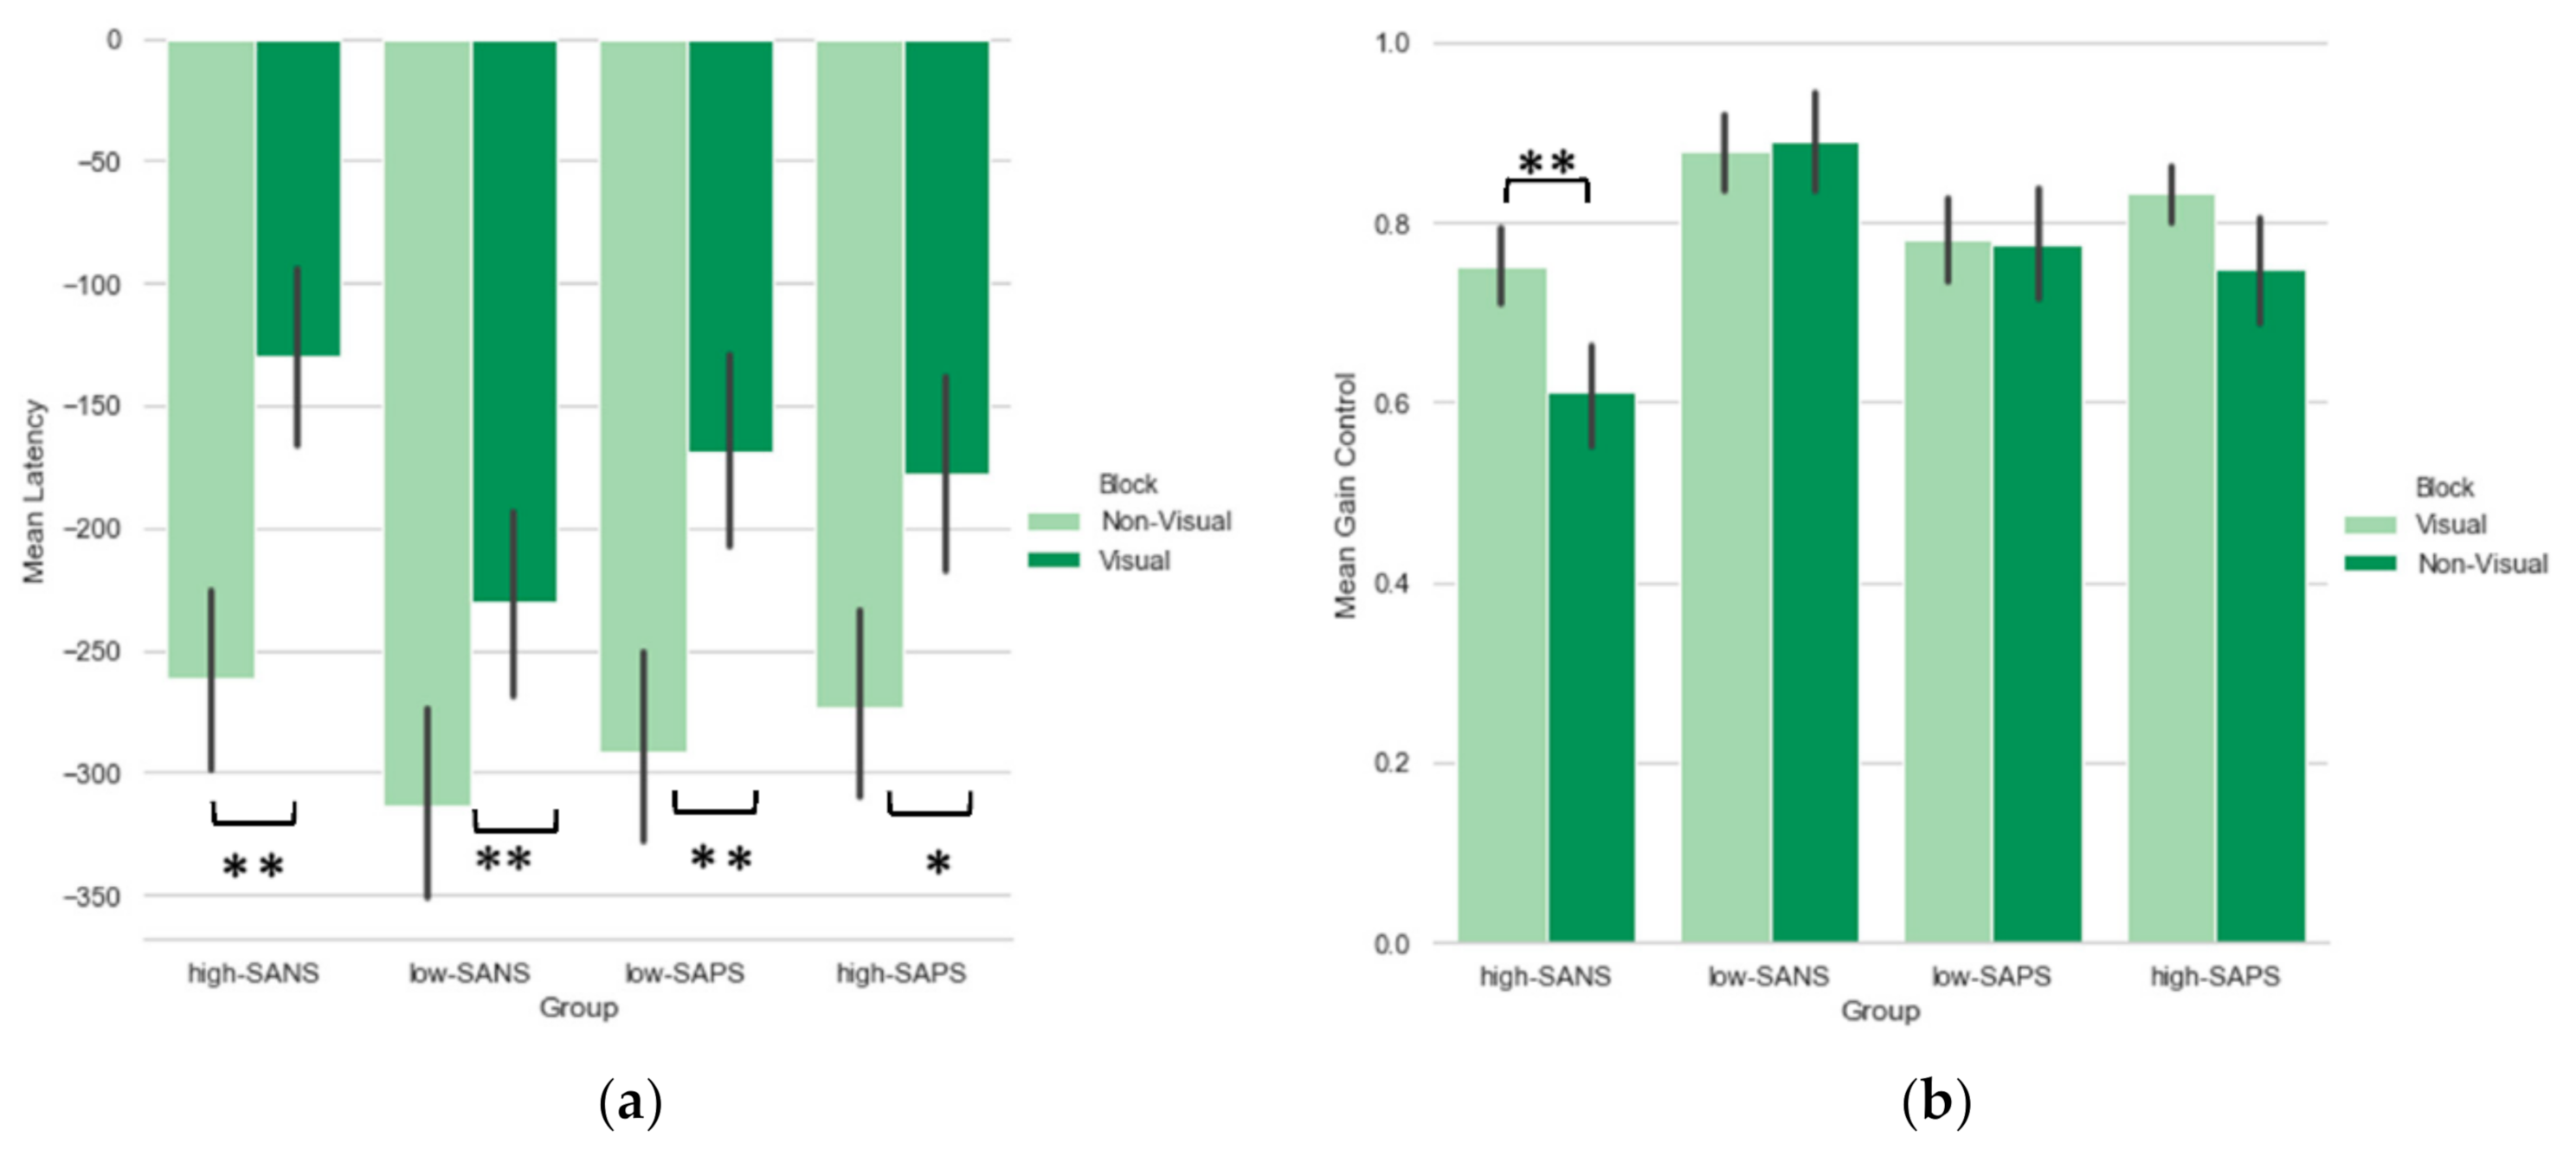
3.1.1. Saccade Latency
Symptom Analysis
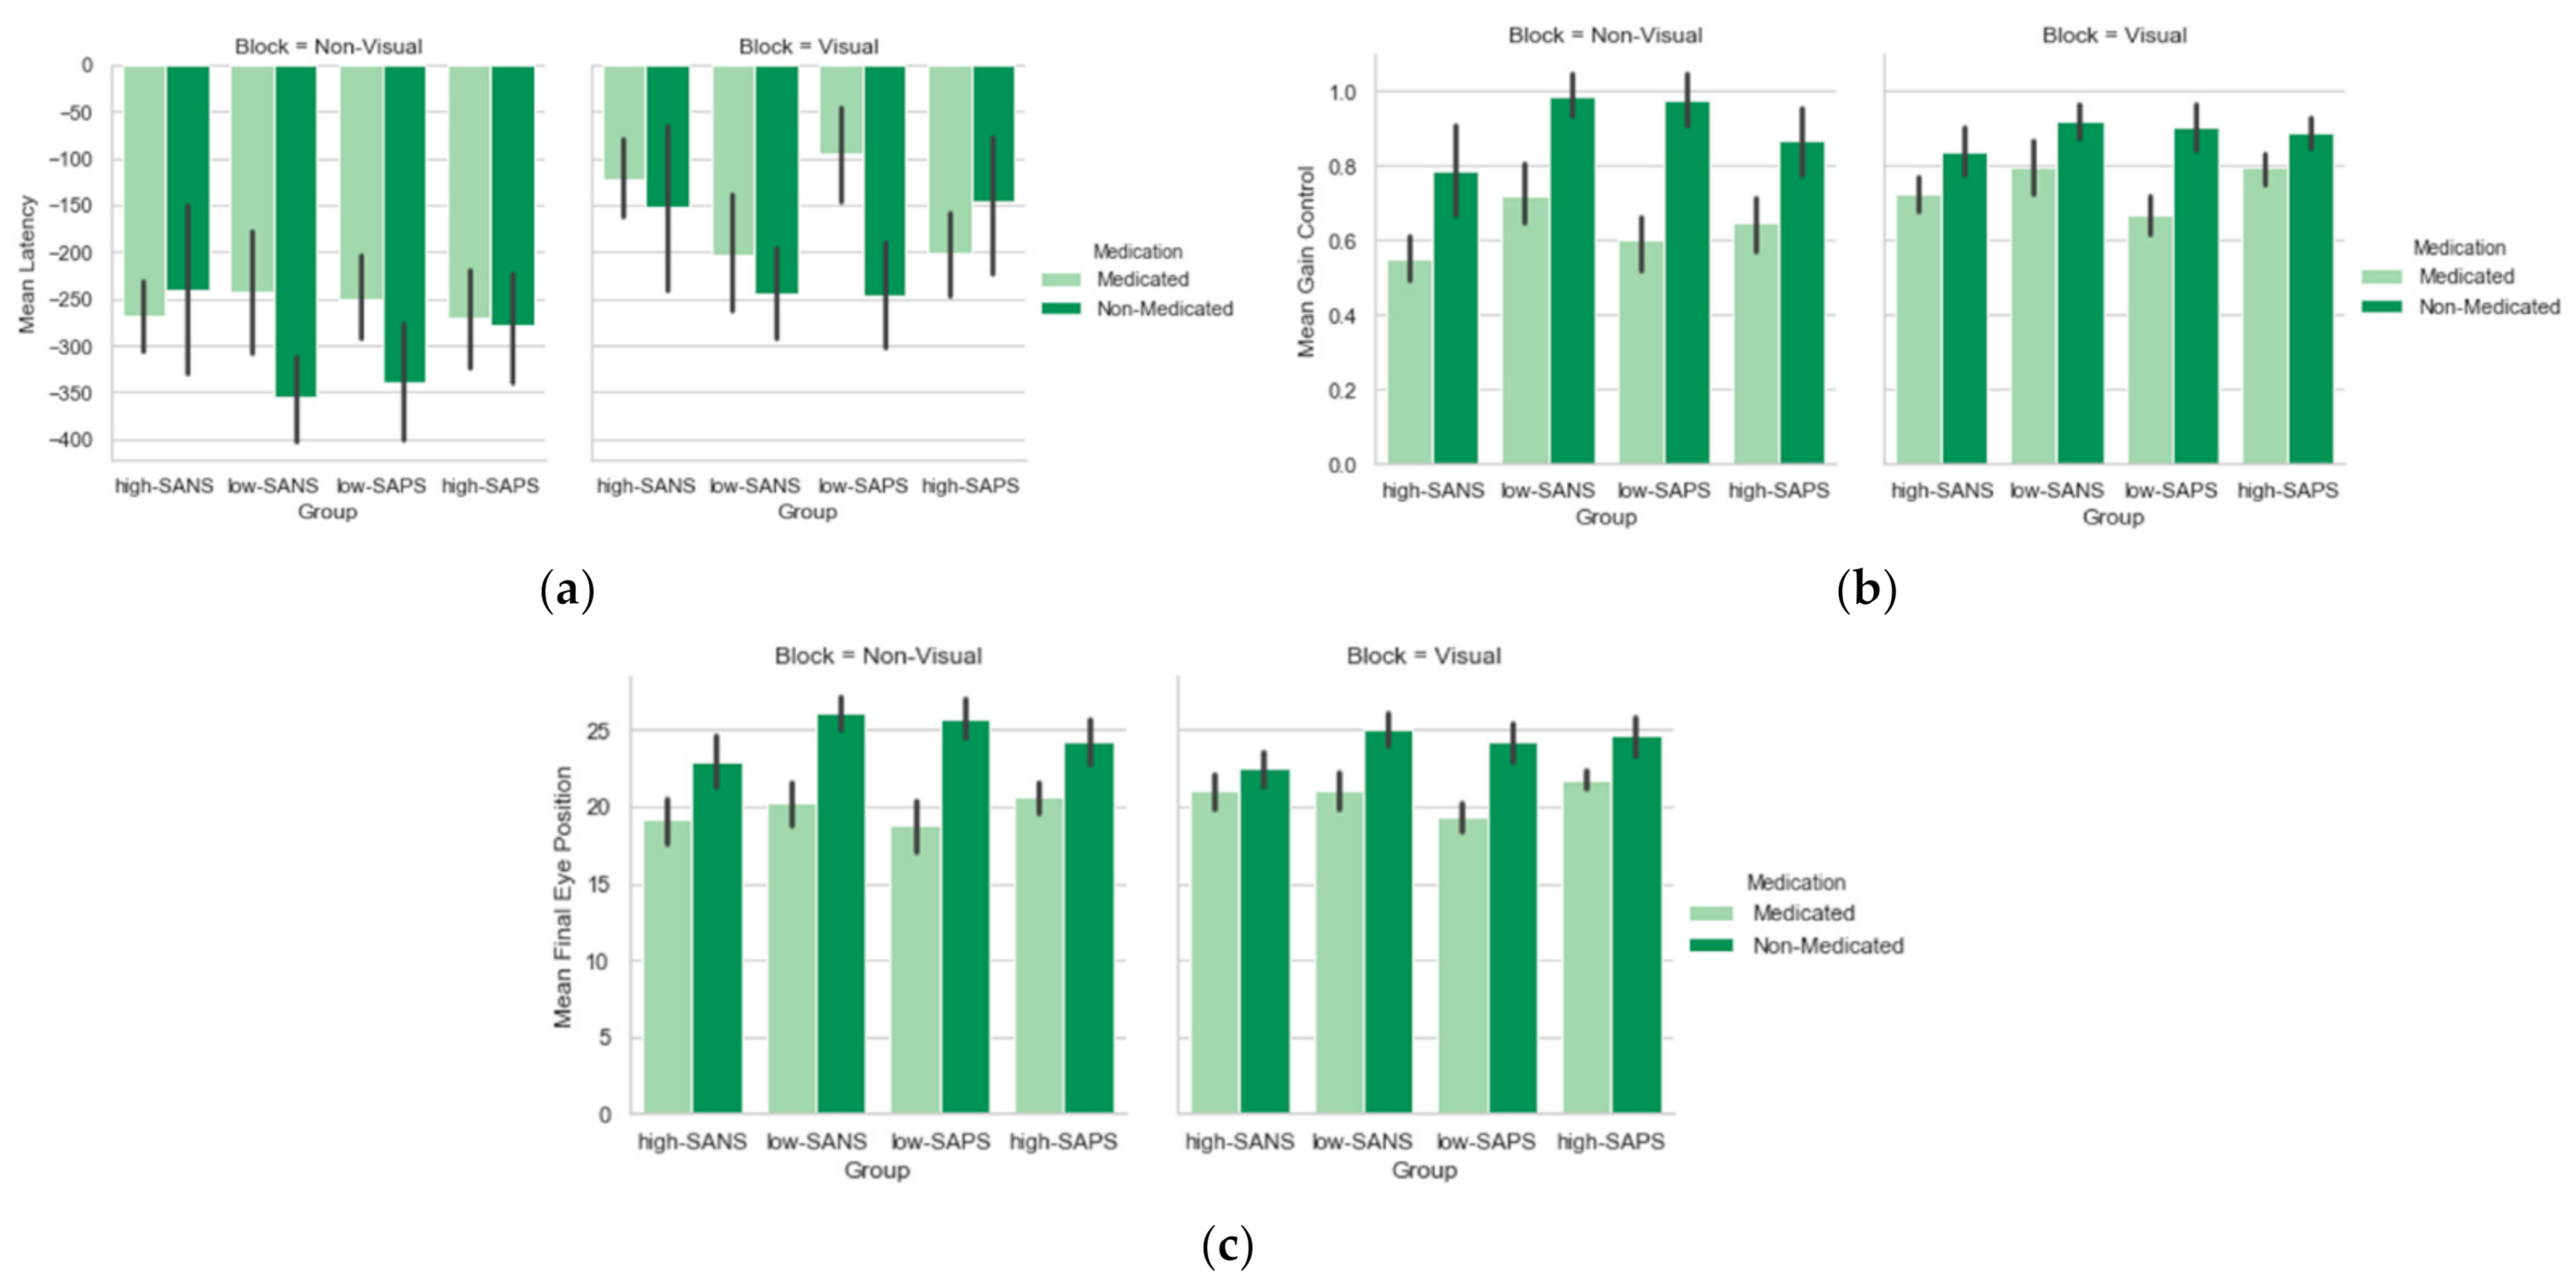
Medication Analysis
3.1.2. Saccade Gain
Symptom Analysis
Medication Analysis
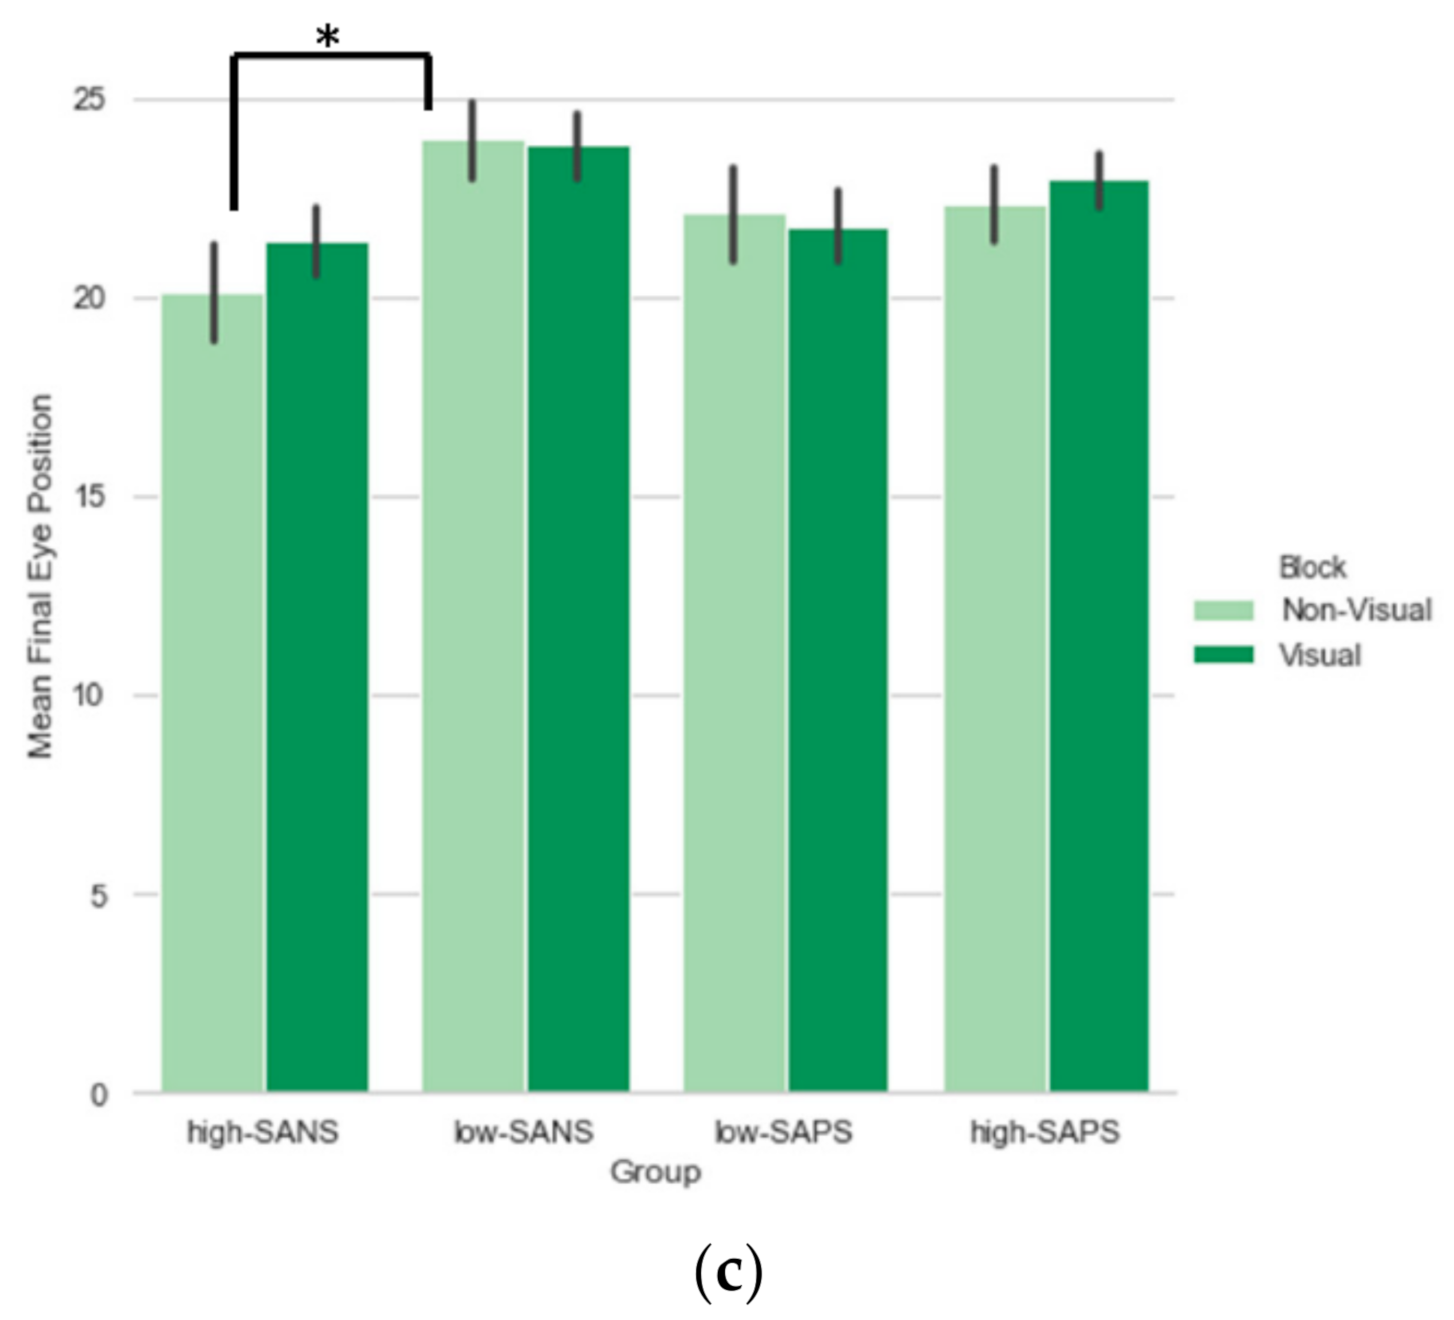
3.1.3. Saccade Final Eye Position
Symptom Analysis
Medication Analysis
3.2. Symptom Dimensional Analyses
4. Discussion
Strengths and Limitations
5. Conclusions
Supplementary Materials
Author Contributions
Funding
Institutional Review Board Statement
Informed Consent Statement
Data Availability Statement
Acknowledgments
Conflicts of Interest
References
- Diefendorf, A.R.; Dodge, R. An experimental study of the ocular reactions of the insane from photographic records. Brain 1908, 31, 451–489. [Google Scholar] [CrossRef]
- Wolf, A.; Ueda, K.; Hirano, Y. Recent updates of eye movement abnormalities in patients with schizophrenia: A scoping review. Psychiatry Clin. Neurosci. 2021, 75, 82–100. [Google Scholar] [CrossRef] [PubMed]
- Brakemeier, S.; Sprenger, A.; Meyhöfer, I.; McDowell, J.E.; Rubin, L.H.; Hill, S.K.; Keshavan, M.S.; Pearlson, G.D.; Tamminga, C.A.; Gershon, E.S.; et al. Smooth pursuit eye movement deficits as a biomarker for psychotic features in bipolar disorder—Findings from the PARDIP study. Bipolar Disord. 2019, 22, 602–611. [Google Scholar] [CrossRef] [Green Version]
- Faiola, E.; Meyhöfer, I.; Ettinger, U. Mechanisms of smooth pursuit eye movements in schizotypy. Cortex 2020, 125, 190–202. [Google Scholar] [CrossRef] [PubMed]
- Levy, L.; Sereno, A.S.; Gooding, D.C.; O’Driscoll, G.A. Eye tracking dysfunction in Schizophrenia: Characterisation and pathophysiology. Curr. Top. Behav. Neurosci. 2010, 4, 311–347. [Google Scholar] [PubMed] [Green Version]
- Kleineidam, L.; Frommann, I.; Ruhrmann, S.; Klosterkötter, J.; Brockhaus-Dumke, A.; Wölwer, W.; Gaebel, W.; Maier, W.; Wagner, M.; Ettinger, U. Antisaccade and prosaccade eye movements in individuals clinically at risk for psychosis: Comparison with first-episode schizophrenia and prediction of conversion. Eur. Arch. Psychiatry Clin. Neurosci. 2019, 269, 921–930. [Google Scholar] [CrossRef] [PubMed]
- Obyedkov, I.; Skuhareuskaya, M.; Skugarevsky, O.; Obyedkov, V.; Buslauski, P.; Skuhareuskaya, T.; Waszkiewicz, N. Saccadic eye movements in different dimensions of schizophrenia and in clinical high-risk state for psychosis. BMC Psychiatry 2019, 19, 110. [Google Scholar] [CrossRef] [Green Version]
- Coe, B.C.; Trappenberg, T.; Munoz, D.P. Modeling Saccadic Action Selection: Cortical and Basal Ganglia Signals Coalesce in the Superior Colliculus. Front. Syst. Neurosci. 2019, 13, 3. [Google Scholar] [CrossRef]
- Myles, J.B.; Rossell, S.L.; Phillipou, A.; Thomas, E.; Gurvich, C. Insights to the schizophrenia continuum: A systematic review of saccadic eye movements in schizotypy and biological relatives of schizophrenia patients. Neurosci. Biobehav. Rev. 2017, 72, 278–300. [Google Scholar] [CrossRef]
- Rodrigue, A.L.; Austin, B.P.; Dyckman, K.A.; McDowell, J.E. Brain activation differences in schizophrenia during context-dependent processing of saccade tasks. Behav. Brain Funct. 2016, 12, 19. [Google Scholar] [CrossRef] [Green Version]
- Caldani, S.; Bucci, M.P.; Lamy, J.-C.; Seassau, M.; Bendjemaa, N.; Gadel, R.; Gaillard, R.; Krebs, M.-O.; Amado, I. Saccadic eye movements as markers of schizophrenia spectrum: Exploration in at-risk mental states. Schizophr. Res. 2017, 181, 30–37. [Google Scholar] [CrossRef] [PubMed]
- Shaikh, A.G.; Antoniades, C.; Fitzgerald, J.; Ghasia, F.F. Effects of Deep Brain Stimulation on Eye Movements and Vestibular Function. Front. Neurol. 2018, 9, 921–930. [Google Scholar] [CrossRef] [Green Version]
- Smyrnis, N.; Amado, I.; Krebs, M.-O.; Sweeney, J.A. Eye Movements in Psychiatry. In Eye Movement Research. Studies in Neuroscience, Psychology and Behavioral Economics; Klein, C., Ettinger, U., Eds.; Springer: Cham, Switzerland, 2019; pp. 703–748. [Google Scholar] [CrossRef]
- Abel, L.A.; Unverzagt, F.; Yee, R.D. Effects of stimulus predictability and interstimulus gap on saccades in Alzheimer’s disease. Dement. Geriatr. Cogn. Disord. 2002, 13, 235–243. [Google Scholar] [CrossRef]
- Bronstein, A.M.; Kennard, C. Predictive ocular motor control in parkinson’s disease. Brain 1985, 108, 925–940. [Google Scholar] [CrossRef] [PubMed]
- Tian, J.R.; Zee, D.S.; Lasker, A.G.; Folstein, S.E. Saccades in Huntington’s disease: Predictive tracking and interaction between release of fixation and initiation of saccades. Neurology 1991, 41, 875. [Google Scholar] [CrossRef] [PubMed]
- Henderson, J.M. Gaze Control as Prediction. Trends Cogn. Sci. 2017, 21, 15–23. [Google Scholar] [CrossRef]
- Bakst, L.; McGuire, J.T. Eye movements reflect adaptive predictions and predictive precision. J. Exp. Psychol. Gen. 2020, 150, 915–929. [Google Scholar] [CrossRef] [PubMed]
- Lukasova, K.; Nucci, M.P.; Neto, R.M.D.A.; Vieira, G.; Sato, J.R.; Amaro, E., Jr. Predictive saccades in children and adults: A combined fMRI and eye tracking study. PLoS ONE 2018, 13, e0196000. [Google Scholar] [CrossRef] [PubMed] [Green Version]
- Hommer, D.W.; Clem, T.; Litman, R.; Pickar, D. Maladaptive anticipatory saccades in schizophrenia. Biol. Psychiatry 1991, 30, 779–794. [Google Scholar] [CrossRef]
- Abel, L.A.; Douglas, J. Effects of age on latency and error generation in internally mediated saccades. Neurobiol. Aging 2007, 28, 627–637. [Google Scholar] [CrossRef]
- Keedy, S.K.; Bishop, J.R.; Weiden, P.J.; Sweeney, J.A.; Rosen, C.; Marvin, R.; Reilly, J.L. Disease and drug effects on internally-generated and externally-elicited responses in first episode schizophrenia and psychotic bipolar disorder. Schizophr. Res. 2014, 159, 101–106. [Google Scholar] [CrossRef] [Green Version]
- Simo, L.S.; Krisky, C.M.; Sweeney, J.A. Functional neuroanatomy of anticipatory behaviour: Dissociation between sensory-driven and memory-driven systems. Cereb. Cortex 2005, 15, 1982–1991. [Google Scholar] [CrossRef] [Green Version]
- McDowell, J.E.; Dyckman, K.A.; Austin, B.P.; Clementz, B.A. Neurophysiology and neuroanatomy of reflexive and volitional saccades: Evidence from studies of humans. Brain Cogn. 2008, 68, 255–270. [Google Scholar] [CrossRef] [PubMed] [Green Version]
- Crawford, T.J.; Haeger, B.; Kennard, C.; Reveley, M.A.; Henderson, L. Saccadic Abnormalities in Psychotic Patients. I. Neuroleptic-free Psychotic Patients. Psychol. Med. 1995, 25, 461–471. [Google Scholar] [CrossRef]
- Crawford, T.J.; Haeger, B.; Kennard, C.; Reveley, M.A.; Henderson, L. Saccadic Abnormalities in Psychotic Patients. II. The Role of Neuroleptic Treatment. Psychol. Med. 1995, 25, 473–483. [Google Scholar] [CrossRef]
- Gagnon, D.; O’Driscoll, G.A.; Petrides, M.; Pike, G.B. The effect of spatial and temporal information on saccades and neural activity in oculomotor structures. Brain 2002, 125, 123–139. [Google Scholar] [CrossRef] [PubMed] [Green Version]
- Karoumi, B.; Ventre-Dominey, J.; Dalery, J. Predictive saccade behavior is enhanced in schizophrenia. Cognition 1998, 68, B81–B91. [Google Scholar] [CrossRef]
- Hutton, S.B.; Cuthbert, I.; Crawford, T.J.; Kennard, C.; Barnes, T.R.E.; Joyce, E.M. Saccadic hypometria in drug-naive and drug-treated schizophrenic patients: A working memory deficit? Psychophysiology 2001, 38, 125–132. [Google Scholar] [CrossRef] [PubMed]
- Krebs, M.-O.; Bourdel, M.-C.; Cherif, Z.R.; Bouhours, P.; Lôo, H.; Poirier, M.F.; Amado, I. Deficit of inhibition motor control in untreated patients with schizophrenia: Further support from visually guided saccade paradigms. Psychiatry Res. 2010, 179, 279–284. [Google Scholar] [CrossRef] [PubMed]
- Ettinger, U.; Kumari, V.; Crawford, T.; Davis, R.E.; Sharma, T.; Corr, P.J. Reliability of smooth pursuit, fixation, and saccadic eye movements. Psychophysiology 2003, 40, 620–628. [Google Scholar] [CrossRef]
- Katsanis, J.; Iacono, W.G. Clinical, neuropsychological, and brain structural correlates of smooth-pursuit eye tracking performance in chronic schizophrenia. J. Abnorm. Psychol. 1991, 100, 526. [Google Scholar] [CrossRef] [PubMed]
- Roitman, S.E.L.; Keefe, R.S.; Harvey, P.D.; Siever, L.J.; Mohs, R.C. Attentional and eye tracking deficits correlate with negative symptoms in schizophrenia. Schizophr. Res. 1997, 26, 139–146. [Google Scholar] [CrossRef]
- Sweeney, J.A.; Clementz, B.A.; Haas, G.L.; Escobar, M.D.; Drake, K.; Frances, A.J. Eye tracking dysfunction in schizophrenia: Characterization of component eye movement abnormalities, diagnostic specificity, and the role of attention. J. Abnorm. Psychol. 1994, 103, 222. [Google Scholar] [CrossRef] [PubMed]
- Flechtner, K.-M.; Steinacher, B.; Sauer, R.; Mackert, A. Smooth pursuit eye movements in schizophrenia and affective disorder. Psychol. Med. 1997, 27, 1411–1419. [Google Scholar] [CrossRef] [PubMed]
- Sweeney, J.A.; Luna, B.; Srinivasagam, N.M.; Keshavan, M.S.; Schooler, N.R.; Haas, G.L.; Carl, J.R. Eye tracking abnormalities in schizophrenia: Evidence for dysfunction in the frontal eye fields. Biol. Psychiatry 1998, 44, 698–708. [Google Scholar] [CrossRef]
- Sweeney, J.A.; Luna, B.; Haas, G.L.; Keshavan, M.S.; Mann, J.J.; Thase, M.E. Pursuit tracking impairments in schizophrenia and mood disorders: Step-ramp studies with unmedicated patients. Biol. Psychiatry 1999, 46, 671–680. [Google Scholar] [CrossRef]
- Lee, K.-H.; Williams, L.M.; Loughland, C.M.; Davidson, D.J.; Gordon, E. Syndromes of schizophrenia and smooth-pursuit eye movement dysfunction. Psychiatry Res. 2001, 101, 11–21. [Google Scholar] [CrossRef]
- Jogems-Kosterman, B.; Zitman, F.; Van Hoof, J.; Hulstijn, W. Psychomotor slowing and planning deficits in schizophrenia. Schizophr. Res. 2001, 48, 317–333. [Google Scholar] [CrossRef] [Green Version]
- Wible, C.G.; Anderson, J.; Shenton, M.E.; Kricun, A.; Hirayasu, Y.; Tanaka, S.; Levitt, J.J.; O’Donnell, B.F.; Kikinis, R.; Jolesz, F.A.; et al. Prefrontal cortex, negative symptoms, and schizophrenia: An MRI study. Psychiatry Res. Neuroimaging 2001, 108, 65–78. [Google Scholar] [CrossRef] [Green Version]
- Rodríguez, V.M.; Andrée, R.M.; Castejón, M.J.P.; Labrador, R.G.; Navarrete, F.F.; Delgado, J.L.C.; Vila, F.J.R. Cerebral perfusion correlates of negative symptomatology and parkinsonism in a sample of treatment-refractory schizo-phrenics: An exploratory 99mTc-HMPAO SPET study. Schizophr. Res. 1997, 25, 11–20. [Google Scholar] [CrossRef]
- Sanfilipo, M.; Lafargue, T.; Rusinek, H.; Arena, L.; Loneragan, C.; Lautin, A.; Feiner, D.; Rotrosen, J.; Wolkin, A. Volumetric measure of the frontal and temporal lobe regions in schizophrenia: Relationship to negative symptoms. Arch. Gen. Psychiatry 2000, 57, 471–480. [Google Scholar] [CrossRef]
- Barbey, A.K.; Koenigs, M.; Grafman, J. Dorsolateral prefrontal contributions to human working memory. Cortex 2013, 49, 1195–1205. [Google Scholar] [CrossRef] [PubMed] [Green Version]
- Ball, G.; Stokes, P.R.; Rhodes, R.A.; Bose, S.K.; Rezek, I.; Wink, A.M.; Lord, L.D.; Mehta, M.A.; Grasby, P.M.; Turkheimer, F.E. Executive functions and prefrontal cortex: A matter of persistence? Front. Syst. Neurosci. 2011, 5, 3. [Google Scholar] [CrossRef] [PubMed] [Green Version]
- Pierrot-Deseilligny, C.; Müri, R.; Nyffeler, T.; Milea, D. The Role of the Human Dorsolateral Prefrontal Cortex in Ocular Motor Behavior. Ann. N. Y. Acad. Sci. 2005, 1039, 239–251. [Google Scholar] [CrossRef]
- Pierrot-Deseilligny, C.H.; Ploner, C.J.; Müri, R.M.; Gaymard, B.; Rivaud-Pechoux, S. Effects of cortical lesions on saccadic: Eye movements in humans. Ann. N. Y. Acad. Sci. 2002, 956, 216–229. [Google Scholar] [CrossRef]
- Martinez-Conde, S.; Macknik, S.L.; Hubel, D.H. The function of bursts of spikes during visual fixation in the awake primate lateral geniculate nucleus and primary visual cortex. Proc. Natl. Acad. Sci. USA 2002, 99, 13920–13925. [Google Scholar] [CrossRef] [PubMed] [Green Version]
- Nakamura, K.; Colby, C.L. Updating of the visual representation in monkey striate and extrastriate cortex during saccades. Proc. Natl. Acad. Sci. USA 2002, 99, 4026–4031. [Google Scholar] [CrossRef] [PubMed] [Green Version]
- American Psychiatric Association. Diagnostic and Statistical Manual of Mental Disorders, 3rd ed.; Revised; APA: Washington, DC, USA, 1987. [Google Scholar]
- Crawford, T.; Goodrich, S.; Henderson, L.; Kennard, C. Predictive responses in Parkinson’s disease: Manual keypresses and saccadic eye movements to regular stimulus events. J. Neurol. Neurosurg. Psychiatry 1989, 52, 1033–1042. [Google Scholar] [CrossRef]
- Frith, C.D. The Cognitive Neuropsychology of Schizophrenia (Classic Edition); Psychology Press: London, UK, 2015. [Google Scholar] [CrossRef]
- Barnes, T.R.E.; Liddle, P.F. Evidence for the Validity of Negative Symptoms. Mod. Probl. Pharmacopsychiatry 1990, 24, 43–72. [Google Scholar] [CrossRef]
- Andreasen, N.C.; Flaum, M. Schizophrenia: The Characteristic Symptoms. Schizophr. Bull. 1991, 17, 27–49. [Google Scholar] [CrossRef] [Green Version]
- McGlashan, T.H.; Fenton, W.S. The positive-negative distinction in schizophrenia: Review of natural history vali-dators. Arch. Gen. Psychiatry 1992, 49, 63–72. [Google Scholar] [CrossRef] [PubMed]
- Bilder, R.M.; Mukherjee, S.; Rieder, R.O.; Pandurangi, A.K. Symptomatic and Neuropsychological Components of Defect States. Schizophr. Bull. 1985, 11, 409–419. [Google Scholar] [CrossRef] [Green Version]
- Liddle, P.F. The symptoms of chronic schizophrenia: A re-examination of the positive-negative dichotomy. Br. J. Psychiatry 1987, 151, 145–151. [Google Scholar] [CrossRef] [PubMed] [Green Version]
- Kulhara, P.; Chandiramani, K. Positive and negative subtypes of schizophrenia: A follow-up study from India. Schizophr. Res. 1990, 3, 107–116. [Google Scholar] [CrossRef]
- Mortimer, A.M.; Lund, C.E.; McKenna, P.J. The Positive: Negative Dichotomy in Schizophrenia. Br. J. Psychiatry 1990, 157, 41–49. [Google Scholar] [CrossRef] [PubMed]
- Arndt, S.; Alliger, R.J.; Andreasen, N.C. The Distinction of Positive and Negative Symptoms. Br. J. Psychiatry 1991, 158, 317–322. [Google Scholar] [CrossRef]
- Crow, T.J. Molecular pathology of schizophrenia: More than one disease process? BMJ 1980, 280, 66–68. [Google Scholar] [CrossRef] [Green Version]
- Crow, T.J. Positive and Negative Schizophrenic Symptoms and the Role of Dopamine. Br. J. Psychiatry 1980, 137, 383–386. [Google Scholar] [CrossRef]
- Andreasen, N.C. Negative symptoms in schizophrenia: Definition and reliability. Arch. Gen. Psychiatry 1982, 39, 784–788. [Google Scholar] [CrossRef]
- Lewine, R.R.; Fogg, L.; Meltzer, H.Y. Assessment of Negative and Positive Symptoms in Schizophrenia. Schizophr. Bull. 1983, 9, 368–376. [Google Scholar] [CrossRef] [Green Version]
- Liddle, P.F. Schizophrenic syndromes, cognitive performance and neurological dysfunction. Psychol. Med. 1987, 17, 49–57. [Google Scholar] [CrossRef] [PubMed]
- Liddle, P.F.; Morris, D.L. Schizophrenic Syndromes and Frontal Lobe Performance. Br. J. Psychiatry 1991, 158, 340–345. [Google Scholar] [CrossRef]
- Ivry, R. Cerebellar Involvement in the Explicit Representation of Temporal Information. Ann. N. Y. Acad. Sci. 1993, 682, 214–230. [Google Scholar] [CrossRef] [PubMed]
- Harrington, D.L.; Haaland, K.Y. Neural underpinnings of temporal processing: A review of focal lesion, pharma-cological, and functional imaging research. Rev. Neurosci. 1999, 10, 91–116. [Google Scholar] [CrossRef] [PubMed]
- Watanabe, M.; Munoz, D.P. Probing basal ganglia functions by saccade eye movements. Eur. J. Neurosci. 2011, 33, 2070–2090. [Google Scholar] [CrossRef]
- Ivry, R.B.; Keele, S.W.; Diener, H.C. Dissociation of the lateral and medial cerebellum in movement timing and movement execution. Exp. Brain Res. 1988, 73, 167–180. [Google Scholar] [CrossRef]
- O’Sullivan, E.P.; Shaunak, S.; Henderson, L.; Hawken, M.; Crawford, T.J.; Kennard, C. Abnormalities of predictive saccades in Parkinson’s disease. Neuroreport 1997, 8, 1209–1213. [Google Scholar] [CrossRef] [Green Version]
- Gaymard, B.; Ploner, C.J.; Rivaud, S.; Vermersch, A.I.; Pierrot-Deseilligny, C. Cortical control of saccades. Exp. Brain Res. 1998, 123, 159–163. [Google Scholar] [CrossRef]
- Schmechtig, A.; Vassos, E.; Kumari, V.; Hutton, S.B.; Collier, D.A.; Morris, R.G.; Williams, S.C.R.; Ettinger, U. Association of Neuregulin 1 rs3924999 genotype with antisaccades and smooth pursuit eye movements. Genes Brain Behav. 2010, 9, 621–627. [Google Scholar] [CrossRef]
- Petrovsky, N.; Weiss-Motz, F.; Schulze-Rauschenbach, S.; Lemke, M.; Hornung, P.; Ruhrmann, S.; Klosterkötter, J.; Maier, W.; Ettinger, U.; Wagner, M. Antisaccade performance is related to genetic loading for schizophrenia. J. Psychiatr. Res. 2009, 43, 291–297. [Google Scholar] [CrossRef]
- Vaidyanathan, U.; Malone, S.M.; Donnelly, J.M.; Hammer, M.A.; Miller, M.B.; McGue, M.; Iacono, W.G. Heritability and molecular genetic basis of antisaccade eye tracking error rate: A genome-wide association study. Psychophysiology 2014, 51, 1272–1284. [Google Scholar] [CrossRef] [PubMed] [Green Version]


| Schizophrenia Patients | Bipolar Disorder Patients | Control Participants | |||
|---|---|---|---|---|---|
| Medicated | Non-Medicated | Medicated | Non-Medicated | ||
| Chlorpromazine equivalent units | 1637 (572) | - | 1186 (474) | - | - |
| Age (year) | 39.9 (12.3) | 39.4 (13.2) | 43.6 (12.1) | 42.1 (12.3) | 38.51 (10.8) |
| Disease duration (year) | 13.7 (10.7) | 12.9 (14.8) | 20.5 (11.6) | 14.7 (13.6) | - |
| Age of onset (year) | 26.3 (8.9) | 25.4 (10.6) | 23.1 (8.9) | 27.4 (12.2) | - |
| Negative symptoms (SANS) | 27.5 (17.1) | 21.5 (19.7) | 13.7 (17.6) | 4.6 (6.8) | 1.0 (1.9) |
| Positive symptoms (SAPS) | 16.6 (21.7) | 17.7 (17.8) | 5.1 (9.2) | 3.4 (6.6) | 0.03 (0.18) |
Publisher’s Note: MDPI stays neutral with regard to jurisdictional claims in published maps and institutional affiliations. |
© 2022 by the authors. Licensee MDPI, Basel, Switzerland. This article is an open access article distributed under the terms and conditions of the Creative Commons Attribution (CC BY) license (https://creativecommons.org/licenses/by/4.0/).
Share and Cite
Smith, E.S.; Crawford, T.J. Positive and Negative Symptoms Are Associated with Distinct Effects on Predictive Saccades. Brain Sci. 2022, 12, 418. https://doi.org/10.3390/brainsci12040418
Smith ES, Crawford TJ. Positive and Negative Symptoms Are Associated with Distinct Effects on Predictive Saccades. Brain Sciences. 2022; 12(4):418. https://doi.org/10.3390/brainsci12040418
Chicago/Turabian StyleSmith, Eleanor S., and Trevor J. Crawford. 2022. "Positive and Negative Symptoms Are Associated with Distinct Effects on Predictive Saccades" Brain Sciences 12, no. 4: 418. https://doi.org/10.3390/brainsci12040418