
Connectivity in Large-Scale Resting-State Brain Networks Is Related to Motor Learning: A High-Density EEG Study

 , , , , and
Abstract
:1. Introduction
2. Materials and Methods
2.1. Participants
2.2. Experimental Methods
2.3. Motor Sequence Learning Task
2.4. Neuroimaging Data Acquisition
2.4.1. EEG Data Acquisition
2.4.2. MRI Data Acquisition
2.5. Neuroimaging Data Analysis
2.5.1. Sleep Scoring
2.5.2. hdEEG Resting-State Functional Connectivity Analyses
2.5.3. EEG Signals Preprocessing
2.5.4. Individual Head Model Creation
2.5.5. EEG Source Reconstruction
2.5.6. Network Connectivity Analyses
3. Results
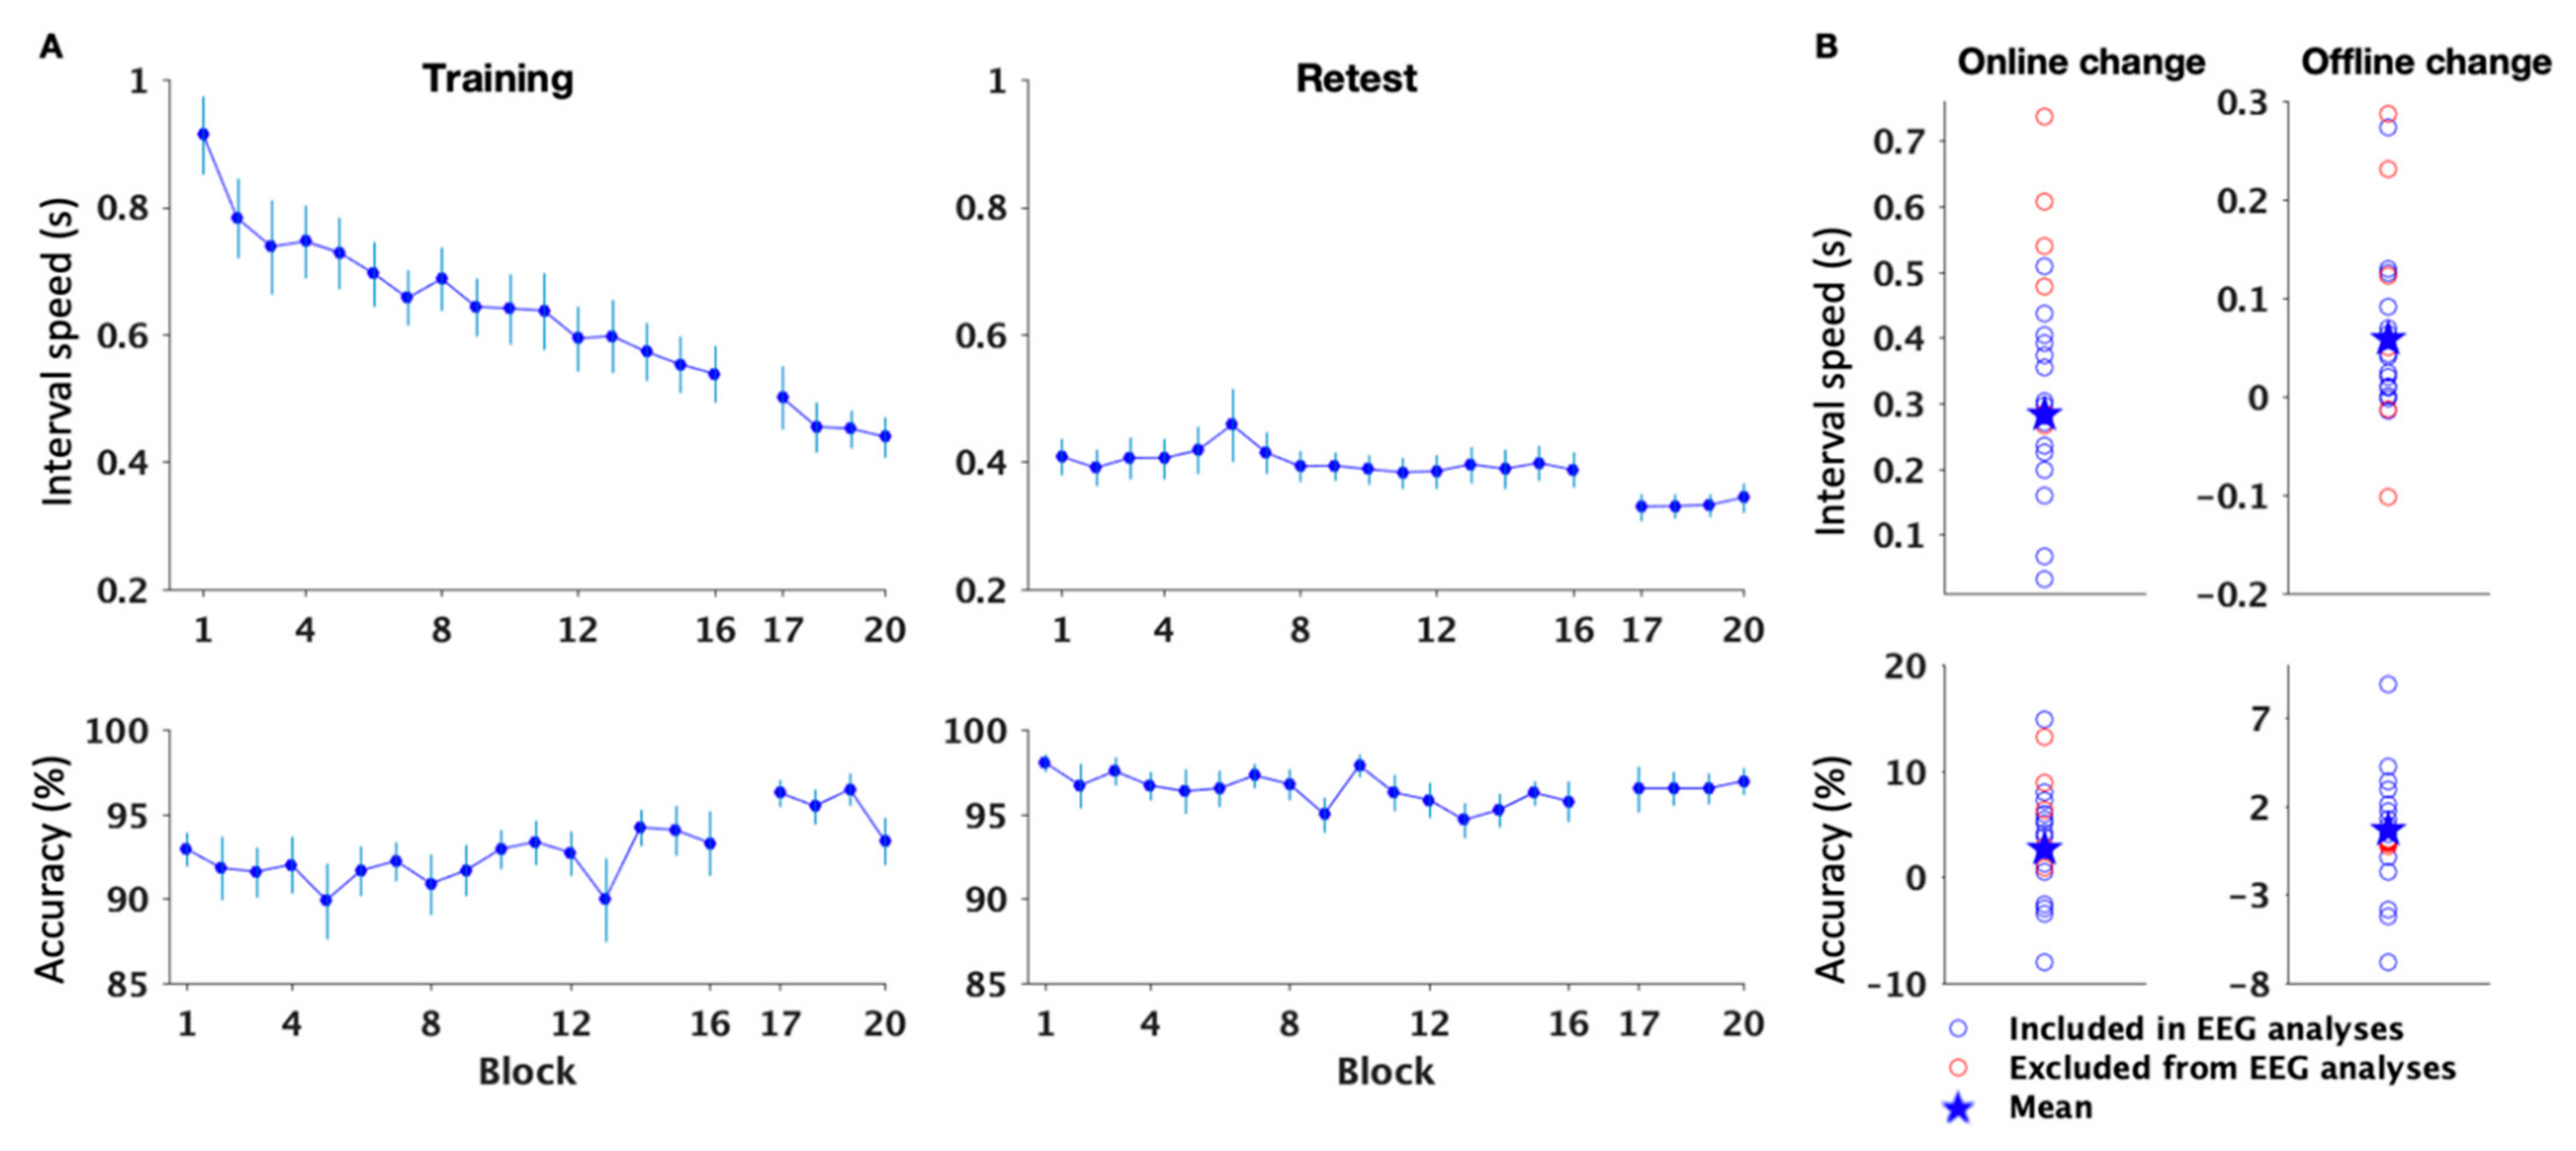
3.1. Behavior
3.1.1. Sleep and Vigilance
3.1.2. MSL Performance
Speed
Accuracy
3.2. Functional Connectivity
3.2.1. Training-Related Changes in Connectivity
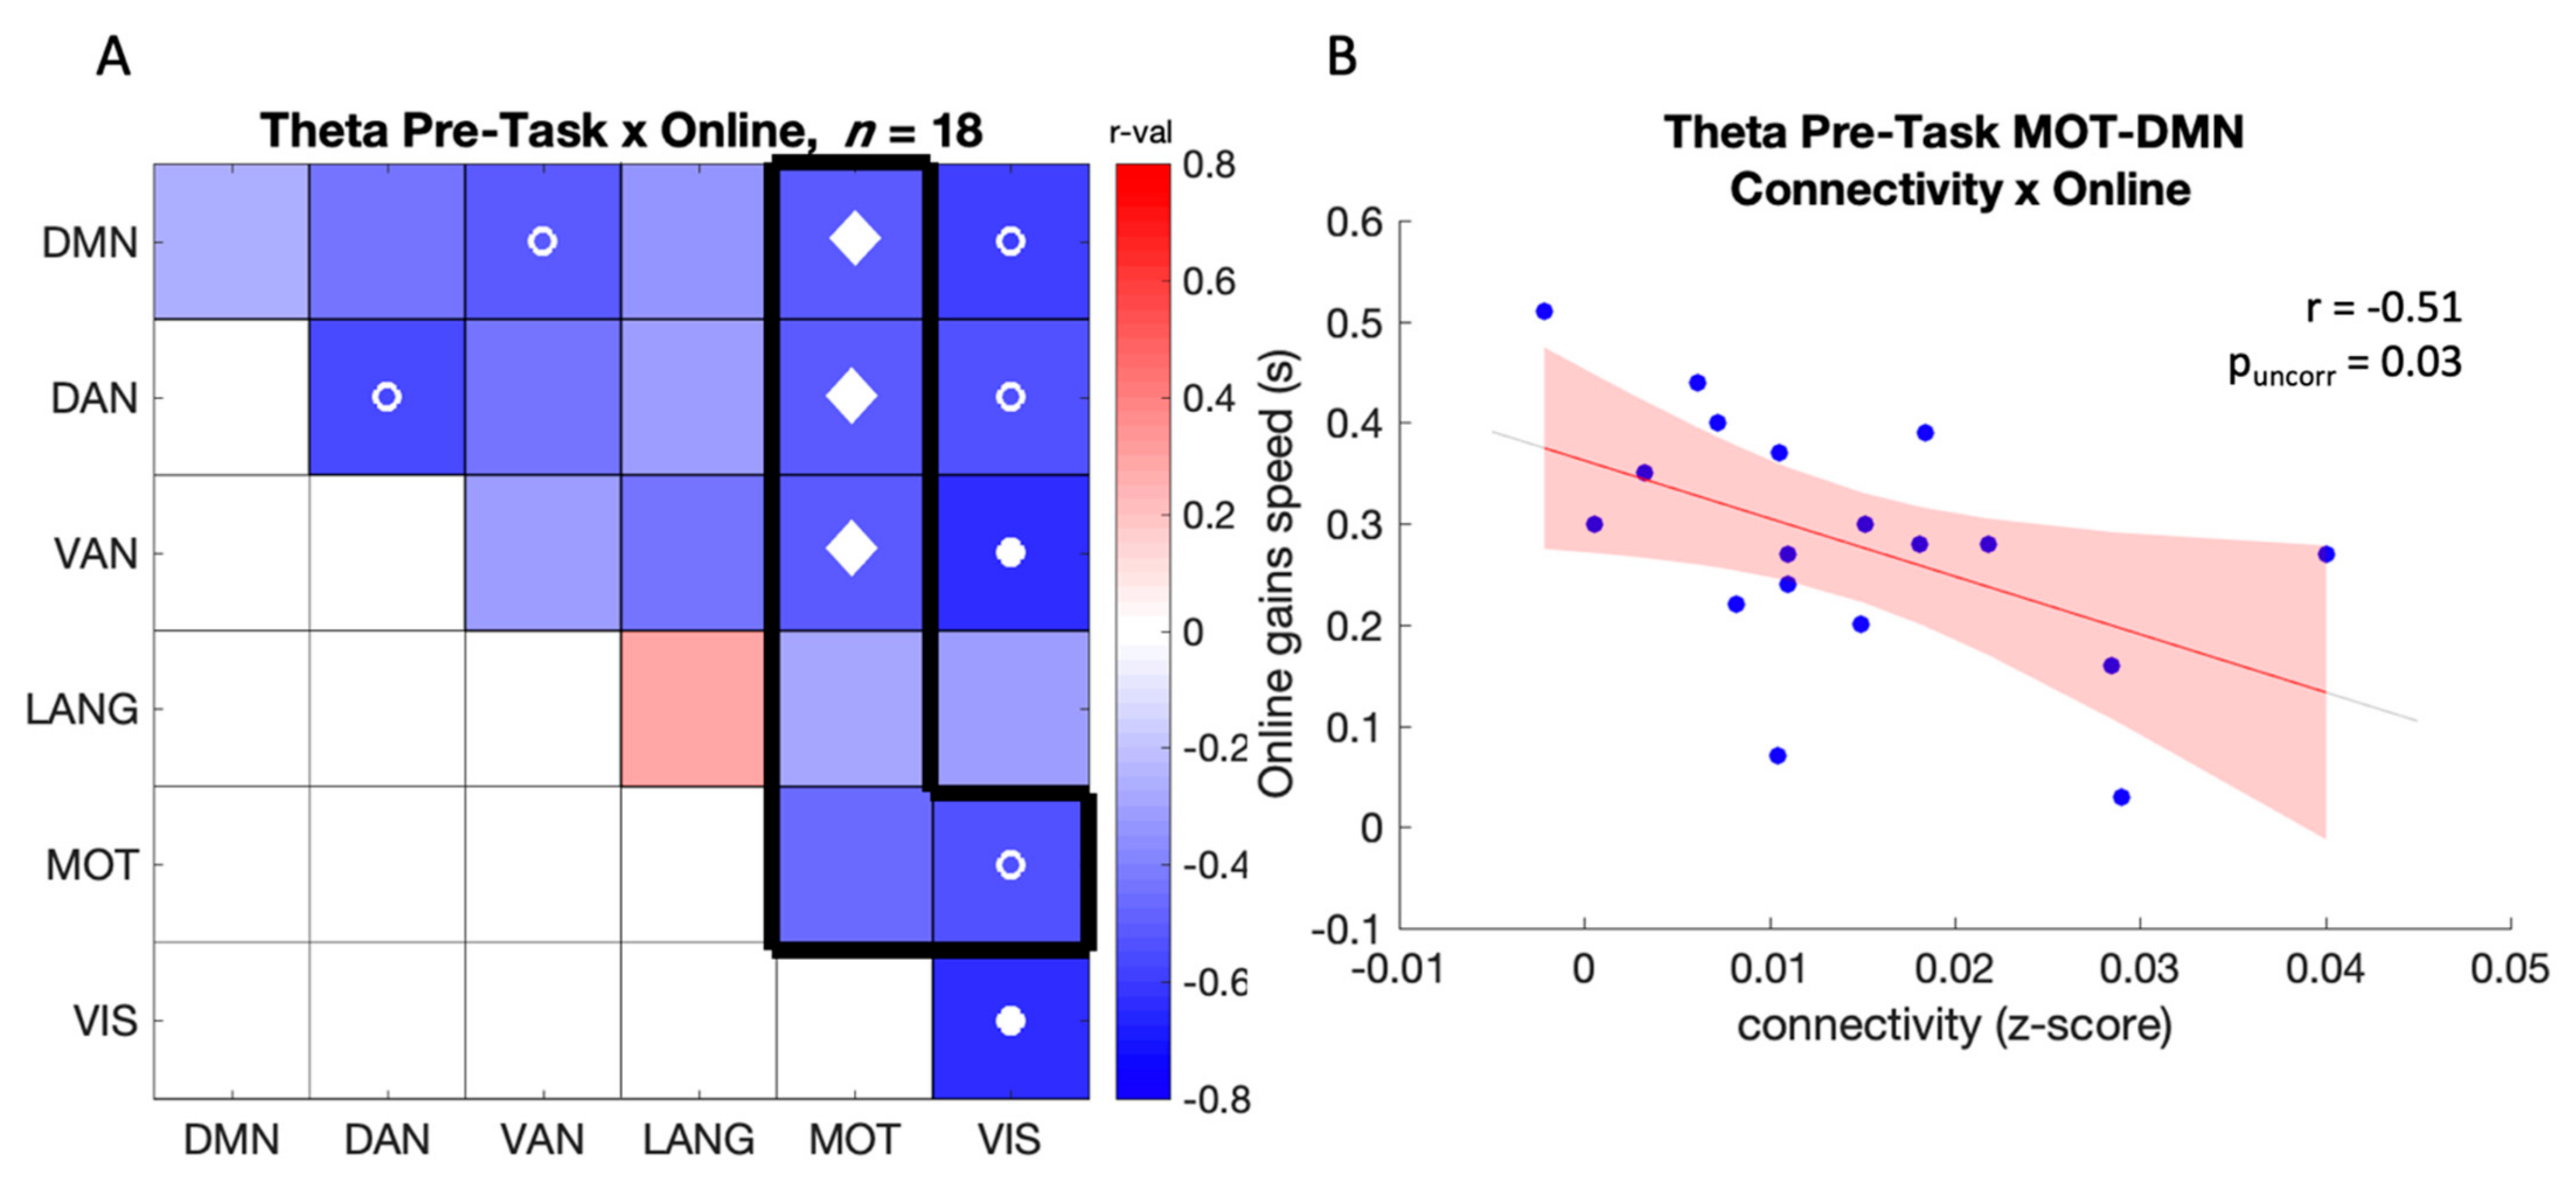
3.2.2. Correlation between Connectivity and Online Gains in Performance
Pre-Task (Baseline) Connectivity
Training-Related Changes in Connectivity
3.2.3. Correlation between Connectivity and Offline Gains in Performance
Pre-Task (Baseline) Connectivity
Training-Related Changes in Connectivity
4. Discussion
4.1. Learning-Related Decreases in Gamma-Band Connectivity
4.2. Baseline Theta, Delta, and Beta Connectivity Predicts the Subsequent Learning and Consolidation Processes
4.3. Training-Related Increases in Beta Connectivity Are Related to Better Consolidation
5. Conclusions
Supplementary Materials
Author Contributions
Funding
Institutional Review Board Statement
Informed Consent Statement
Data Availability Statement
Acknowledgments
Conflicts of Interest
References
- Willingham, D.B. A Neuropsychological Theory of Motor Skill Learning. Psychol. Rev. 1998, 105, 558–584. [Google Scholar] [CrossRef] [Green Version]
- Krakauer, J.W.; Shadmehr, R. Consolidation of Motor Memory. Trends Neurosci. 2006, 29, 58–64. [Google Scholar] [CrossRef] [Green Version]
- King, B.R.; Hoedlmoser, K.; Hirschauer, F.; Dolfen, N.; Albouy, G. Sleeping on the Motor Engram: The Multifaceted Nature of Sleep-Related Motor Memory Consolidation. Neurosci. Biobehav. Rev. 2017, 80, 1–22. [Google Scholar] [CrossRef]
- Doyon, J.; Korman, M.; Morin, A.; Dostie, V.; Tahar, A.H.; Benali, H.; Karni, A.; Ungerleider, L.G.; Carrier, J. Contribution of Night and Day Sleep vs. Simple Passage of Time to the Consolidation of Motor Sequence and Visuomotor Adaptation Learning. Exp. Brain Res. 2009, 195, 15–26. [Google Scholar] [CrossRef] [Green Version]
- Walker, M.P.; Brakefield, T.; Morgan, A.; Hobson, J.A.; Stickgold, R. Practice with Sleep Makes Perfect: Sleep-Dependent Motor Skill Learning. Neuron 2002, 35, 205–211. [Google Scholar] [CrossRef] [Green Version]
- Doyon, J.; Bellec, P.; Amsel, R.; Penhune, V.; Monchi, O.; Carrier, J.; Lehéricy, S.; Benali, H. Contributions of the Basal Ganglia and Functionally Related Brain Structures to Motor Learning. Behav. Brain Res. 2009, 199, 61–75. [Google Scholar] [CrossRef]
- Dayan, E.; Cohen, L.G. Neuroplasticity Subserving Motor Skill Learning. Neuron 2011, 72, 443–454. [Google Scholar] [CrossRef] [Green Version]
- Albouy, G.; Sterpenich, V.; Vandewalle, G.; Darsaud, A.; Gais, S.; Rauchs, G.; Desseilles, M.; Boly, M.; Dang-Vu, T.; Balteau, E.; et al. Interaction between Hippocampal and Striatal Systems Predicts Subsequent Consolidation of Motor Sequence Memory. PLoS ONE 2013, 8, e59490. [Google Scholar] [CrossRef]
- Albert, N.B.; Robertson, E.M.; Miall, R.C. The Resting Human Brain and Motor Learning. Curr. Biol. 2009, 19, 1023–1027. [Google Scholar] [CrossRef] [Green Version]
- King, B.R.; Van Ruitenbeek, P.; Leunissen, I.; Cuypers, K.; Heise, K.F.; Santos Monteiro, T.; Hermans, L.; Levin, O.; Albouy, G.; Mantini, D.; et al. Age-Related Declines in Motor Performance Are Associated with Decreased Segregation of Large-Scale Resting State Brain Networks. Cereb. Cortex 2018, 28, 4390–4402. [Google Scholar] [CrossRef]
- Gregory, M.D.; Agam, Y.; Selvadurai, C.; Nagy, A.; Vangel, M.; Tucker, M.; Robertson, E.M.; Stickgold, R.; Manoach, D.S. Resting State Connectivity Immediately Following Learning Correlates with Subsequent Sleep-Dependent Enhancement of Motor Task Performance. NeuroImage 2014, 102, 666–673. [Google Scholar] [CrossRef] [Green Version]
- Samogin, J.; Marino, M.; Porcaro, C.; Wenderoth, N.; Dupont, P.; Swinnen, S.P.; Mantini, D. Frequency-dependent Functional Connectivity in Resting State Networks. Hum. Brain Mapp. 2020, 41, 5187–5198. [Google Scholar] [CrossRef]
- Liu, Q.; Farahibozorg, S.; Porcaro, C.; Wenderoth, N.; Mantini, D. Detecting Large-Scale Networks in the Human Brain Using High-Density Electroencephalography. Hum. Brain Mapp. 2017, 38, 4631–4643. [Google Scholar] [CrossRef] [Green Version]
- Marino, M.; Liu, Q.; Samogin, J.; Tecchio, F.; Cottone, C.; Mantini, D.; Porcaro, C. Neuronal Dynamics Enable the Functional Differentiation of Resting State Networks in the Human Brain. Hum. Brain Mapp. 2019, 40, 1445–1457. [Google Scholar] [CrossRef]
- Mary, A.; Wens, V.; Op De Beeck, M.; Leproult, R.; De Tiège, X.; Peigneux, P. Resting-State Functional Connectivity Is an Age-Dependent Predictor of Motor Learning Abilities. Cereb. Cortex 2017, 27, 4923–4932. [Google Scholar] [CrossRef]
- Sugata, H.; Yagi, K.; Yazawa, S.; Nagase, Y.; Tsuruta, K.; Ikeda, T.; Nojima, I.; Hara, M.; Matsushita, K.; Kawakami, K.; et al. Role of Beta-Band Resting-State Functional Connectivity as a Predictor of Motor Learning Ability. NeuroImage 2020, 210, 116562. [Google Scholar] [CrossRef]
- Mary, A.; Wens, V.; Op De Beeck, M.; Leproult, R.; De Tiège, X.; Peigneux, P. Age-Related Differences in Practice-Dependent Resting-State Functional Connectivity Related to Motor Sequence Learning. Hum. Brain Mapp. 2017, 38, 923–937. [Google Scholar] [CrossRef]
- Greicius, M.D.; Supekar, K.; Menon, V.; Dougherty, R.F. Resting-State Functional Connectivity Reflects Structural Connectivity in the Default Mode Network. Cereb. Cortex 2009, 19, 72–78. [Google Scholar] [CrossRef]
- De Luca, M.; Beckmann, C.F.; De Stefano, N.; Matthews, P.M.; Smith, S.M. FMRI Resting State Networks Define Distinct Modes of Long-Distance Interactions in the Human Brain. NeuroImage 2006, 29, 1359–1367. [Google Scholar] [CrossRef]
- Lewis, C.M.; Baldassarre, A.; Committeri, G.; Romani, G.L.; Corbetta, M. Learning Sculpts the Spontaneous Activity of the Resting Human Brain. Proc. Natl. Acad. Sci. USA 2009, 106, 17558–17563. [Google Scholar] [CrossRef] [Green Version]
- de Pasquale, F.; Della Penna, S.; Snyder, A.Z.; Marzetti, L.; Pizzella, V.; Romani, G.L.; Corbetta, M. A Cortical Core for Dynamic Integration of Functional Networks in the Resting Human Brain. Neuron 2012, 74, 753–764. [Google Scholar] [CrossRef] [PubMed] [Green Version]
- Manuel, A.L.; Guggisberg, A.G.; Thézé, R.; Turri, F.; Schnider, A.; Manuel, L.; Guggisberg, A.G.; Schnider, A. Resting-State Connectivity Predicts Visuo-Motor Skill Learning. NeuroImage 2018, 176, 446–453. [Google Scholar] [CrossRef] [PubMed]
- Cheyne, D.; Ferrari, P. MEG Studies of Motor Cortex Gamma Oscillations: Evidence for a Gamma “Fingerprint” in the Brain? Front. Hum. Neurosci. 2013, 7, 575. [Google Scholar] [CrossRef] [PubMed] [Green Version]
- Bardouille, T.; Boe, S. State-Related Changes in MEG Functional Connectivity Reveal the Task-Positive Sensorimotor Network. PLoS ONE 2012, 7, e48682. [Google Scholar] [CrossRef]
- Perfetti, B.; Moisello, C.; Landsness, E.C.; Kvint, S.; Lanzafame, S.; Onofrj, M.; di Rocco, A.; Tononi, G.; Felice Ghilardi, M. Modulation of Gamma and Theta Spectral Amplitude and Phase Synchronization Is Associated with the Development of Visuo-Motor Learning. J. Neurosci. 2011, 31, 14810–14819. [Google Scholar] [CrossRef] [Green Version]
- Oldfield, R.C. The Assessment and Analysis of Handedness: The Edinburgh Inventory. Neuropsychologia 1971, 9, 97–113. [Google Scholar] [CrossRef]
- Beck, A.T.; Epstein, N.; Brown, G.; Steer, R.A. An Inventory for Measuring Clinical Anxiety: Psychometric Properties. J. Consult. Clin. Psychol. 1988, 56, 893–897. [Google Scholar] [CrossRef]
- Beck, A.T. An Inventory for Measuring Depression. Arch. Gen. Psychiatry 1961, 4, 561. [Google Scholar] [CrossRef] [Green Version]
- Johns, M.W. A New Method for Measuring Daytime Sleepiness: The Epworth Sleepiness Scale. Sleep 1991, 14, 540–545. [Google Scholar] [CrossRef] [Green Version]
- Buysse, D.J.; Reynolds, C.F.; Monk, T.H.; Berman, S.R.; Kupfer, D.J. The Pittsburgh Sleep Quality Index: A New Instrument for Psychiatric Practice and Research. Psychiatry Res. 1989, 28, 193–213. [Google Scholar] [CrossRef]
- Ellis, B.W.; Johns, M.W.; Lancaster, R.; Raptopoulos, P.; Angelopoulos, N.; Priest, R.G. The St. Mary’s Hospital Sleep Questionnaire: A Study of Reliability. Sleep 1981, 4, 93–97. [Google Scholar] [CrossRef] [PubMed]
- Horne, J.A.; Ostberg, O. A Self-Assessment Questionnaire to Determine Morningness-Eveningness in Human Circadian Rhythms. Int. J. Chronobiol. 1976, 4, 97–110. [Google Scholar] [PubMed]
- Faul, F.; Erdfelder, E.; Lang, A.-G.; Buchner, A. G*Power 3: A Flexible Statistical Power Analysis Program for the Social, Behavioral, and Biomedical Sciences. Behav. Res. Methods 2007, 39, 175–191. [Google Scholar] [CrossRef] [PubMed]
- Nissen, M.J.; Bullemer, P. Attentional Requirements of Learning: Evidence from Performance Measures. Cogn. Psychol. 1987, 19, 1–32. [Google Scholar] [CrossRef]
- Dinges, D.F.; Powell, J.W. Microcomputer Analyses of Performance on a Portable, Simple Visual RT Task during Sustained Operations. Behav. Res. Methods Instrum. Comput. 1985, 17, 652–655. [Google Scholar] [CrossRef]
- Maclean, A.W.; Fekken, G.C.; Saskin, P.; Knowles, J.B. Psychometric Evaluation of the Stanford Sleepiness Scale. J. Sleep Res. 1992, 1, 35–39. [Google Scholar] [CrossRef]
- Kleiner, M.; Brainard, D.; Pelli, D.; Ingling, A.; Murray, R.; Broussard, C. What’s New in Psychtoolbox-3? In Proceedings of the Proceedings of the 30th European Conference on Visual Perception, Arezzo, Italy, 27–31 August 2007. [Google Scholar]
- Pan, S.C.; Rickard, T.C. Sleep and Motor Learning: Is There Room for Consolidation? Psychol. Bull. 2015, 141, 812–834. [Google Scholar] [CrossRef] [PubMed]
- Taberna, G.A.; Marino, M.; Ganzetti, M.; Mantini, D. Spatial Localization of EEG Electrodes Using 3D Scanning. J. Neural Eng. 2019, 16, 026020. [Google Scholar] [CrossRef]
- Patanaik, A.; Ong, J.L.; Gooley, J.J.; Ancoli-Israel, S.; Chee, M.W.L. An End-to-End Framework for Real-Time Automatic Sleep Stage Classification. Sleep 2018, 41, zsy041. [Google Scholar] [CrossRef]
- Samogin, J.; Liu, Q.; Marino, M.; Wenderoth, N.; Mantini, D. Shared and Connection-Specific Intrinsic Interactions in the Default Mode Network. NeuroImage 2019, 200, 474–481. [Google Scholar] [CrossRef]
- Liu, Q.; Balsters, J.H.; Baechinger, M.; van der Groen, O.; Wenderoth, N.; Mantini, D. Estimating a Neutral Reference for Electroencephalographic Recordings: The Importance of Using a High-Density Montage and a Realistic Head Model. J. Neural Eng. 2015, 12, 056012. [Google Scholar] [CrossRef] [PubMed]
- Mantini, D.; Franciotti, R.; Romani, G.L.; Pizzella, V. Improving MEG Source Localizations: An Automated Method for Complete Artifact Removal Based on Independent Component Analysis. NeuroImage 2008, 40, 160–173. [Google Scholar] [CrossRef] [PubMed]
- Haueisen, J.; Ramon, C.; Eiselt, M.; Brauer, H.; Nowak, H. Influence of Tissue Resistivities on Neuromagnetic Fields and Electric Potentials Studied with a Finite Element Model of the Head. IEEE Trans. Biomed. Eng. 1997, 44, 727–735. [Google Scholar] [CrossRef] [PubMed]
- Wolters, C.H.; Grasedyck, L.; Hackbusch, W. Efficient Computation of Lead Field Bases and Influence Matrix for the FEM-Based EEG and MEG Inverse Problem. Inverse Probl. 2004, 20, 1099–1116. [Google Scholar] [CrossRef]
- Ziegler, E.; Chellappa, S.L.; Gaggioni, G.; Ly, J.Q.M.; Vandewalle, G.; André, E.; Geuzaine, C.; Phillips, C. A Finite-Element Reciprocity Solution for EEG Forward Modeling with Realistic Individual Head Models. NeuroImage 2014, 103, 542–551. [Google Scholar] [CrossRef] [PubMed] [Green Version]
- Pascual-Marqui, R.D.; Lehmann, D.; Koukkou, M.; Kochi, K.; Anderer, P.; Saletu, B.; Tanaka, H.; Hirata, K.; John, E.R.; Prichep, L.; et al. Assessing Interactions in the Brain with Exact Low-Resolution Electromagnetic Tomography. Philos. Trans. R. Soc. A Math. Phys. Eng. Sci. 2011, 369, 3768–3784. [Google Scholar] [CrossRef] [PubMed]
- Tamaki, M.; Huang, T.-R.; Yotsumoto, Y.; Hamalainen, M.; Lin, F.-H.; Nanez, J.E.; Watanabe, T.; Sasaki, Y. Enhanced Spontaneous Oscillations in the Supplementary Motor Area Are Associated with Sleep-Dependent Offline Learning of Finger-Tapping Motor-Sequence Task. J. Neurosci. 2013, 33, 13894–13902. [Google Scholar] [CrossRef] [Green Version]
- Grootswagers, T.; Cichy, R.M.; Carlson, T.A. Finding Decodable Information That Can Be Read out in Behaviour. NeuroImage 2018, 179, 252–262. [Google Scholar] [CrossRef]
- Mantini, D.; Perrucci, M.G.; Del Gratta, C.; Romani, G.L.; Corbetta, M. Electrophysiological Signatures of Resting State Networks in the Human Brain. Proc. Natl. Acad. Sci. USA 2007, 104, 13170–13175. [Google Scholar] [CrossRef] [Green Version]
- Hipp, J.F.; Hawellek, D.J.; Corbetta, M.; Siegel, M.; Engel, A.K. Large-Scale Cortical Correlation Structure of Spontaneous Oscillatory Activity. Nat. Neurosci. 2012, 15, 884–890. [Google Scholar] [CrossRef] [Green Version]
- Benjamini, Y.; Hochberg, Y. Controlling the False Discovery Rate: A Practical and Powerful Approach to Multiple Testing. J. R. Stat. Soc. Ser. B 1995, 57, 289–300. [Google Scholar] [CrossRef]
- Bechtold, Bastian. Violin Plots for Matlab, Github Project. 2016. Available online: https://github.com/bastibe/Violinplot-Matlab (accessed on 18 April 2022). [CrossRef]
- Nowak, M.; Zich, C.; Stagg, C.J. Motor Cortical Gamma Oscillations: What Have We Learnt and Where Are We Headed? Curr. Behav. Neurosci. Rep. 2018, 5, 136–142. [Google Scholar] [CrossRef]
- Cheyne, D.; Bells, S.; Ferrari, P.; Gaetz, W.; Bostan, A.C. Self-Paced Movements Induce High-Frequency Gamma Oscillations in Primary Motor Cortex. NeuroImage 2008, 42, 332–342. [Google Scholar] [CrossRef]
- Gaetz, W.; Liu, C.; Zhu, H.; Bloy, L.; Roberts, T.P.L. Evidence for a Motor Gamma-Band Network Governing Response Interference. NeuroImage 2013, 74, 245–253. [Google Scholar] [CrossRef] [Green Version]
- Dalal, S.S.; Guggisberg, A.G.; Edwards, E.; Sekihara, K.; Findlay, A.M.; Canolty, R.T.; Berger, M.S.; Knight, R.T.; Barbaro, N.M.; Kirsch, H.E.; et al. Five-Dimensional Neuroimaging: Localization of the Time-Frequency Dynamics of Cortical Activity. NeuroImage 2008, 40, 1686–1700. [Google Scholar] [CrossRef] [Green Version]
- Muthukumaraswamy, S.D. Functional Properties of Human Primary Motor Cortex Gamma Oscillations. J. Neurophysiol. 2010, 104, 2873–2885. [Google Scholar] [CrossRef] [Green Version]
- Joundi, R.A.; Jenkinson, N.; Brittain, J.S.; Aziz, T.Z.; Brown, P. Driving Oscillatory Activity in the Human Cortex Enhances Motor Performance. Curr. Biol. 2012, 22, 403–407. [Google Scholar] [CrossRef] [Green Version]
- Moisa, M.; Polania, R.; Grueschow, M.; Ruff, C.C. Brain Network Mechanisms Underlying Motor Enhancement by Transcranial Entrainment of Gamma Oscillations. J. Neurosci. 2016, 36, 12053–12065. [Google Scholar] [CrossRef] [Green Version]
- Lisman, J. Working Memory: The Importance of Theta and Gamma Oscillations. Curr. Biol. 2010, 20, R490–R492. [Google Scholar] [CrossRef] [Green Version]
- Sauseng, P.; Griesmayr, B.; Freunberger, R.; Klimesch, W. Control Mechanisms in Working Memory: A Possible Function of EEG Theta Oscillations. Neurosci. Biobehav. Rev. 2010, 34, 1015–1022. [Google Scholar] [CrossRef]
- Hikosaka, O.; Nakamura, K.; Sakai, K.; Nakahara, H. Central Mechanisms of Motor Skill Learning. Curr. Opin. Neurobiol. 2002, 12, 217–222. [Google Scholar] [CrossRef]
- Backus, A.R.; Schoffelen, J.-M.; Szebényi, S.; Hanslmayr, S.; Doeller, C.F. Hippocampal-Prefrontal Theta Oscillations Support Memory Integration. Curr. Biol. 2016, 26, 450–457. [Google Scholar] [CrossRef] [Green Version]
- Lega, B.C.; Jacobs, J.; Kahana, M. Human Hippocampal Theta Oscillations and the Formation of Episodic Memories. Hippocampus 2012, 22, 748–761. [Google Scholar] [CrossRef]
- Meyer, L.; Grigutsch, M.; Schmuck, N.; Gaston, P.; Friederici, A.D. Frontal-Posterior Theta Oscillations Reflect Memory Retrieval during Sentence Comprehension. Cortex 2015, 71, 205–218. [Google Scholar] [CrossRef]
- Jacobs, J.; Hwang, G.; Curran, T.; Kahana, M.J. EEG Oscillations and Recognition Memory: Theta Correlates of Memory Retrieval and Decision Making. NeuroImage 2006, 32, 978–987. [Google Scholar] [CrossRef]
- Vivekananda, U.; Bush, D.; Bisby, J.A.; Baxendale, S.; Rodionov, R.; Diehl, B.; Chowdhury, F.A.; McEvoy, A.W.; Miserocchi, A.; Walker, M.C.; et al. Theta Power and Theta-Gamma Coupling Support Long-Term Spatial Memory Retrieval. Hippocampus 2021, 31, 213–220. [Google Scholar] [CrossRef]
- Kaplan, R.; Bush, D.; Bonnefond, M.; Bandettini, P.A.; Barnes, G.R.; Doeller, C.F.; Burgess, N. Medial Prefrontal Theta Phase Coupling during Spatial Memory Retrieval. Hippocampus 2014, 24, 656–665. [Google Scholar] [CrossRef] [Green Version]
- Sachdev, R.N.S.; Gaspard, N.; Gerrard, J.L.; Hirsch, L.J.; Spencer, D.D.; Zaveri, H.P. Delta Rhythm in Wakefulness: Evidence from Intracranial Recordings in Human Beings. J. Neurophysiol. 2015, 114, 1248–1254. [Google Scholar] [CrossRef] [Green Version]
- Holz, J.; Piosczyk, H.; Feige, B.; Spiegelhalder, K.; Baglioni, C.; Riemann, D.; Nissen, C. EEG Sigma and Slow-Wave Activity during NREM Sleep Correlate with Overnight Declarative and Procedural Memory Consolidation. J. Sleep Res. 2012, 21, 612–619. [Google Scholar] [CrossRef]
- Helfrich, R.F.; Lendner, J.D.; Mander, B.A.; Guillen, H.; Paff, M.; Mnatsakanyan, L.; Vadera, S.; Walker, M.P.; Lin, J.J.; Knight, R.T. Bidirectional Prefrontal-Hippocampal Dynamics Organize Information Transfer during Sleep in Humans. Nat. Commun. 2019, 10, 3572. [Google Scholar] [CrossRef]
- Murphy, M.; Riedner, B.A.; Huber, R.; Massimini, M.; Ferrarelli, F.; Tononi, G. Source Modeling Sleep Slow Waves. Proc. Natl. Acad. Sci. USA 2009, 106, 1608–1613. [Google Scholar] [CrossRef] [Green Version]
- Pfurtscheller, G.; Lopes da Silva, F.H. Event-Related EEG/MEG Synchronization and Desynchronization: Basic Principles. Clin. Neurophysiol. 1999, 110, 1842–1857. [Google Scholar] [CrossRef]
- Stillman, C.M.; Gordon, E.M.; Simon, J.R.; Vaidya, C.J.; Howard, D.V.; Howard, J.H. Caudate Resting Connectivity Predicts Implicit Probabilistic Sequence Learning. Brain Connect. 2013, 3, 601–610. [Google Scholar] [CrossRef] [Green Version]
- Albouy, G.; Fogel, S.; King, B.R.; Laventure, S.; Benali, H.; Karni, A.; Carrier, J.; Robertson, E.M.; Doyon, J. Maintaining vs. Enhancing Motor Sequence Memories: Respective Roles of Striatal and Hippocampal Systems. NeuroImage 2015, 108, 423–434. [Google Scholar] [CrossRef]


| Behavioral Analyses | Sample Size |
|---|---|
| Task Training | n = 24 |
| Task Retest | n = 20 |
| EEG Analyses | |
| Pre-Post | n = 21 |
| Correlation with online gains | n = 18 |
| Correlations with offline gains | n = 15 |
| Seed | MNI Coordinates | |||
|---|---|---|---|---|
| X | Y | Z | ||
| lANG | −57 | −63 | 17 | DMN |
| rANG | 56 | −63 | 18 | |
| PCC | 5 | −58 | 29 | |
| MPFC | −5 | 35 | −9 | |
| lIPS | −27 | −61 | 50 | DAN |
| rIPS | 26 | −60 | 48 | |
| lFEF | −30 | −9 | 52 | |
| rFEF | 30 | −9 | 55 | |
| rTPJ | 60 | −43 | 16 | VAN |
| rIFG | 42 | 5 | 1 | |
| lTPJ | −54 | −33 | −4 | LANG |
| lIFG | −47 | 14 | 1 | |
| lSMA | −1 | −17 | 55 | MOT |
| lCS | −45 | −17 | 49 | |
| rCS | 45 | −17 | 49 | |
| lS2 | −42 | −13 | 10 | |
| rS2 | 42 | −13 | 10 | |
| lV1V2 | −27 | −81 | −13 | VIS |
| rV1V2 | 27 | −81 | −13 | |
| lMT | −45 | −81 | 4 | |
| rMT | 45 | −81 | 4 | |
Publisher’s Note: MDPI stays neutral with regard to jurisdictional claims in published maps and institutional affiliations. |
© 2022 by the authors. Licensee MDPI, Basel, Switzerland. This article is an open access article distributed under the terms and conditions of the Creative Commons Attribution (CC BY) license (https://creativecommons.org/licenses/by/4.0/).
Share and Cite
Titone, S.; Samogin, J.; Peigneux, P.; Swinnen, S.; Mantini, D.; Albouy, G. Connectivity in Large-Scale Resting-State Brain Networks Is Related to Motor Learning: A High-Density EEG Study. Brain Sci. 2022, 12, 530. https://doi.org/10.3390/brainsci12050530
Titone S, Samogin J, Peigneux P, Swinnen S, Mantini D, Albouy G. Connectivity in Large-Scale Resting-State Brain Networks Is Related to Motor Learning: A High-Density EEG Study. Brain Sciences. 2022; 12(5):530. https://doi.org/10.3390/brainsci12050530
Chicago/Turabian StyleTitone, Simon, Jessica Samogin, Philippe Peigneux, Stephan Swinnen, Dante Mantini, and Genevieve Albouy. 2022. "Connectivity in Large-Scale Resting-State Brain Networks Is Related to Motor Learning: A High-Density EEG Study" Brain Sciences 12, no. 5: 530. https://doi.org/10.3390/brainsci12050530