
The Percentages of Cognitive Skills Deficits among Chinese Children with Developmental Dyslexia: A Systematic Review and Meta-Analysis

Abstract
:1. Introduction
2. Materials and Methods
2.1. Search Strategy and Procedure
2.2. Inclusion and Exclusion Criteria
2.3. Recorded Variables and Coding
2.3.1. Coding Procedure
2.3.2. Variables
2.4. Statistical Analysis
3. Results
3.1. Study Characteristics
3.2. Pooled Percentage
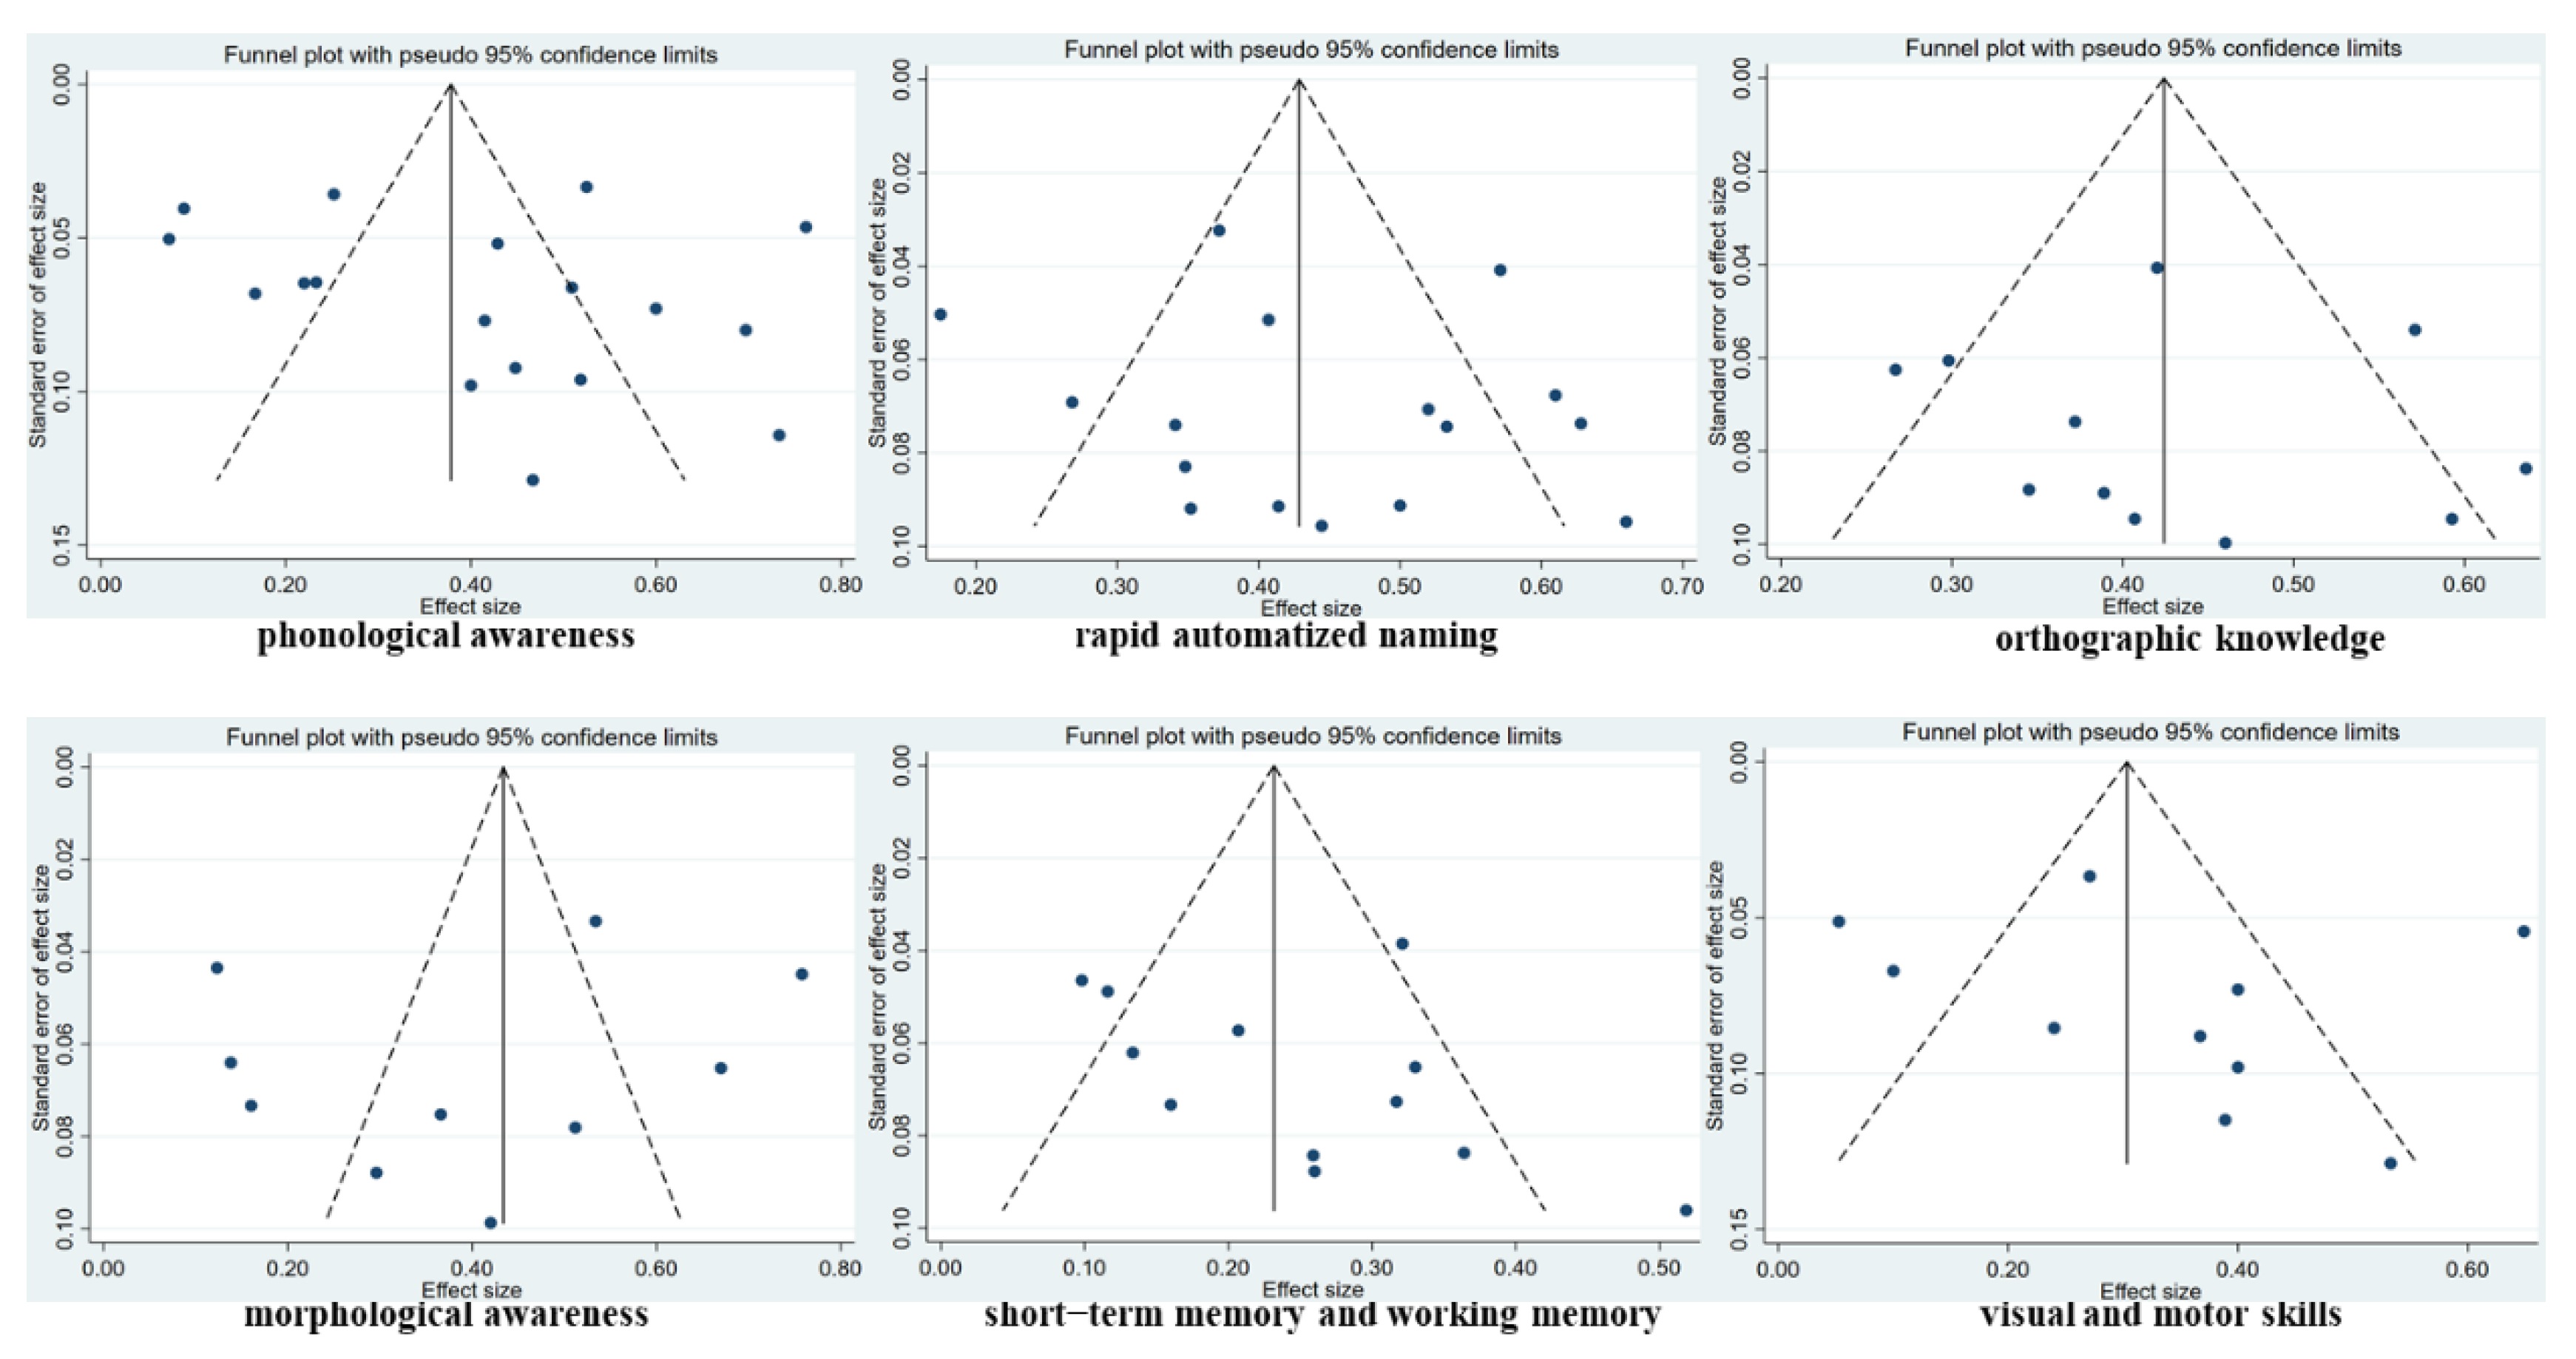
3.2.1. Phonological Awareness
3.2.2. Rapid Automatized Naming
3.2.3. Orthographic Knowledge
3.2.4. Morphological Awareness
3.2.5. Short-Term Memory and Working Memory
3.2.6. Visual and Motor Skills
4. Discussion
4.1. Pooled Percentage
4.2. Type of Control Group
4.3. Age, Location and Standard
4.4. Limitations
5. Conclusions
Author Contributions
Funding
Institutional Review Board Statement
Informed Consent Statement
Data Availability Statement
Conflicts of Interest
Appendix A

| Section and Topic | Item # | Checklist Item | Location Where Item Is Reported |
|---|---|---|---|
| TITLE | |||
| Title | 1 | Identify the report as a systematic review. | Title: Row 1 through 3 |
| ABSTRACT | |||
| Abstract | 2 | See the PRISMA 2020 for Abstracts checklist. | Abstract: Row 9 through 19 |
| INTRODUCTION | |||
| Rationale | 3 | Describe the rationale for the review in the context of existing knowledge. | 1. Introduction |
| Objectives | 4 | Provide an explicit statement of the objective(s) or question(s) the review addresses. | 1. Introduction |
| METHODS | |||
| Eligibility criteria | 5 | Specify the inclusion and exclusion criteria for the review and how studies were grouped for the syntheses. | 2.2. Inclusion and exclusion criteria |
| Information sources | 6 | Specify all databases, registers, websites, organizations, reference lists and other sources searched or consulted to identify studies. Specify the date when each source was last searched or consulted. | 2.1. Search strategy and procedure |
| Search strategy | 7 | Present the full search strategies for all databases, registers and websites, including any filters and limits used. | 2.1. Search strategy and procedure |
| Selection process | 8 | Specify the methods used to decide whether a study met the inclusion criteria of the review, including how many reviewers screened each record and each report retrieved, whether they worked independently, and if applicable, details of automation tools used in the process. | 2.2. Inclusion and exclusion criteria |
| Data collection process | 9 | Specify the methods used to collect data from reports, including how many reviewers collected data from each report, whether they worked independently, any processes for obtaining or confirming data from study investigators, and if applicable, details of automation tools used in the process. | 2.3.1. Coding procedure |
| Data items | 10a | List and define all outcomes for which data were sought. Specify whether all results that were compatible with each outcome domain in each study were sought (e.g., for all measures, time points, analyses), and if not, the methods used to decide which results to collect. | 2.3.2. Variables |
| 10b | List and define all other variables for which data were sought (e.g., participant and intervention characteristics, funding sources). Describe any assumptions made about any missing or unclear information. | 2.3. Recorded variables and coding | |
| Study risk of bias assessment | 11 | Specify the methods used to assess risk of bias in the included studies, including details of the tool(s) used, how many reviewers assessed each study and whether they worked independently, and if applicable, details of automation tools used in the process. | 2.4. Statistical analysis |
| Effect measures | 12 | Specify for each outcome the effect measure(s) (e.g., risk ratio, mean difference) used in the synthesis or presentation of results. | 3.2. Pooled percentage |
| Synthesis methods | 13a | Describe the processes used to decide which studies were eligible for each synthesis (e.g., tabulating the study intervention characteristics and comparing against the planned groups for each synthesis (item #5)). | 3.1. Study characteristics |
| 13b | Describe any methods required to prepare the data for presentation or synthesis, such as the handling of missing summary statistics, or data conversions. | 3.1. Study characteristics | |
| 13c | Describe any methods used to tabulate or visually display results of individual studies and syntheses. | 3.1. Study characteristics | |
| 13d | Describe any methods used to synthesize results and provide a rationale for the choice(s). If a meta-analysis was performed, describe the model(s), method(s) to identify the presence and extent of statistical heterogeneity, and software package(s) used. | 2.4. Statistical analysis | |
| 13e | Describe any methods used to explore the possible causes of heterogeneity among the study results (e.g., subgroup analysis, meta-regression). | 2.4. Statistical analysis | |
| 13f | Describe any sensitivity analyses conducted to assess the robustness of the synthesized results. | 3.2. Pooled percentage | |
| Reporting bias assessment | 14 | Describe any methods used to assess risk of bias due to missing results in a synthesis (arising from reporting biases). | 2.4. Statistical analysis |
| Certainty assessment | 15 | Describe any methods used to assess certainty (or confidence) in the body of evidence for an outcome. | 2.4. Statistical analysis |
| RESULTS | |||
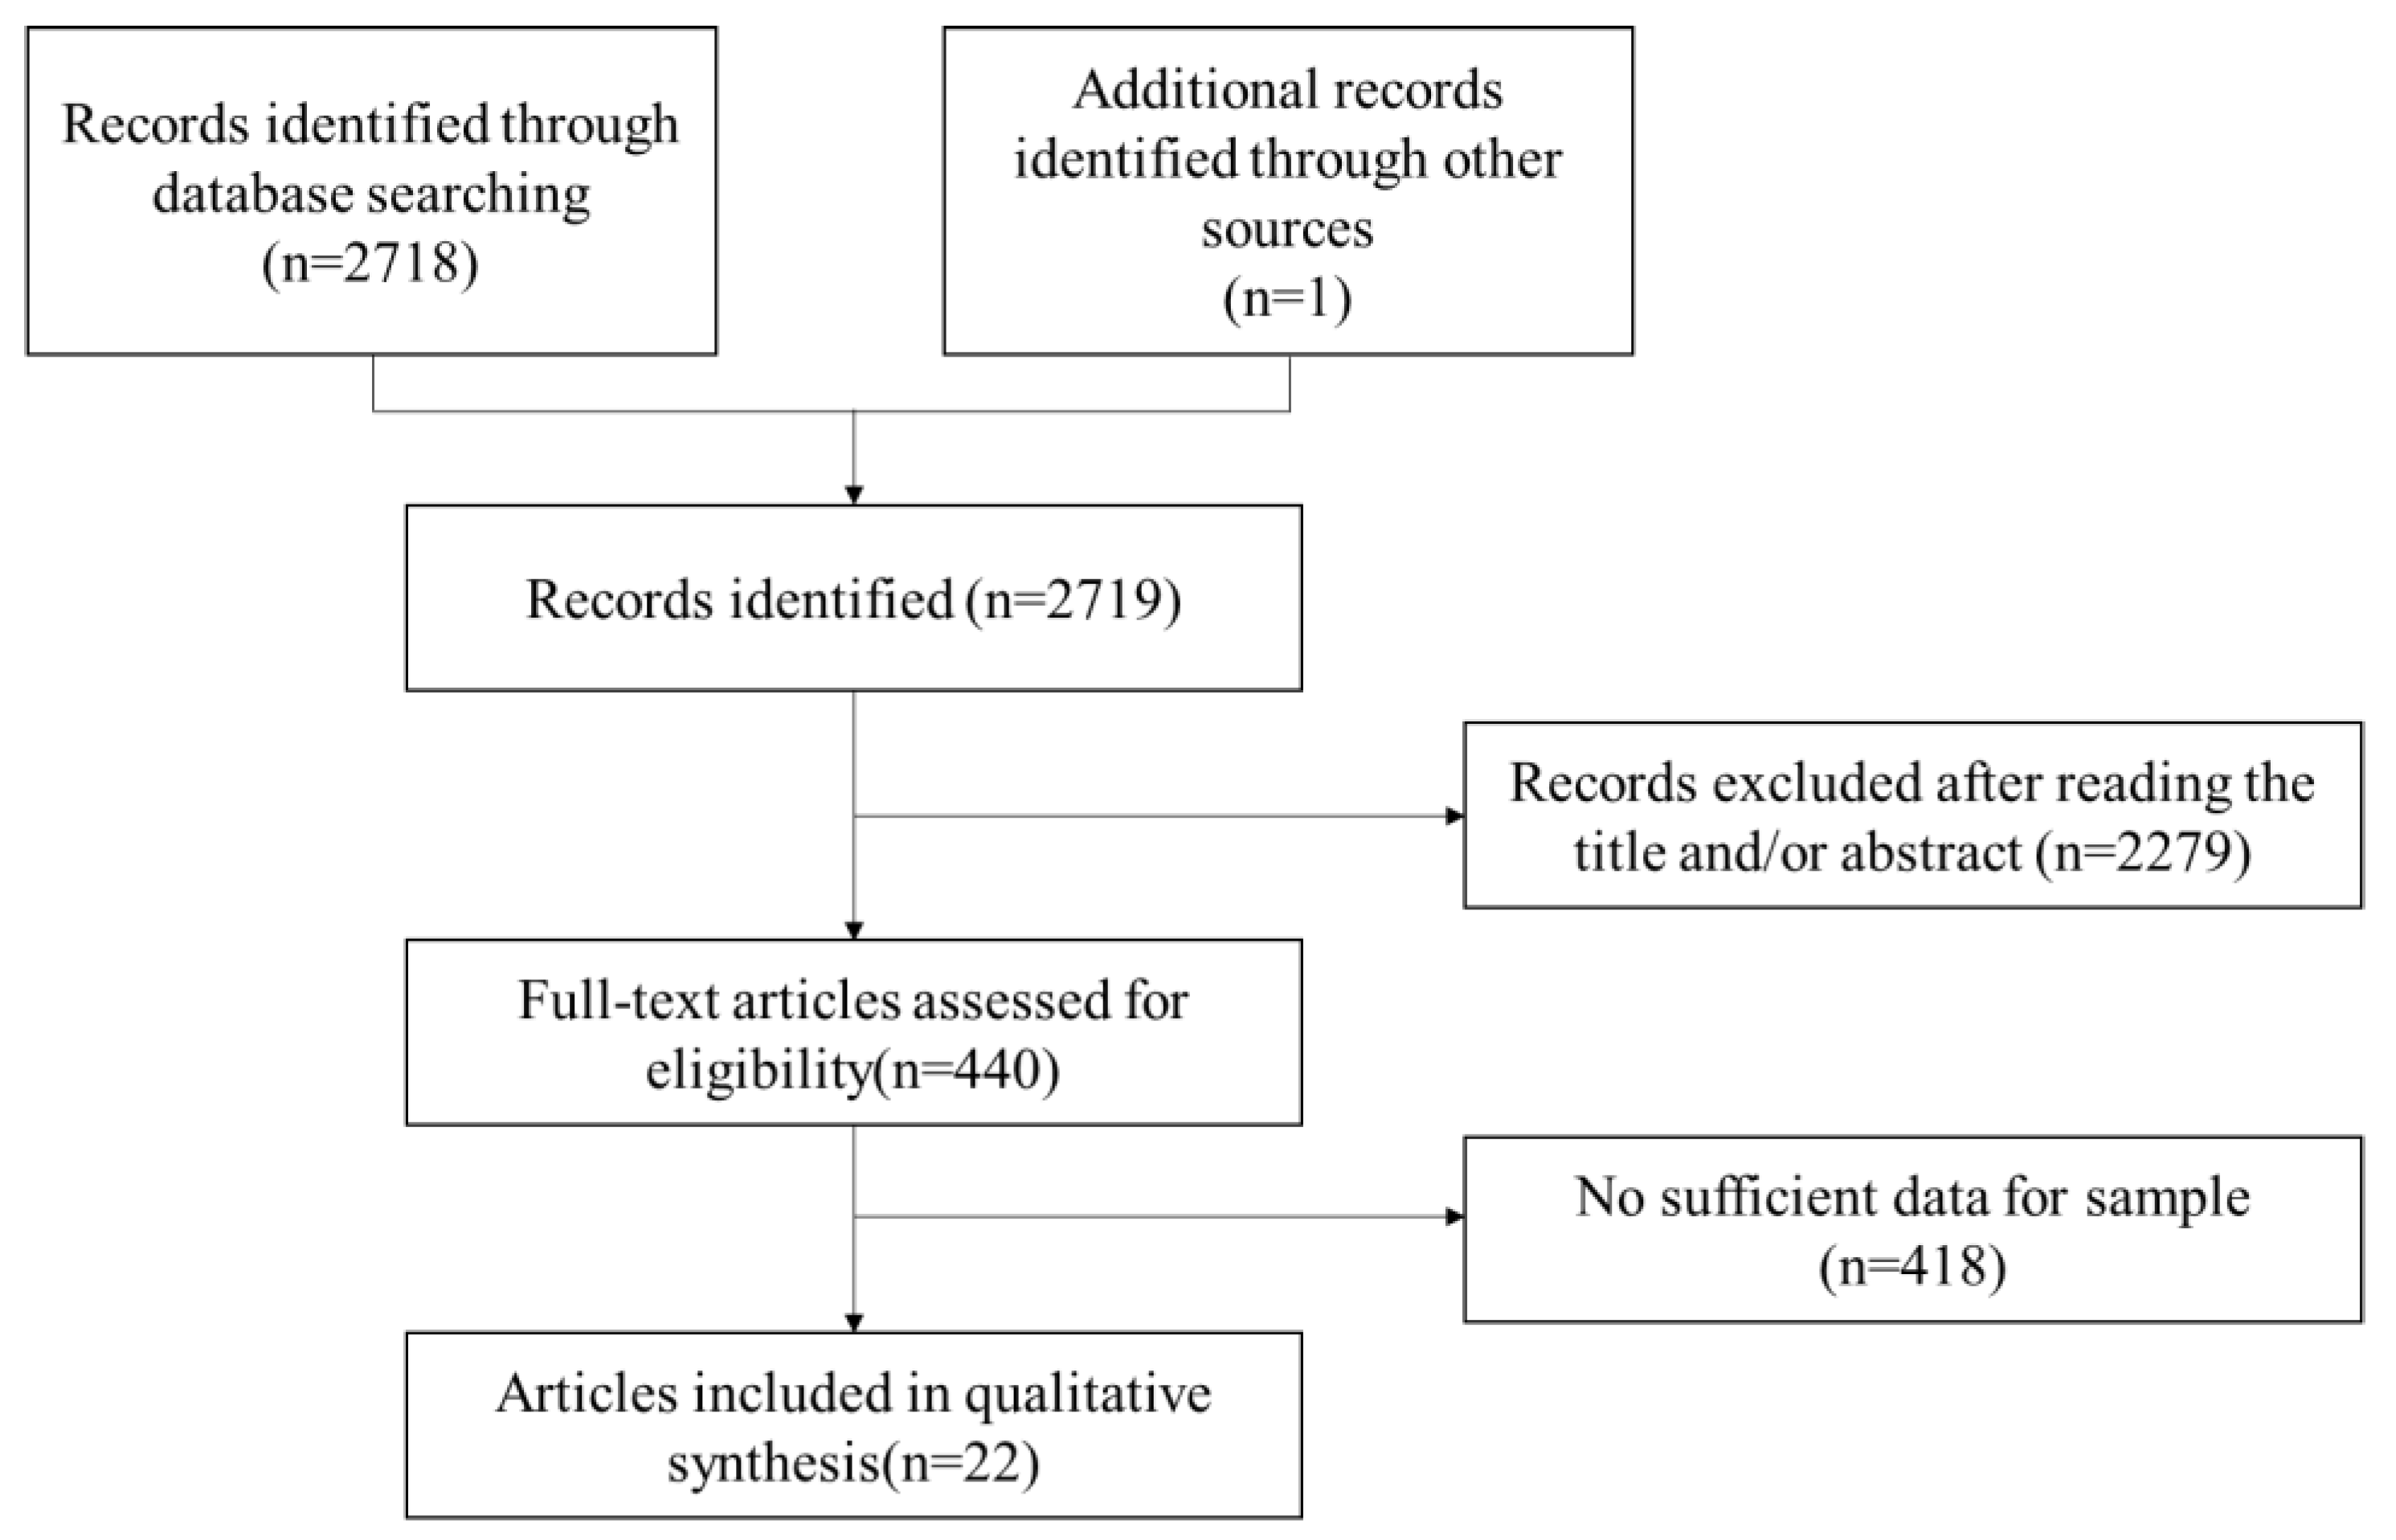
| Study selection | 16a | Describe the results of the search and selection process, from the number of records identified in the search to the number of studies included in the review, ideally using a flow diagram. | 3. Results |
| 16b | Cite studies that might appear to meet the inclusion criteria, but were excluded, and explain why they were excluded. | 3. Results | |
| Study characteristics | 17 | Cite each included study and present its characteristics. | 3.1. Study characteristics |
| Risk of bias in studies | 18 | Present assessments of risk of bias for each included study. | 3.2. Pooled percentage |
| Results of individual studies | 19 | For all outcomes present for each study: (a) summary statistics for each group (where appropriate) and (b) an effect estimate and its precision (e.g., confidence/credible interval), ideally using structured tables or plots. | 3.2. Pooled percentage |
| Results of syntheses | 20a | For each synthesis, briefly summarize the characteristics and risk of bias among contributing studies. | 3.2. Pooled percentage |
| 20b | Present results of all statistical syntheses conducted. If meta-analysis was carried out, present for each the summary estimate and its precision (e.g., confidence/credible interval) and measures of statistical heterogeneity. If comparing groups, describe the direction of the effect. | 3.2. Pooled percentage | |
| 20c | Present results of all investigations of the possible causes of heterogeneity among study results. | 3.2. Pooled percentage | |
| 20d | Present results of all sensitivity analyses conducted to assess the robustness of the synthesized results. | 3.2. Pooled percentage | |
| Reporting biases | 21 | Present assessments of risk of bias due to missing results (arising from reporting biases) for each synthesis assessed. | 3.2. Pooled percentage |
| Certainty of evidence | 22 | Present assessments of certainty (or confidence) in the body of evidence for each outcome assessed. | 3.2. Pooled percentage |
| DISCUSSION | |||
| Discussion | 23a | Provide a general interpretation of the results in the context of other evidence. | 4. Discussion |
| 23b | Discuss any limitations of the evidence included in the review. | 4.4. Limitations | |
| 23c | Discuss any limitations of the review processes used. | 4.4. Limitations | |
| 23d | Discuss implications of the results for practice, policy, and future research. | 5. Conclusions | |
| OTHER INFORMATION | |||
| Registration and protocol | 24a | Provide registration information for the review, including register name and registration number, or state that the review was not registered. | 2.1. Search strategy and procedure |
| 24b | Indicate where the review protocol can be accessed, or state that a protocol was not prepared. | 2.1. Search strategy and procedure | |
| 24c | Describe and explain any amendments to the information provided at registration or in the protocol. | 2.1. Search strategy and procedure | |
| Support | 25 | Describe sources of financial or non-financial support for the review, and the role of the funders or sponsors in the review. | Institutional Review Board Statement |
| Competing interests | 26 | Declare any competing interests of the review authors. | Conflicts of Interest |
| Availability of data, code and other materials | 27 | Report which of the following are publicly available and where they can be found; template data collection forms; data extracted from included studies; data used for all analyses; analytic code; any other materials used in the review. | Data Availability Statement |

References
- Ring, J.; Black, J.L. The multiple deficit model of dyslexia: What does it mean for identification and intervention? Ann. Dyslexia 2018, 68, 104–125. [Google Scholar] [CrossRef]
- Stevenson, H.W.; Stigler, J.W.; Lucker, G.W.; Lee, S.Y.; Hsu, C.C.; Kitamura, S. Reading disabilities: The case of Chinese, Japanese, and English. Child Dev. 1982, 53, 1164–1181. [Google Scholar] [CrossRef] [PubMed]
- Zhang, C.F.; Zhang, J.; Yin, R. Experimental research on the reading disability of Chinese students. Psychol. Sci. 1996, 19, 222–226. [Google Scholar]
- Peng, P.; Tao, S.; Li, B.L. The deficit profile of working memory, inhibition, and updating in Chinese children with reading difficulties. Learn. Individ. Differ. 2013, 25, 111–117. [Google Scholar] [CrossRef]
- Shu, H.; McBride-Chang, C.; Wu, S.; Liu, H. Understanding Chinese developmental dyslexia: Morphological awareness as a core cognitive construct. J. Educ. Psychol. 2006, 98, 122–133. [Google Scholar] [CrossRef] [Green Version]
- Peng, P.; Wang, C.; Tao, S.; Sun, C. The Deficit Profiles of Chinese Children with Reading Difficulties: A Meta-analysis. Educ. Psychol. Rev. 2017, 29, 513–564. [Google Scholar] [CrossRef]
- Tamer, A.E.; Rawhia, A.; Haidy, E.H. Assessment of Arabic phonological awareness and its relation to word reading ability. Logop. Phoniatr. Vocol. 2016, 41, 174–180. [Google Scholar]
- Denckla, M.B.; Rudel, R.G. Rapid ‘automatized’ naming (R.A.N.): Dyslexia differentiated from other learning disabilities. Neuropsychologia 1976, 14, 471–479. [Google Scholar] [CrossRef]
- Apel, K. What Is Orthographic Knowledge? Lang. Speech Hear. Serv. Sch. 2011, 42, 592. [Google Scholar] [CrossRef]
- Kuo, L.J.; Anderson, R.C. Morphological Awareness and Learning to Read: A Cross-Language Perspective. Educ. Psychol. 2006, 41, 161–180. [Google Scholar] [CrossRef]
- Ho, C.S.H.; Chan, D.W.-O.; Lee, S.-H.; Tsang, S.-M.; Luan, V.H. Cognitive profiling and preliminary subtyping in Chinese developmental dyslexia. Cognition 2004, 91, 43–75. [Google Scholar] [CrossRef]
- Chung, K.K.H.; Lo, J.C.M.; McBride, C. Cognitive-linguistic profiles of Chinese typical-functioning adolescent dyslexics and high-functioning dyslexics. Ann. Dyslexia 2018, 68, 229–250. [Google Scholar] [CrossRef] [PubMed]
- Liu, W.; Liu, X.; Zhang, J. A Preliminary Study Subtypes of Chinese Developmental Dyslexia. Acta Psychol. Sin. 2006, 38, 681–693. [Google Scholar]
- Yang, L.; Li, C.; Li, X.; Zhai, M.; An, Q.; Zhang, Y.; Zhao, J.; Weng, X. Prevalence of Developmental Dyslexia in Primary School Children: A Systematic Review and Meta-Analysis. Brain Sci. 2022, 12, 240. [Google Scholar] [CrossRef] [PubMed]
- Cheung, H.; Chung, K.K.; Wong, S.W.; McBride-Chang, C.; Penney, T.B.; Ho, C.S. Perception of tone and aspiration contrasts in Chinese children with dyslexia. J. Child Psychol. Psychiatry 2009, 50, 726–733. [Google Scholar] [CrossRef] [PubMed]
- Goswami, U.; Bryant, P. The interpretation of studies using the reading level design. J. Read. Behav. 1989, 21, 413–424. [Google Scholar] [CrossRef] [Green Version]
- Xiong, J.; Yan, G. Analysis of the Main Subtypes of Chinese Developmental Dyslexia. Stud. Psychol. Behav. 2014, 12, 496–500. [Google Scholar]
- Wang, X.; Li, Q.; Deng, C. An Experimental Study on the Phonetic Processing and Orthographic Processing Deficit of the Chinese Reading Disability. J. Psychol. Sci. 2014, 37, 803–808. [Google Scholar]
- Wu, S.; Shu, H.; Wang, Y. The Heterogeneity of Chinese Developmental Dyslexia. Psychol. Dev. Educ. 2004, 3, 46–50. [Google Scholar]
- Peng, H.; Liang, W.L.; Zhang, Z.X.; Li, H.; Shu, H.; Tardif, T.; Fletcher, P. Screen of Chinese Reading at-risk children. Psychol. Dev. Educ. 2007, 23, 89–92. [Google Scholar]
- Li, H.; Shu, H. The Linguistic Cognitive Deficiency of Developmental Dyslexic Children. Psychol. Sci. 2009, 32, 301–303+300. [Google Scholar]
- Meng, X.; Zhou, X.; Zeng, B.; Kong, R.; Zhuang, J. Visual Perceptual Skills and Reading Abilities in Chinese Speaking Children. Acta Psychol. Sin. 2002, 34, 16–22. [Google Scholar]
- Wu, S.; Shu, H.; Liu, Y. The Role of Morphological Awareness in Chinese Children Reading. Stud. Psychol. Behav. 2005, 3, 35–38. [Google Scholar]
- Chen, H.; Yang, Z.; Tang, X. Subtypes of Reading Disorders in Chinese Children. Chin. Ment. Health J. 2002, 16, 52–54. [Google Scholar]
- Ho, C.S.H.; Chan, D.W.O.; Tsang, S.M.; Lee, S.H. The cognitive profile and multiple-deficit hypothesis in Chinese developmental dyslexia. Dev. Psychol. 2002, 38, 543–553. [Google Scholar] [CrossRef]
- Chen, N.T.; Zheng, M.; Ho, C.S.H. Examining the visual attention span deficit hypothesis in Chinese developmental dyslexia. Read. Writ. 2019, 32, 639–662. [Google Scholar] [CrossRef]
- Song, S.; Zhang, Y.; Shu, H.; Su, M.; McBride, C. Universal and Specific Predictors of Chinese Children with Dyslexia – Exploring the Cognitive Deficits and Subtypes. Front. Psychol. 2020, 10, 2904. [Google Scholar] [CrossRef] [PubMed] [Green Version]
- Huo, S.; Wu, K.C.; Mo, J.; Wang, J.; Maurer, U. Children with Chinese Dyslexia Acquiring English Literacy: Interaction Between Cognitive Subtypes of Dyslexia and Orthographies. J. Learn. Disabil. 2021, 55, 229–241. [Google Scholar] [CrossRef]
- Li, H.; Shu, H.; McBride-Chang, C.; Liu, H.Y.; Xue, J. Paired associate learning in Chinese children with dyslexia. J. Exp. Child Psychol. 2009, 103, 135–151. [Google Scholar] [CrossRef] [PubMed]
- Chung, K.K.H.; Ho, C.S.-H.; Chan, D.W.; Tsang, S.-M.; Lee, S.-H. Cognitive Profiles of Chinese Adolescents with Dyslexia. Dyslexia 2010, 16, 2–23. [Google Scholar] [CrossRef] [PubMed]
- Chung, K.K.H.; Lo, J.C.M.; Ho, C.S.-H.; Xiao, X.; Chan, D.W. Syntactic and discourse skills in Chinese adolescent readers with dyslexia: A profiling study. Ann. Dyslexia 2014, 64, 222–247. [Google Scholar] [CrossRef] [PubMed]
- Wang, X.; Georgiou, G.K.; Das, J.P.; Li, Q. Cognitive Processing Skills and Developmental Dyslexia in Chinese. J. Learn. Disabil. 2012, 45, 526–537. [Google Scholar] [CrossRef] [PubMed]
- Chan, W.S.R.; Hung, S.F.; Liu, S.N.; Lee, C.K.K. Cognitive profiling in Chinese developmental dyslexia with attention-deficit/hyperactivity disorders. Read. Writ. 2008, 21, 661–674. [Google Scholar] [CrossRef]
- Zhao, J.; Liu, M.; Liu, H.; Huang, C. Increased deficit of visual attention span with development in Chinese children with developmental dyslexia. Sci. Rep. 2018, 8, 3153. [Google Scholar] [CrossRef] [PubMed] [Green Version]
- Cheng, C.; Yao, Y.; Wang, Z.; Zhao, J. Visual attention span and phonological skills in Chinese developmental dyslexia. Res. Dev. Disabil. 2021, 116, 104015. [Google Scholar] [CrossRef] [PubMed]
- Song, S.; Georgiou, G.K.; Su, M.; Hua, S. How Well Do Phonological Awareness and Rapid Automatized Naming Correlate with Chinese Reading Accuracy and Fluency? A Meta-Analysis. Sci. Stud. Read. 2016, 20, 99–123. [Google Scholar] [CrossRef]
- McBride-Chang, C.; Ho, C.S.H. Developmental issues in Chinese children’s character acquisition. J. Educ. Psychol. 2000, 92, 50–55. [Google Scholar] [CrossRef]
- Wolf, M. A Provisional, Integrative Account of Phonological and Naming-Speed Deficits in Dyslexia: Implications for Diagnosis and Intervention; Routledge: New York, NY, USA, 1997. [Google Scholar]
- Bosse, M.L.; Tainturier, M.J.; Valdois, S. Developmental dyslexia: The visual attention span deficit hypothesis. Cognition 2007, 104, 198–230. [Google Scholar] [CrossRef] [PubMed] [Green Version]
- Franceschini, S.; Gori, S.; Ruffino, M.; Pedrolli, K.; Facoetti, A. A Causal Link between Visual Spatial Attention and Reading Acquisition. Curr. Biol. 2012, 22, 814–819. [Google Scholar] [CrossRef] [PubMed] [Green Version]
- Lei, L.; Pan, J.; Liu, H.; McBride-Chang, C.; Li, H.; Zhang, Y.; Chen, L.; Tardif, T.; Liang, W.; Zhang, Z.; et al. Developmental trajectories of reading development and impairment from ages 3 to 8 years in Chinese children. J. Child Psychol. Psychiatry 2011, 52, 212–220. [Google Scholar] [CrossRef] [Green Version]
- Majeed, N.M.; Hartanto, A.; Tan, J.J.X. Developmental dyslexia and creativity: A meta-analysis. Dyslexia 2021, 27, 187–203. [Google Scholar] [CrossRef] [PubMed]
- Cockcroft, K.; Hartgill, M. Focusing on the abilities in learning disabilities: Dyslexia and creativity. Educ. Chang. 2004, 8, 61–79. [Google Scholar] [CrossRef]
| Variables | Contents | Specific Description |
|---|---|---|
| The Sample Characteristics | Sample size | The number of people with Chinese developmental dyslexia was coded. |
| Age | The mean age of the sample was coded. | |
| The Definition Criteria of Cognitive Deficits | Type of Control Group | The researchers used age-matched typically developing or reading-level-matched typically developing children as controls to further confirm whether children with DD have certain deficits [15,16]. The type of control was coded. |
| Criterion of Cognitive deficits | The children were identified as having a cognitive deficit if their performance was below the cut-off criteria of the control group (e.g., 1.5SD below the mean of a participant’s respective age group) on the cognitive deficits screening measures. | |
| The Type of Cognitive Deficits and Percentage of Different Cognitive Deficits | Type of Cognitive Deficits | The cognitive deficits included phonological awareness, rapid automatized naming, orthographic knowledge, morphological awareness, short-term memory and working memory, and visual and motor skills. If there was a cognitive deficit in the paper that did not fall into any of the above categories, it went into the other category. |
| The Percentage of Cognitive Deficits | The percentage or the sample size of different cognitive deficits was coded. |
| Research | Location | Dyslexia (n) | Age (Years) | Control Group | Standard | Phonological Awareness Deficits | Rapid Automatized Naming Deficits | Orthographic Knowledge Deficits | Morphological Awareness Deficits | Short-Term Memory and Working Memory Deficits | Visual and Motor Skills Deficits |
|---|---|---|---|---|---|---|---|---|---|---|---|
| Liu, Liu and Zhang, 2006 [13] | Mainland | 29 | 10.43 | RC | 1 SD | 0.448 | 0.414 | 0.345 | 0.138 | ||
| Xiong and Yan, 2014 [17] | Mainland | 57 | 10.58 | RC | 1.5 SD | 0.509 | 0.175 | 0.298 | 0.123 | ||
| Wang, Li and Deng, 2014 [18] | Mainland | 33 | 11.54 | CA | 1.5 SD | 0.697 | 0.348 | 0.636 | 0.364 | ||
| Wu, Shu and Wang, 2004 [19] | Mainland | 15 | 11.6 | CA | 1.65 SD | 0.467 | 1 | ||||
| Peng et al., 2007 [20] | Mainland | 25 | 3.5 | CA | 2 SD | 0.4 | 0.16 | 0.16 | |||
| Li and Shu, 2009 [21] | Mainland | 41 | 11.7 | CA | 1 SD | 0.415 | 0.341 | 0.512 | 0.354 | ||
| Meng, Zhou, Zeng, Kong and Zhuang, 2002 [22] | Mainland | 15 | 10–11.5 | CA | Mean | 0.733 | 0.533 | ||||
| Wu, Shu and Liu, 2005 [23] | Mainland | 91 | 11.83–12.17 | CA | 1.5 SD | 0.429 | 0.407 | 0.758 | |||
| Chen, Yang and Tang, 2002 [24] | Mainland | 77 | 10 | Cluster | Cluster | 0.649 | |||||
| Ho et al., 2004 [11] | Hong Kong | 147 | 8.275 | CA | 1.5 SD | 0.252 | 0.571 | 0.42 | 0.321 | 0.272 | |
| Ho, Chan, Tsang and Lee, 2002 [25] | Hong Kong | 30 | 8.67 | CA | 1.5 SD | 0.167 | 0.5 | 0.389 | 0.1335 | 0.367 | |
| Chen, Zheng and Ho, 2019 [26] | Hong Kong | 25 | 10.45 | CA | 1.5 SD | 0.4 | |||||
| Hong Kong | 25 | 10.45 | RC | 1.5 SD | 0.24 | ||||||
| Song, Zhang, Shu, Su and McBride, 2020 [27] | Mainland | 223 | 10.84 | Cluster | Cluster | 0.525 | 0.372 | 0.534 | |||
| Huo, Wu, Mo, Wang and Maurer, 2021 [28] | Hong Kong | 84 | 8.39 | Cluster | Cluster | 0.762 | 0.571 | ||||
| Li, Shu, McBride-Chang, Liu and Xue, 2009 [29] | Mainland | 41 | 11.73 | CA | 1.5 SD | 0.22 | 0.268 | 0.366 | 0.0976 | ||
| Chung et al., 2010 [30] | Hong Kong | 27 | 13.65 | CA | 1.5 SD | 0.074 | 0.352 | 0.407 | 0.296 | 0.259 | |
| Chung, Lo, Ho, Xiao and Chan, 2014 [31] | Hong Kong | 52 | 13.42 | CA | 1.5 SD | 0.61 | 0.67 | 0.33 | |||
| Wang, Georgiou, Das and Li, 2012 [32] | Mainland | 27 | 9.98 | CA | 1.5 SD | 0.5185 | 0.4445 | 0.5926 | 0.5185 | ||
| Chung, Lo and McBride, 2018 [12] | Hong Kong | 50 | 9.04 | CA | 1 SD | 0.09 | 0.52 | 0.267 | 0.207 | ||
| Hong Kong | 25 | 13.31 | CA | 1 SD | 0.66 | 0.46 | 0.42 | 0.26 | |||
| Chan, Hung, Liu and Lee, 2008 [33] | Hong Kong | 43 | 8.17 | CA | 1.5 SD | 0.233 | 0.628 | 0.372 | 0.116 | ||
| Zhao, Liu, Liu and Huang, 2018 [34] | Mainland | 20 | 8.88 | CA | 1.65 SD | 0.1 | |||||
| Mainland | 19 | 10.19 | CA | 1.65 SD | 0.0526 | ||||||
| Mainland | 18 | 11.68 | CA | 1.65 SD | 0.3889 | ||||||
| Cheng, Yao, Wang and Zhao 2021 [35] | Mainland | 45 | 10.11 | CA | 1.5 SD | 0.6 | 0.533 | 0.4 |
| Index | Number of Studies | Heterogeneity Test | Model | Results | ||
|---|---|---|---|---|---|---|
| p | I2 | Pooled Percentage | 95% CI | |||
| Total | 18 | <0.001 | 93.20% | random | 0.41 | (0.31, 0.52) |
| Age | ||||||
| Younger than 11 years old | 11 | <0.001 | 94.50% | random | 0.41 | (0.27, 0.55) |
| Older than 11 years old | 6 | <0.001 | 91.00% | random | 0.38 | (0.19, 0.56) |
| Location | ||||||
| Mainland | 12 | <0.001 | 69.10% | random | 0.49 | (0.42, 0.56) |
| Hong Kong | 6 | <0.001 | 96.70% | random | 0.26 | (0.05, 0.47) |
| Control group | ||||||
| CA | 14 | <0.001 | 89.70% | random | 0.37 | (0.26, 0.47) |
| RC | 2 | 0.591 | 0.00% | fixed | 0.49 | (0.38, 0.59) |
| Standard | ||||||
| mean | 1 | — | — | fixed | 0.73 | (0.51, 0.96) |
| 1SD | 3 | <0.001 | 91.10% | random | 0.31 | (0.05, 0.57) |
| 1.5SD | 10 | <0.001 | 90.00% | random | 0.36 | (0.24, 0.48) |
| 1.65SD | 1 | — | — | fixed | 0.47 | (0.21, 0.72) |
| 2SD | 1 | — | — | fixed | 0.4 | (0.21, 0.59) |
| Cluster | 2 | <0.001 | 94.20% | random | 0.64 | (0.41, 0.87) |
| Index | Number of Studies | Heterogeneity Test | Model | Results | ||
|---|---|---|---|---|---|---|
| p | I2 | Pooled Percentage | 95% CI | |||
| Total | 16 | <0.001 | 79.70% | random | 0.44 | (0.37, 0.51) |
| Age | ||||||
| Younger than 11 years old | 9 | <0.001 | 84.70% | random | 0.46 | (0.36, 0.56) |
| Older than 11 years old | 7 | <0.001 | 80.70% | random | 0.42 | (0.32, 0.53) |
| Location | ||||||
| Mainland | 9 | 0.004 | 64.80% | random | 0.36 | (0.29, 0.43) |
| Hong Kong | 7 | 0.207 | 29.10% | fixed | 0.56 | (0.51, 0.61) |
| Control group | ||||||
| CA | 13 | <0.001 | 67.20% | random | 0.48 | (0.41, 0.54) |
| RC | 2 | 0.022 | 80.90% | random | 0.28 | (0.05, 0.52) |
| Standard | ||||||
| 1SD | 4 | 0.047 | 62.20% | random | 0.48 | (0.35, 0.61) |
| 1.5SD | 11 | <0.001 | 83.80% | random | 0.44 | (0.34, 0.54) |
| Cluster | 1 | — | — | fixed | 0.37 | (0.31, 0.44) |
| Index | Number of Studies | Heterogeneity Test | Model | Results | ||
|---|---|---|---|---|---|---|
| p | I2 | Pooled Percentage | 95% CI | |||
| Total | 11 | 0.001 | 65.80% | random | 0.43 | (0.36, 0.50) |
| Age | ||||||
| Younger than 11 years old | 8 | 0.002 | 68.40% | random | 0.4 | (0.32, 0.49) |
| Older than 11 years old | 3 | 0.158 | 45.90% | fixed | 0.51 | (0.41, 0.62) |
| Location | ||||||
| Mainland | 4 | 0.002 | 79.60% | random | 0.46 | (0.29, 0.64) |
| Hong Kong | 7 | 0.024 | 58.70% | random | 0.41 | (0.34, 0.49) |
| Control group | ||||||
| CA | 8 | 0.02 | 58.10% | random | 0.43 | (0.35, 0.51) |
| RC | 2 | 0.661 | 0.00% | fixed | 0.31 | (0.22, 0.41) |
| Standard | ||||||
| 1SD | 3 | 0.254 | 27.00% | fixed | 0.33 | (0.24, 0.42) |
| 1.5SD | 7 | 0.024 | 58.90% | random | 0.43 | (0.35, 0.52) |
| Cluster | 1 | — | — | fixed | 0.57 | (0.47, 0.68) |
| Index | Number of Studies | Heterogeneity Test | Model | Results | ||
|---|---|---|---|---|---|---|
| p | I2 | Pooled Percentage | 95% CI | |||
| Total | 10 | <0.001 | 94.50% | random | 0.4 | (0.24, 0.55) |
| Age | ||||||
| Younger than 11 years old | 4 | <0.001 | 96.00% | random | 0.24 | (0.00, 0.48) |
| Older than 11 years old | 6 | <0.001 | 87.30% | random | 0.51 | (0.35, 0.67) |
| Location | ||||||
| Mainland | 7 | <0.001 | 96.00% | random | 0.37 | (0.18, 0.57) |
| Hong Kong | 3 | 0.002 | 84.40% | random | 0.47 | (0.23, 0.71) |
| Control group | ||||||
| CA | 7 | <0.001 | 91.30% | random | 0.46 | (0.28, 0.64) |
| RC | 2 | 0.846 | 0% | fixed | 0.13 | (0.06, 0.2) |
| Standard | ||||||
| 1SD | 3 | 0.001 | 86.80% | random | 0.35 | (0.11, 0.60) |
| 1.5SD | 5 | <0.001 | 97.50% | random | 0.44 | (0.16, 0.73) |
| 2SD | 1 | — | — | fixed | 0.16 | (0.02, 0.30) |
| Cluster | 1 | — | — | fixed | 0.53 | (0.47, 0.60) |
| Index | Number of Studies | Heterogeneity Test | Model | Results | ||
|---|---|---|---|---|---|---|
| p | I2 | Pooled Percentage | 95% CI | |||
| Total | 12 | <0.001 | 71.20% | random | 0.25 | (0.18, 0.31) |
| Age | ||||||
| Younger than 11 years old | 6 | <0.001 | 78.70% | random | 0.23 | (0.13, 0.33) |
| Older than 11 years old | 6 | 0.012 | 65.80% | random | 0.26 | (0.17, 0.36) |
| Location | ||||||
| Mainland | 5 | <0.001 | 81.80% | random | 0.28 | (0.13, 0.43) |
| Hong Kong | 7 | 0.013 | 62.80% | random | 0.23 | (0.16, 0.30) |
| Control group | ||||||
| CA | 12 | <0.001 | 71.20% | random | 0.25 | (0.18, 0.31) |
| RC | 0 | |||||
| Standard | ||||||
| 1SD | 3 | 0.49 | 0.00% | fixed | 0.25 | (0.17, 0.33) |
| 1.5SD | 8 | <0.001 | 80.30% | random | 0.26 | (0.16, 0.35) |
| 2SD | 1 | — | — | fixed | 0.16 | (0.02, 0.30) |
| Index | Number of Studies | Heterogeneity Test | Model | Results | ||
|---|---|---|---|---|---|---|
| p | I2 | Pooled Percentage | 95% CI | |||
| Total | 10 | <0.001 | 89.00% | random | 0.33 | (0.20, 0.46) |
| Age | ||||||
| Younger than 11 years old | 8 | <0.001 | 91.00% | random | 0.31 | (0.16, 0.45) |
| Older than 11 years old | 1 | _ | _ | fixed | 0.39 | (0.16, 0.61) |
| Location | ||||||
| Mainland | 5 | <0.001 | 93.70% | random | 0.35 | (0.12, 0.58) |
| Hong Kong | 4 | 0.451 | 0.00% | fixed | 0.29 | (0.23, 0.35) |
| Control group | ||||||
| CA | 8 | <0.001 | 79.90% | random | 0.29 | (0.18, 0.40) |
| RC | 1 | _ | _ | fixed | 0.24 | (0.07, 0.41) |
| Standard | ||||||
| mean | 1 | — | — | fixed | 0.53 | (0.28, 0.79) |
| 1.5SD | 5 | 0.335 | 12.40% | fixed | 0.31 | (0.25, 0.36) |
| 1.65SD | 3 | 0.028 | 72.10% | random | 0.15 | (−0.01, 0.31) |
| Cluster | 1 | — | — | fixed | 0.65 | (0.54, 0.76) |
Publisher’s Note: MDPI stays neutral with regard to jurisdictional claims in published maps and institutional affiliations. |
© 2022 by the authors. Licensee MDPI, Basel, Switzerland. This article is an open access article distributed under the terms and conditions of the Creative Commons Attribution (CC BY) license (https://creativecommons.org/licenses/by/4.0/).
Share and Cite
Li, X.; Hu, M.; Liang, H. The Percentages of Cognitive Skills Deficits among Chinese Children with Developmental Dyslexia: A Systematic Review and Meta-Analysis. Brain Sci. 2022, 12, 548. https://doi.org/10.3390/brainsci12050548
Li X, Hu M, Liang H. The Percentages of Cognitive Skills Deficits among Chinese Children with Developmental Dyslexia: A Systematic Review and Meta-Analysis. Brain Sciences. 2022; 12(5):548. https://doi.org/10.3390/brainsci12050548
Chicago/Turabian StyleLi, Xin, Mingming Hu, and Huadong Liang. 2022. "The Percentages of Cognitive Skills Deficits among Chinese Children with Developmental Dyslexia: A Systematic Review and Meta-Analysis" Brain Sciences 12, no. 5: 548. https://doi.org/10.3390/brainsci12050548
APA StyleLi, X., Hu, M., & Liang, H. (2022). The Percentages of Cognitive Skills Deficits among Chinese Children with Developmental Dyslexia: A Systematic Review and Meta-Analysis. Brain Sciences, 12(5), 548. https://doi.org/10.3390/brainsci12050548