
Adding a Second iTBS Block in 15 or 60 Min Time Interval Does Not Increase iTBS Effects on Motor Cortex Excitability and the Responder Rates

 , , ,
, , ,
Abstract
:1. Introduction
2. Materials and Methods
2.1. Participants
- Age between 18–40;
- Right-handedness according to the Edinburgh Handedness Inventory (EHI) [36].
- Neurological or psychiatric disorders (at the time of inclusion or a history of such medical conditions);
- Severe diseases of other systems;
- Intake of drugs with an influence on the central nervous system at the time of inclusion;
- Contraindications to TMS and/or MRI (implanted cardiac pacemaker or intracardiac catheters, electronic pumps, cochlear implants, ferromagnetic metallic clips or stents, metallic foreign bodies, implants and post-surgical devices, claustrophobia, pregnancy) [37];
- Epileptiform activity on routine EEG.
- Severe adverse events (AEs) during the TMS procedure (epileptic seizures, syncopes, and others);
- Occurrence of psychiatric or neurological disorders after the inclusion into the study;
- Occurrence or exacerbation of existing somatic diseases after the inclusion;
- Installation of cardiac pacemaker, intracardiac catheters, or brain surgery with implantation of metallic devices in the skull;
- Pregnancy;
- Participants’ refusal to participate in the study.
2.2. Study Protocol
2.3. Transcranial Magnetic Stimulation
2.3.1. iTBS
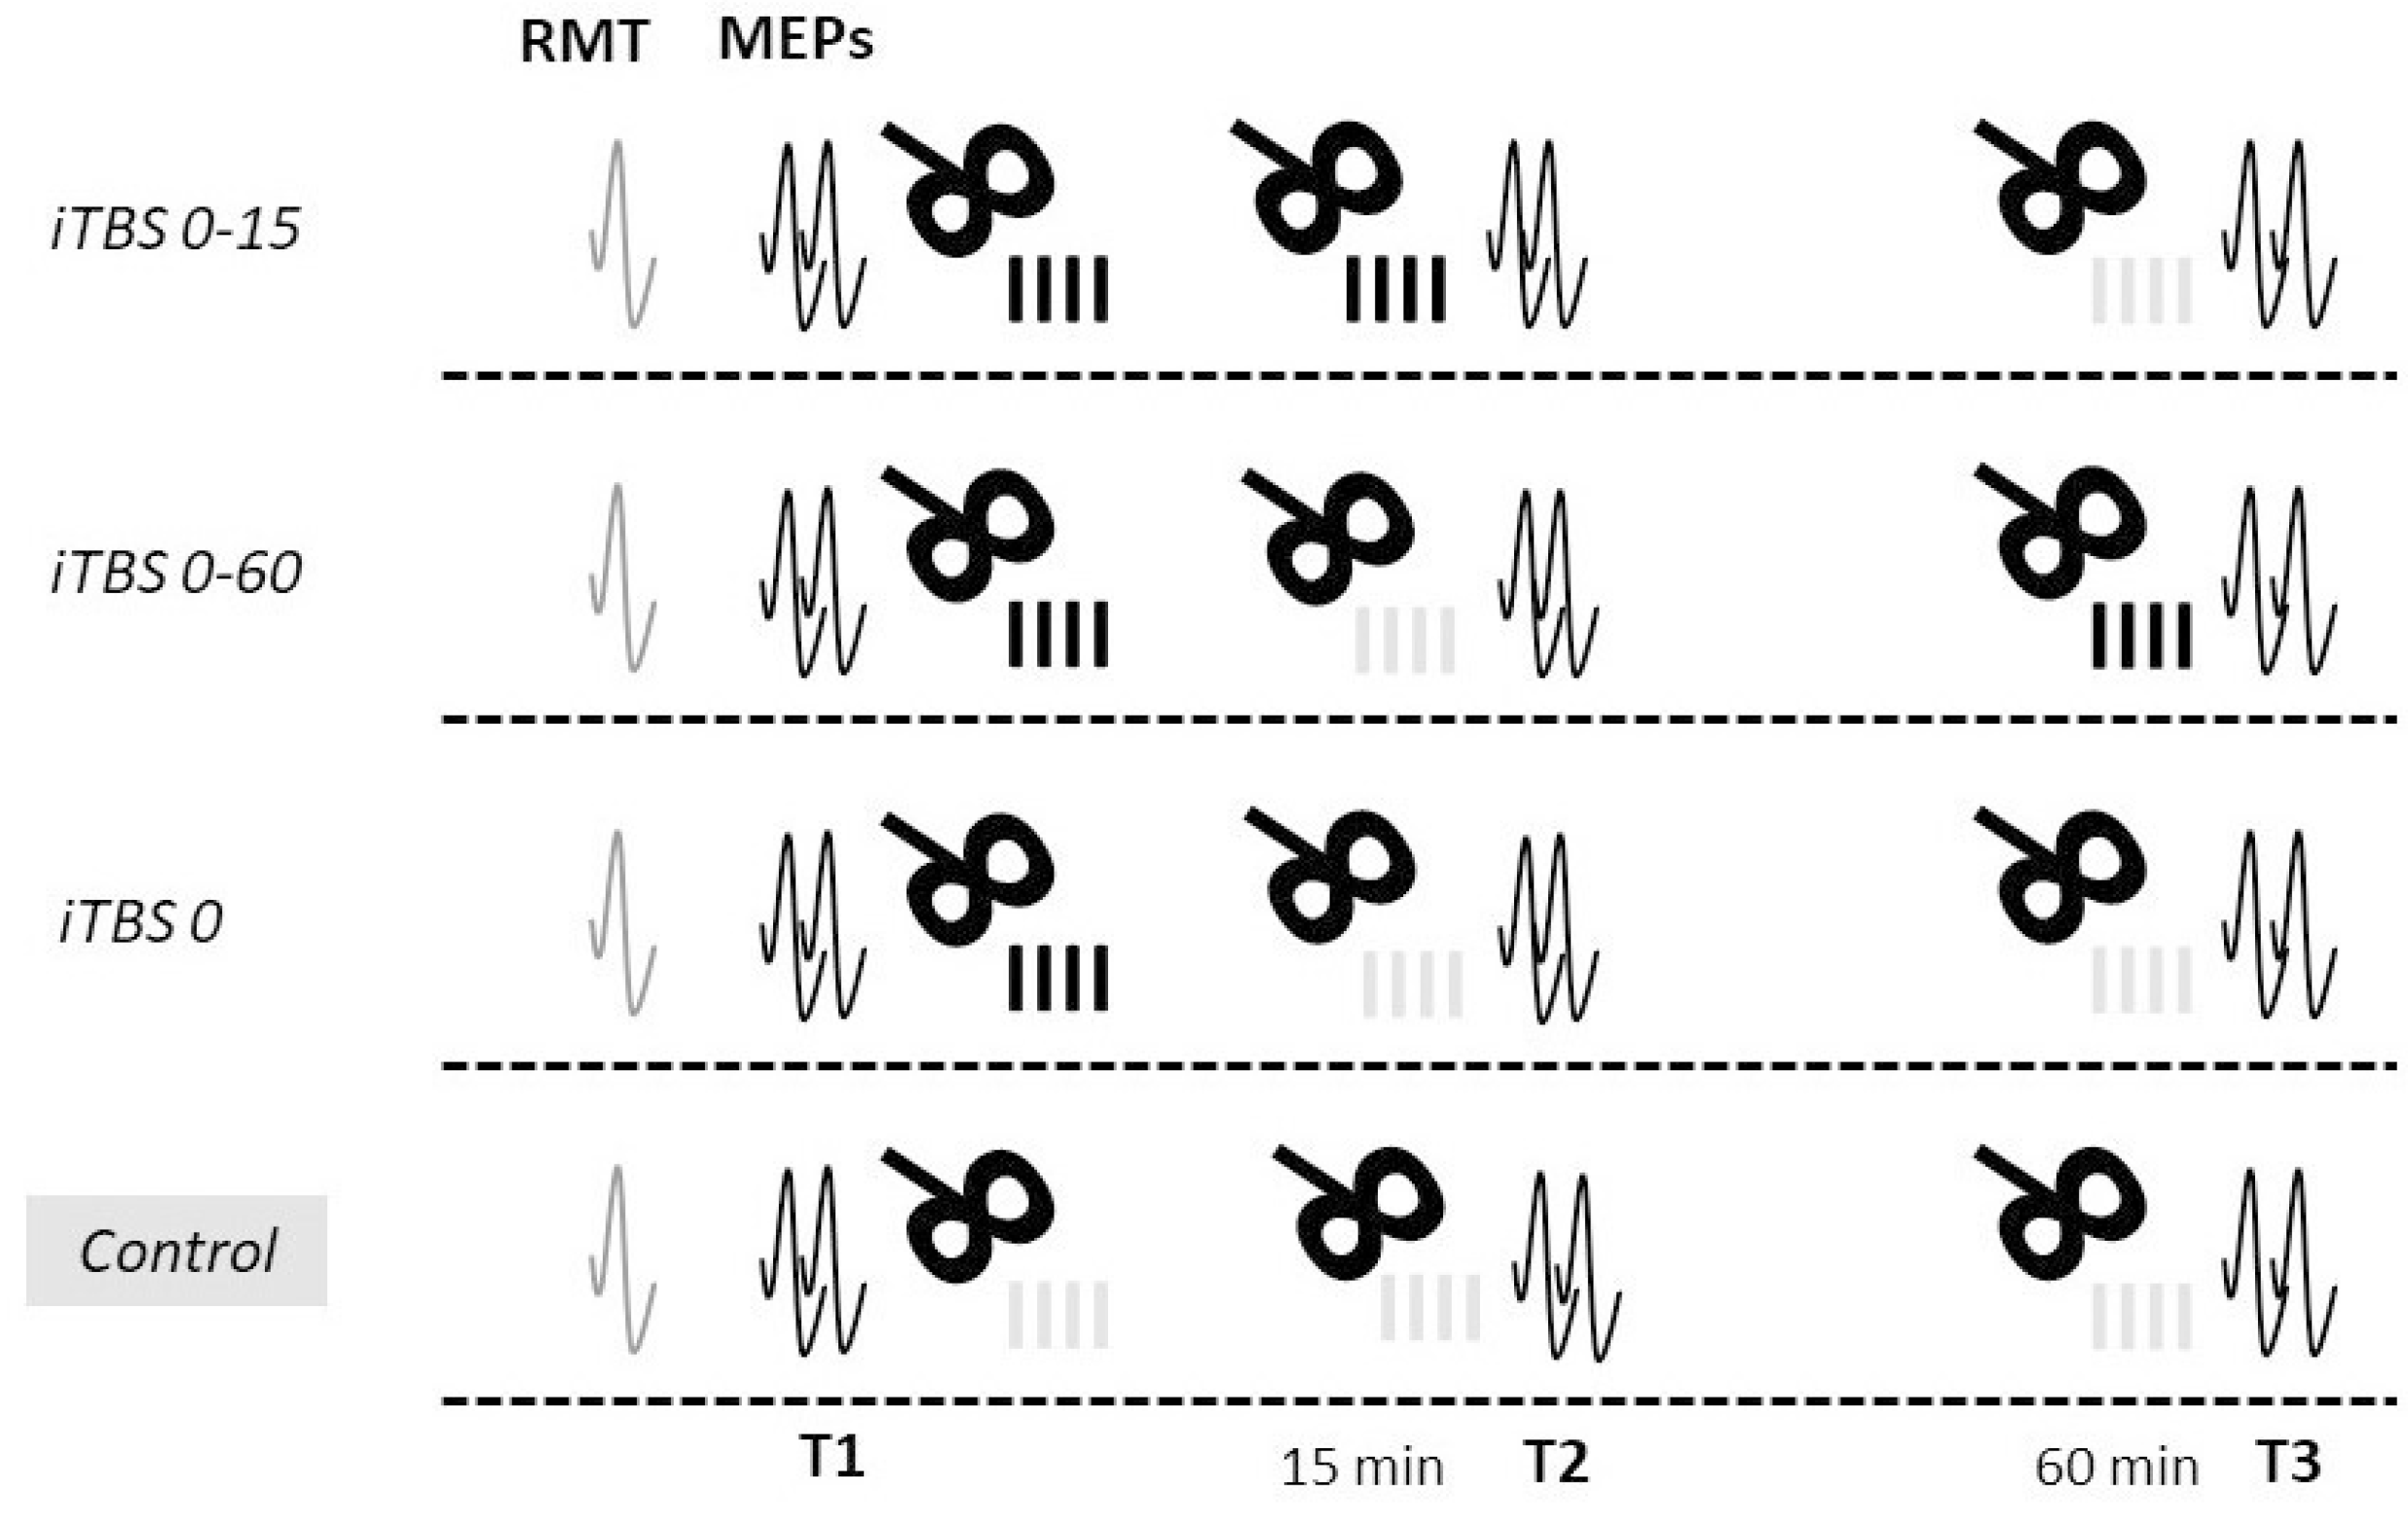
- Repeated iTBS protocol with a short interval between blocks (iTBS 0-15): two blocks of active stimulation with an interval of 15 min between them and a control stimulation block in 60 min from the end of the first block;
- Repeated protocol with a long interval between blocks (iTBS 0-60): a block of active stimulation was followed by a block of control stimulation with an interval of 15 min between them, and another block of active stimulation was applied in 60 min from the end of the first block;
- Standard iTBS protocol (iTBS 0): firstly, one block of active stimulation was applied, followed by two blocks of control stimulation in 15 and 60 min from the end of the first block;
- Control protocol (Control): three blocks of control stimulation were applied: at baseline, 15 min, and 60 min after the end of the first block.
2.3.2. Motor Evoked Potential (MEP) Acquisition
2.3.3. Tolerability Assessment
2.4. Statistical Analysis
3. Results
3.1. Study Sample
3.2. Effects of Single Protocols
3.3. Comparisons of the Effects of Protocols
3.4. Comparisons of Responder Rates
3.5. Correlations of Responder Classifications
3.6. Analysis Excluding the MEP Measurements with Largest within-Session Variability
3.7. Analysis Excluding Subjects with Largest Variability of Baseline MEPs between Sessions
3.8. Analysis of Effect Reliability
3.9. TBS Tolerability
4. Discussion
Limitations
Supplementary Materials
Author Contributions
Funding
Institutional Review Board Statement
Informed Consent Statement
Data Availability Statement
Conflicts of Interest
References
- Burke, M.J.; Fried, P.J.; Pascual-Leone, A. Transcranial magnetic stimulation: Neurophysiological and clinical applications. In Handbook of Clinical Neurology; Elsevier B.V.: Amsterdam, The Netherlands, 2019; Volume 163, pp. 73–92. [Google Scholar]
- Lefaucheur, J.P. Transcranial magnetic stimulation. In Handbook of Clinical Neurology; Elsevier B.V.: Amsterdam, The Netherlands, 2019; Volume 160, pp. 559–580. [Google Scholar]
- Chervyakov, A.V.; Chernyavsky, A.Y.; Sinitsyn, D.O.; Piradov, M.A. Possible Mechanisms Underlying the Therapeutic Effects of Transcranial Magnetic Stimulation. Front. Hum. Neurosci. 2015, 9, 303. [Google Scholar] [CrossRef] [PubMed]
- Valero-Cabré, A.; Amengual, J.L.; Stengel, C.; Pascual-Leone, A.; Coubard, O.A. Transcranial magnetic stimulation in basic and clinical neuroscience: A comprehensive review of fundamental principles and novel insights. Neurosci. Biobehav. Rev. 2017, 83, 381–404. [Google Scholar] [CrossRef] [PubMed]
- Maeda, F.; Keenan, J.P.; Tormos, J.M.; Topka, H.; Pascual-Leone, A. Interindividual variability of the modulatory effects of repetitive transcranial magnetic stimulation on cortical excitability. Exp. Brain Res. 2000, 133, 425–430. [Google Scholar] [CrossRef] [PubMed]
- Pellegrini, M.; Zoghi, M.; Jaberzadeh, S. Cluster analysis and subgrouping to investigate inter-individual variability to non-invasive brain stimulation: A systematic review. Rev. Neurosci. 2018, 29, 675–697. [Google Scholar] [CrossRef] [Green Version]
- Terranova, C.; Rizzo, V.; Cacciola, A.; Chillemi, G.; Calamuneri, A.; Milardi, D.; Quartarone, A. Is there a future for non-invasive brain stimulation as a therapeutic tool? Front. Neurol. 2019, 10, 1146. [Google Scholar] [CrossRef]
- Lefaucheur, J.P.; Aleman, A.; Baeken, C.; Benninger, D.H.; Brunelin, J.; Di Lazzaro, V.; Filipović, S.R.; Grefkes, C.; Hasan, A.; Hummel, F.C.; et al. Evidence-based guidelines on the therapeutic use of repetitive transcranial magnetic stimulation (rTMS): An update (2014–2018). Clin. Neurophysiol. 2020, 131, 474–528. [Google Scholar] [CrossRef]
- Goldsworthy, M.R.; Hordacre, B.; Rothwell, J.C.; Ridding, M.C. Effects of rTMS on the brain: Is there value in variability? Cortex 2021, 139, 43–59. [Google Scholar] [CrossRef]
- Hinder, M.R.; Goss, E.L.; Fujiyama, H.; Canty, A.J.; Garry, M.I.; Rodger, J.; Summers, J.J. Inter- and Intra-individual variability following intermittent theta burst stimulation: Implications for rehabilitation and recovery. Brain Stimul. 2014, 7, 365–371. [Google Scholar] [CrossRef]
- Corp, D.T.; Bereznicki, H.G.K.; Clark, G.M.; Youssef, G.J.; Fried, P.J.; Jannati, A.; Davies, C.B.; Gomes-Osman, J.; Stamm, J.; Chung, S.W.; et al. Large-scale analysis of interindividual variability in theta-burst stimulation data: Results from the “Big TMS Data Collaboration”. Brain Stimul. 2020, 13, 1476–1488. [Google Scholar] [CrossRef]
- Rounis, E.; Huang, Y.Z. Theta burst stimulation in humans: A need for better understanding effects of brain stimulation in health and disease. Exp. Brain Res. 2020, 238, 1707–1714. [Google Scholar] [CrossRef]
- Hamada, M.; Murase, N.; Hasan, A.; Balaratnam, M.; Rothwell, J.C. The role of interneuron networks in driving human motor cortical plasticity. Cereb. Cortex 2013, 23, 1593–1605. [Google Scholar] [CrossRef] [Green Version]
- Boucher, P.O.; Ozdemir, R.A.; Momi, D.; Burke, M.J.; Jannati, A.; Fried, P.J.; Pascual-Leone, A.; Shafi, M.M.; Santarnecchi, E. Sham-derived effects and the minimal reliability of theta burst stimulation. Sci. Rep. 2021, 11, 21170. [Google Scholar] [CrossRef]
- Cash, R.F.H.; Weigand, A.; Zalesky, A.; Siddiqi, S.H.; Downar, J.; Fitzgerald, P.B.; Fox, M.D. Using Brain Imaging to Improve Spatial Targeting of Transcranial Magnetic Stimulation for Depression. Biol. Psychiatry 2021, 90, 689–700. [Google Scholar] [CrossRef]
- Thut, G.; Veniero, D.; Romei, V.; Miniussi, C.; Schyns, P.; Gross, J. Rhythmic TMS causes local entrainment of natural oscillatory signatures. Curr. Biol. 2011, 21, 1176–1185. [Google Scholar] [CrossRef] [Green Version]
- Jin, Y.; Phillips, B. A pilot study of the use of EEG-based synchronized Transcranial Magnetic Stimulation (sTMS) for treatment of Major Depression. BMC Psychiatry 2014, 14, 13. [Google Scholar] [CrossRef] [Green Version]
- Kar, S.K. Predictors of Response to Repetitive Transcranial Magnetic Stimulation in Depression: A Review of Recent Updates. Clin. Psychopharmacol. Neurosci. 2019, 17, 25–33. [Google Scholar] [CrossRef]
- Zrenner, C.; Desideri, D.; Belardinelli, P.; Ziemann, U. Real-time EEG-defined excitability states determine efficacy of TMS-induced plasticity in human motor cortex. Brain Stimul. 2018, 11, 374–389. [Google Scholar] [CrossRef]
- Hussain, S.J.; Vollmer, M.K.; Stimely, J.; Norato, G.; Zrenner, C.; Ziemann, U.; Buch, E.R.; Cohen, L.G. Phase-dependent offline enhancement of human motor memory. Brain Stimul. 2021, 14, 873–883. [Google Scholar] [CrossRef]
- Stefanou, M.I.; Baur, D.; Belardinelli, P.; Bergmann, T.O.; Blum, C.; Gordon, P.C.; Nieminen, J.O.; Zrenner, B.; Ziemann, U.; Zrenner, C. Brain state-dependent brain stimulation with real-time electroencephalography-triggered transcranial magnetic stimulation. J. Vis. Exp. 2019, 2019, e59711. [Google Scholar] [CrossRef]
- Abraham, W.C.; Bear, M.F. Metaplasticity: The plasticity of synaptic plasticity. Trends Neurosci. 1996, 19, 126–130. [Google Scholar] [CrossRef]
- Abraham, W.C. Metaplasticity: Tuning synapses and networks for plasticity. Nat. Rev. Neurosci. 2008, 9, 387–399. [Google Scholar] [CrossRef]
- Vose, L.; Stanton, P. Synaptic Plasticity, Metaplasticity and Depression. Curr. Neuropharmacol. 2016, 15, 71–86. [Google Scholar] [CrossRef] [Green Version]
- Bienenstock, E.L.; Cooper, L.N.; Munro, P.W. Theory for the development of neuron selectivity: Orientation specificity and binocular interaction in visual cortex. J. Neurosci. 1982, 2, 32–48. [Google Scholar] [CrossRef] [Green Version]
- Müller-Dahlhaus, F.; Ziemann, U. Metaplasticity in human cortex. Neuroscientist 2015, 21, 185–202. [Google Scholar] [CrossRef]
- Hurley, R.; Machado, L. Using tDCS priming to improve brain function: Can metaplasticity provide the key to boosting outcomes? Neurosci. Biobehav. Rev. 2017, 83, 155–159. [Google Scholar] [CrossRef]
- Hassanzahraee, M.; Zoghi, M.; Jaberzadeh, S. How different priming stimulations affect the corticospinal excitability induced by noninvasive brain stimulation techniques: A systematic review and meta-analysis. Rev. Neurosci. 2018, 29, 883–899. [Google Scholar] [CrossRef]
- Fitzgerald, P.B.; Hoy, K.E.; Elliot, D.; Susan McQueen, R.N.; Wambeek, L.E.; Daskalakis, Z.J. Accelerated repetitive transcranial magnetic stimulation in the treatment of depression. Neuropsychopharmacology 2018, 43, 1565–1572. [Google Scholar] [CrossRef] [Green Version]
- Cole, E.J.; Phillips, A.L.; Bentzley, B.S.; Stimpson, K.H.; Nejad, R.; Barmak, F.; Veerapal, C.; Khan, N.; Cherian, K.; Felber, E.; et al. Stanford Neuromodulation Therapy (SNT): A Double-Blind Randomized Controlled Trial. Am. J. Psychiatry 2022, 179, 132–141. [Google Scholar] [CrossRef]
- Murakami, T.; Müller-Dahlhaus, F.; Lu, M.K.; Ziemann, U. Homeostatic metaplasticity of corticospinal excitatory and intracortical inhibitory neural circuits in human motor cortex. J. Physiol. 2012, 590, 5765–5781. [Google Scholar] [CrossRef]
- Tse, N.Y.; Goldsworthy, M.R.; Ridding, M.C.; Coxon, J.P.; Fitzgerald, P.B.; Fornito, A.; Rogasch, N.C. The effect of stimulation interval on plasticity following repeated blocks of intermittent theta burst stimulation. Sci. Rep. 2018, 8, 8526. [Google Scholar] [CrossRef] [Green Version]
- Thomson, A.C.; Sack, A.T. How to Design Optimal Accelerated rTMS Protocols Capable of Promoting Therapeutically Beneficial Metaplasticity. Front. Neurol. 2020, 11, 599918. [Google Scholar] [CrossRef] [PubMed]
- Yu, F.; Tang, X.; Hu, R.; Liang, S.; Wang, W.; Tian, S.; Wu, Y.; Yuan, T.F.; Zhu, Y. The After-Effect of Accelerated Intermittent Theta Burst Stimulation at Different Session Intervals. Front. Neurosci. 2020, 14, 576. [Google Scholar] [CrossRef] [PubMed]
- Kramár, E.A.; Babayan, A.H.; Gavin, C.F.; Cox, C.D.; Jafari, M.; Gall, C.M.; Rumbaugh, G.; Lynch, G. Synaptic evidence for the efficacy of spaced learning. Proc. Natl. Acad. Sci. USA 2012, 109, 5121–5126. [Google Scholar] [CrossRef] [PubMed] [Green Version]
- Oldfield, R.C. The assessment and analysis of handedness: The Edinburgh inventory. Neuropsychologia 1971, 9, 97–113. [Google Scholar] [CrossRef]
- Rossi, S.; Hallett, M.; Rossini, P.M.; Pascual-Leone, A.; Safety of TMS Consensus Group. Safety, ethical considerations, and application guidelines for the use of transcranial magnetic stimulation in clinical practice and research. Clin. Neurophysiol. 2009, 120, 2008–2039. [Google Scholar] [CrossRef] [Green Version]
- Nettekoven, C.; Volz, L.J.; Kutscha, M.; Pool, E.M.; Rehme, A.K.; Eickhoff, S.B.; Fink, G.R.; Grefkes, C. Dose-dependent effects of theta burst rTMS on cortical excitability and resting-state connectivity of the human motor system. J. Neurosci. 2014, 34, 6849–6859. [Google Scholar] [CrossRef]
- Nettekoven, C.; Volz, L.J.; Leimbach, M.; Pool, E.M.; Rehme, A.K.; Eickhoff, S.B.; Fink, G.R.; Grefkes, C. Inter-individual variability in cortical excitability and motor network connectivity following multiple blocks of rTMS. Neuroimage 2015, 118, 209–218. [Google Scholar] [CrossRef] [Green Version]
- Rossini, P.M.; Barker, A.T.; Berardelli, A.; Caramia, M.D.; Caruso, G.; Cracco, R.Q.; Dimitrijevic, M.R.; Hallett, M.; Katayama, Y.; Lucking, C.H.; et al. Non-invasive electrical and magnetic stimulation of the brain, spinal cord and roots: Basic principles and procedures for routine clinical application. Report of an IFCN committee. Electroencephalogr. Clin. Neurophysiol. 1994, 91, 79–92. [Google Scholar] [CrossRef]
- Chung, S.W.; Rogasch, N.C.; Hoy, K.E.; Sullivan, C.M.; Cash, R.F.H.; Fitzgerald, P.B. Impact of different intensities of intermittent theta burst stimulation on the cortical properties during TMS-EEG and working memory performance. Hum. Brain Mapp. 2018, 39, 783–802. [Google Scholar] [CrossRef] [Green Version]
- Goldsworthy, M.R.; Pitcher, J.B.; Ridding, M.C. The application of spaced theta burst protocols induces long-lasting neuroplastic changes in the human motor cortex. Eur. J. Neurosci. 2012, 35, 125–134. [Google Scholar] [CrossRef]
- Huang, Y.Z.; Edwards, M.J.; Rounis, E.; Bhatia, K.P.; Rothwell, J.C. Theta burst stimulation of the human motor cortex. Neuron 2005, 45, 201–206. [Google Scholar] [CrossRef] [Green Version]
- Dickins, D.S.E.; Sale, M.V.; Kamke, M.R. Plasticity Induced by Intermittent Theta Burst Stimulation in Bilateral Motor Cortices Is Not Altered in Older Adults. Neural Plast. 2015, 2015, 323409. [Google Scholar] [CrossRef]
- Vallence, A.M.; Goldsworthy, M.R.; Hodyl, N.A.; Semmler, J.G.; Pitcher, J.B.; Ridding, M.C. Inter- and intra-subject variability of motor cortex plasticity following continuous theta-burst stimulation. Neuroscience 2015, 304, 266–278. [Google Scholar] [CrossRef] [Green Version]
- Gamboa, O.L.; Antal, A.; Laczo, B.; Moliadze, V.; Nitsche, M.A.; Paulus, W. Impact of repetitive theta burst stimulation on motor cortex excitability. Brain Stimul. 2011, 4, 145–151. [Google Scholar] [CrossRef]
- Opie, G.M.; Vosnakis, E.; Ridding, M.C.; Ziemann, U.; Semmler, J.G. Priming theta burst stimulation enhances motor cortex plasticity in young but not old adults. Brain Stimul. 2017, 10, 298–304. [Google Scholar] [CrossRef] [Green Version]
- Schilberg, L.; Schuhmann, T.; Sack, A.T. Interindividual Variability and Intraindividual Reliability of Intermittent Theta Burst Stimulation-induced Neuroplasticity Mechanisms in the Healthy Brain. J. Cogn. Neurosci. 2017, 29, 1022–1032. [Google Scholar] [CrossRef]
- Perellón-Alfonso, R.; Kralik, M.; Pileckyte, I.; Princic, M.; Bon, J.; Matzhold, C.; Fischer, B.; Šlahorová, P.; Pirtošek, Z.; Rothwell, J.; et al. Similar effect of intermittent theta burst and sham stimulation on corticospinal excitability: A 5-day repeated sessions study. Eur. J. Neurosci. 2018, 48, 1990–2000. [Google Scholar] [CrossRef]
- Hordacre, B.; Goldsworthy, M.R.; Vallence, A.M.; Darvishi, S.; Moezzi, B.; Hamada, M.; Rothwell, J.C.; Ridding, M.C. Variability in neural excitability and plasticity induction in the human cortex: A brain stimulation study. Brain Stimul. 2017, 10, 588–595. [Google Scholar] [CrossRef] [Green Version]
- Lioumis, P.; Kičić, D.; Savolainen, P.; Mäkelä, J.P.; Kähkönen, S. Reproducibility of TMS-Evoked EEG responses. Hum. Brain Mapp. 2009, 30, 1387–1396. [Google Scholar] [CrossRef]
- Casarotto, S.; Lauro, L.J.R.; Bellina, V.; Casali, A.G.; Rosanova, M.; Pigorini, A.; Defendi, S.; Mariotti, M.; Massimini, M. EEG responses to TMS are sensitive to changes in the perturbation parameters and repeatable over time. PLoS ONE 2010, 5, e10281. [Google Scholar] [CrossRef] [Green Version]
- Kerwin, L.J.; Keller, C.J.; Wu, W.; Narayan, M.; Etkin, A. Test-retest reliability of transcranial magnetic stimulation EEG evoked potentials. Brain Stimul. 2018, 11, 536–544. [Google Scholar] [CrossRef]
- Ozdemir, R.A.; Boucher, P.; Fried, P.J.; Momi, D.; Jannati, A.; Pascual-Leone, A.; Santarnecchi, E.; Shafi, M.M. Reproducibility of cortical response modulation induced by intermittent and continuous theta-burst stimulation of the human motor cortex. Brain Stimul. 2021, 14, 949–964. [Google Scholar] [CrossRef]
- Ji, G.J.; Wei, J.J.; Liu, T.; Li, D.; Zhu, C.; Yu, F.; Tian, Y.; Wang, K.; Zhang, L.; Hu, P. Aftereffect and Reproducibility of Three Excitatory Repetitive TMS Protocols for a Response Inhibition Task. Front. Neurosci. 2019, 13, 1155. [Google Scholar] [CrossRef] [Green Version]
- Cole, E.J.; Stimpson, K.H.; Bentzley, B.S.; Gulser, M.; Cherian, K.; Tischler, C.; Nejad, R.; Pankow, H.; Choi, E.; Aaron, H.; et al. Stanford Accelerated Intelligent Neuromodulation Therapy for Treatment-Resistant Depression. Am. J. Psychiatry 2020, 177, 716–726. [Google Scholar] [CrossRef]


| Protocol | Median MEP Ratio to Baseline, % | Uncorrected p-Value for MEP Ratio Comparison with 100% | Bonferroni-Corrected p-Value | Median Difference of MEP Ratio between T2 and T3, % | Uncorrected p-Value for MEP Ratio Comparisons between T2 and T3 | Bonferroni-Corrected p-Value | |||
|---|---|---|---|---|---|---|---|---|---|
| T2 | T3 | T2 | T3 | T2 | T3 | ||||
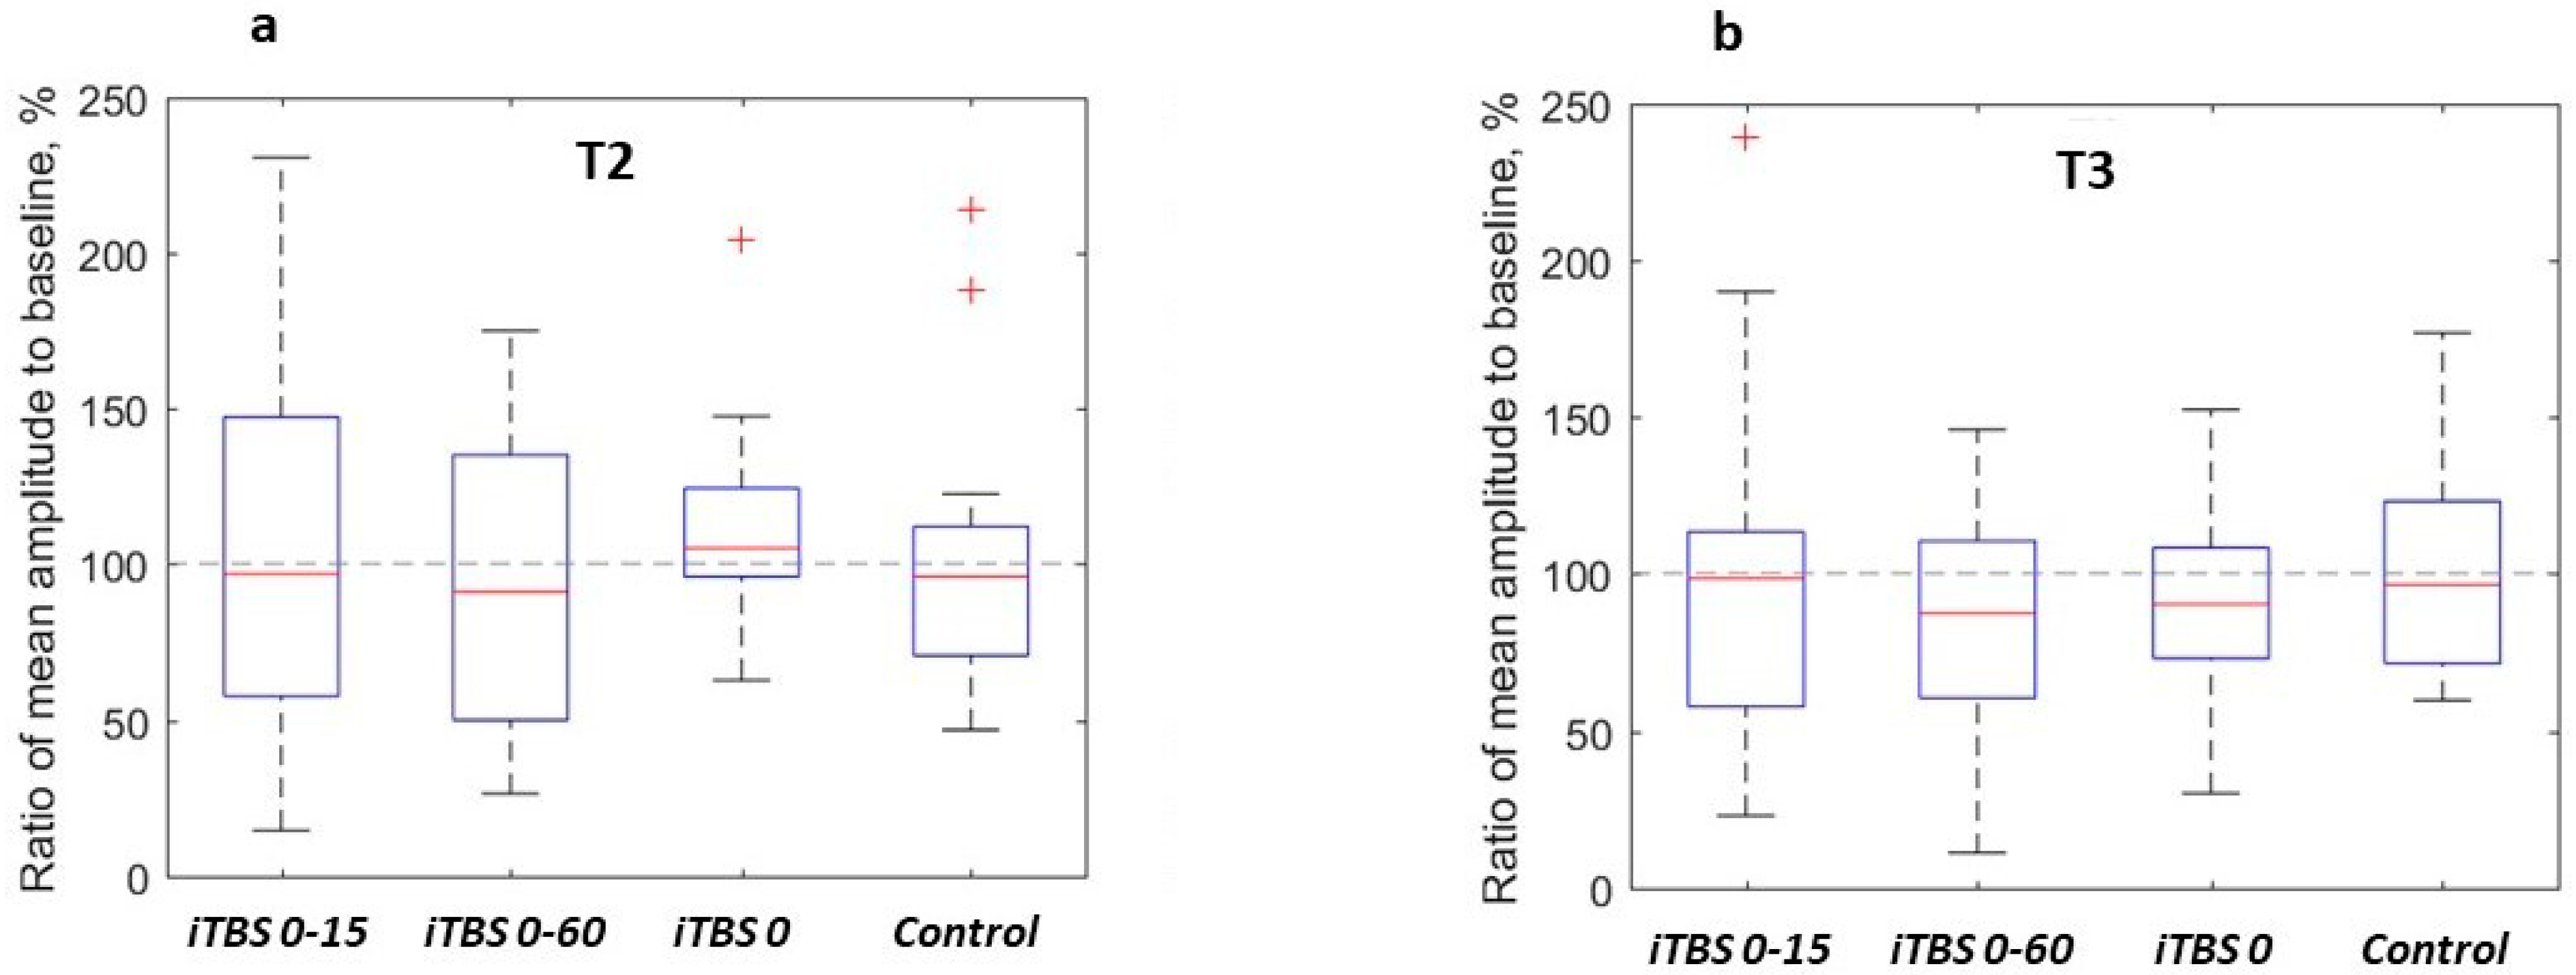
| iTBS 0-15 1 | 96.7 | 98.3 | 0.98 2 | 0.79 | 1.0 | 1.0 | 3.6 | 0.59 | 1.0 |
| iTBS 0-60 | 91 | 87.2 | 0.49 | 0.27 | 1.0 | 1.0 | 6.8 | 0.33 | 1.0 |
| iTBS 0 | 105 | 90.2 | 0.1 | 0.25 | 1.0 | 1.0 | 14.1 | 0.011 | 0.12 |
| Control | 95.9 | 96.4 | 0.62 | 0.75 | 1.0 | 1.0 | 2.5 | 0.91 | 1.0 |
| Comparison | Median Difference of MEP Ratio, % | p-Value for Difference of MEP Ratio with 100% | Difference of Facilitator Rates | p-Value for Facilitation Rate Comparison between T2 and T3 | Difference of Inhibitor Rates | p-Value for Inhibition Rate Comparison between T2 and T3 | ||||||
|---|---|---|---|---|---|---|---|---|---|---|---|---|
| T2 | T3 | Uncorrected | Bonferroni-Corrected | T2 | T3 | Uncorrected | Bonferroni-Corrected | T2 | T3 | Uncorrected | Bonferroni-Corrected | |
| iTBS 0-15 vs. iTBS 0-60 | 5.8 | 1 | pT2 = 0.21 1 pT3 = 0.46 | pT2 = 1.0 pT3 =1.0 | −6 | 0 | pT2 = 1 pT3 = 1 | pT2 = 1.0 pT3 =1.0 | −12 | −12 | pT2 = 0.69 pT3 = 0.73 | pT2 = 1.0 pT3 =1.0 |
| iTBS 0-15 vs. iTBS 0 | −20.3 | −0.3 | pT2 = 0.76 pT3 = 0.62 | pT2 = 1.0 pT3 = 1.0 | −18 | 0 | pT2 = 0.55 pT3 = 1 | pT2 = 1.0 pT3 = 1.0 | 23 | −6 | pT2 = 0.22 pT3 = 1 | pT2 = 1.0 pT3 = 1.0 |
| iTBS 0-15 vs. Control | −19.2 | 2.3 | pT2 = 0.83 pT3 = 0.98 | pT2 = 1.0 pT3 = 1.0 | 5 | −17 | pT2 = 1 pT3 = 0.45 | pT2 = 1.0 pT3 = 1.0 | −6 | −6 | pT2 = 1 pT3 = 1 | pT2 = 1.0 pT3 = 1.0 |
| iTBS 0-60 vs. iTBS 0 | −26 | −5.5 | pT2 = 0.19 pT3 = 0.91 | pT2 = 1.0 pT3 = 1.0 | −12 | 0 | pT2 = 1 pT3 = 0.22 | pT2 = 1.0 pT3 = 1.0 | 35 | 6 | pT2 = 0.031 pT3 = 1 | pT2 = 0.36 pT3 = 1.0 |
| iTBS 0-60 vs. Control | −16.4 | −17.1 | pT2 = 0.38 pT3 = 0.38 | pT2 = 1.0 pT3 = 1.0 | 11 | −17 | pT2 = 0.69 pT3 = 0.51 | pT2 = 1.0 pT3 = 1.0 | 6 | 6 | pT2 = 1 pT3 = 1 | pT2 = 1.0 pT3 = 1.0 |
| iTBS 0 vs. Control | 1.4 | −10.4 | pT2 = 0.52 pT3 = 0.55 | pT2 = 1.0 pT3 = 1.0 | 23 | −17 | pT2 = 0.22 pT3 = 0.45 | pT2 = 1.0 pT3 = 1.0 | −29 | 0 | pT2 = 0.063 pT3 = 1 | pT2 = 0.76 pT3 = 1.0 |
| Protocol | Rate of Facilitators, % | Uncorrected p-Value for Facilitation Rate Comparison between T2 and T3 | Bonferroni-Corrected p-Value | Rate of Inhibitors, % | Uncorrected p-Value for Inhibition Rate Comparison between T2 and T3 | Bonferroni-Corrected p-Value | ||
|---|---|---|---|---|---|---|---|---|
| T2 | T3 | T2 | T3 | |||||
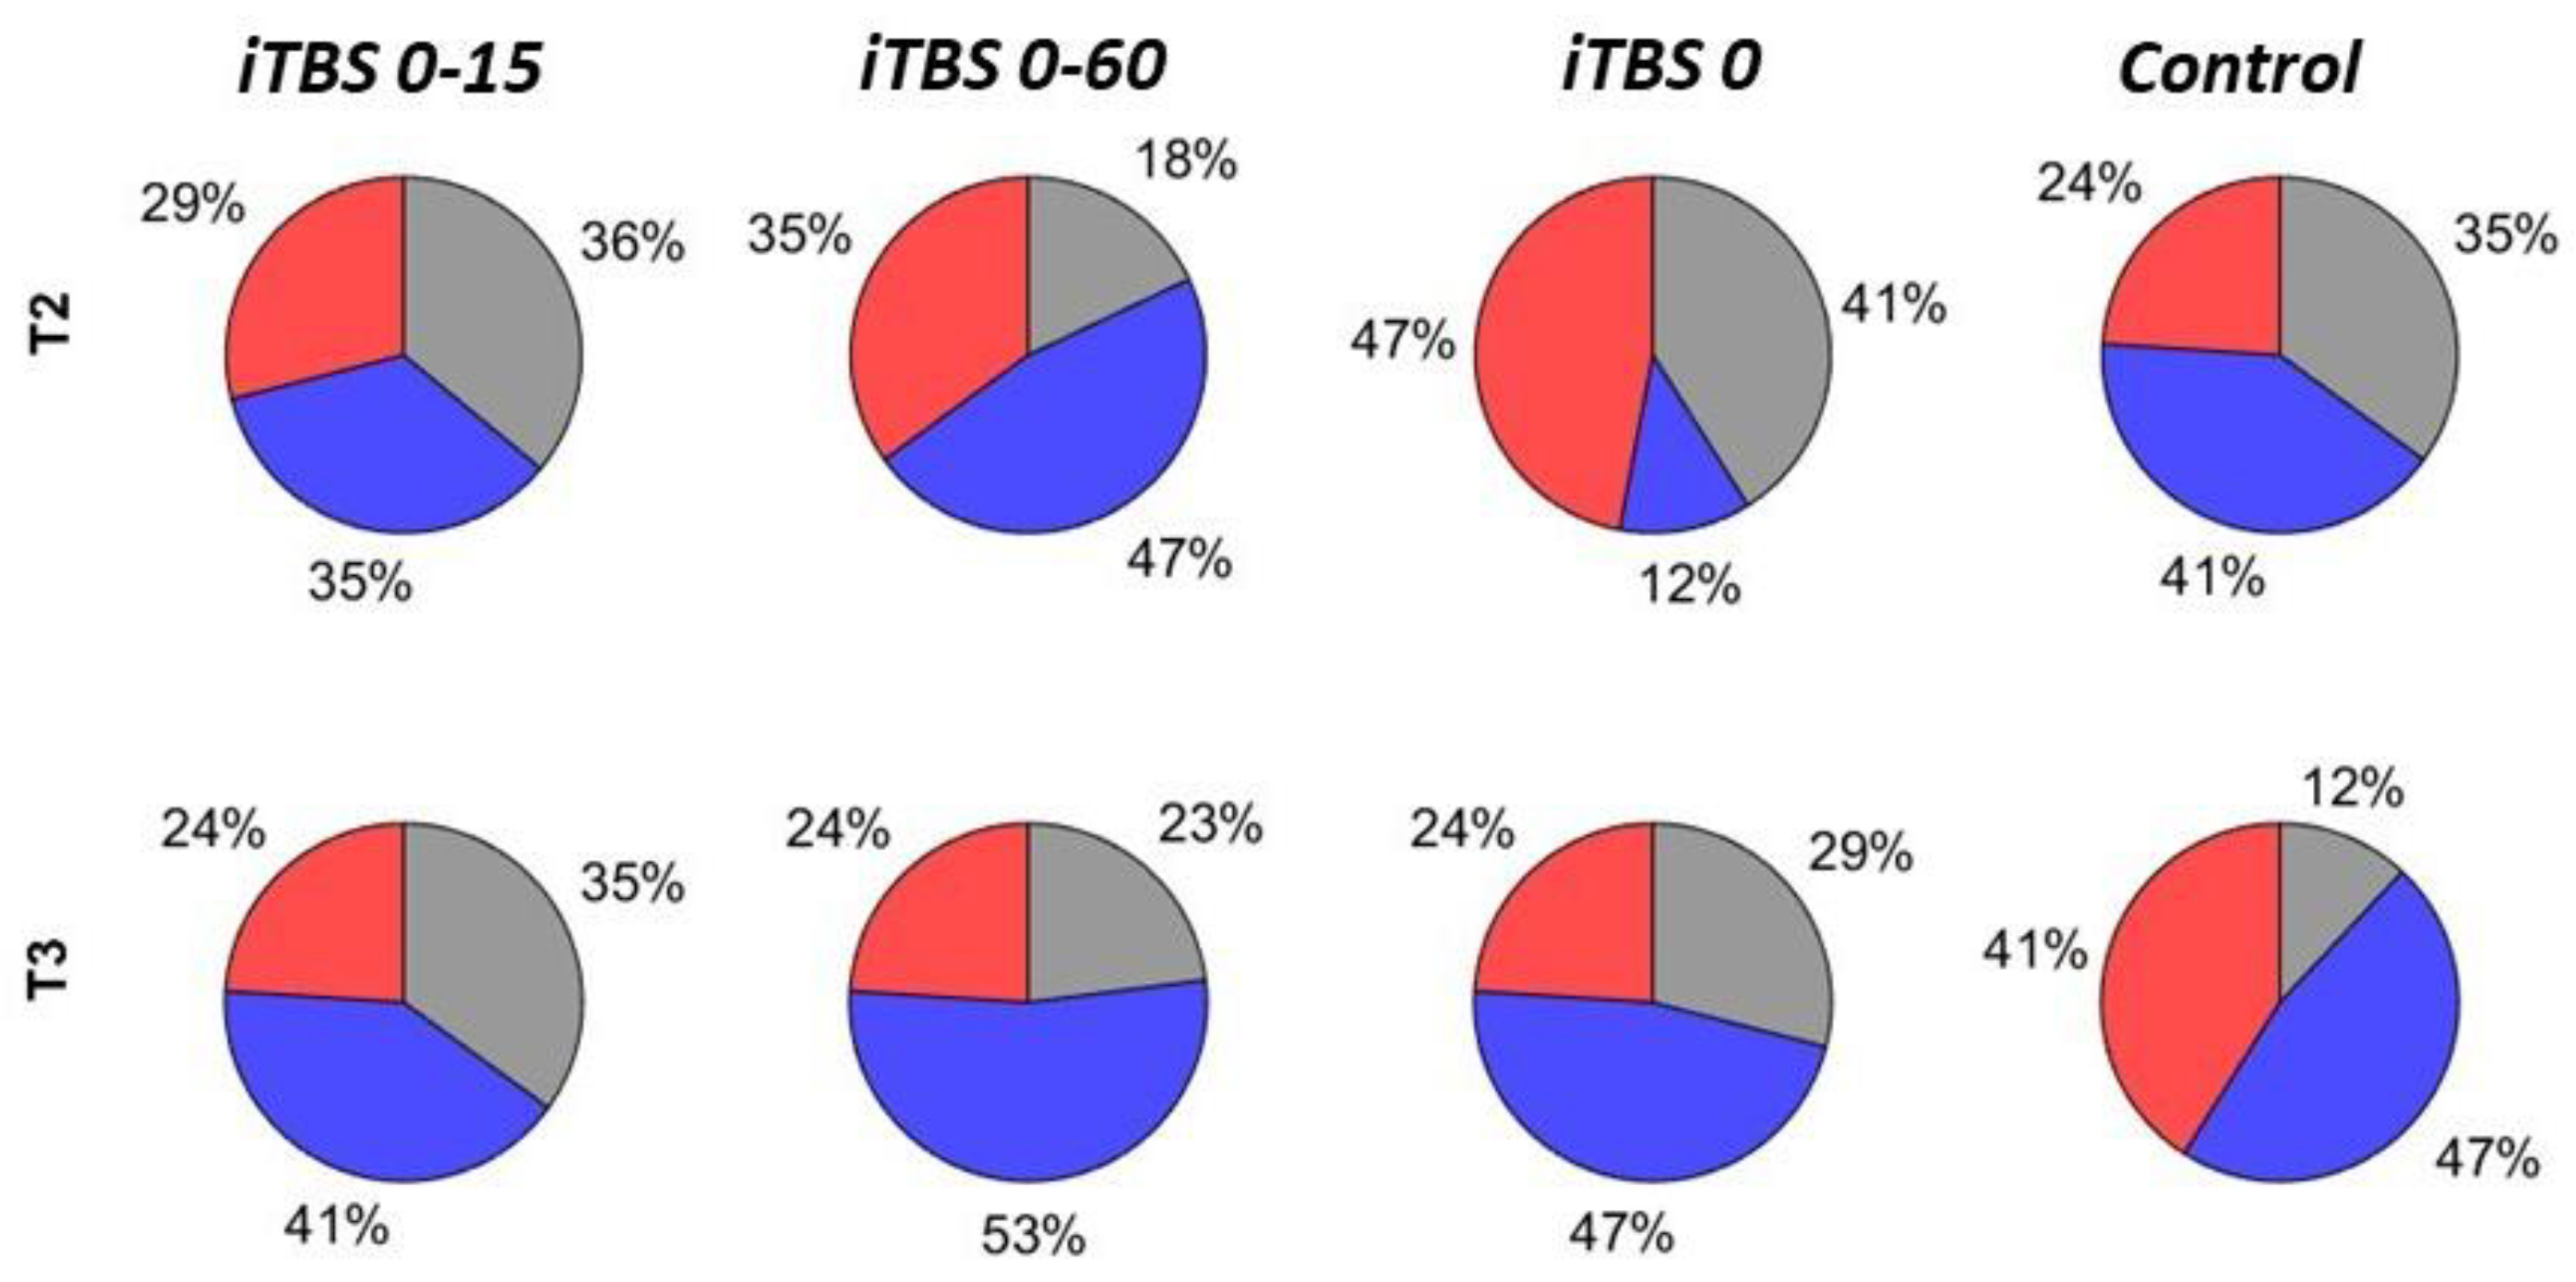
| iTBS 0-15 | 29 | 24 | 1.0 | 1.0 | 35 | 41 | 1.0 | 1.0 |
| iTBS 0-60 | 35 | 24 | 0.5 | 1.0 | 47 | 53 | 1.0 | 1.0 |
| iTBS 0 | 47 | 24 | 0.22 | 1.0 | 12 | 47 | 0.031 | 1.0 |
| Control | 24 | 41 | 0.45 | 1.0 | 41 | 47 | 1.0 | 1.0 |
| Facilitation | |||
|---|---|---|---|
| Facilitation in iTBS 0-60 at T3 | No Facilitation in iTBS 0-60 at T3 | Odds Ratio | |
| Facilitation in iTBS 0-60 at T2 | 4/17 | 2/17 | inf. 1 |
| No facilitation in iTBS 0-60 at T2 | 0/17 | 11/17 | |
| Facilitation in iTBS 0-60 at T3 | No facilitation in iTBS 0-60 at T3 | ||
| Facilitation in iTBS 0-15 at T3 | 3/17 | 1/17 | 36 |
| No facilitation in iTBS 0-15 at T3 | 1/17 | 12/17 | |
| Inhibition | |||
| Inhibition in iTBS 0-15 at T3 | No Inhibition in iTBS 0-15 at T3 | Odds Ratio | |
| Inhibition in iTBS 0-15 at T2 | 5/17 | 1/17 | 23 |
| No inhibition in iTBS 0-15 at T2 | 2/17 | 9/17 | |
| Inhibition in iTBS 0-60 at T3 | No inhibition in iTBS 0-60 at T3 | ||
| Inhibition in iTBS 0-60 at T2 | 8/17 | 0/17 | inf. |
| No inhibition in iTBS 0-60 at T2 | 1/17 | 8/17 | |
Publisher’s Note: MDPI stays neutral with regard to jurisdictional claims in published maps and institutional affiliations. |
© 2022 by the authors. Licensee MDPI, Basel, Switzerland. This article is an open access article distributed under the terms and conditions of the Creative Commons Attribution (CC BY) license (https://creativecommons.org/licenses/by/4.0/).
Share and Cite
Bakulin, I.; Zabirova, A.; Sinitsyn, D.; Poydasheva, A.; Lagoda, D.; Suponeva, N.; Piradov, M. Adding a Second iTBS Block in 15 or 60 Min Time Interval Does Not Increase iTBS Effects on Motor Cortex Excitability and the Responder Rates. Brain Sci. 2022, 12, 1064. https://doi.org/10.3390/brainsci12081064
Bakulin I, Zabirova A, Sinitsyn D, Poydasheva A, Lagoda D, Suponeva N, Piradov M. Adding a Second iTBS Block in 15 or 60 Min Time Interval Does Not Increase iTBS Effects on Motor Cortex Excitability and the Responder Rates. Brain Sciences. 2022; 12(8):1064. https://doi.org/10.3390/brainsci12081064
Chicago/Turabian StyleBakulin, Ilya, Alfiia Zabirova, Dmitry Sinitsyn, Alexandra Poydasheva, Dmitry Lagoda, Natalia Suponeva, and Michael Piradov. 2022. "Adding a Second iTBS Block in 15 or 60 Min Time Interval Does Not Increase iTBS Effects on Motor Cortex Excitability and the Responder Rates" Brain Sciences 12, no. 8: 1064. https://doi.org/10.3390/brainsci12081064