
Brain Pathways in LIS1-Associated Lissencephaly Revealed by Diffusion MRI Tractography

 , ,
, ,
Abstract
:1. Introduction
2. Materials and Methods
2.1. Diffusion MRI Acquisition and Analysis
2.2. Information about the Cases
2.2.1. Lissencephaly
2.2.2. Control
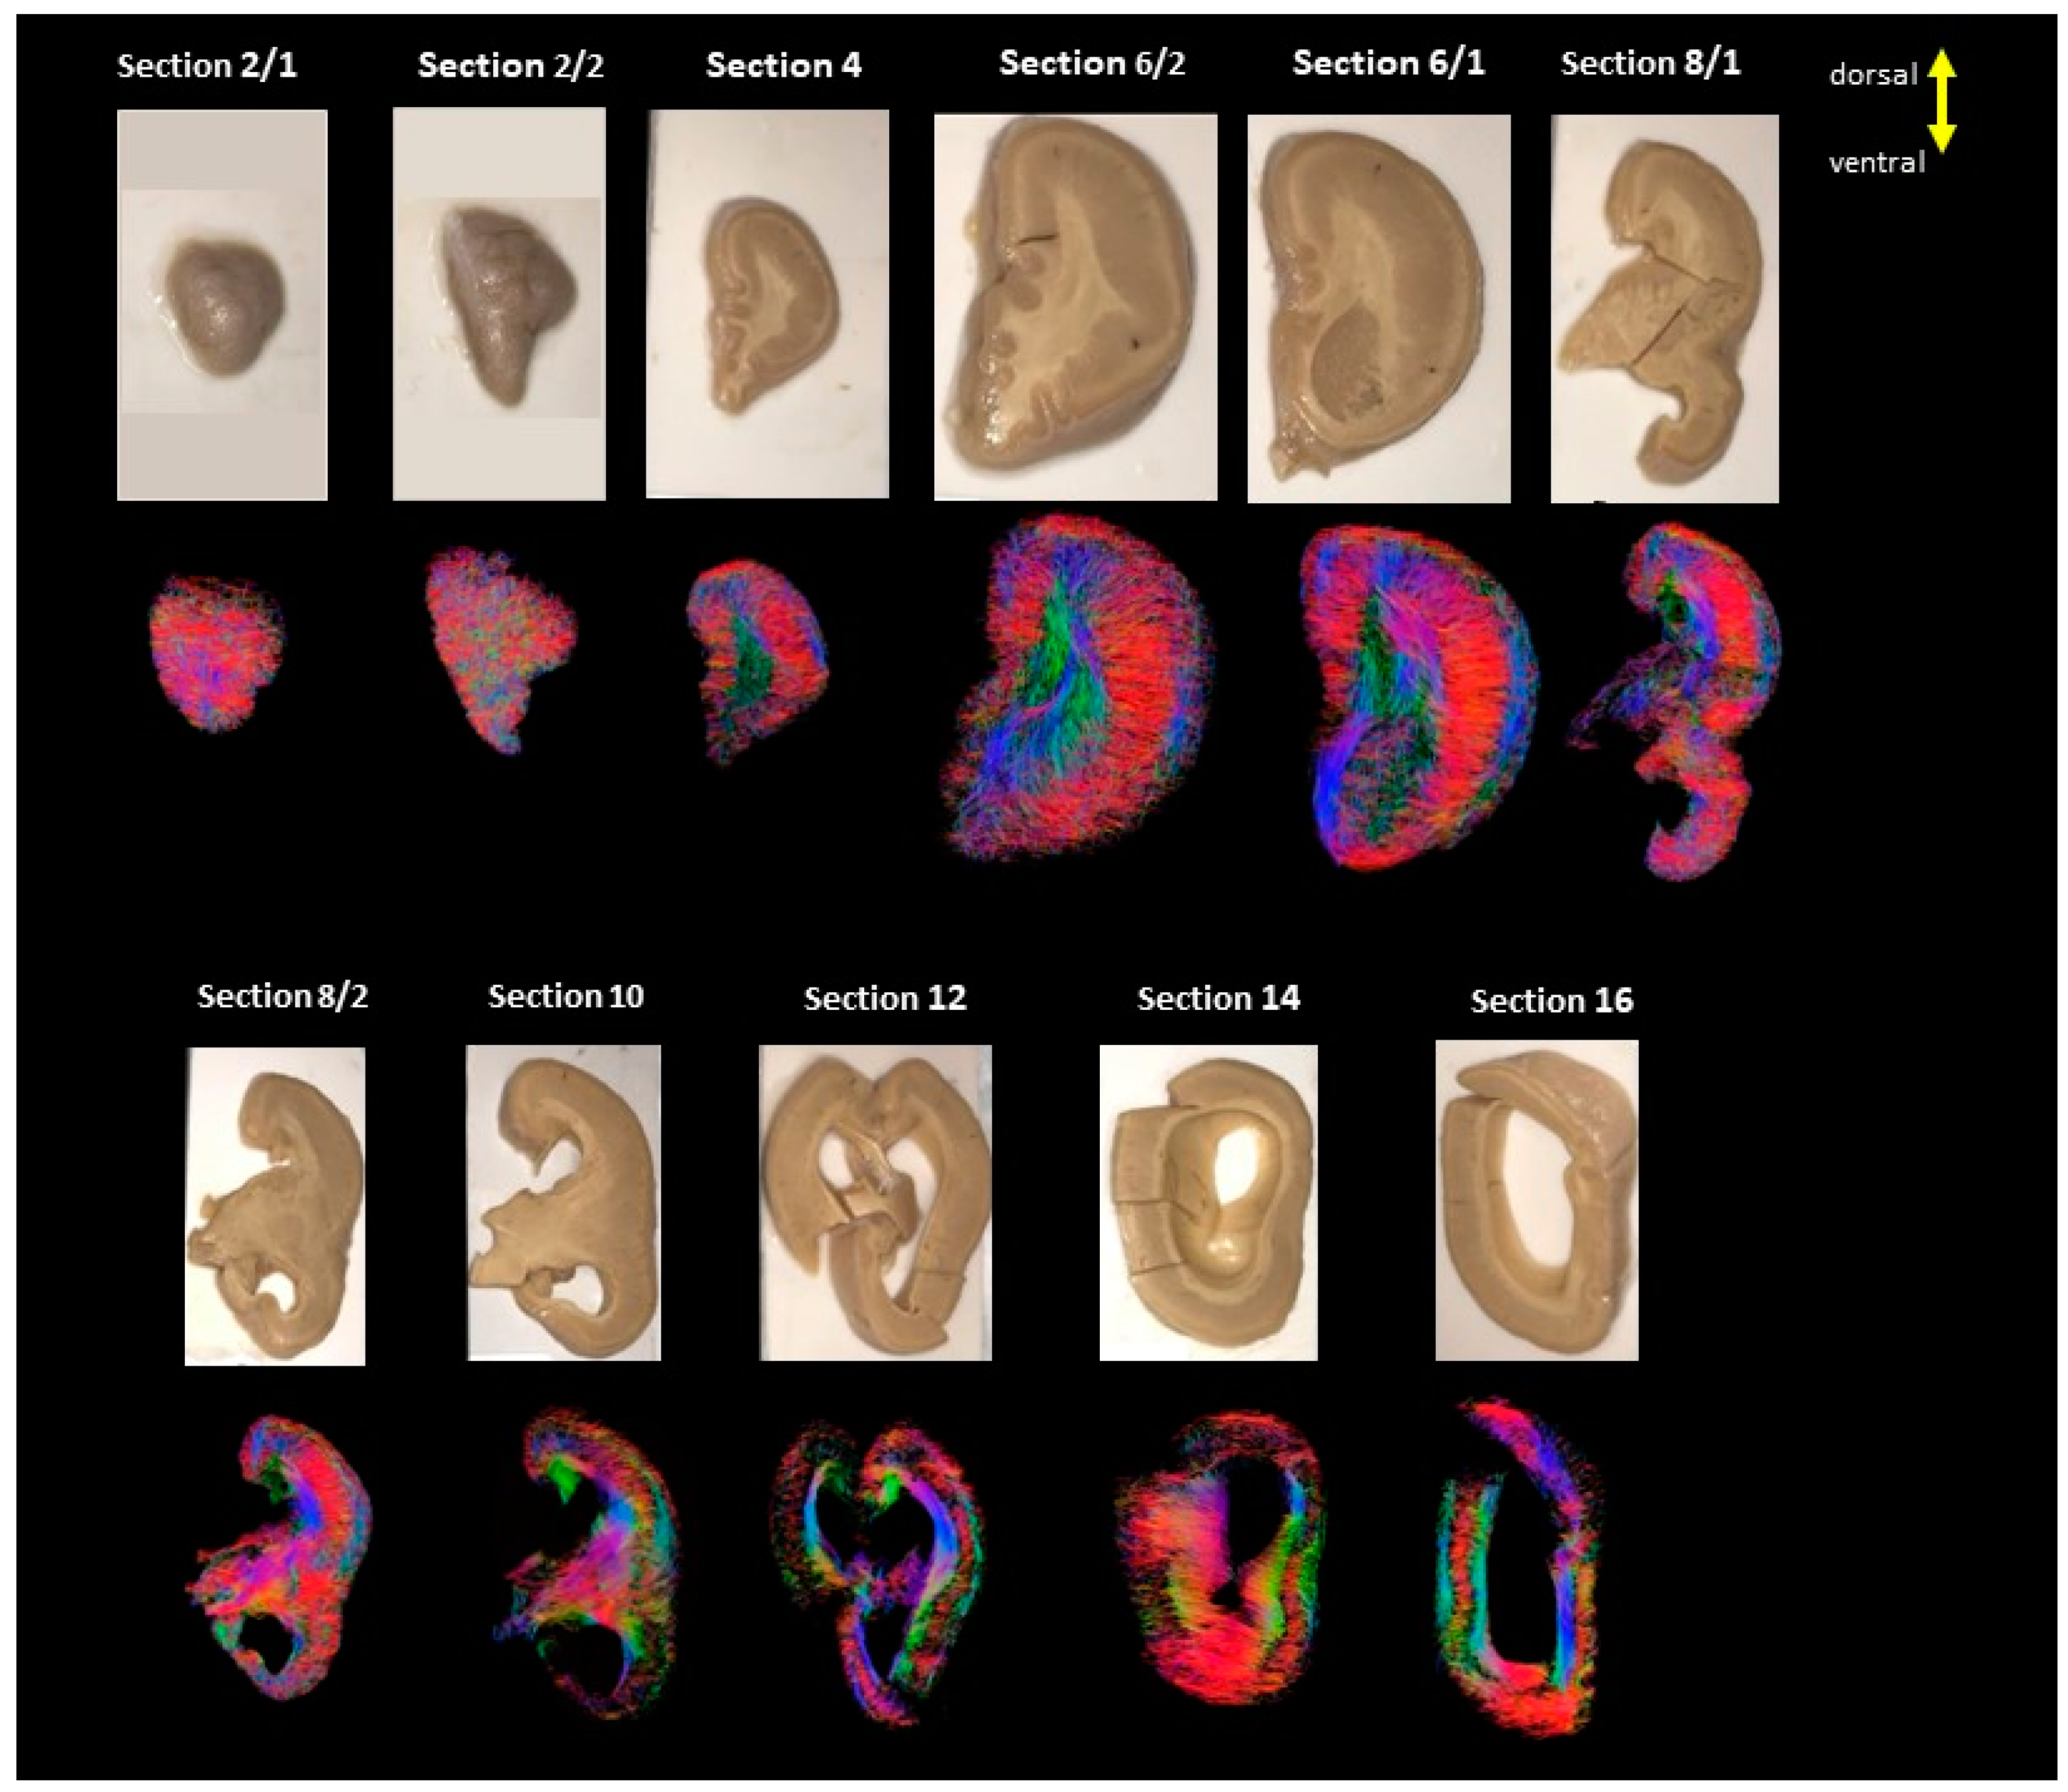
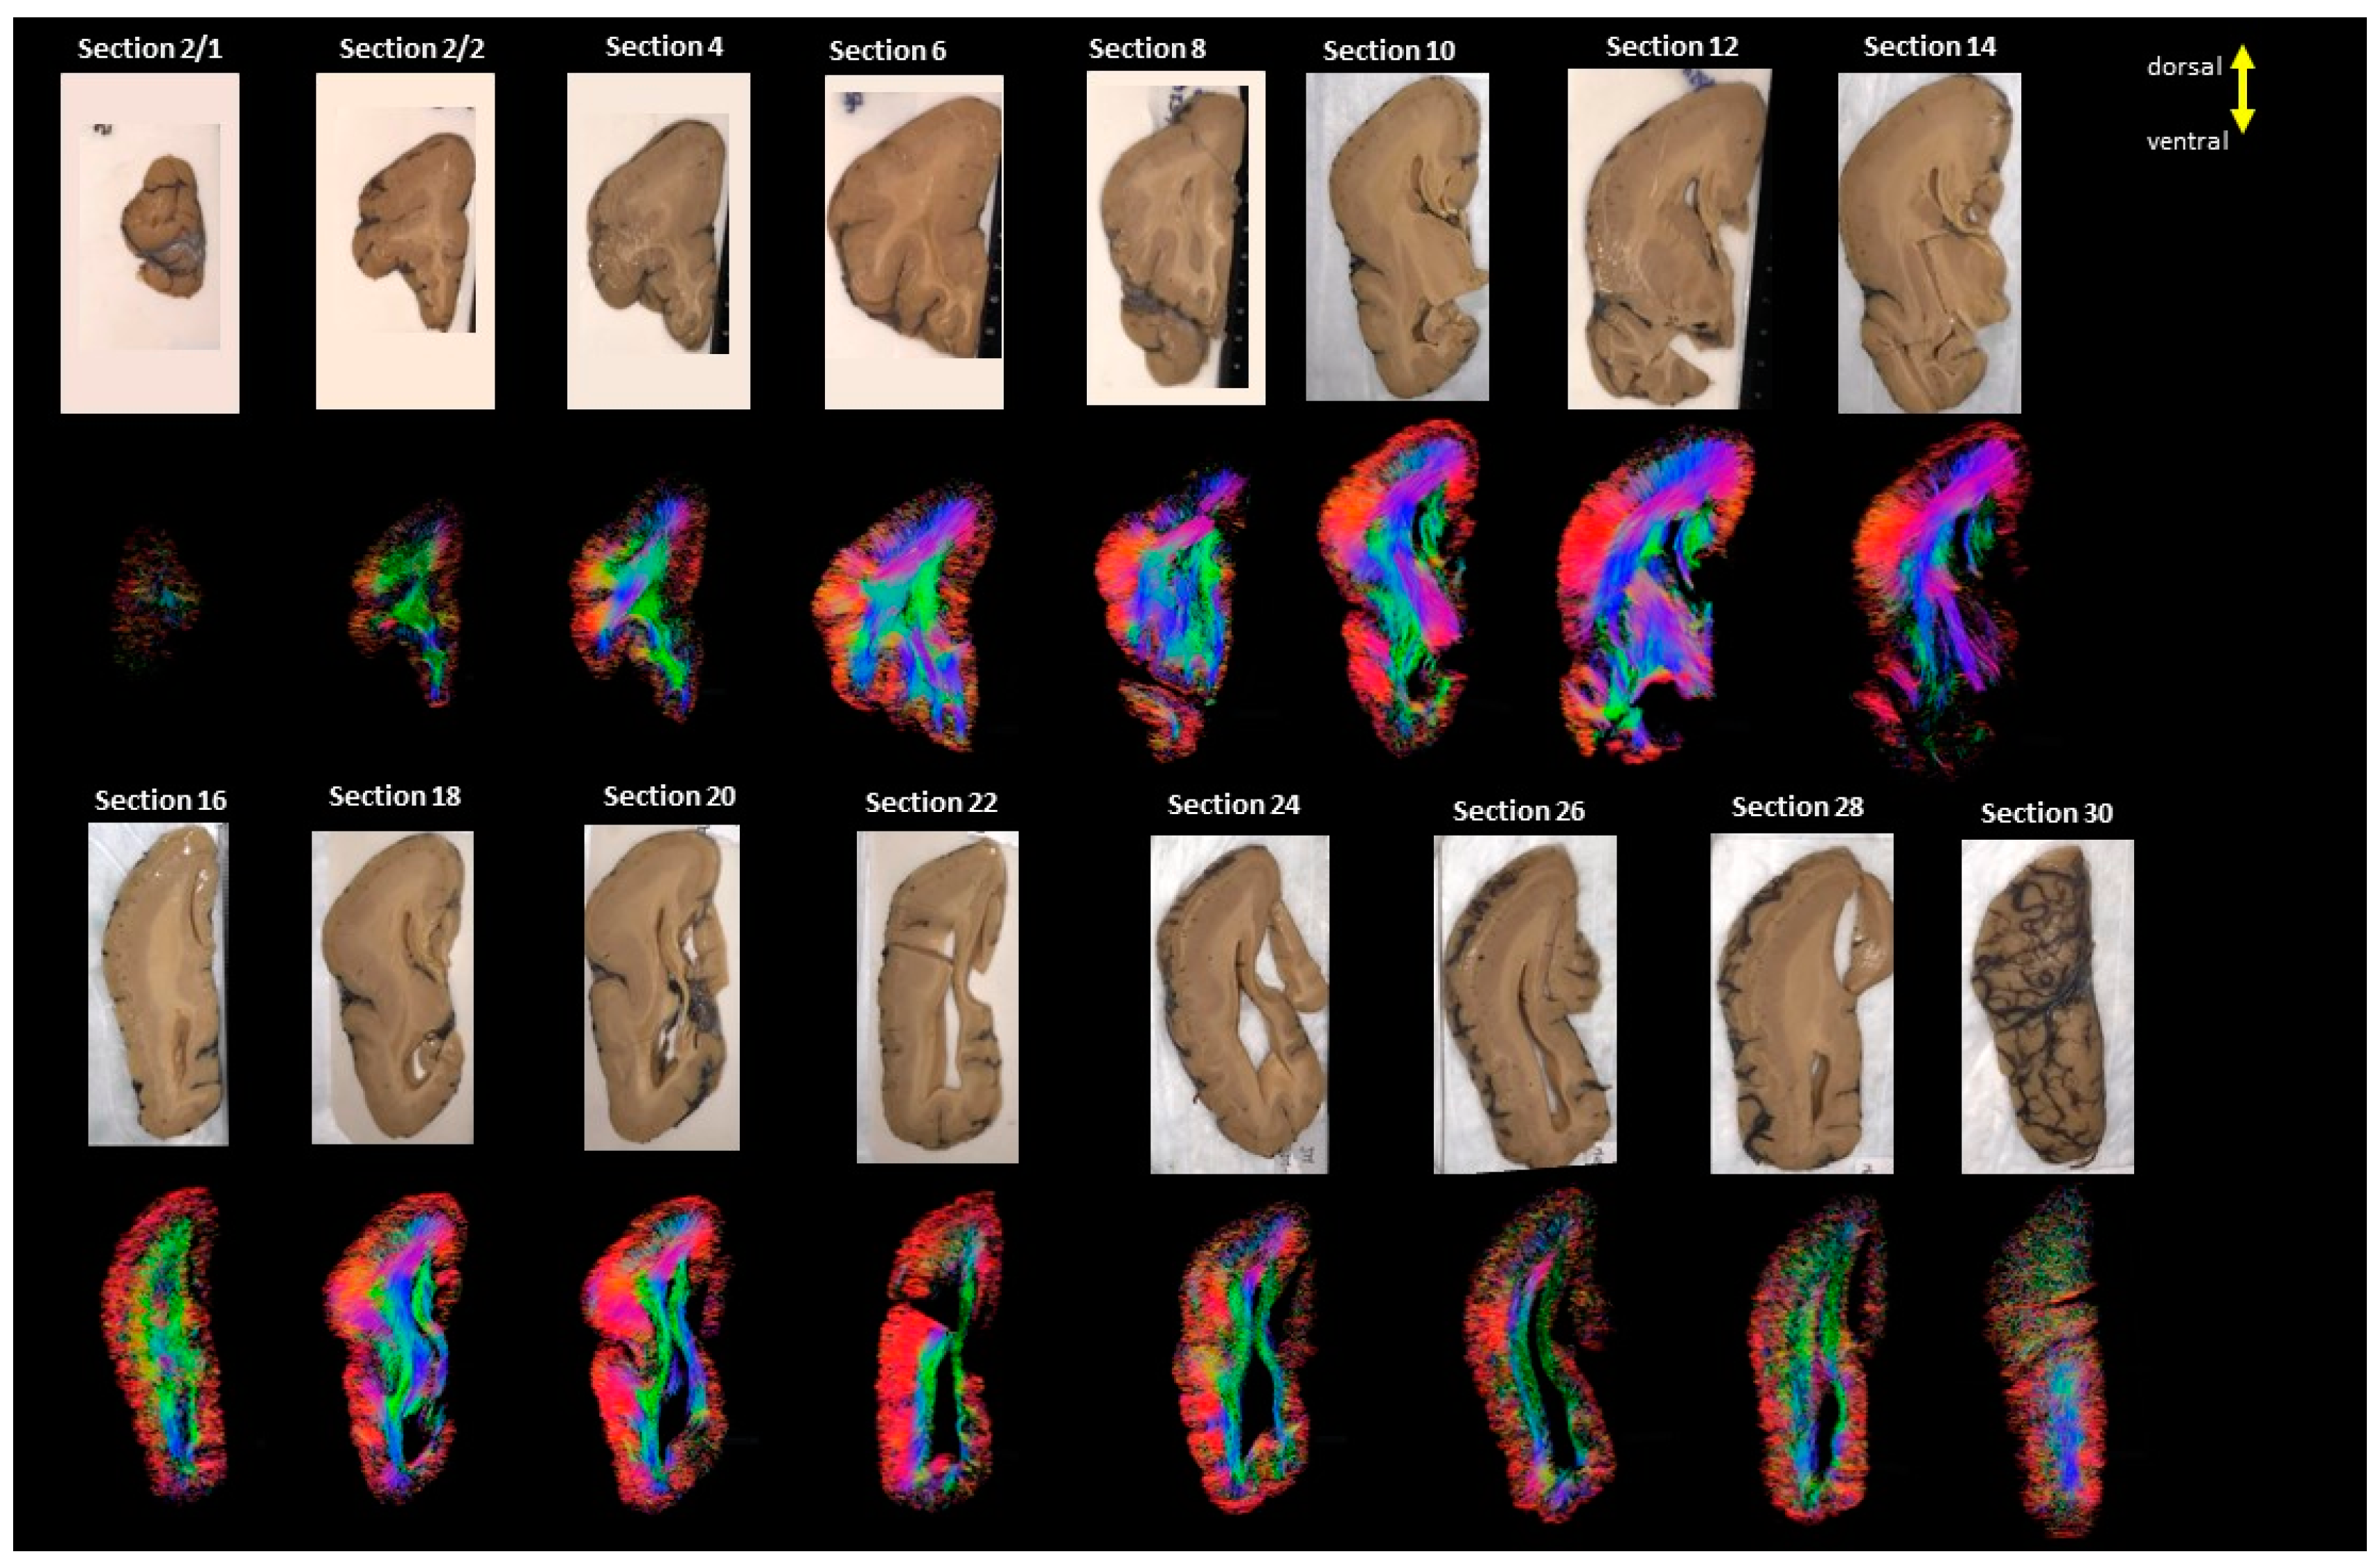
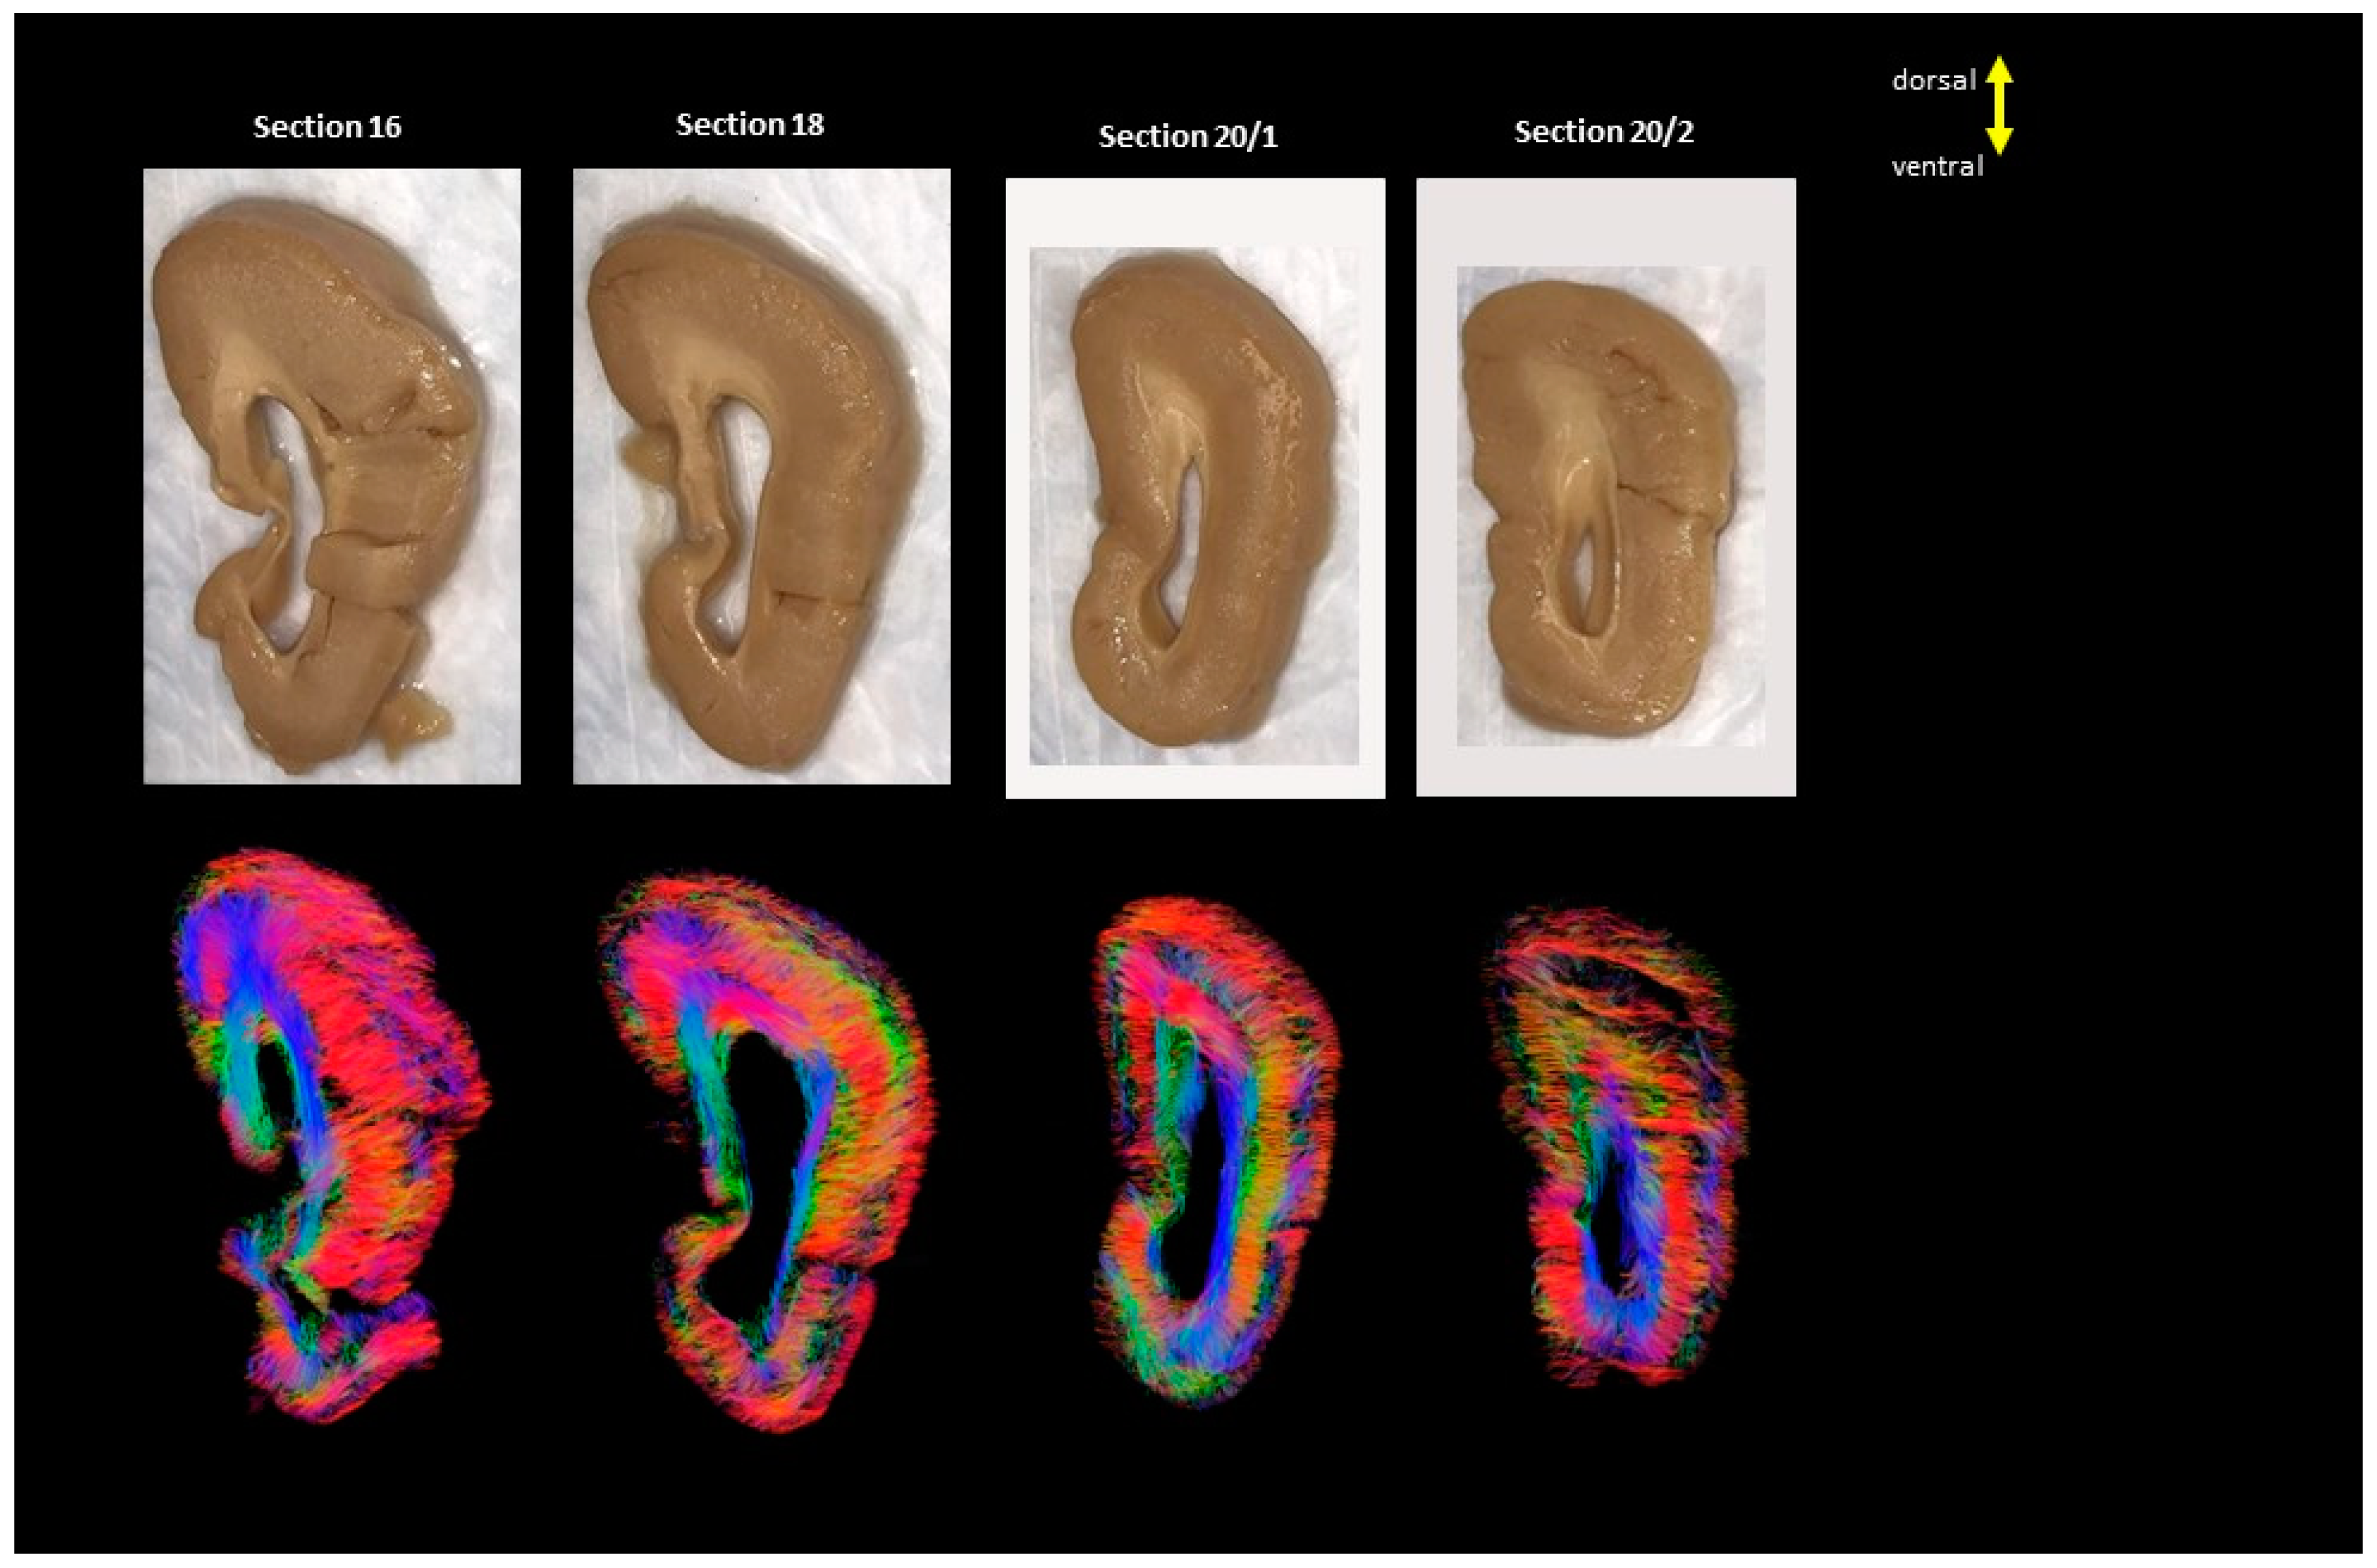
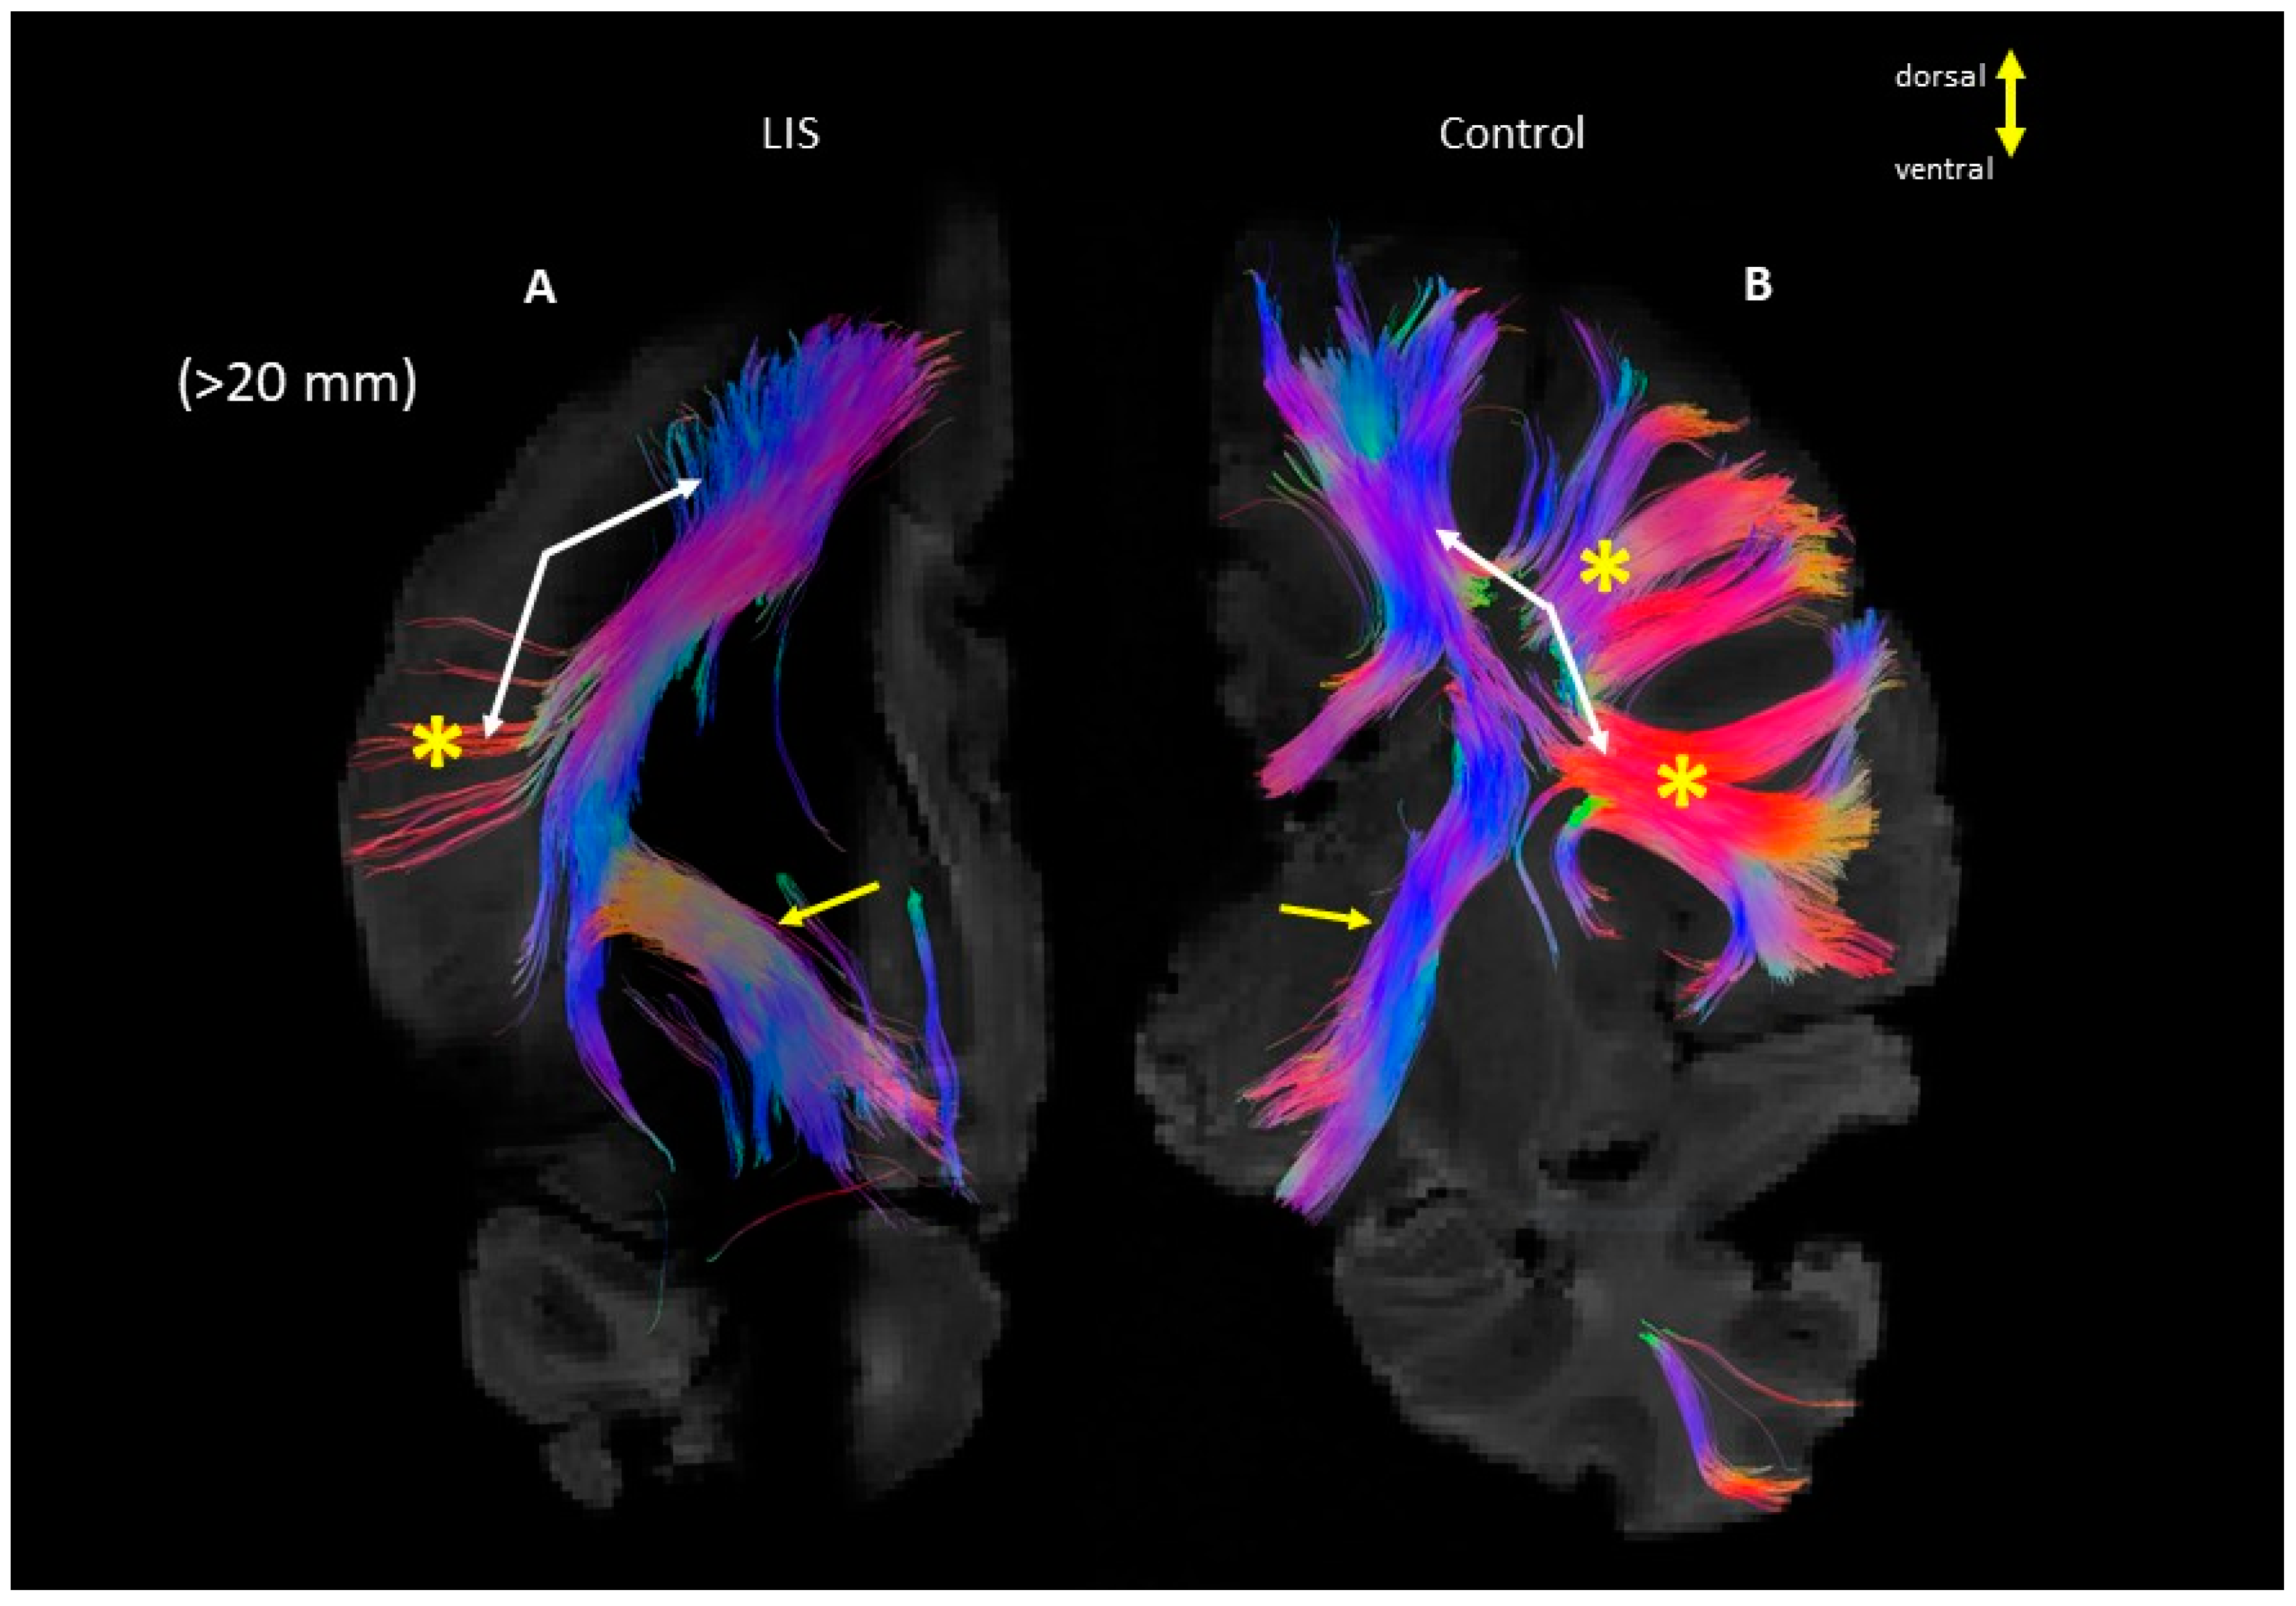
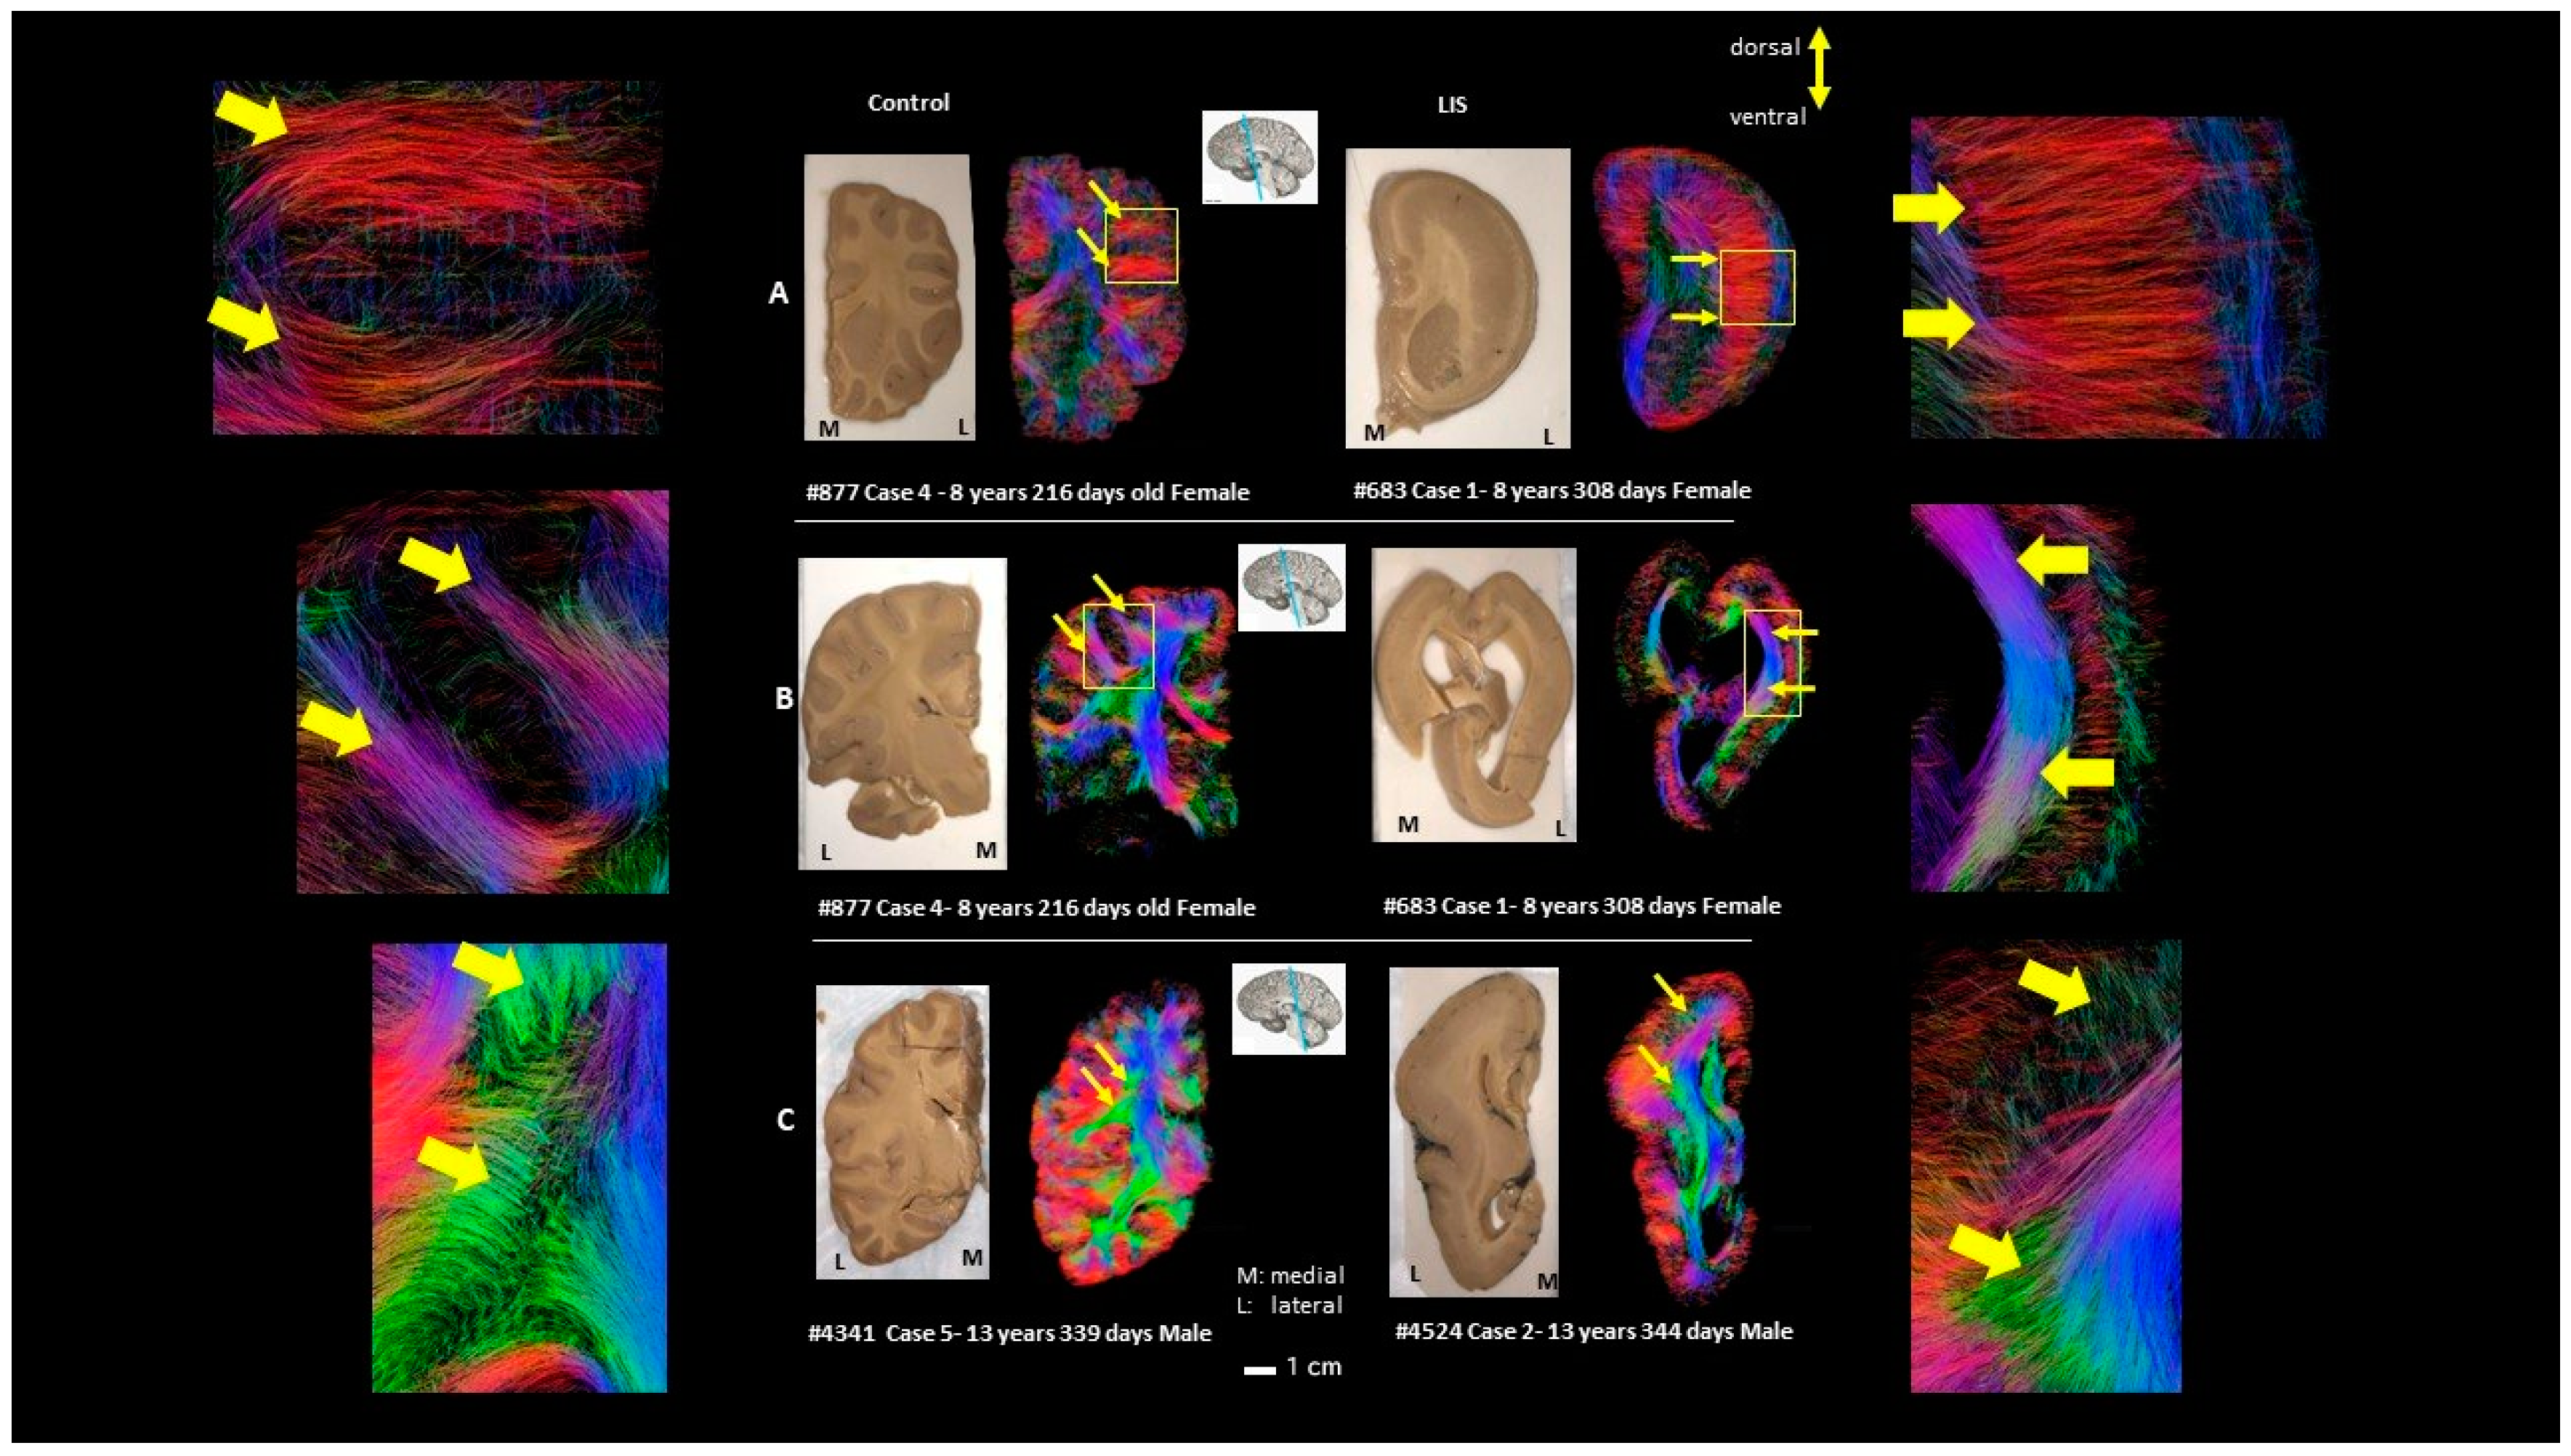
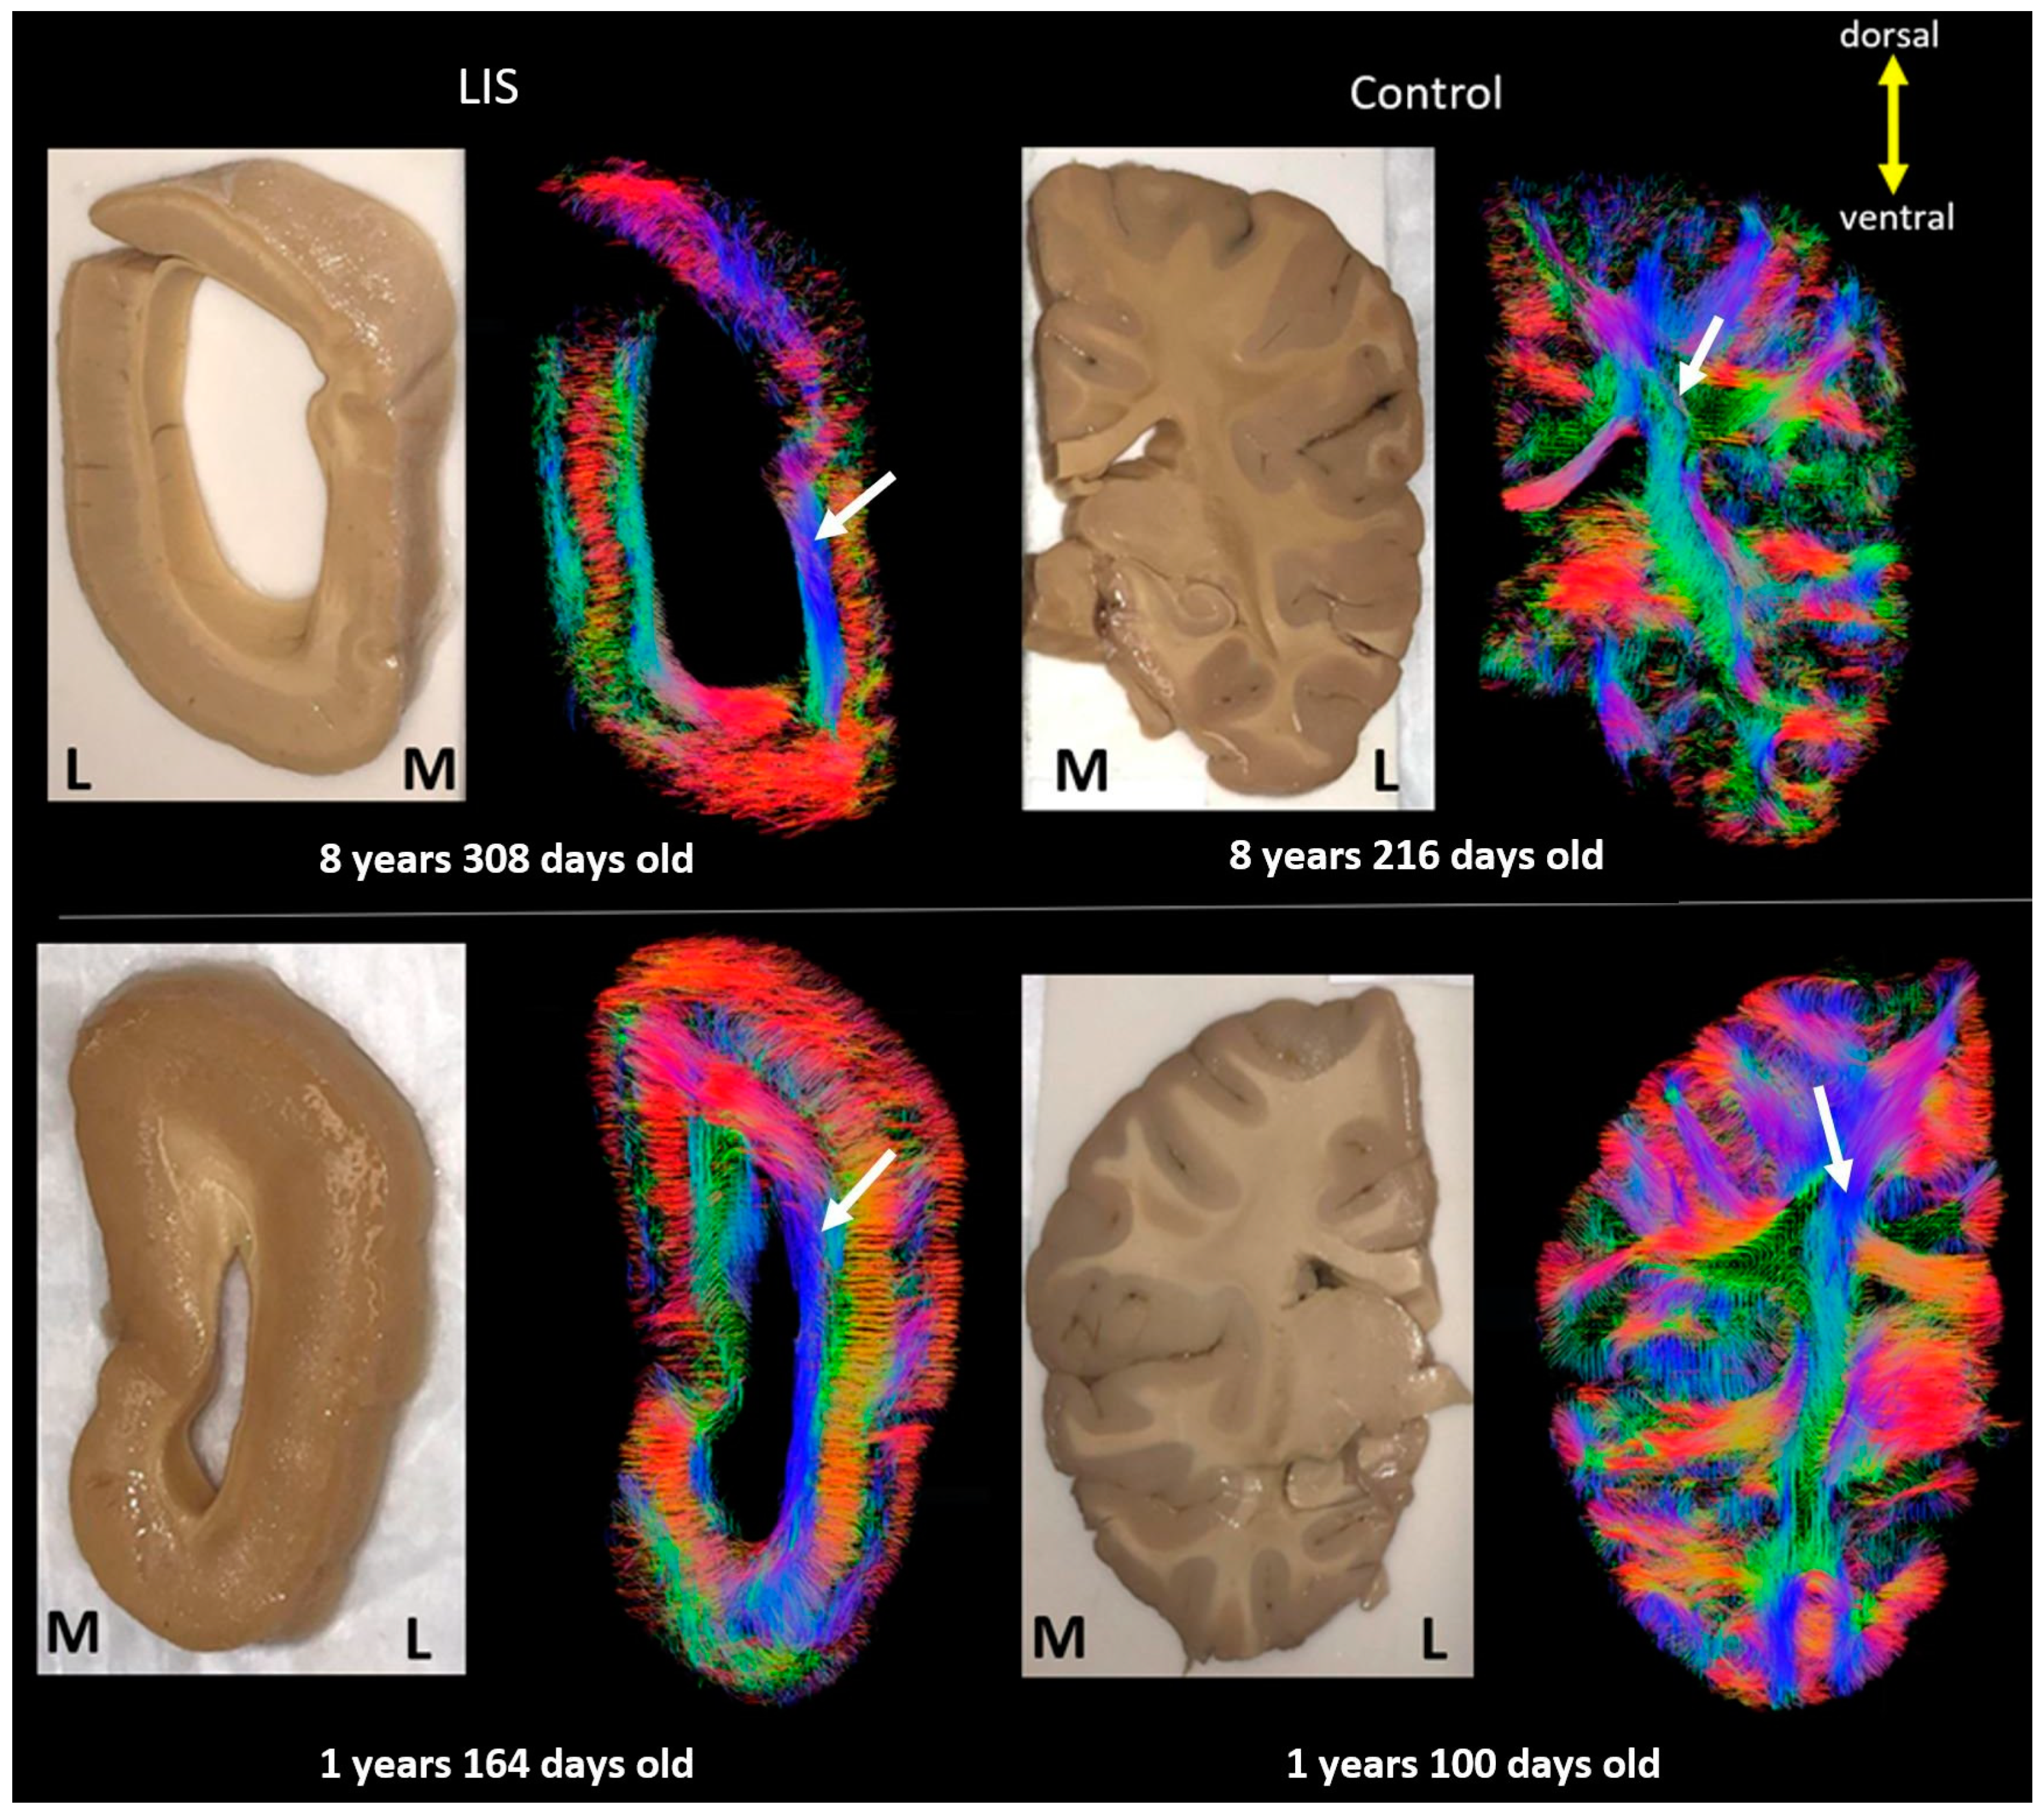
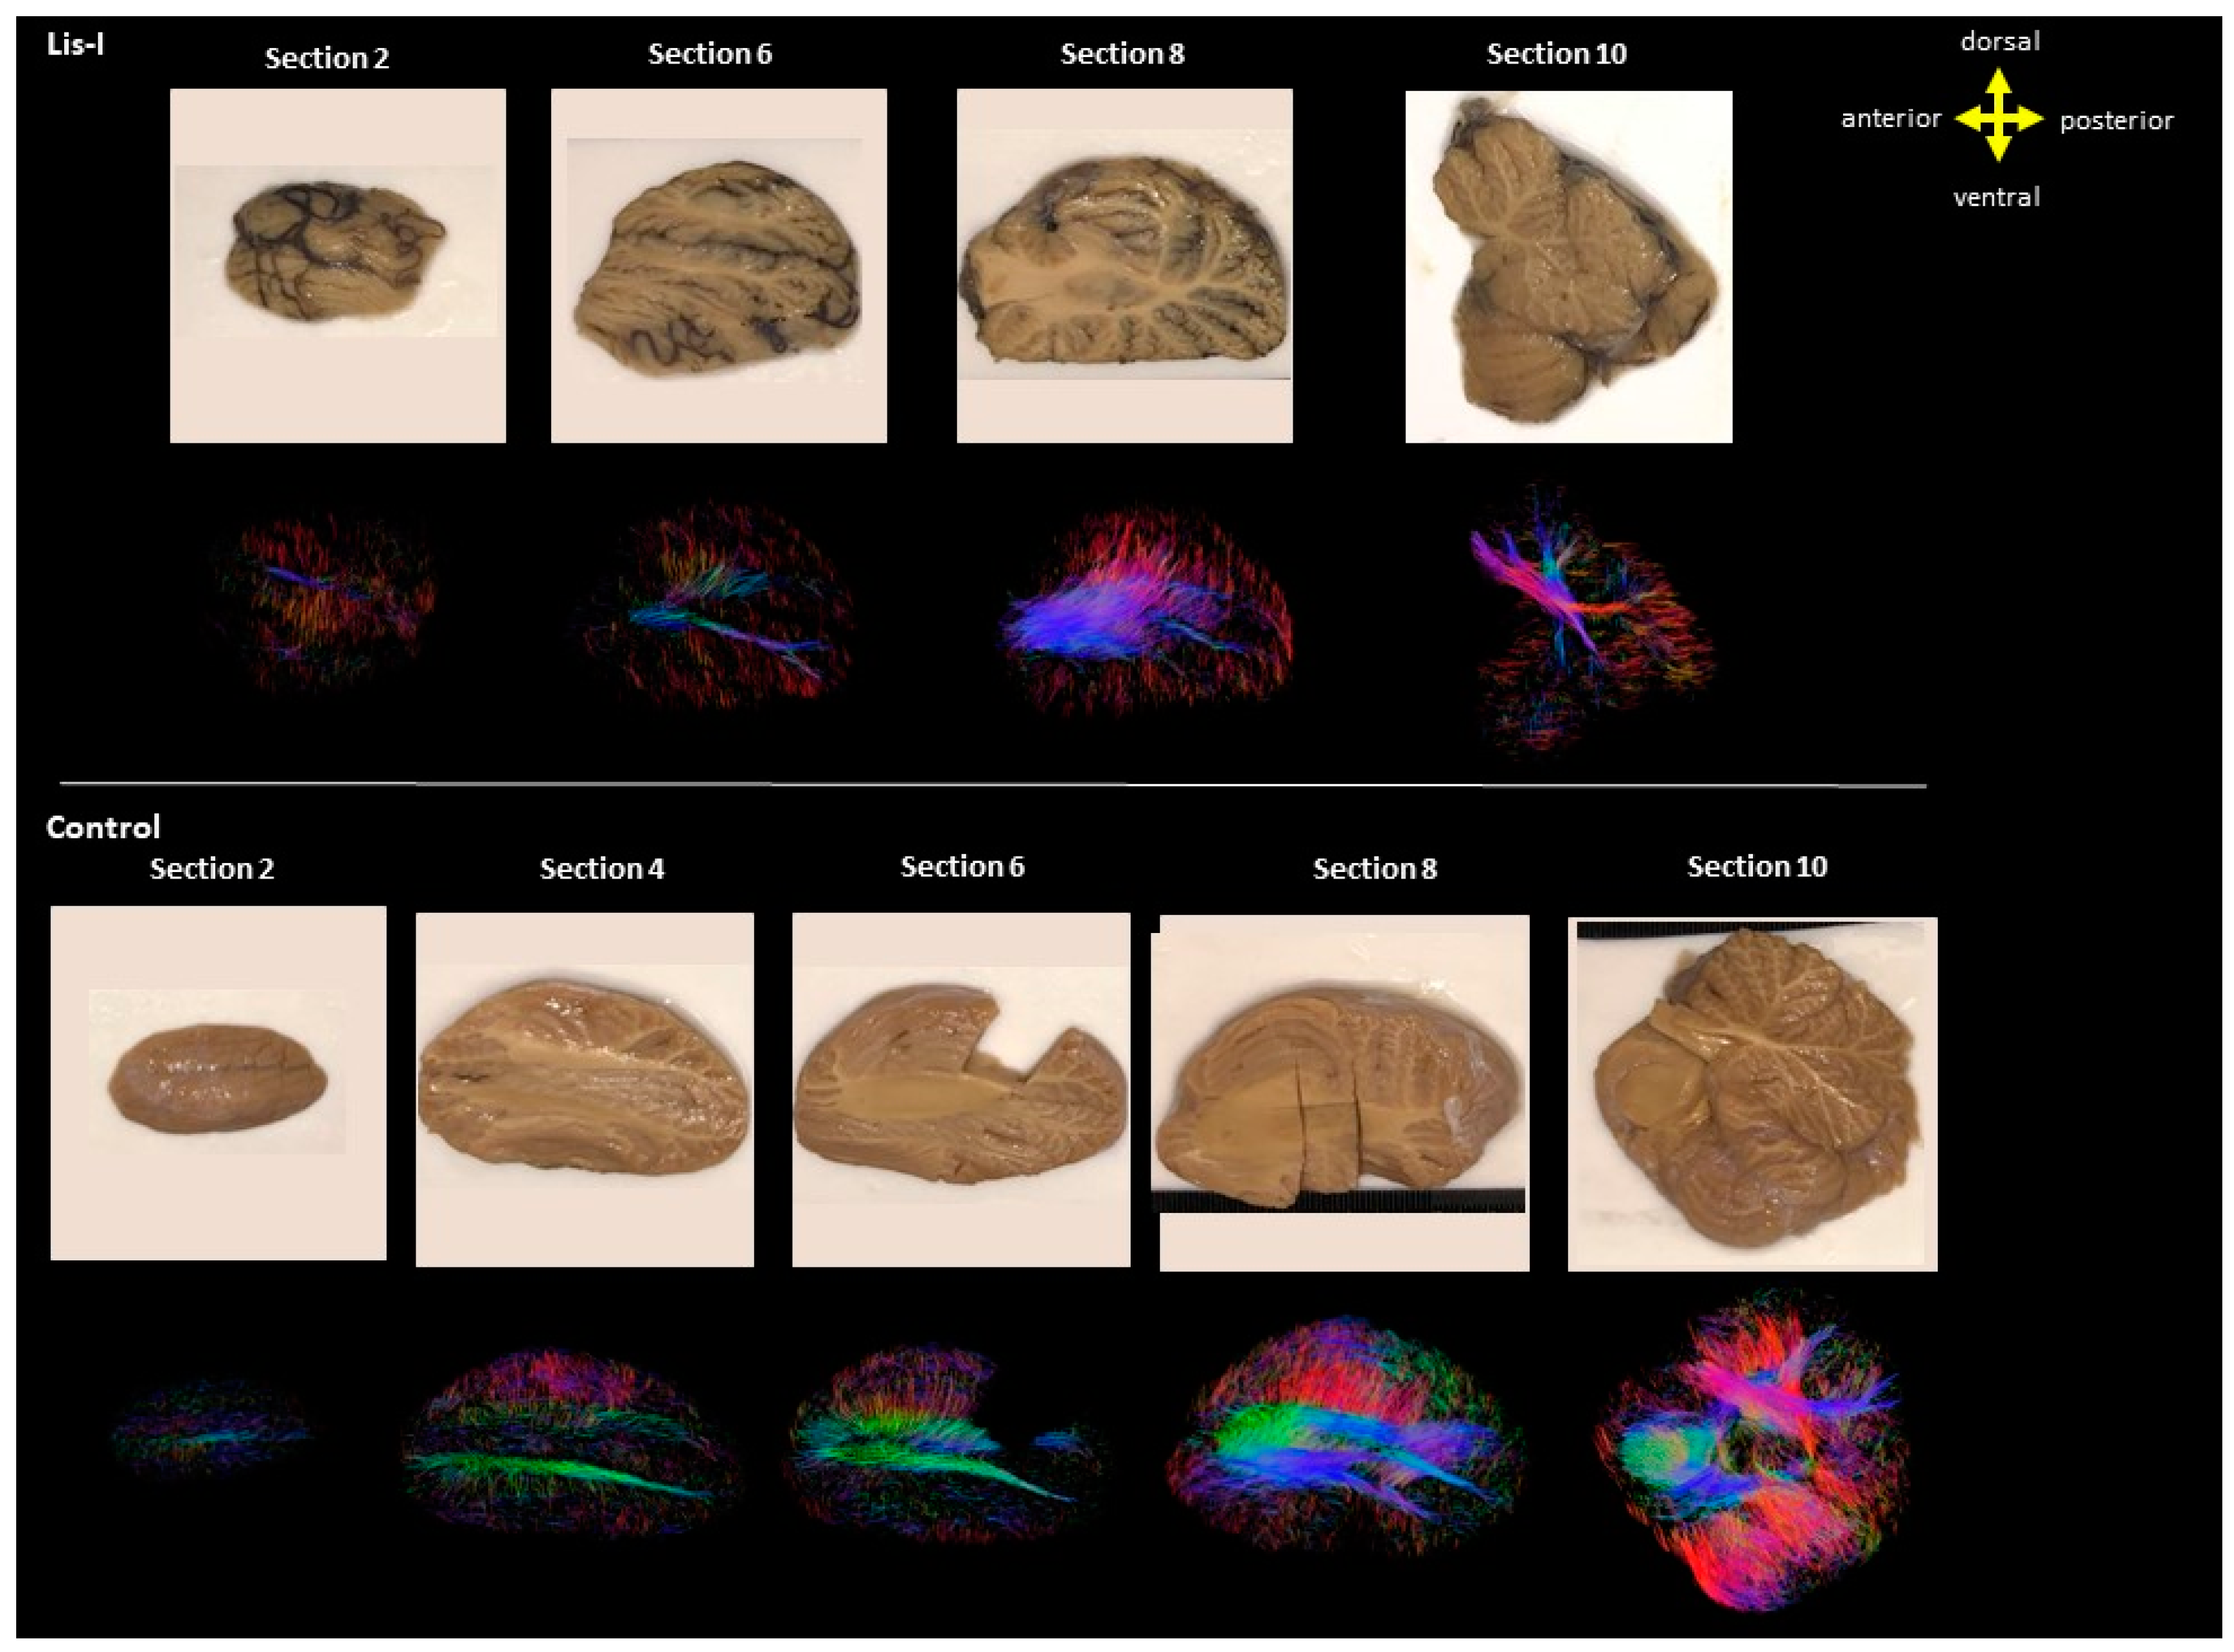
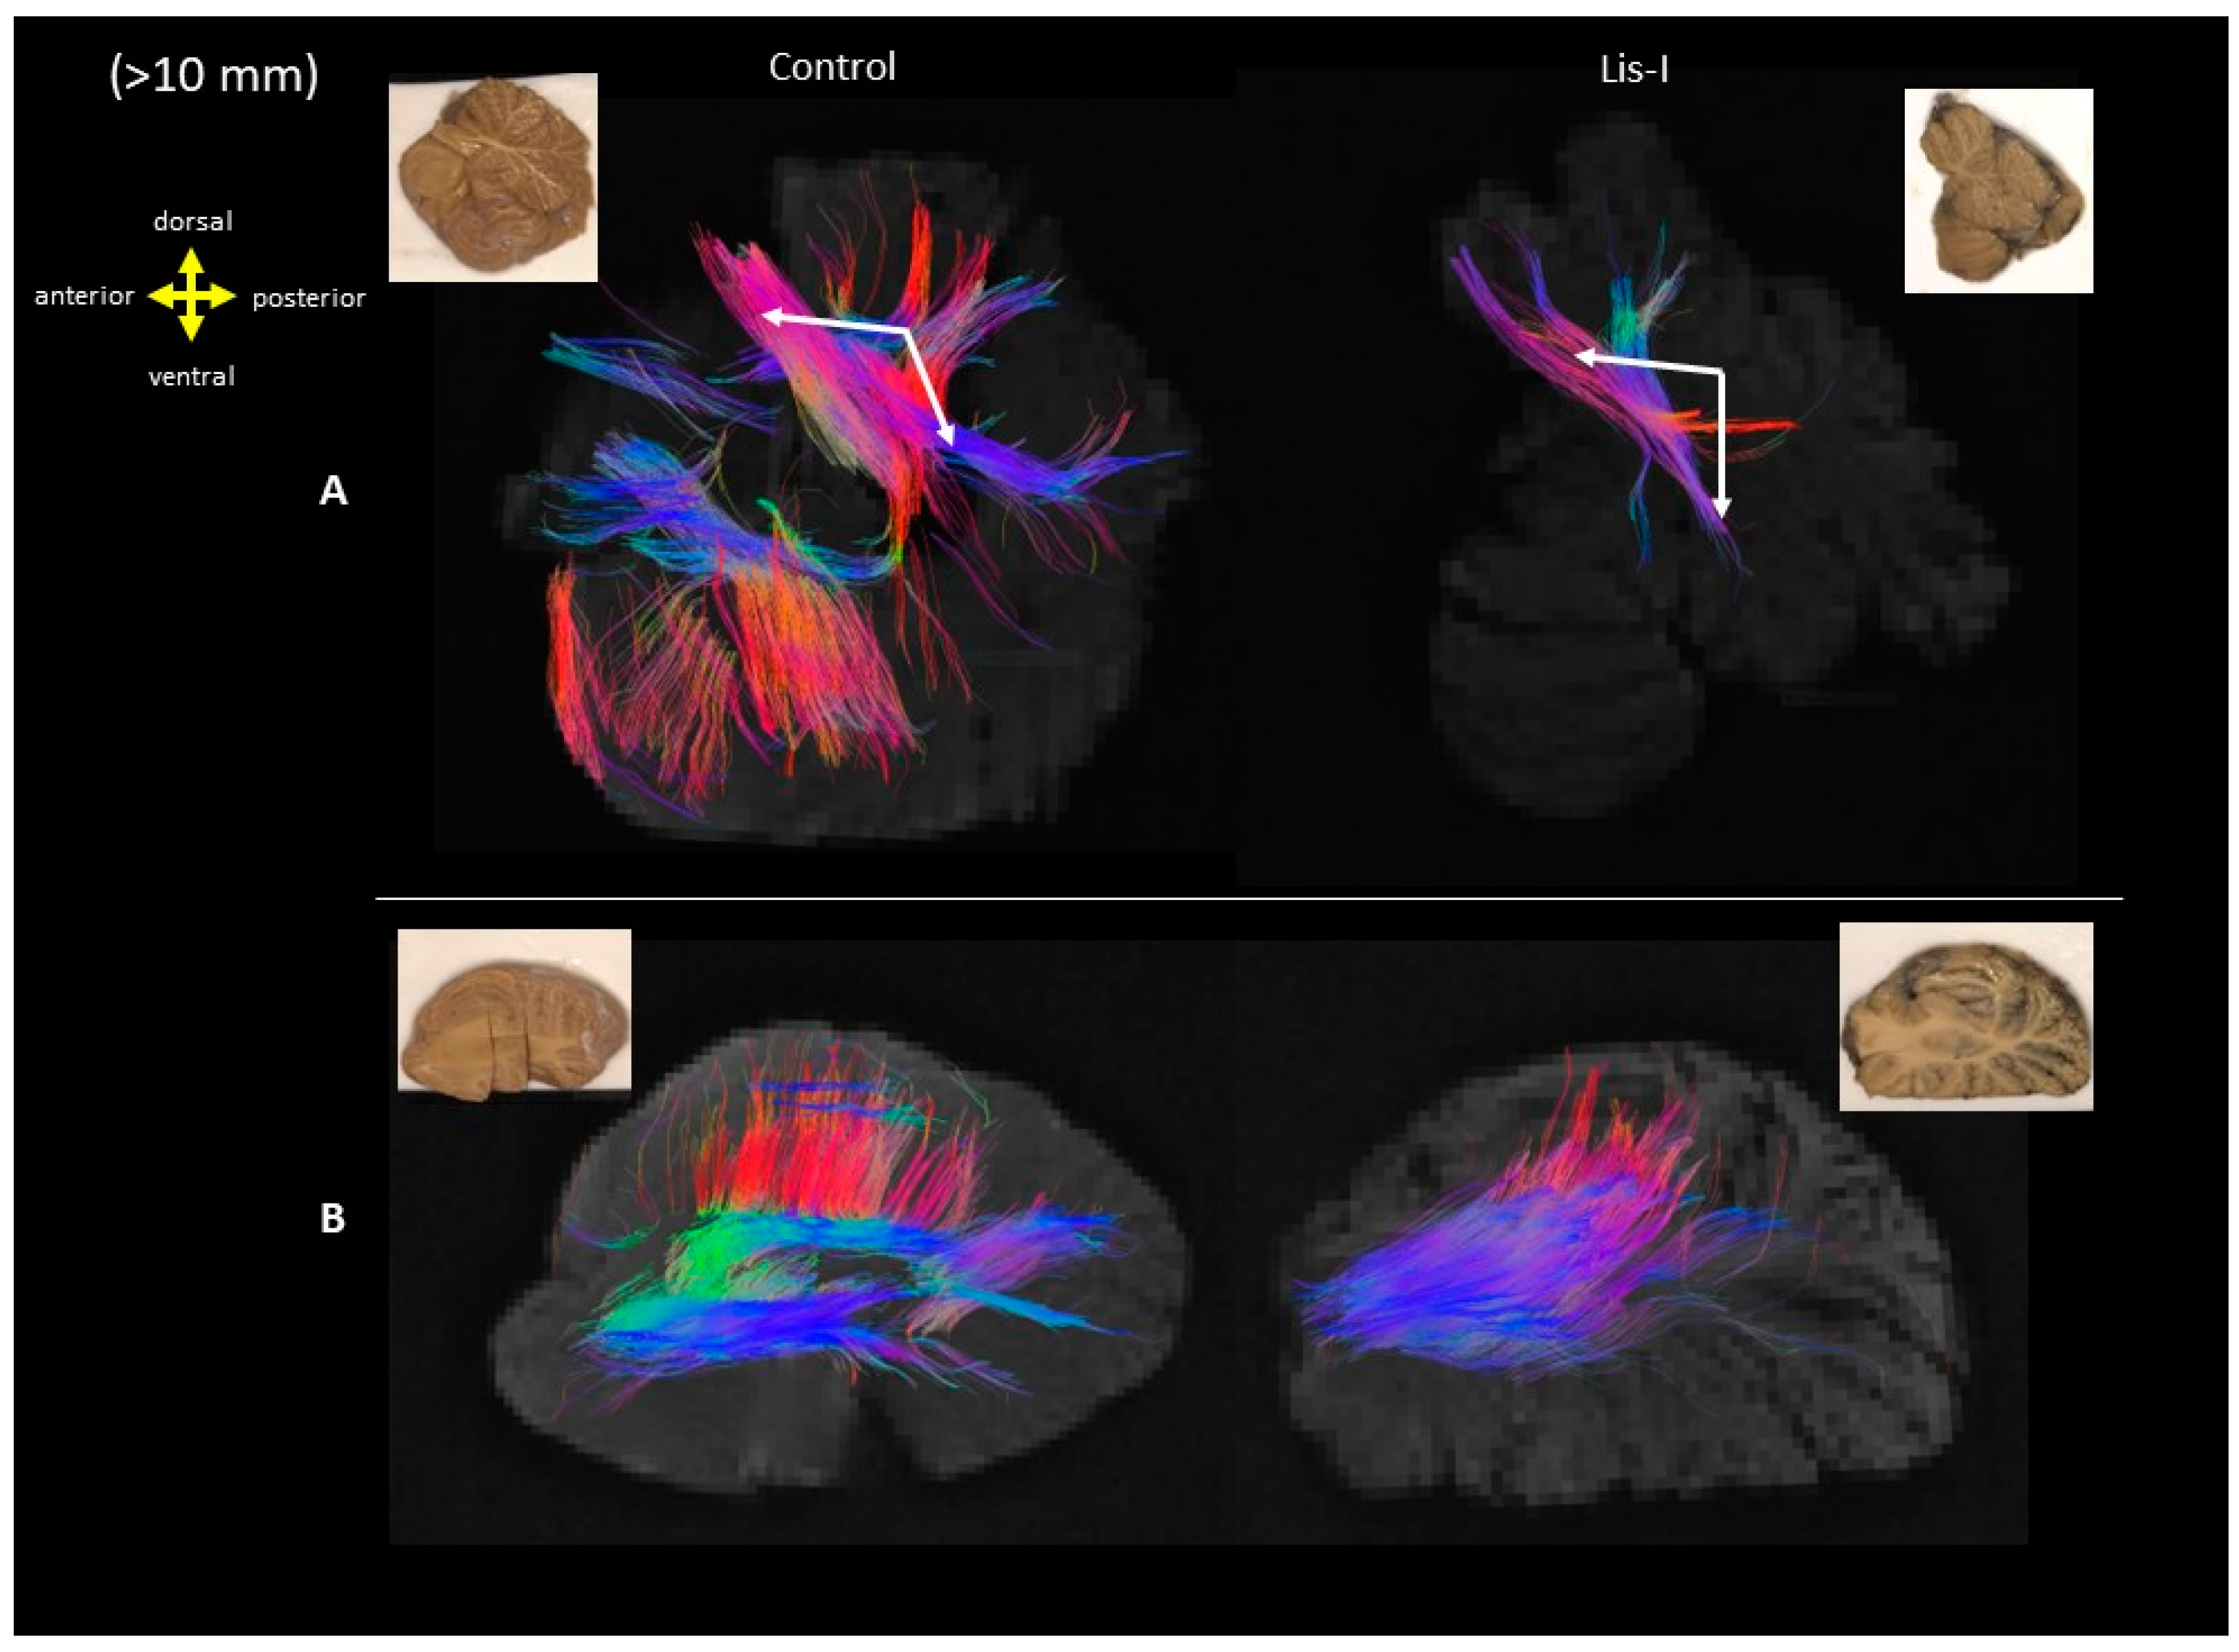
3. Results
4. Discussion
4.1. Developmental Aspect of the LIS Brains
4.2. Microanatomy of Lissencephaly
4.3. Limitations and Future Directions

| LIS1 | ARX | DCX | TUBA1A | RELN | VLDLR | Our Case 1 #683 | Our Case 2 #4524 | Our Case 3 #641 | |
|---|---|---|---|---|---|---|---|---|---|
| Chromosome location | 17p13.3 | Xp22.13 | Xq22.3-q23 | 12q13.12 | 7q22.1 | 9p24.2 | 17p13.3 | 17p13 (submicroscopic deletion) | 17p13.3 |
| Head size/circumference | Relative/acquired microcephaly | Microcephaly | Relative/acquired microcephaly | Microcephaly | Normal or acquired mild microcephaly | Normal | Microcephaly with tririgonocephaly | Dysmorphism | Microcephaly |
| Early-onset seizures | At few months of age | Present | At few months of age | Present | At few months of life | Present (uncommon) | No seizures recognized | N/A | Present |
| Ophthalmologic findings reported | N/A | Duane anomaly (rare) | Nystagmus | Strabismus, nystagmus | Myopia, strabismus, nystagmus | Strabismus, nystagmus, cataracts (rare) | Bilateral micropthalmia with microcornea and complete colobomas bilateratelly. (Considered blind) | N/A | Bilateral disk hypoplasia (pupils were bilaterally unreactive) |
| Brain MRI features: | |||||||||
| Optic nerves | N/A | Hypoplasia (rare) | N/A | Hypoplasia (rare) | Normal or atrophy | N/A | Present | Present | Hypoplasia |
| Cerebellum | Normal or mild vermis hypoplasia | Normal or hypoplastic/dysplastic | Normal or cerebellar vermis hypoplasia (could be worse than that seen in LIS1) | Normal or mild to severe cerebellar vermis > hemispheres hypoplasia | Normal to profound cerebellar hypoplasia, especially inferior vermis and hemispheres, afoliation | Inferior cerebellar hemispheres and vermis hypoplasia, afoliation | The cerebellar vermis slightly small and is incorporated in the cyst involving the hilum of the left cerebellar hemisphere. The dentate nucleus is indistinct. | Severe cerebellar atrophy/hypoplasia | Atrophy of the cerebellar vermis and small peduncles. But no atrophy at cerebellar hemispheres |
| Brainstem | Normal or hypoplastic | Mild hypoplasia | Normal or uncommonly hypoplastic | Mild to severe hypoplasia | Hypoplasia | Hypoplasia particularly the pons | No significant anomalies | Heterotopic remnants of inferior olive in the mid medulla | Normal |
| Cerebral cortex gyration | Moderate agyria in occipital lobes transitioning to pachygyria anteriorly | Posterior agyria and anterior pachygyria | Agyria more prominent in anterior regions and pachygyria posteriorly | Agyria/pachygyria, perisylvian polymicrogyria or pachygyria | Moderate pachygyria | Normal to mild simplification, predominantly frontal pachygyria | Severe agyria. Only inferior frontal sulci and major fissures seen. | Pachgyria from frontal lobe to Slyvian fissure, agyria in the dorsal brain. | Severe degree of pachgyria. Failure of formation of the usual gryal and sulcal definition (agyria) leaving only a vague suggestion of thr Slyvian sulcus and central sulcus as well as the parieto-occipital sulcus. |
| Gradient of gyration abnormality | p > a | p > a | p < a | p > a | p < a | None or variable (p < a more common) | N/A | p > a | N/A |
| Cerebral cortical thickness | Abnormally thick cortex | Moderately thick cortex | Thick cortex, SBH in female carriers | Thick cortex or SBH/SBH-like | Thick cortex | Normal to mildly thick cortex | Abnormally thick cortex | Thick (in excess of 1.5–2 cm) and has abnormal organization. | Abnormally thick cortex up to 18–20 mm (3–4 times normal thickness) |
| Hippocampus | N/A | N/A | N/A | Small and globular | Flat and lacking definable upper and lower blades | Normal | N/A | Hypoplastic | N/A |
| Basal ganglia/thalami | N/A | Dysplastic | N/A | Very small and dysplastic | N/A | N/A | Abnormally disposed | Normal | Normal |
| Internal capsule | N/A | N/A | N/A | Absent or hypoplastic anterior limbs | N/A | N/A | N/A | N/A | N/A |
| Corpus callosum | Could be hypoplastic | Absent | Normal, mild hypoplasia or absent | Dysmorphic, thin or absent | Hypoplastic | Normal | Formed, thin | Only small remnant | Clearly formed |
| Lateral ventricles | Enlarged | Enlarged | Enlarged | Mildly to severely enlarged | Enlarged | Could be enlarged | Enlarged posteriorly | Enlarged posteriorly | Only the aqueduct was enlarged |
5. Conclusions
Author Contributions
Funding
Institutional Review Board Statement
Informed Consent Statement
Data Availability Statement
Acknowledgments
Conflicts of Interest
References
- Severino, M.; Geraldo, A.F.; Utz, N.; Tortora, D.; Pogledic, I.; Klonowski, W.; Triulzi, F.; Arrigoni, F.; Mankad, K.; Leventer, R.J.; et al. Definitions and classification of malformations of cortical development: Practical guidelines. Brain 2020, 143, 2874–2894. [Google Scholar] [CrossRef]
- Arrigoni, F.; Peruzzo, D.; Mandelstam, S.; Amorosino, G.; Redaelli, D.; Romaniello, R.; Leventer, R.; Borgatti, R.; Seal, M.; Yang, J.Y. Characterizing White Matter Tract Organization in Polymicrogyria and Lissencephaly: A Multifiber Diffusion MRI Modeling and Tractography Study. AJNR Am. J. Neuroradiol. 2020, 41, 1495–1502. [Google Scholar] [CrossRef] [PubMed]
- Pang, T.; Atefy, R.; Sheen, V. Malformations of cortical development. Neurologist 2008, 14, 181–191. [Google Scholar] [CrossRef] [PubMed]
- LoTurco, J.J.; Booker, A.B. Chapter 26—Neuronal Migration Disorders. In Cellular Migration and Formation of Neuronal Connections; John, L.R., Rubenstein, P.R., Eds.; Academic Press: Cambridge, MA, USA, 2013; pp. 481–494. ISBN 9780123972668. [Google Scholar] [CrossRef]
- Mochida, G.H. Genetics and biology of microcephaly and lissencephaly. Semin Pediatr Neurol 2009, 16, 120–126. [Google Scholar] [CrossRef] [PubMed]
- Di Donato, N.; Chiari, S.; Mirzaa, G.M.; Aldinger, K.; Parrini, E.; Olds, C.; Barkovich, A.J.; Guerrini, R.; Dobyns, W.B. Lissencephaly: Expanded imaging and clinical classification. Am. J. Med. Genet. A 2017, 173, 1473–1488. [Google Scholar] [CrossRef] [PubMed]
- Dobyns, W.B. Developmental aspects of lissencephaly and the lissencephaly syndromes. Birth. Defects Orig. Artic. Ser. 1987, 23, 225–241. [Google Scholar] [PubMed]
- Reiner, O.; Carrozzo, R.; Shen, Y.; Wehnert, M.; Faustinella, F.; Dobyns, W.B.; Caskey, C.T.; Ledbetter, D.H. Isolation of a Miller-Dieker lissencephaly gene containing G protein beta-subunit-like repeats. Nature 1993, 364, 717–721. [Google Scholar] [CrossRef]
- Guerrini, R.; Dobyns, W.B. Malformations of cortical development: Clinical features and genetic causes. Lancet Neurol. 2014, 13, 710–726. [Google Scholar] [CrossRef]
- des Portes, V.; Francis, F.; Pinard, J.-M.; Desguerre, I.; Moutard, M.-L.; Snoeck, I.; Meiners, L.C.; Capron, F.; Cusmai, R.; Ricci, S.; et al. Doublecortin Is the Major Gene Causing X-Linked Subcortical Laminar Heterotopia (SCLH). Hum. Mol. Genet. 1998, 7, 1063–1070. [Google Scholar] [CrossRef]
- Gleeson, J.G.; Allen, K.M.; Fox, J.W.; Lamperti, E.D.; Berkovic, S.; Scheffer, I.; Cooper, E.C.; Dobyns, W.B.; Minnerath, S.R.; Ross, M.E.; et al. Doublecortin, a brain-specific gene mutated in human X-linked lissencephaly and double cortex syndrome, encodes a putative signaling protein. Cell 1998, 92, 63–72. [Google Scholar] [CrossRef]
- Rivière, J.B.; van Bon, B.W.; Hoischen, A.; Kholmanskikh, S.S.; O’Roak, B.J.; Gilissen, C.; Gijsen, S.; Sullivan, C.T.; Christian, S.L.; Abdul-Rahman, O.A.; et al. De novo mutations in the actin genes ACTB and ACTG1 cause Baraitser-Winter syndrome. Nat. Genet. 2012, 44, 440–444. [Google Scholar] [CrossRef] [PubMed]
- Rakic, P. Mode of cell migration to the superficial layers of fetal monkey neocortex. J. Comp. Neurol. 1972, 145, 61–83. [Google Scholar] [CrossRef] [PubMed]
- Fernández, V.; Llinares-Benadero, C.; Borrell, V. Cerebral cortex expansion and folding: What have we learned? Embo J. 2016, 35, 1021–1044. [Google Scholar] [CrossRef] [PubMed]
- Herculano-Houzel, S.; Mota, B.; Wong, P.; Kaas, J.H. Connectivity-driven white matter scaling and folding in primate cerebral cortex. Proc. Natl. Acad. Sci. USA 2010, 107, 19008–19013. [Google Scholar] [CrossRef] [PubMed]
- McDaniel, M.A. Big-brained people are smarter: A meta-analysis of the relationship between in vivo brain volume and intelligence. Intelligence 2005, 33, 337–346. [Google Scholar] [CrossRef]
- Zilles, K.; Armstrong, E.; Schleicher, A.; Kretschmann, H.J. The human pattern of gyrification in the cerebral cortex. Anat. Embryol. 1988, 179, 173–179. [Google Scholar] [CrossRef]
- Armstrong, E.; Curtis, M.; Buxhoeveden, D.P.; Fregoe, C.; Zilles, K.; Casanova, M.F.; McCarthy, W.F. Cortical gyrification in the rhesus monkey: A test of the mechanical folding hypothesis. Cereb Cortex 1991, 1, 426–432. [Google Scholar] [CrossRef]
- Roebroeck, A.; Miller, K.L.; Aggarwal, M. Ex vivo diffusion MRI of the human brain: Technical challenges and recent advances. NMR Biomed. 2019, 32, e3941. [Google Scholar] [CrossRef]
- McNab, J.A.; Jbabdi, S.; Deoni, S.C.; Douaud, G.; Behrens, T.E.; Miller, K.L. High resolution diffusion-weighted imaging in fixed human brain using diffusion-weighted steady state free precession. Neuroimage 2009, 46, 775–785. [Google Scholar] [CrossRef]
- McNab, J.A.; Miller, K.L. Steady-state diffusion-weighted imaging: Theory, acquisition and analysis. NMR Biomed. 2010, 23, 781–793. [Google Scholar] [CrossRef]
- Takahashi, E.; Folkerth, R.D.; Galaburda, A.M.; Grant, P.E. Emerging cerebral connectivity in the human fetal brain: An MR tractography study. Cereb Cortex 2012, 22, 455–464. [Google Scholar] [CrossRef] [PubMed]
- Shiohama, T.; Stewart, N.; Nangaku, M.; van der Kouwe, A.J.W.; Takahashi, E. Identification of association fibers using ex vivo diffusion tractography in Alexander disease brains. J. Neuroimaging 2022, 32, 866–874. [Google Scholar] [CrossRef]
- Stalling, D.; Westerhoff, M.; Hege, H.-C. Amira: A Highly Interactive System for Visual Data Analysis. In The Visualization Handbook; Elsevier: San Diego, CA, USA, 2005. [Google Scholar]
- Coronal Brain Slices. Available online: https://www.neuroanatomy.ca/coronals.html (accessed on 21 November 2023).
- Coronal Sections of the Brain. Available online: https://www.neuroanatomy.sites.tau.ac.il/copy-of-blood-vessels-of-the-brain (accessed on 21 November 2023).
- Chiba, E.; Kimura, Y.; Shimizu-Motohashi, Y.; Miyagawa, N.; Ota, M.; Shigemoto, Y.; Ohnishi, M.; Nakaya, M.; Nakagawa, E.; Sasaki, M.; et al. Clinical and neuroimaging findings in patients with lissencephaly/subcortical band heterotopia spectrum: A magnetic resonance conventional and diffusion tensor study. Neuroradiology 2022, 64, 825–836. [Google Scholar] [CrossRef] [PubMed]
- Wynshaw-Boris, A.; Pramparo, T.; Youn, Y.H.; Hirotsune, S. Lissencephaly: Mechanistic insights from animal models and potential therapeutic strategies. Semin. Cell Dev. Biol. 2010, 21, 823–830. [Google Scholar] [CrossRef] [PubMed]
- Moffat, J.J.; Ka, M.; Jung, E.-M.; Kim, W.-Y. Genes and brain malformations associated with abnormal neuron positioning. Mol. Brain 2015, 8, 72. [Google Scholar] [CrossRef] [PubMed]
- Dobyns, W.B.; Stratton, R.F.; Greenberg, F. Syndromes with lissencephaly. I: Miller-Dieker and Norman-Roberts syndromes and isolated lissencephaly. Am. J. Med. Genet. 1984, 18, 509–526. [Google Scholar] [CrossRef] [PubMed]
- Dobyns, W.B.; Elias, E.R.; Newlin, A.C.; Pagon, R.A.; Ledbetter, D.H. Causal heterogeneity in isolated lissencephaly. Neurology 1992, 42, 1375–1388. [Google Scholar] [CrossRef] [PubMed]
- Olson, E.C.; Walsh, C.A. Smooth, rough and upside-down neocortical development. Curr. Opin. Genet. Dev. 2002, 12, 320–327. [Google Scholar] [CrossRef]
- Barkovich, A.J.; Kuzniecky, R.I.; Dobyns, W.B.; Jackson, G.D.; Becker, L.E.; Evrard, P. A classification scheme for malformations of cortical development. Neuropediatrics 1996, 27, 59–63. [Google Scholar] [CrossRef]
- Kao, Y.-C.; Peng, S.S.-F.; Weng, W.-C.; Lin, M.-I.; Lee, W.-T. Evaluation of White Matter Changes in Agyria–Pachygyria Complex Using Diffusion Tensor Imaging. J. Child Neurol. 2011, 26, 433–439. [Google Scholar] [CrossRef]
- ten Donkelaar, H.J.; Lammens, M.; Wesseling, P.; Hori, A.; Keyser, A.; Rotteveel, J. Development and malformations of the human pyramidal tract. J. Neurol. 2004, 251, 1429–1442. [Google Scholar] [CrossRef] [PubMed]
- Roessmann, U.; Hori, A. Agyria (lissencephaly) with anomalous pyramidal crossing. Case report and review of literature. J. Neurol. Sci. 1985, 69, 357–364. [Google Scholar] [CrossRef]
- Forman, M.S.; Squier, W.; Dobyns, W.B.; Golden, J.A. Genotypically defined lissencephalies show distinct pathologies. J. Neuropathol. Exp. Neurol. 2005, 64, 847–857. [Google Scholar] [CrossRef] [PubMed]
- Fallet-Bianco, C.; Loeuillet, L.; Poirier, K.; Loget, P.; Chapon, F.; Pasquier, L.; Saillour, Y.; Beldjord, C.; Chelly, J.; Francis, F. Neuropathological phenotype of a distinct form of lissencephaly associated with mutations in TUBA1A. Brain 2008, 131, 2304–2320. [Google Scholar] [CrossRef] [PubMed]
- Rollins, N.K.; Booth, T.N.; Chahrour, M.H. Variability of Ponto-cerebellar Fibers by Diffusion Tensor Imaging in Diverse Brain Malformations. J. Child Neurol. 2017, 32, 271–285. [Google Scholar] [CrossRef] [PubMed]
- Vasung, L.; Rezayev, A.; Yun, H.J.; Song, J.W.; van der Kouwe, A.; Stewart, N.; Palani, A.; Shiohama, T.; Chouinard-Decorte, F.; Levman, J.; et al. Structural and Diffusion MRI Analyses With Histological Observations in Patients With Lissencephaly. Front. Cell Dev. Biol. 2019, 7, 124. [Google Scholar] [CrossRef]
- Ross, M.E.; Swanson, K.; Dobyns, W.B. Lissencephaly with cerebellar hypoplasia (LCH): A heterogeneous group of cortical malformations. Neuropediatrics 2001, 32, 256–263. [Google Scholar] [CrossRef]
- Abumansour, I.S.; Wrogemann, J.; Chudley, A.E.; Chodirker, B.N.; Salman, M.S. Lissencephaly with Brainstem and Cerebellar Hypoplasia and Congenital Cataracts. J. Child Neurol. 2014, 29, 860–864. [Google Scholar] [CrossRef]
- De Zeeuw, C.I.; Simpson, J.I.; Hoogenraad, C.C.; Galjart, N.; Koekkoek, S.K.; Ruigrok, T.J. Microcircuitry and function of the inferior olive. Trends Neurosci. 1998, 21, 391–400. [Google Scholar] [CrossRef]


| Brain Age (Years) | Disease/Cause of Death | Sex | Race | Postmortem Interval (Hours) | Time in Fixative (Years) * | |
|---|---|---|---|---|---|---|
| Case 1, #683 | 8 | Multiple congenital anomalies | Female | Caucasian | 3 | 24+ |
| Case 2, #4524, | 13 | Lissencephaly | Male | Caucasian | 9 | 16+ |
| Case 3, #641 | 1 | Lissencephaly | Female | Caucasian | 2 | 24+ |
| Case 4, #877 | 8 | Intracerebral hemorrhage | Female | African American | 36 | 22+ |
| Case 5, #4341 | 13 | Suicide | Male | Caucasian | 16 | 11+ |
| Case 6, #4638 | 15 | Chest Injury/Motor Vehicle Accident | Female | Caucasian | 5 | 15+ |
| Case 7, #4455 | 1 | Drowning | Female | Caucasian | 39 | 3+ |
Disclaimer/Publisher’s Note: The statements, opinions and data contained in all publications are solely those of the individual author(s) and contributor(s) and not of MDPI and/or the editor(s). MDPI and/or the editor(s) disclaim responsibility for any injury to people or property resulting from any ideas, methods, instructions or products referred to in the content. |
© 2023 by the authors. Licensee MDPI, Basel, Switzerland. This article is an open access article distributed under the terms and conditions of the Creative Commons Attribution (CC BY) license (https://creativecommons.org/licenses/by/4.0/).
Share and Cite
Ortug, A.; Valli, B.; Alatorre Warren, J.L.; Shiohama, T.; van der Kouwe, A.; Takahashi, E. Brain Pathways in LIS1-Associated Lissencephaly Revealed by Diffusion MRI Tractography. Brain Sci. 2023, 13, 1655. https://doi.org/10.3390/brainsci13121655
Ortug A, Valli B, Alatorre Warren JL, Shiohama T, van der Kouwe A, Takahashi E. Brain Pathways in LIS1-Associated Lissencephaly Revealed by Diffusion MRI Tractography. Brain Sciences. 2023; 13(12):1655. https://doi.org/10.3390/brainsci13121655
Chicago/Turabian StyleOrtug, Alpen, Briana Valli, José Luis Alatorre Warren, Tadashi Shiohama, Andre van der Kouwe, and Emi Takahashi. 2023. "Brain Pathways in LIS1-Associated Lissencephaly Revealed by Diffusion MRI Tractography" Brain Sciences 13, no. 12: 1655. https://doi.org/10.3390/brainsci13121655