Abstract
Parkinson’s disease (PD) is a complex degenerative brain disease that affects nerve cells in the brain responsible for body movement. Machine learning is widely used to track the progression of PD in its early stages by predicting unified Parkinson’s disease rating scale (UPDRS) scores. In this paper, we aim to develop a new method for PD diagnosis with the aid of supervised and unsupervised learning techniques. Our method is developed using the Laplacian score, Gaussian process regression (GPR) and self-organizing maps (SOM). SOM is used to segment the data to handle large PD datasets. The models are then constructed using GPR for the prediction of the UPDRS scores. To select the important features in the PD dataset, we use the Laplacian score in the method. We evaluate the developed approach on a PD dataset including a set of speech signals. The method was evaluated through root-mean-square error (RMSE) and adjusted R-squared (adjusted R²). Our findings reveal that the proposed method is efficient in the prediction of UPDRS scores through a set of speech signals (dysphonia measures). The method evaluation showed that SOM combined with the Laplacian score and Gaussian process regression with the exponential kernel provides the best results for R-squared (Motor-UPDRS = 0.9489; Total-UPDRS = 0.9516) and RMSE (Motor-UPDRS = 0.5144; Total-UPDRS = 0.5105) in predicting UPDRS compared with the other kernels in Gaussian process regression.
1. Introduction
Parkinson’s disease (PD) is a complex degenerative brain disease with increasing motor symptoms that can significantly impair patients’ quality of life [1,2]. Aging has been linked to a number of negative health consequences, including those affecting the nervous system [3]. The number of people affected by these conditions is expected to increase as the global population ages. The most significant risk factor for developing PD appears to be age. The disease is typically diagnosed in people over the age of 60 [4,5,6], but it can affect younger people as well; 20% of patients are diagnosed with PD before the age of 50. PD affects 6.3 million people worldwide [7], and the disease’s impact on quality of life and life expectancy, as well as social and monetary costs, are expected to grow as the population ages. According to the statistic, there will be 8.7 million PD patients by 2030 [8]. Furthermore, the statistic shows that the number of PD patients in the US is predicted to increase to around 1.8 million by 2030 [9]. There is no one specific test that can diagnose PD. Instead, a neurologist will examine a patient’s symptoms and medical history and perform a neurological examination in order to make a diagnosis.
Because of the high heterogeneity of PD, each individual may experience a variety of symptoms. Since the initial symptoms are mild, they can go undetected for long periods. Furthermore, at the diagnostic level, 60% of PD patients have a clear asymmetry of symptoms. There are numerous reported PD symptoms, both motor and nonmotor [10,11]. Constipation, sleep disorders, rapid eye movement (REM) sleep behavior disorders, bladder disorders (urinary incontinence) and anxiety are some examples of nonmotor symptoms. Note that non-motor symptoms can sometimes precede motor symptoms, and are thought to represent the disease’s early stage. The secondary symptoms can be freezing of gait, gait dysfunction, hallucination, smell dysfunction, thinking difficulties, dementia, sexual dysfunction and depression. Although there is no cure for PD, there are treatments available to help manage its symptoms. The goal of treatment is to either replace the dopamine that is missing in the brain or to correct the problems that are caused by the lack of dopamine. Patients may be unaware of this disorder’s most common symptom, which is reduced vocal loudness. In addition, people with Parkinson’s disease commonly suffer from dysphonia [12], which is vocal impairment and characterized by a breathy voice and harshness. As the disease progresses, patients may experience greater difficulty speaking.
The UPDRS, or unified Parkinson’s disease rating scale, which measures the severity and presence of symptoms of PD, is the most popular tool used by clinicians to measure PD symptom severity (but does not measure their underlying causes) [3,13,14]. The UPDRS scale consists of three sections that assess motor symptoms, activities of daily life and mentation, behavior and mood. Monitoring the progression of PD is essential for better patient-directed care [3,13,15,16]. A convincing method for accurately and effectively tracking the progression of PD at more frequent intervals with less expense and resource waste is remote monitoring. A growing option in general medical care is noninvasive telemonitoring, which may allow for reliable, affordable PD screening while potentially reducing the need for frequent clinic visits. As a result, the clinical evaluation of the subject’s condition is evaluated more accurately and the burden on national healthcare systems is reduced.
Machine learning has demonstrated to be effective in disease diagnosis [15,16,17,18,19,20,21,22,23,24,25,26,27]. There have been many methods for PD diagnosis; some of them are presented in Table 1. The findings for the methods presented in this table show that there is no research on the use of clustering, feature selection and prediction machine learning for the prediction of UPDRS. As seen from this table, the previous research was mainly developed using prediction learning techniques. The use of clustering techniques can be effective in developing a robust learning method for UPDRS prediction. Clustering is effective because it allows the PD diagnosis methods to identify groups of similar objects or data points in the PD dataset. By grouping similar data points, the underlying patterns and structures within the data can be better understood to make more informed decisions. Accordingly, this study aims to develop a new method using clustering, feature selection and prediction machine learning to predict UPDRS scores (Total-UPDRS and Motor-UPDRS) and simulate the relationship between the characteristics of speech signals (dysphonia measures) and UPDRS scores. In this research, Motor-UPDRS is the motor section of the UPDRS. In addition, Total-UPDRS is the full range of UPDRS as described in [13]. Our method is developed using the Laplacian score, Gaussian process regression (GPR), and self-organizing maps (SOM) techniques. The SOM technique is used to segment the data to handle large PD datasets. The models are then constructed using the GPR technique for UPDRS prediction. To select the important features in the PD dataset, we use the Laplacian score in the method. We perform several experiments on a PD dataset in the UCI machine learning archive, including a set of speech signals (dysphonia measures), to evaluate the developed method.

Table 1.
Related works on PD diagnosis.
2. Method
This study developed a hybrid method using unsupervised, feature selection and supervised learning techniques. The steps of the proposed method are shown in Figure 1. The data were collected from the UCI machine learning archive. In the first step of our methodology, data were clustered using the SOM clustering technique. We then used the Laplacian score for feature selection. To perform UPDRS prediction, GPR was implemented on the generated clusters. The proposed method was evaluated using root-mean-square error (RMSE) and correlation coefficients. In this section, the techniques incorporated in the proposed method are introduced.
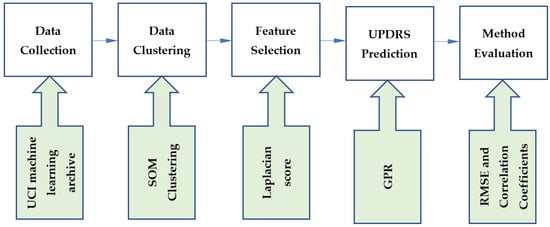
Figure 1.
The steps of the proposed method.
2.1. Gaussian Process Regression
The Gaussian process regression is a stochastic process that can be interpreted as probability distributions over functions with a number of random variables [80,81]. A joint Gaussian distribution exists for any finite range of these random variables. The Gaussian process regression is a machine learning approach that can be employed to deal with complex problems (e.g., nonlinear problems) [82]. It is developed on the basis of statistical theory and Bayesian theory [83]. This technique is widely used for regression problems [83,84].
A training dataset is required to establish a relationship between the input and output variables of the dataset. Assume that there is a dataset with -dimensional input vector and with as the corresponding output. Then, we have:
Thus, the output vector and matrix are organized, respectively, for values and vector. Gaussian process regression employs a Gaussian prior which is parameterized through a covariance function and the mean function to model a time series.
where is typically taken to be zero without affecting generality, and is known as the latent variable in the Gaussian process regression model.
The similarity between input data points, which is a crucial component of the Gaussian process regression model, is described by the covariance function . Different kernel functions are used in Gaussian process regression. A common kernel function used in Gaussian process regression is squared exponential (SE), which is represented as:
where and indicate two hyperparameters that govern the accuracy of the output prediction. They need to be optimized in Gaussian process regression.
During the training phase of Gaussian process regression, the log-likelihood function in the following equation is maximized for the estimation of the kernel matrix’s parameters :
where in the above equation, indicates the variance of the noise. In this function, indicates the number of test data points.
Because the log-likelihood function is convex, the gradient descent algorithm can solve Equation (4).
After training the model, at test points , the posterior distribution of will be obtained as:
In the above formula, cov indicates the prediction variance and denotes the prediction mean.
2.2. SOM
As an unsupervised learning algorithm, SOM [85] is used to cluster and visualize high-dimensional datasets simultaneously [86,87,88,89,90,91]. The self-organization process used by the learning algorithm was biologically inspired by the cortex brain cells. In contrast to the error-correction learning used in feedforward neural networks, this type of learning is referred to as competitive learning. A map is a grid-organized neural network made up of interconnected nodes, also known as cells, neurons or units. For visual purposes, the grid topology is typically two-dimensional [92,93], but it can have any topology. A prototype vector from the high-dimensional input space where the data live is assigned to each cell. The prototypes are updated to fit the training set during an iterative learning process; when a prototype is updated, the prototypes associated with neighboring cells are also updated using a specific weight. As the distance between grid cells increases, the weights decrease and the cells on the map near each other are linked to prototype vectors in the input space near each other. This allows the map to preserve the topology of the space. The resulting map, after convergence, allows for efficient visualization of the high-dimensional input space on a low-dimensional map. Because of its ease of use and interpretable results, SOM is a popular clustering and visualization tool. The SOM procedure for clustering is presented in Algorithm 1. In this algorithm, input patterns are considered for the data clustering in SOM. Number of iterations , learning rate and neighborhood function must be initialized in SOM to perform the data clustering. Note that each neuron represents an arbitrary number of input patterns. The output of SOM is a trained map and clustered input patterns. In Algorithm 1, the learning rate and radius of the neighborhood must both decrease at a constant rate for the algorithm to converge.
| Algorithm 1: SOM Procedure |
| Inputs:, number of iterations , learning rate , neighborhood function Output: Trained map and clustered input patterns |
| Randomly initialize neurons, For Do
|
2.3. Laplacian Score for Feature Selection
The Laplacian score is based on Laplacian eigenmaps [94] and is considered a graph-based feature selection method. The Laplacian score models the data’s local geometrical structure [95,96] with a k-nearest neighbor (k-NN) graph. Consider a dataset ; to approximate the dataset’s manifold structure, a k-NN graph is constructed, which contains an edge with weight between and if is one of ’s k-nearest neighbors, or conversely. There are several similarity-based methods for determining edge weights. The Euclidean distance is one of the popular similarity metrics to measure the distance between two vectors [97,98]. Thus, for and and with as a suitable constant, we can define the weight matrix as follows:
Two data points can only be considered close to one another on a feature if and only if there is an edge connecting them. To select a good feature, the following objective function needs to be minimized:
where indicates the ith sample of the rth feature in the dataset and , denotes the estimated variance of . In order to maximize representative power, larger variance features are preferred.
Accordingly, we can obtain the variance of weight using the following equation.
where is a diagonal matrix, and the corresponding degree matrix of and is a nonzero constant vector.
Accordingly, the mean of each feature by Equation (8) is removed. This is carried out to avoid assigning a zero Laplacian score to a nonzero constant vector, such as 1, because such a feature obviously contains no information. For a good feature, we have:
where a bigger indicates a smaller , is the Laplacian matrix and .
Accordingly, the rth feature’s Laplacian score is reduced to
3. Data Analysis and Method Evaluation
In this research, we used Parkinson’s telemonitoring dataset [13] to evaluate the proposed method. Table 2 presents the features of this dataset. The dataset was published online in 2009 at the UCI machine learning archive. This dataset consists of around 200 recordings per patient from 42 people (28 men and 14 women) with early-stage PD, which makes a total of 5875 voice recordings. Each patient’s phonations of the sustained vowel /a/ are recorded. Parkinson’s telemonitoring dataset includes two outputs Motor-UPDRS and Total-UPDRS and sixteen biomedical voice measures (F1–F16). They are presented in Table 2. A full description of these features is presented in [13].
Table 2.
The Total- and Motor-UPDRS, and 16 biomedical voice measures in Parkinson’s telemonitoring dataset.
The dataset was clustered by SOM for different topology maps. The SOM clustering quality was assessed by the Silhouette index. To measure the separation between the resulting clusters, this index can be used. The silhouette index of the object is defined as:
where denotes the distance of to its own cluster, which is characterized as the average distance between the object and all the other objects in its own cluster as:
where denotes the number of data points in the cluster denote the squared Euclidean distance, indicates the indicator function ( is in ; is not in .
The minimum average distance between the object and every other object in a cluster, excluding the cluster to which the object belongs, is defined by . is calculated by:
Accordingly, SI . When SI is close to 1, the element is assigned to the correct cluster. When this value is close to −1, the object is in the incorrect cluster because the neighboring cluster is a better option than the selected cluster. The validity of the entire clustering can then be evaluated using the silhouette index, which is defined as:
Accordingly, we present the results for the silhouette index in Figure 2. As seen from this figure, nine clusters in SOM provide the best silhouette index, as the highest value for is obtained for nine clusters. Hence, we clustered the PD data in nine clusters, as presented in Figure 3. The clusters in this figure are visualized using different PCs (principal components), which are PC 1, PC 9 and PC 16. In addition, in this figure, Total-UPDRS and Motor-UPDRS are visualized using PC 2 in nine clusters of SOM. We also provide the cluster centroids in Table 3. In this table, nine clusters are presented along with the centroid for each feature of the PD dataset.
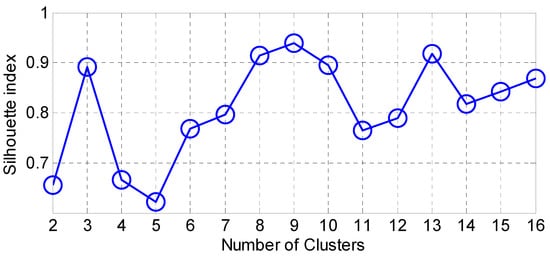
Figure 2.
The results for silhouette index.
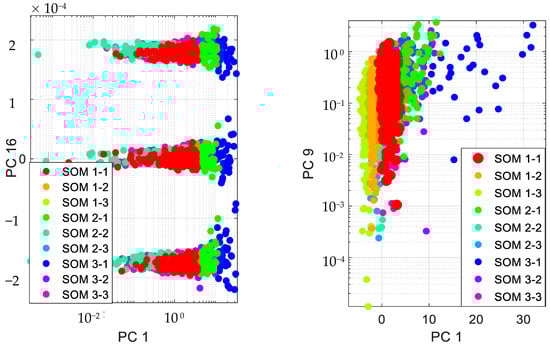
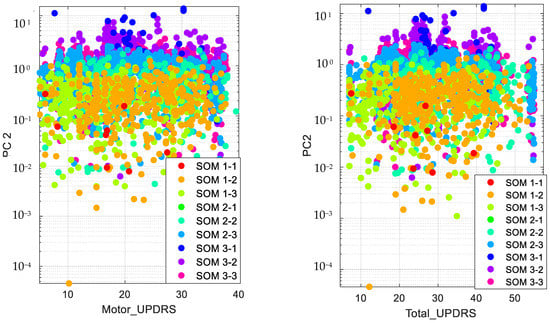
Figure 3.
Visualizing SOM clusters.
Table 3.
Cluster centroids.
To perform UPDRS prediction in each cluster of SOM, we first used the Laplacian score technique for feature selection. The results of the feature selection are presented in Figure 4 and Table A1 in Appendix A. For these results, the features are ranked for unsupervised learning using Laplacian scores. According to the results, a large score value indicates that the corresponding PD feature is important.
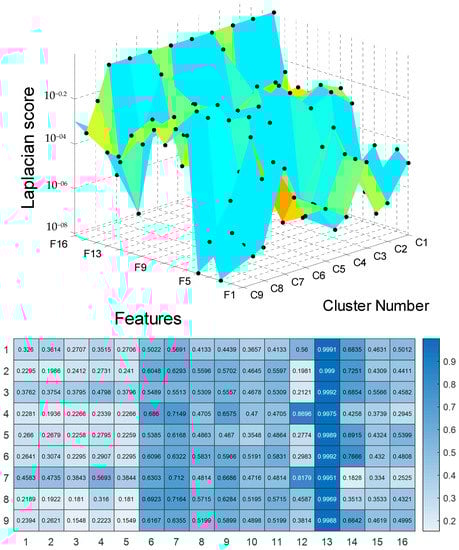
Figure 4.
The results for Laplacian score.
The selected features of nine clusters of Parkinson’s telemonitoring dataset were used in Gaussian process regression for UPDRS score (Total-UPDRS and Motor-UPDRS) predictions. In this study, the 10 most important features were selected for UPDRS prediction in each cluster. As a result, there were nine clusters, each of which included ten important features for UPDRS prediction.
The method was run on Microsoft Windows 10 Pro and a laptop with Processor Intel(R) Core(TM) i7-6700HQ CPU @ 2.60GHz, 2592 Mhz, four core(s) and eight logical processor(s). A 5-fold cross-validation approach in the hyperparameter optimization to avoid overfitting was used in training the models in Gaussian process regression. For example, to combine RMSE and five-fold cross-validation, we applied the following steps:
- Dividing the data into five equal parts;
- Training the model on four parts of the data and testing it on the fifth part, calculating the RMSE for that fold;
- Repeating step 2 for all five folds;
- Calculating the average RMSE across all five folds. This provided an estimate of the model’s overall performance.
The nine models were assessed using RMSE and correlation coefficients. The highest value of adjusted R-squared (adjusted R² or the coefficient of determination) means perfection. Lower values of RMSE reflect better performance by the predictor. The RMSE is presented in Equation (15).
This metric is defined for a testing vector of length N, actual and forecasted . In this study, four kernels were used in Gaussian process regression: rational quadratic kernel, squared-exponential kernel, exponential kernel and Matérn 5/2 kernel. In Table 4 and Table 5, we present the average results of R-squared and RMSE for Total-UPDRS and Motor-UPDRS, respectively, in Parkinson’s disease. The results are provided for maximum, minimum and mean values of R-squared and RMSE. The results presented in Table 4 and Table 5 clearly show that SOM + Laplacian score + Gaussian process regression (exponential kernel) provide the best results for R-squared and RMSE in predicting Total-UPDRS and Motor-UPDRS compared with the SOM + Laplacian score + Gaussian process regression (squared-exponential kernel), SOM + Laplacian score + Gaussian process regression (rational quadratic kernel) and SOM + Laplacian score + Gaussian process regression (Matérn 5/2 kernel). Furthermore, the findings reveal that SOM + Laplacian score + Gaussian process regression (Matérn 5/2 kernel) provided the largest prediction errors for Total-UPDRS and Motor-UPDRS.
Table 4.
Adjusted R2 and RMSE results for Motor-UPDRS 0.9489 and 0.5144; 0.9516, 0.5105.
Table 5.
Adjusted R2 and RMSE results for Total-UPDRS.
4. Discussion
Machine learning has significant implications for PD. Researchers and healthcare providers can gain deeper insights into the disease by leveraging machine learning algorithms, allowing for earlier diagnosis, personalized treatment plans and improved symptom management. Early detection of PD is critical because early intervention can help slow disease progression and improve patient outcomes. By analyzing patient data and identifying specific patterns associated with the disease, machine learning can aid in the early detection of PD. Machine learning can also be used to create personalized treatment plans for patients with PD, taking into account individual patient data such as medical history, genetic information and response to previous treatments. This can assist healthcare providers in tailoring treatments to each patient’s specific needs, improving treatment outcomes and quality of life. Furthermore, machine learning can help manage PD’s symptoms, particularly through remote monitoring. Wearable devices with machine learning algorithms can monitor changes in motor symptoms and alert healthcare providers if necessary, enabling more proactive and responsive care. Overall, the implications of machine learning for PD are promising, opening up new avenues for disease diagnosis, treatment and management that can improve patient outcomes and quality of life.
5. Conclusions
The use of voice measurements has been an effective way for remote tracking of UPDRS. It eases the clinical monitoring of patients and increases the chances of early diagnosis of PD. Machine learning has been widely used in the analysis of speech signals in the diagnosis of PD. Accordingly, there have been many attempts in improving the accuracy of machine learning methods in this context. This study relied on feature selection, clustering and prediction learning techniques in improving the accuracy of PD diagnosis systems. We used the Laplacian score technique as a feature selection technique, SOM as a clustering technique based on the neural network approach, and Gaussian process regression as a prediction learning technique in the development of a new method for UPDRS prediction. SOM discovered nine clusters from the PD dataset. In each cluster of SOM, the most important features were selected by the Laplacian score technique for UPDRS precision by Gaussian process regression. Gaussian process regression was applied using different kernels, namely the rational quadratic kernel, squared-exponential kernel, exponential kernel, and Matérn 5/2 kernel. The method was evaluated through RMSE and adjusted R-squared. The results revealed that SOM + Laplacian score + Gaussian process regression (exponential kernel) provide the best results for R-squared and RMSE in predicting Total-UPDRS and Motor-UPDRS compared with the SOM + Laplacian score + Gaussian process regression (squared-exponential kernel), SOM + Laplacian score + Gaussian process regression (rational quadratic kernel) and SOM + Laplacian score + Gaussian process regression (Matérn 5/2 kernel). Although the proposed method has accurately predicted the UPDRS through a set of selected features by Laplacian score, this method can be further improved by optimizable Gaussian process regression. In addition, the use of incremental Gaussian process regression is greatly suggested in the development of the proposed method for online learning of PD data. The incremental use of Gaussian process regression will significantly improve the efficiency of the proposed method, particularly when there are big datasets for PD with many features of speech signals.
Author Contributions
Conceptualization, M.N.; methodology, M.N.; software, M.N., R.A.A., S.A., A.A. and M.A.; validation, M.N.; formal analysis, M.N.; investigation, M.N.; resources, M.N.; data curation, M.N.; writing—original draft preparation, M.N.; writing—review and editing, M.N., R.A.A., S.A., A.A. and M.A.; visualization, M.N., R.A.A., S.A., A.A. and M.A. All authors have read and agreed to the published version of the manuscript.
Funding
The authors are thankful to the Deanship of Scientific Research at Najran University for funding this work, under the Research Groups Funding program grant code NU/RG/SERC/12/12.
Institutional Review Board Statement
Not applicable.
Informed Consent Statement
Not applicable.
Data Availability Statement
The data are available in the UCI machine learning archive, which was published online in 2009.
Conflicts of Interest
The authors declare no conflict of interest.
Appendix A
Table A1.
The results for Laplacian score.
Table A1.
The results for Laplacian score.
| Cluster 1 | Cluster 2 | Cluster 3 | Cluster 4 | Cluster 5 | Cluster 6 | Cluster 7 | Cluster 8 | Cluster 9 |
|---|---|---|---|---|---|---|---|---|
| HNR | HNR | HNR | HNR | HNR | HNR | HNR | HNR | HNR |
| RPDE | RPDE | RPDE | NHR | RPDE | RPDE | NHR | MDVP:Shimmer (dB) | RPDE |
| MDVP:Shimmer (dB) | MDVP:Shimmer (dB) | DFA | MDVP:Shimmer (dB) | MDVP:Shimmer (dB) | MDVP:Shimmer (dB) | MDVP:Shimmer (dB) | MDVP:Shimmer | MDVP:Shimmer (dB) |
| NHR | NHR | Shimmer:APQ5 | MDVP:Shimmer | PPE | MDVP:Shimmer | Shimmer:APQ5 | Shimmer:APQ5 | MDVP:Shimmer |
| MDVP:Shimmer | MDVP:Shimmer | MDVP:Shimmer (dB) | Shimmer:APQ5 | MDVP:Shimmer | Shimmer:APQ5 | MDVP:Shimmer | Shimmer:DDA | Shimmer:APQ5 |
| PPE | PPE | MDVP:Shimmer | Shimmer:DDA | Shimmer:DDA | Shimmer:DDA | MDVP:Jitter:PPQ5 | Shimmer:APQ3 | Shimmer:DDA |
| DFA | DFA | Shimmer:APQ3 | Shimmer:APQ3 | Shimmer:APQ3 | Shimmer:APQ3 | Shimmer:APQ3 | Shimmer:APQ11 | Shimmer:APQ3 |
| Shimmer:APQ5 | Shimmer:APQ5 | Shimmer:DDA | Shimmer:APQ11 | Shimmer:APQ5 | Shimmer:APQ11 | Shimmer:DDA | NHR | PPE |
| Shimmer:APQ3 | Shimmer:APQ3 | MDVP:Jitter:PPQ5 | RPDE | DFA | PPE | MDVP:Jitter (Abs) | PPE | Shimmer:APQ11 |
| Shimmer:DDA | Shimmer:DDA | Shimmer:APQ11 | DFA | Shimmer:APQ11 | DFA | Shimmer:APQ11 | DFA | DFA |
| Shimmer:APQ11 | Shimmer:APQ11 | PPE | PPE | MDVP:Jitter:PPQ5 | MDVP:Jitter (Abs) | MDVP:Jitter (%) | RPDE | NHR |
| MDVP:Jitter (Abs) | MDVP:Jitter (Abs) | Jitter:DDP | MDVP:Jitter:PPQ5 | NHR | NHR | Jitter:DDP | MDVP:Jitter:PPQ5 | MDVP:Jitter (Abs) |
| MDVP:Jitter:PPQ5 | MDVP:Jitter:PPQ5 | MDVP:Jitter:RAP | MDVP:Jitter (%) | MDVP:Jitter (Abs) | MDVP:Jitter:PPQ5 | MDVP:Jitter:RAP | MDVP:Jitter (%) | MDVP:Jitter (%) |
| MDVP:Jitter (%) | MDVP:Jitter (%) | MDVP:Jitter (%) | MDVP:Jitter:RAP | MDVP:Jitter (%) | MDVP:Jitter (%) | DFA | MDVP:Jitter (Abs) | MDVP:Jitter:PPQ5 |
| MDVP:Jitter:RAP | MDVP:Jitter:RAP | MDVP:Jitter (Abs) | Jitter:DDP | Jitter:DDP | Jitter:DDP | PPE | MDVP:Jitter:RAP | Jitter:DDP |
| Jitter:DDP | Jitter:DDP | NHR | MDVP:Jitter (Abs) | MDVP:Jitter:RAP | MDVP:Jitter:RAP | RPDE | Jitter:DDP | MDVP:Jitter:RAP |
References
- Welsh, M. Parkinson’s disease and quality of life: Issues and challenges beyond motor symptoms. Neurol. Clin. 2004, 22, S141–S148. [Google Scholar] [CrossRef]
- Nilashi, M.; Ibrahim, O.; Ahani, A. Accuracy improvement for predicting Parkinson’s disease progression. Sci. Rep. 2016, 6, 34181. [Google Scholar] [CrossRef] [PubMed]
- Tsanas, A.; Little, M.A.; McSharry, P.E.; Spielman, J.; Ramig, L.O. Novel speech signal processing algorithms for high-accuracy classification of Parkinson’s disease. IEEE Trans. Biomed. Eng. 2012, 59, 1264–1271. [Google Scholar] [CrossRef]
- Nazarko, L. A team approach to the complexities of Parkinson’s. Br. J. Healthc. Assist. 2013, 7, 533–539. [Google Scholar] [CrossRef]
- Dowding, C.H.; Shenton, C.L.; Salek, S.S. A review of the health-related quality of life and economic impact of Parkinson’s disease. Drugs Aging 2006, 23, 693–721. [Google Scholar] [CrossRef]
- Rozas, N.S.; Sadowsky, J.M.; Jones, D.J.; Jeter, C.B. Incorporating oral health into interprofessional care teams for patients with Parkinson’s disease. Park. Relat. Disord. 2017, 43, 9–14. [Google Scholar] [CrossRef]
- Rocca, W.A. The burden of Parkinson’s disease: A worldwide perspective. Lancet Neurol. 2018, 17, 928–929. [Google Scholar] [CrossRef]
- Robinson, P.A. Protein stability and aggregation in Parkinson’s disease. Biochem. J. 2008, 413, 1–13. [Google Scholar] [CrossRef]
- Statista. Number of U.S. Patients for Parkinson’s Disease and Parkinson’s Disease Psychosis in 2016 and 2030. 2016. Available online: https://www.statista.com/statistics/786193/parkinsons-disease-and-psychosis-patients-in-us/ (accessed on 28 December 2022).
- Seki, M.; Takahashi, K.; Uematsu, D.; Mihara, B.; Morita, Y.; Isozumi, K.; Ohta, K.; Muramatsu, K.; Shirai, T.; Nogawa, S. Clinical features and varieties of non-motor fluctuations in Parkinson’s disease: A Japanese multicenter study. Park. Relat. Disord. 2013, 19, 104–108. [Google Scholar] [CrossRef]
- Chaudhuri, K.R.; Healy, D.G.; Schapira, A.H. Non-motor symptoms of Parkinson’s disease: Diagnosis and management. Lancet Neurol. 2006, 5, 235–245. [Google Scholar] [CrossRef]
- Devarajan, M.; Ravi, L. Intelligent cyber-physical system for an efficient detection of Parkinson disease using fog computing. Multimed. Tools Appl. 2019, 78, 32695–32719. [Google Scholar] [CrossRef]
- Tsanas, A.; Little, M.; McSharry, P.; Ramig, L. Accurate telemonitoring of Parkinson’s disease progression by non-invasive speech tests. Nat. Preced. 2009, 1. [Google Scholar] [CrossRef]
- Nilashi, M.; Ibrahim, O.; Ahmadi, H.; Shahmoradi, L.; Farahmand, M. A hybrid intelligent system for the prediction of Parkinson’s Disease progression using machine learning techniques. Biocybern. Biomed. Eng. 2018, 38, 1–15. [Google Scholar] [CrossRef]
- Nilashi, M.; Ahmadi, H.; Sheikhtaheri, A.; Naemi, R.; Alotaibi, R.; Alarood, A.A.; Munshi, A.; Rashid, T.A.; Zhao, J. Remote tracking of Parkinson’s disease progression using ensembles of deep belief network and self-organizing map. Expert Syst. Appl. 2020, 159, 113562. [Google Scholar] [CrossRef]
- Nilashi, M.; Ibrahim, O.; Samad, S.; Ahmadi, H.; Shahmoradi, L.; Akbari, E. An analytical method for measuring the Parkinson’s disease progression: A case on a Parkinson’s telemonitoring dataset. Measurement 2019, 136, 545–557. [Google Scholar] [CrossRef]
- Maglogiannis, I.; Zafiropoulos, E.; Anagnostopoulos, I. An intelligent system for automated breast cancer diagnosis and prognosis using SVM based classifiers. Appl. Intell. 2009, 30, 24–36. [Google Scholar] [CrossRef]
- Kandhasamy, J.P.; Balamurali, S. Performance analysis of classifier models to predict diabetes mellitus. Procedia Comput. Sci. 2015, 47, 45–51. [Google Scholar] [CrossRef]
- Singh, N.; Singh, P. Stacking-based multi-objective evolutionary ensemble framework for prediction of diabetes mellitus. Biocybern. Biomed. Eng. 2020, 40, 1–22. [Google Scholar] [CrossRef]
- Qian, X.; Zhou, Z.; Hu, J.; Zhu, J.; Huang, H.; Dai, Y. A comparative study of kernel-based vector machines with probabilistic outputs for medical diagnosis. Biocybern. Biomed. Eng. 2021, 41, 1486–1504. [Google Scholar] [CrossRef]
- Shahid, A.H.; Singh, M. A novel approach for coronary artery disease diagnosis using hybrid particle swarm optimization based emotional neural network. Biocybern. Biomed. Eng. 2020, 40, 1568–1585. [Google Scholar] [CrossRef]
- Solana-Lavalle, G.; Galán-Hernández, J.-C.; Rosas-Romero, R. Automatic Parkinson disease detection at early stages as a pre-diagnosis tool by using classifiers and a small set of vocal features. Biocybern. Biomed. Eng. 2020, 40, 505–516. [Google Scholar] [CrossRef]
- Alfonso-Francia, G.; Pedraza-Ortega, J.C.; Badillo-Fernández, M.; Toledano-Ayala, M.; Aceves-Fernandez, M.A.; Rodriguez-Resendiz, J.; Ko, S.-B.; Tovar-Arriaga, S. Performance Evaluation of Different Object Detection Models for the Segmentation of Optical Cups and Discs. Diagnostics 2022, 12, 3031. [Google Scholar] [CrossRef]
- Gallegos-Duarte, M.; Mendiola-Santibañez, J.D.; Ibrahimi, D.; Paredes-Orta, C.; Rodríguez-Reséndiz, J.; González-Gutiérrez, C.A. A novel method for measuring subtle alterations in pupil size in children with congenital strabismus. IEEE Access 2020, 8, 125331–125344. [Google Scholar] [CrossRef]
- Aviles, M.; Sánchez-Reyes, L.-M.; Fuentes-Aguilar, R.Q.; Toledo-Pérez, D.C.; Rodríguez-Reséndiz, J. A Novel Methodology for Classifying EMG Movements Based on SVM and Genetic Algorithms. Micromachines 2022, 13, 2108. [Google Scholar] [CrossRef]
- Ghane, M.; Ang, M.C.; Nilashi, M.; Sorooshian, S. Enhanced decision tree induction using evolutionary techniques for Parkinson’s disease classification. Biocybern. Biomed. Eng. 2022, 42, 902–920. [Google Scholar] [CrossRef]
- Nilashi, M.; bin Ibrahim, O.; Ahmadi, H.; Shahmoradi, L. An analytical method for diseases prediction using machine learning techniques. Comput. Chem. Eng. 2017, 106, 212–223. [Google Scholar] [CrossRef]
- Polat, K. Classification of Parkinson’s disease using feature weighting method on the basis of fuzzy C-means clustering. Int. J. Syst. Sci. 2012, 43, 597–609. [Google Scholar] [CrossRef]
- Mittal, V.; Sharma, R. Machine learning approach for classification of Parkinson disease using acoustic features. J. Reliab. Intell. Environ. 2021, 7, 233–239. [Google Scholar] [CrossRef]
- Chen, H.-L.; Huang, C.-C.; Yu, X.-G.; Xu, X.; Sun, X.; Wang, G.; Wang, S.-J. An efficient diagnosis system for detection of Parkinson’s disease using fuzzy k-nearest neighbor approach. Expert Syst. Appl. 2013, 40, 263–271. [Google Scholar] [CrossRef]
- Wan, S.; Liang, Y.; Zhang, Y.; Guizani, M. Deep multi-layer perceptron classifier for behavior analysis to estimate parkinson’s disease severity using smartphones. IEEE Access 2018, 6, 36825–36833. [Google Scholar] [CrossRef]
- Jain, S.; Shetty, S. Improving accuracy in noninvasive telemonitoring of progression of Parkinson’s Disease using two-step predictive model. In Proceedings of the 2016 Third International Conference on Electrical, Electronics, Computer Engineering and their Applications (EECEA), IEEE, Beirut, Lebanon, 21–23 April 2016; pp. 104–109. [Google Scholar] [CrossRef]
- Benayad, N.; Soumaya, Z.; Taoufiq, B.D.; Abdelkrim, A. Features selection by genetic algorithm optimization with k-nearest neighbour and learning ensemble to predict Parkinson disease. Int. J. Electr. Comput. Eng. (2088-8708) 2022, 12, 1982–1989. [Google Scholar] [CrossRef]
- Behroozi, M.; Sami, A. A multiple-classifier framework for Parkinson’s disease detection based on various vocal tests. Int. J. Telemed. Appl. 2016, 2016, 6837498. [Google Scholar] [CrossRef]
- Sharma, S.R.; Singh, B.; Kaur, M. Classification of Parkinson disease using binary Rao optimization algorithms. Expert Syst. 2021, 38, e12674. [Google Scholar] [CrossRef]
- Das, R. A comparison of multiple classification methods for diagnosis of Parkinson disease. Expert Syst. Appl. 2010, 37, 1568–1572. [Google Scholar] [CrossRef]
- Uppalapati, B.; Srinivasa Rao, S.; Srinivasa Rao, P. Application of ANN Combined with Machine Learning for Early Recognition of Parkinson’s Disease. In Intelligent System Design; Springer: Singapore, 2023; pp. 39–49. [Google Scholar] [CrossRef]
- Afonso, L.C.; Rosa, G.H.; Pereira, C.R.; Weber, S.A.; Hook, C.; Albuquerque, V.H.C.; Papa, J.P. A recurrence plot-based approach for Parkinson’s disease identification. Future Gener. Comput. Syst. 2019, 94, 282–292. [Google Scholar] [CrossRef]
- Anand, A.; Bolishetti, N.; Teja, B.S.N.; Adhikari, S.; Ahmed, I.; Natarajan, J. Neurodegenerative Disorder of Ageing using Neural Networks. In Proceedings of the 2022 International Conference on Applied Artificial Intelligence and Computing (ICAAIC), IEEE, Salem, India, 9–11 May 2022; pp. 183–186. [Google Scholar] [CrossRef]
- Pereira, C.R.; Pereira, D.R.; Rosa, G.H.; Albuquerque, V.H.; Weber, S.A.; Hook, C.; Papa, J.P. Handwritten dynamics assessment through convolutional neural networks: An application to Parkinson’s disease identification. Artif. Intell. Med. 2018, 87, 67–77. [Google Scholar] [CrossRef]
- Shinde, S.; Prasad, S.; Saboo, Y.; Kaushick, R.; Saini, J.; Pal, P.K.; Ingalhalikar, M. Predictive markers for Parkinson’s disease using deep neural nets on neuromelanin sensitive MRI. Neuroimage Clin. 2019, 22, 101748. [Google Scholar] [CrossRef]
- Manap, H.H.; Tahir, N.M.; Yassin, A.I.M. Statistical analysis of parkinson disease gait classification using Artificial Neural Network. In Proceedings of the 2011 IEEE International Symposium on Signal Processing and Information Technology (ISSPIT), IEEE, Bilbao, Spain, 14–17 December 2011; pp. 60–65. [Google Scholar] [CrossRef]
- Eskidere, Ö.; Ertaş, F.; Hanilçi, C. A comparison of regression methods for remote tracking of Parkinson’s disease progression. Expert Syst. Appl. 2012, 39, 5523–5528. [Google Scholar] [CrossRef]
- Babu, G.S.; Suresh, S. Parkinson’s disease prediction using gene expression–A projection based learning meta-cognitive neural classifier approach. Expert Syst. Appl. 2013, 40, 1519–1529. [Google Scholar] [CrossRef]
- Hariharan, M.; Polat, K.; Sindhu, R. A new hybrid intelligent system for accurate detection of Parkinson’s disease. Comput. Methods Programs Biomed. 2014, 113, 904–913. [Google Scholar] [CrossRef]
- Khan, M.M.; Chalup, S.K.; Mendes, A. Parkinson’s disease data classification using evolvable wavelet neural networks. In Proceedings of theAustralasian Conference on Artificial Life and Computational Intelligence, Canberra, ACT, Australia, 2–5 February 2016; pp. 113–124. [Google Scholar]
- Muniz, A.; Liu, H.; Lyons, K.; Pahwa, R.; Liu, W.; Nobre, F.; Nadal, J. Comparison among probabilistic neural network, support vector machine and logistic regression for evaluating the effect of subthalamic stimulation in Parkinson disease on ground reaction force during gait. J. Biomech. 2010, 43, 720–726. [Google Scholar] [CrossRef] [PubMed]
- Buza, K.; Varga, N.Á. Parkinsonet: Estimation of updrs score using hubness-aware feedforward neural networks. Appl. Artif. Intell. 2016, 30, 541–555. [Google Scholar] [CrossRef]
- Al-Fatlawi, A.H.; Jabardi, M.H.; Ling, S.H. Efficient diagnosis system for Parkinson’s disease using deep belief network. In Proceedings of the 2016 IEEE Congress on Evolutionary Computation (CEC), IEEE, Vancouver, BC, Canada, 24–29 July 2016; pp. 1324–1330. [Google Scholar] [CrossRef]
- Borzì, L.; Sigcha, L.; Rodríguez-Martín, D.; Olmo, G. Real-time detection of freezing of gait in Parkinson’s disease using multi-head convolutional neural networks and a single inertial sensor. Artif. Intell. Med. 2023, 135, 102459. [Google Scholar] [CrossRef] [PubMed]
- Grover, S.; Bhartia, S.; Yadav, A.; Seeja, K. Predicting severity of Parkinson’s disease using deep learning. Procedia Comput. Sci. 2018, 132, 1788–1794. [Google Scholar] [CrossRef]
- El-Hasnony, I.M.; Barakat, S.I.; Mostafa, R.R. Optimized ANFIS model using hybrid metaheuristic algorithms for Parkinson’s disease prediction in IoT environment. IEEE Access 2020, 8, 119252–119270. [Google Scholar] [CrossRef]
- Daher, A.; Yassin, S.; Alsamra, H.; Abou Ali, H. Adaptive Neuro-Fuzzy Inference System As New Real-Time Approach For Parkinson Seizures Prediction. In Proceedings of the 2021 4th International Conference on Bio-Engineering for Smart Technologies (BioSMART), IEEE, Paris/Créteil, France, 8–10 December 2021; pp. 1–4. [Google Scholar] [CrossRef]
- Nilashi, M.; Bin Ibrahim, O.; Mardani, A.; Ahani, A.; Jusoh, A. A soft computing approach for diabetes disease classification. Health Inform. J. 2018, 24, 379–393. [Google Scholar] [CrossRef]
- Li, D.-C.; Liu, C.-W.; Hu, S.C. A fuzzy-based data transformation for feature extraction to increase classification performance with small medical data sets. Artif. Intell. Med. 2011, 52, 45–52. [Google Scholar] [CrossRef]
- Bellino, G.M.; Ramirez, C.R.; Massafra, A.M.; Schiaffino, L. Fuzzy logic as a control strategy to command a deep brain stimulator in patients with parkinson disease. In Latin American Conference on Biomedical Engineering; Springer: Cham, Switzerland, 2019; pp. 129–137. [Google Scholar] [CrossRef]
- Aversano, L.; Bernardi, M.L.; Cimitile, M.; Pecori, R. Fuzzy neural networks to detect parkinson disease. In Proceedings of the 2020 IEEE International Conference on Fuzzy Systems (FUZZ-IEEE), IEEE, Glasgow, UK, 19–24 July 2020; pp. 1–8. [Google Scholar] [CrossRef]
- Guo, P.-F.; Bhattacharya, P.; Kharma, N. Advances in detecting Parkinson’s disease. In International Conference on Medical Biometrics; Springer: Berlin/Heidelberg, Germany, 2010; pp. 306–314. [Google Scholar] [CrossRef]
- Parziale, A.; Senatore, R.; Della Cioppa, A.; Marcelli, A. Cartesian genetic programming for diagnosis of Parkinson disease through handwriting analysis: Performance vs. interpretability issues. Artif. Intell. Med. 2021, 111, 101984. [Google Scholar] [CrossRef]
- Castelli, M.; Vanneschi, L.; Silva, S. Prediction of the unified Parkinson’s disease rating scale assessment using a genetic programming system with geometric semantic genetic operators. Expert Syst. Appl. 2014, 41, 4608–4616. [Google Scholar] [CrossRef]
- Avci, D.; Dogantekin, A. An expert diagnosis system for parkinson disease based on genetic algorithm-wavelet kernel-extreme learning machine. Park. Dis. 2016, 2016. [Google Scholar] [CrossRef]
- Pelzer, E.A.; Stürmer, S.; Feis, D.-L.; Melzer, C.; Schwartz, F.; Scharge, M.; Eggers, C.; Tittgemeyer, M.; Timmermann, L. Clustering of Parkinson subtypes reveals strong influence of DRD2 polymorphism and gender. Sci. Rep. 2022, 12, 1–6. [Google Scholar]
- Shalaby, M.; Belal, N.A.; Omar, Y. Data clustering improves Siamese neural networks classification of Parkinson’s disease. Complexity 2021, 2021, 3112771. [Google Scholar] [CrossRef]
- Sherly Puspha Annabel, L.; Sreenidhi, S.; Vishali, N. A Novel Diagnosis System for Parkinson’s Disease Using K-means Clustering and Decision Tree. In Communication and Intelligent Systems; Springer: Singapore; pp. 607–615. [CrossRef]
- Nilashi, M.; Abumalloh, R.A.; Minaei-Bidgoli, B.; Samad, S.; Yousoof Ismail, M.; Alhargan, A.; Abdu Zogaan, W. Predicting Parkinson’s Disease Progression: Evaluation of Ensemble Methods in Machine Learning. J. Healthc. Eng. 2022, 2022, 2793361. [Google Scholar] [CrossRef]
- Mabrouk, R. Principal Component Analysis versus Subject’s Residual Profile Analysis for Neuroinflammation Investigation in Parkinson Patients: A PET Brain Imaging Study. J. Imaging 2022, 8, 56. [Google Scholar] [CrossRef] [PubMed]
- Kiran, G.U.; Vasumathi, D. Predicting Parkinson’s Disease using Extreme Learning Measure and Principal Component Analysis based Mini SOM. Ann. Rom. Soc. Cell Biol. 2021, 25, 16099–16111. [Google Scholar]
- Wang, Y.; Gao, H.; Jiang, S.; Luo, Q.; Han, X.; Xiong, Y.; Xu, Z.; Qiao, R.; Yang, X. Principal component analysis of routine blood test results with Parkinson’s disease: A case-control study. Exp. Gerontol. 2021, 144, 111188. [Google Scholar] [CrossRef]
- Xu, Z.; Zhu, Z. Handwritten dynamics classification of Parkinson’s disease through support vector machine and principal component analysis. In Journal of Physics: Conference Series; IOP Publishing: Sanya, China, 2021; p. 012098. [Google Scholar]
- Rao, D.V.; Sucharitha, Y.; Venkatesh, D.; Mahamthy, K.; Yasin, S.M. Diagnosis of Parkinson’s Disease using Principal Component Analysis and Machine Learning algorithms with Vocal Features. In Proceedings of the 2022 International Conference on Sustainable Computing and Data Communication Systems (ICSCDS), IEEE, Erode, India, 7–9 April 2022; pp. 200–206. [Google Scholar] [CrossRef]
- Lakshmi, T.; Ramani, B.L.; Jayana, R.K.; Kaza, S.; Kamatam, S.S.S.T.; Raghava, B. An Ensemble Model to Detect Parkinson’s Disease Using MRI Images. In Intelligent System Design; Springer: Singapore, 2023; pp. 465–473. [Google Scholar] [CrossRef]
- Masud, M.; Singh, P.; Gaba, G.S.; Kaur, A.; Alroobaea, R.; Alrashoud, M.; Alqahtani, S.A. CROWD: Crow search and deep learning based feature extractor for classification of Parkinson’s disease. ACM Trans. Internet Technol. (TOIT) 2021, 21, 1–18. [Google Scholar] [CrossRef]
- Gunduz, H. Deep Learning-Based Parkinson’s Disease Classification Using Vocal Feature Sets. IEEE Access 2019, 7, 115540–115551. [Google Scholar] [CrossRef]
- Bhakar, S.; Verma, S.S. Parkinson’s Disease Detection Through Deep Learning Model. In ICT Systems and Sustainability; Springer: Singapore, 2023; pp. 95–103. [Google Scholar] [CrossRef]
- Singh, K.R.; Dash, S. Early detection of neurological diseases using machine learning and deep learning techniques: A review. Artif. Intell. Neurol. Disord. 2023, 1–24. [Google Scholar] [CrossRef]
- Nilashi, M.; Abumalloh, R.A.; Yusuf, S.Y.M.; Thi, H.H.; Alsulami, M.; Abosaq, H.; Alyami, S.; Alghamdi, A. Early diagnosis of Parkinson’s disease: A combined method using deep learning and neuro-fuzzy techniques. Comput. Biol. Chem. 2023, 102, 107788. [Google Scholar] [CrossRef]
- Johri, A.; Tripathi, A. Parkinson Disease Detection Using Deep Neural Networks. In Proceedings of the 2019 Twelfth International Conference on Contemporary Computing (IC3), IEEE, Noida, India, 8–10 August 2019; pp. 1–4. [Google Scholar] [CrossRef]
- Kose, U.; Deperlioglu, O.; Alzubi, J.; Patrut, B. Diagnosing parkinson by using deep autoencoder neural network. In Deep Learning for Medical Decision Support Systems; Springer: Singapore, 2021; pp. 73–93. [Google Scholar] [CrossRef]
- Nagasubramanian, G.; Sankayya, M. Multi-variate vocal data analysis for detection of Parkinson disease using deep learning. Neural Comput. Appl. 2021, 33, 4849–4864. [Google Scholar] [CrossRef]
- Williams, C.K. Prediction with Gaussian processes: From linear regression to linear prediction and beyond. In Learning in Graphical Models; Springer: Dordrecht, The Netherlands, 1998; pp. 599–621. [Google Scholar] [CrossRef]
- Bachoc, F.; Gamboa, F.; Loubes, J.-M.; Venet, N. A Gaussian process regression model for distribution inputs. IEEE Trans. Inf. Theory 2017, 64, 6620–6637. [Google Scholar] [CrossRef]
- Zhikun, H.; Guangbin, L.; Xijing, Z.; Jian, Y. Temperature model for FOG zero-bias using Gaussian process regression. In Proceedings of the Intelligence Computation and Evolutionary Computation, Wuhan, China, 7 July 2013; pp. 37–45. [Google Scholar]
- Lin, C.; Li, T.; Chen, S.; Liu, X.; Lin, C.; Liang, S. Gaussian process regression-based forecasting model of dam deformation. Neural Comput. Appl. 2019, 31, 8503–8518. [Google Scholar] [CrossRef]
- Hewing, L.; Kabzan, J.; Zeilinger, M.N. Cautious model predictive control using gaussian process regression. IEEE Trans. Control Syst. Technol. 2019, 28, 2736–2743. [Google Scholar] [CrossRef]
- Kohonen, T. Essentials of the self-organizing map. Neural Netw. 2013, 37, 52–65. [Google Scholar] [CrossRef]
- Flexer, A. On the use of self-organizing maps for clustering and visualization. Intell. Data Anal. 2001, 5, 373–384. [Google Scholar] [CrossRef]
- Penn, B.S. Using self-organizing maps to visualize high-dimensional data. Comput. Geosci. 2005, 31, 531–544. [Google Scholar] [CrossRef]
- Nilashi, M.; Asadi, S.; Abumalloh, R.A.; Samad, S.; Ghabban, F.; Supriyanto, E.; Osman, R. Sustainability performance assessment using self-organizing maps (SOM) and classification and ensembles of regression trees (CART). Sustainability 2021, 13, 3870. [Google Scholar] [CrossRef]
- Ahani, A.; Nilashi, M.; Yadegaridehkordi, E.; Sanzogni, L.; Tarik, A.R.; Knox, K.; Samad, S.; Ibrahim, O. Revealing customers’ satisfaction and preferences through online review analysis: The case of Canary Islands hotels. J. Retail. Consum. Serv. 2019, 51, 331–343. [Google Scholar] [CrossRef]
- Aazhang, B.; Paris, B.-P.; Orsak, G.C. Neural networks for multiuser detection in code-division multiple-access communications. IEEE Trans. Commun. 1992, 40, 1212–1222. [Google Scholar] [CrossRef]
- Nilashi, M.; Yadegaridehkordi, E.; Ibrahim, O.; Samad, S.; Ahani, A.; Sanzogni, L. Analysis of travellers’ online reviews in social networking sites using fuzzy logic approach. Int. J. Fuzzy Syst. 2019, 21, 1367–1378. [Google Scholar] [CrossRef]
- Ahani, A.; Nilashi, M.; Ibrahim, O.; Sanzogni, L.; Weaven, S. Market segmentation and travel choice prediction in Spa hotels through TripAdvisor’s online reviews. Int. J. Hosp. Manag. 2019, 80, 52–77. [Google Scholar] [CrossRef]
- Zibarzani, M.; Abumalloh, R.A.; Nilashi, M.; Samad, S.; Alghamdi, O.; Nayer, F.K.; Ismail, M.Y.; Mohd, S.; Akib, N.A.M. Customer satisfaction with Restaurants Service Quality during COVID-19 outbreak: A two-stage methodology. Technol. Soc. 2022, 70, 101977. [Google Scholar] [CrossRef] [PubMed]
- Belkin, M.; Niyogi, P. Laplacian eigenmaps and spectral techniques for embedding and clustering. Adv. Neural Inf. Process. Syst. 2001, 14. [Google Scholar]
- Xu, J.; Man, H. Dictionary learning based on laplacian score in sparse coding. In Proceedings of the International Workshop on Machine Learning and Data Mining in Pattern Recognition, New York, NY, USA, 30 August–3 September 2011; pp. 253–264. [Google Scholar]
- Liu, R.; Yang, N.; Ding, X.; Ma, L. An unsupervised feature selection algorithm: Laplacian score combined with distance-based entropy measure. In Proceedings of the 2009 Third International Symposium on Intelligent Information Technology Application, IEEE, Nanchang, China, 21–22 November 2009; pp. 65–68. [Google Scholar] [CrossRef]
- Jiang, D.; Tang, C.; Zhang, A. Cluster analysis for gene expression data: A survey. IEEE Trans. Knowl. Data Eng. 2004, 16, 1370–1386. [Google Scholar] [CrossRef]
- Elmore, K.L.; Richman, M.B. Euclidean distance as a similarity metric for principal component analysis. Mon. Weather Rev. 2001, 129, 540–549. [Google Scholar] [CrossRef]


Disclaimer/Publisher’s Note: The statements, opinions and data contained in all publications are solely those of the individual author(s) and contributor(s) and not of MDPI and/or the editor(s). MDPI and/or the editor(s) disclaim responsibility for any injury to people or property resulting from any ideas, methods, instructions or products referred to in the content. |
© 2023 by the authors. Licensee MDPI, Basel, Switzerland. This article is an open access article distributed under the terms and conditions of the Creative Commons Attribution (CC BY) license (https://creativecommons.org/licenses/by/4.0/).