
The Performance of Different Machine Learning Algorithm and Regression Models in Predicting High-Grade Intracranial Meningioma
 ,
,
Abstract
:1. Introduction
2. Method
2.1. Patients
2.2. Variable Definition
2.3. Algorithm Training and Evaluation
3. Result
4. Discussion
5. Conclusions
Author Contributions
Funding
Institutional Review Board Statement
Informed Consent Statement
Data Availability Statement
Conflicts of Interest
References
- Apra, C.; Peyre, M.; Kalamarides, M. Current treatment options for meningioma. Expert Rev. Neurother. 2018, 18, 241–249. [Google Scholar] [CrossRef] [PubMed]
- Louis, D.N.; Perry, A.; Reifenberger, G.; Von Deimling, A.; Figarella-Branger, D.; Cavenee, W.K.; Ohgaki, H.; Wiestler, O.D.; Kleihues, P.; Ellison, D.W. The 2016 World Health Organization Classification of Tumors of the Central Nervous System: A summary. Acta Neuropathol. 2016, 131, 803–820. [Google Scholar] [CrossRef] [Green Version]
- Ros-Sanjuan, A.; Iglesias-Moroño, S.; Carrasco-Brenes, A.; Bautista-Ojeda, D.; Arraez-Sanchez, M.A. Atypical Meningiomas: Histologic and Clinical Factors Associated with Recurrence. World Neurosurg. 2019, 125, e248–e256. [Google Scholar] [CrossRef] [PubMed]
- Yang, S.Y.; Park, C.K.; Park, S.H.; Kim, D.G.; Chung, Y.S.; Jung, H.W. Atypical and anaplastic meningiomas: Prognostic implications of clinicopathological features. J. Neurol. Neurosurg. Psychiatry 2008, 79, 574–580. [Google Scholar] [CrossRef] [PubMed]
- Nassiri, F.; Mamatjan, Y.; Suppiah, S.; Badhiwala, J.H.; Mansouri, S.; Karimi, S.; Saarela, O.; Poisson, L.M.; Gepfner-Tuma, I.; Schittenhelm, J.; et al. DNA methylation profiling to predict recurrence risk in meningioma: Development and validation of a nomogram to optimize clinical management. Neuro-Oncology 2019, 21, 901–910. [Google Scholar] [CrossRef] [PubMed] [Green Version]
- Peng, S.; Cheng, Z.; Guo, Z. Diagnostic nomogram model for predicting preoperative pathological grade of meningioma. Transl. Cancer Res. 2021, 10, 4057–4064. [Google Scholar] [CrossRef] [PubMed]
- Khanna, O.; Fathi Kazerooni, A.; Farrell, C.J.; Baldassari, M.P.; Alexander, T.D.; Karsy, M.; A Greenberger, B.; A Garcia, J.; Sako, C.; Evans, J.J.; et al. Machine Learning Using Multiparametric Magnetic Resonance Imaging Radiomic Feature Analysis to Predict Ki-67 in World Health Organization Grade I Meningiomas. Neurosurgery 2021, 89, 928–936. [Google Scholar] [CrossRef] [PubMed]
- Joo, L.; Park, J.E.; Park, S.Y.; Nam, S.J.; Kim, Y.-H.; Kim, J.H.; Kim, H.S. Extensive peritumoral edema and brain-to-tumor interface MRI features enable prediction of brain invasion in meningioma: Development and validation. Neuro-Oncology 2021, 23, 324–333. [Google Scholar] [CrossRef] [PubMed]
- Goldbrunner, R.; Minniti, G.; Preusser, M.; Jenkinson, M.D.; Sallabanda, K.; Houdart, E.; von Deimling, A.; Stavrinou, P.; Lefranc, F.; Lund-Johansen, M.; et al. EANO guidelines for the diagnosis and treatment of meningiomas. Lancet Oncol. 2016, 17, e383–e391. [Google Scholar] [CrossRef] [PubMed] [Green Version]
- Nassiri, F.; Price, B.; Shehab, A.; Au, K.; Cusimano, M.D.; Jenkinson, M.D.; Jungk, C.; Mansouri, A.; Santarius, T.; Suppiah, S.; et al. Life after surgical resection of a meningioma: A prospective cross-sectional study evaluating health-related quality of life. Neuro-Oncology 2019, 21 (Suppl. 1), i32–i43. [Google Scholar] [CrossRef] [PubMed] [Green Version]
- Karri, R.; Chen, Y.-P.P.; Drummond, K.J. Using machine learning to predict health-related quality of life outcomes in patients with low grade glioma, meningioma, and acoustic neuroma. PLoS ONE 2022, 17, e0267931. [Google Scholar] [CrossRef] [PubMed]
- Mijderwijk, H.-J.; Steyerberg, E.W.; Steiger, H.-J.; Fischer, I.; Kamp, M.A. Fundamentals of Clinical Prediction Modeling for the Neurosurgeon. Neurosurgery 2019, 85, 302–311. [Google Scholar] [CrossRef] [PubMed] [Green Version]
- Riley, R.D.; Ensor, J.; Snell, K.I.E.; Martin, G.P.; Reitsma, J.B.; Moons, K.G.M.; Collins, G.; van Smeden, M. Calculating the sample size required for developing a clinical prediction model. BMJ 2020, 368, m441. [Google Scholar] [CrossRef] [PubMed] [Green Version]
- Miao, Y.; Lu, X.; Qiu, Y.; Jiang, J.; Lin, Y. A multivariate analysis of prognostic factors for health-related quality of life in patients with surgically managed meningioma. J. Clin. Neurosci. 2010, 17, 446–449. [Google Scholar] [CrossRef] [PubMed]
- Mohsenipour, I.; Deusch, E.; Gabl, M.; Hofer, M.; Twerdy, K. Quality of life in patients after meningioma resection. Acta Neurochir. 2001, 143, 547–553. [Google Scholar] [CrossRef] [PubMed]
- Tanti, M.J.; Marson, A.G.; Jenkinson, M.D. Epilepsy and adverse quality of life in surgically resected meningioma. Acta Neurol. Scand. 2017, 136, 246–253. [Google Scholar] [CrossRef] [PubMed]
- Gill, C.M.; Loewenstern, J.; Rutland, J.W.; Arib, H.; Shrivastava, R.K. Peritumoral edema correlates with mutational burden in meningiomas. Neuroradiology 2021, 63, 73–80. [Google Scholar] [CrossRef] [PubMed]
- Boukobza, M.; Cebula, H.; Pop, R.; Kouakou, F.; Chibbaro, S. Cystic meningioma: Radiological, histological, and surgical particularities in 43 patients. Acta Neurochir. 2016, 158, 1955–1964. [Google Scholar] [CrossRef] [PubMed]


| Variable | Meningioma | p Value | ||
|---|---|---|---|---|
| Overall | WHO I | WHO II and III | ||
| Age(year), n(%) | ||||
| 0–20 | 25 (1.266) | 14 (0.841) | 11 (3.548) | <0.001 |
| 20–40 | 272 (13.772) | 220 (13.213) | 52 (16.774) | |
| 40–60 | 1074 (54.380) | 920 (55.255) | 154 (49.677) | |
| >60 | 604 (30.582) | 511 (30.691) | 93 (30.000) | |
| Gender, n(%) | ||||
| Female | 1407 (71.241) | 1256 (75.435) | 151 (48.710) | <0.001 |
| Male | 568 (28.759) | 409 (24.565) | 159 (51.290) | |
| Recurrance, n(%) | ||||
| No | 1905 (96.456) | 1635 (98.198) | 270 (87.097) | |
| Yes | 70 (3.544) | 30 (1.802) | 40 (12.903) | |
| Boundary, n(%) | ||||
| Clear | 1751 (88.658) | 1493 (89.670) | 258 (83.226) | 0.001 |
| Unclear | 224 (11.342) | 172 (10.330) | 52 (16.774) | |
| Shape, n (%) | ||||
| Regular | 1243 (62.937) | 1107 (66.486) | 136 (43.871) | <0.001 |
| Irregular | 732 (37.063) | 558 (33.514) | 174 (56.129) | |
| Location, n (%) | ||||
| Supratentorial | 383 (19.392) | 348 (20.901) | 35 (11.290) | |
| Cerebellum and tentorium | 1217 (61.620) | 981 (58.919) | 236 (76.129) | |
| Skull base | 295 (14.937) | 269 (16.156) | 26 (8.387) | |
| Ventricle | 80 (4.051) | 67 (4.024) | 13 (4.194) | |
| T1, n (%) | ||||
| Low | 361 (18.278) | 239 (14.354) | 122 (39.355) | |
| Medium | 533 (26.987) | 454 (27.267) | 79 (25.484) | |
| High | 1059 (53.620) | 952 (57.177) | 107 (34.516) | |
| Mixed | 22 (1.114) | 20 (1.201) | 2 (0.645) | |
| T2, n (%) | ||||
| Low | 593 (30.025) | 436 (26.186) | 157 (50.645) | |
| Medium | 145 (7.342) | 129 (7.748) | 16 (5.161) | |
| High | 605 (30.633) | 540 (32.432) | 65 (20.968) | |
| Mixed | 632 (32.000) | 560 (33.634) | 72 (23.226) | |
| Flair, n (%) | ||||
| Low | 599 (30.329) | 446 (26.787) | 153 (49.355) | |
| Medium | 191 (9.671) | 160 (9.610) | 31 (10.000) | |
| High | 534 (27.038) | 479 (28.769) | 55 (17.742) | |
| Mixed | 651 (32.962) | 580 (34.835) | 71 (22.903) | |
| Enhancement, n (%) | ||||
| Yes | 1231 (62.329) | 1115 (66.967) | 116 (37.419) | |
| No | 744 (37.671) | 550 (33.033) | 194 (62.581) | |
| HBG, n (%) | ||||
| Normal | 1532 (77.570) | 1313 (78.859) | 219 (70.645) | 0.001 |
| Abnormal | 443 (22.430) | 352 (21.141) | 91 (29.355) | |
| PLT, n (%) | ||||
| Normal | 1700 (86.076) | 1437 (86.306) | 263 (84.839) | 0.493 |
| Abnormal | 275 (13.924) | 228 (13.694) | 47 (15.161) | |
| WBC, n (%) | ||||
| Normal | 1747 (88.456) | 1490 (89.489) | 257 (82.903) | <0.001 |
| Abnormal | 228 (11.544) | 175 (10.511) | 53 (17.097) | |
| NEUT, n (%) | ||||
| Normal | 1705 (86.329) | 1460 (87.688) | 245 (79.032) | |
| Abnormal | 270 (13.671) | 205 (12.312) | 65 (20.968) | |
| LYM, n (%) | ||||
| Normal | 1667 (84.405) | 1425 (85.586) | 242 (78.065) | |
| Abnormal | 308 (15.595) | 240 (14.414) | 68 (21.935) | |
| MO, n (%) | ||||
| Normal | 1750 (88.608) | 1492 (89.610) | 258 (83.226) | 0.001 |
| Abnormal | 225 (11.392) | 173 (10.390) | 52 (16.774) | |
| EO, n (%) | ||||
| Normal | 1679 (85.013) | 1436 (86.246) | 243 (78.387) | <0.001 |
| Abnormal | 296 (14.987) | 229 (13.754) | 67 (21.613) | |
| BAS, n (%) | ||||
| Normal | 1918 (97.114) | 1624 (97.538) | 294 (94.839) | 0.009 |
| Abnormal | 57 (2.886) | 41 (2.462) | 16 (5.161) | |
| Blood Type | ||||
| O | 666 (33.722) | 564 (33.874) | 102 (32.903) | 0.47 |
| A | 641 (32.456) | 529 (31.772) | 112 (36.129) | |
| B | 495 (25.063) | 423 (25.405) | 72 (23.226) | |
| AB | 173 (8.759) | 149 (8.949) | 24 (7.742) | |
| Sull Invasion, n (%) | ||||
| NO | 1654 (83.747) | 1415 (84.985) | 239 (77.097) | <0.001 |
| YES | 321 (16.253) | 250 (15.015) | 71 (22.903) | |
| Cystic, n (%) | ||||
| NO | 1785 (90.380) | 1544 (92.733) | 241 (77.742) | |
| YES | 190 (9.620) | 121 (7.267) | 69 (22.258) | |
| DTs ,n (%) | ||||
| NO | 426 (21.570) | 351 (21.081) | 75 (24.194) | 0.221 |
| YES | 1549 (78.430) | 1314 (78.919) | 235 (75.806) | |
| AGR, median [IQR] | 1.594 [1.439,1.776] | 1.598 [1.446,1.774] | 1.557 [1.410,1.779] | 0.063 |
| LMR, median [IQR] | 5.063 [3.833,6.697] | 5.172 [3.918,6.783] | 4.649 [3.286,6.077] | <0.001 |
| PLR, median [IQR] | 105.882 [79.755,139.091] | 103.349 [79.359,136.567] | 115.169 [82.386,156.571] | |
| NLR, median [IQR] | 2.117 [1.620,3.010] | 2.067 [1.571,2.891] | 2.484 [1.886,4.236] | |
| edema, mean (±SD) | 11.718 ± 15.877 | 9.674 ± 14.411 | 21.113 ± 18.674 | |
| size, mean (±SD) | 43.943 ± 18.070 | 41.289 ± 16.792 | 56.003 ± 18.747 | |
| Dataset | Model Performance | Method | |||||
|---|---|---|---|---|---|---|---|
| Logistic | XGBoost | RandomForest | AdaBoost | SVM | KNN | ||
| Train | AUC (SD) | 0.812 (0.009) | 1.000 (0.000) | 1.000 (0.000) | 0.855 (0.007) | 0.675 (0.007) | 0.884 (0.006) |
| Accuracy (SD) | 0.777 (0.016) | 0.996 (0.001) | 0.997 (0.001) | 0.775 (0.020) | 0.803 (0.010) | 0.841 (0.006) | |
| Recall (SD) | 0.679 (0.043) | 0.998 (0.003) | 0.997 (0.003) | 0.774 (0.026) | 0.559 (0.031) | 1.000 (0.000) | |
| F1 (SD) | 0.485 (0.008) | 0.991 (0.005) | 0.997 (0.001) | 0.524 (0.012) | 0.470 (0.018) | 0.667 (0.009) | |
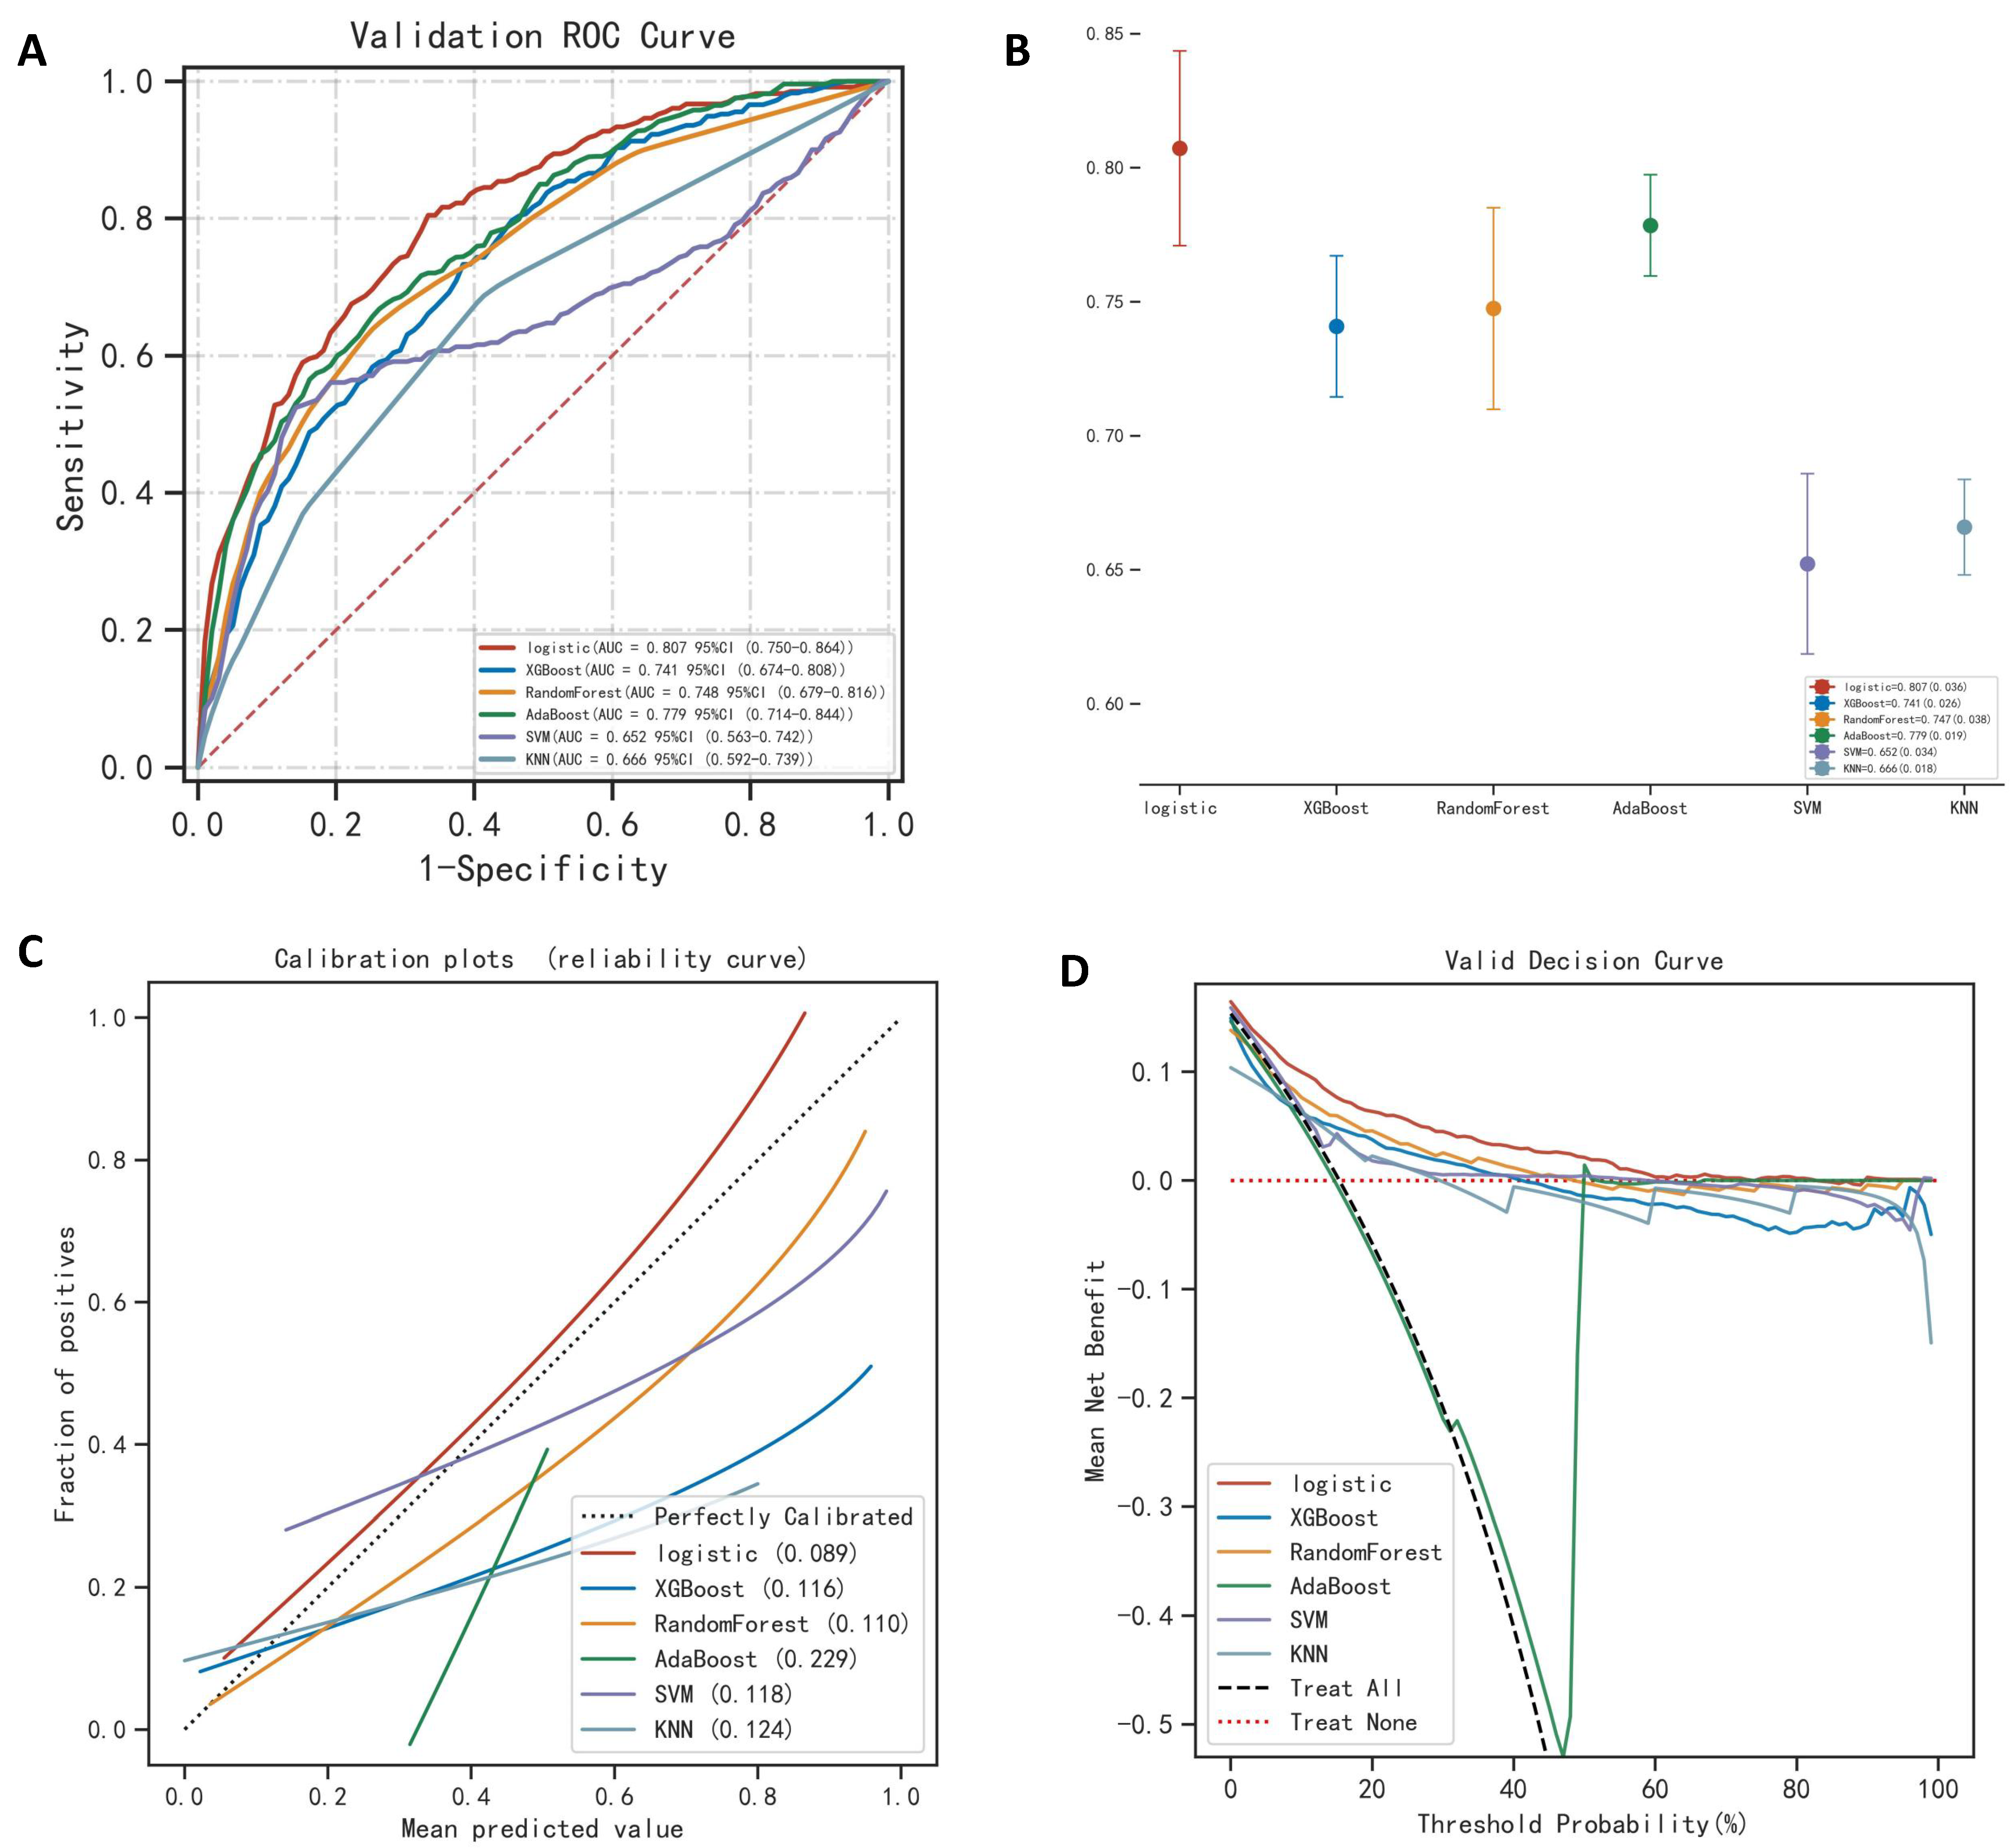
| Validation | AUC (SD) | 0.807 (0.036) | 0.741 (0.026) | 0.748 (0.038) | 0.779 (0.019) | 0.652 (0.034) | 0.666 (0.018) |
| Precision (SD) | 0.774 (0.036) | 0.815 (0.009) | 0.842 (0.014) | 0.740 (0.010) | 0.773 (0.014) | 0.775 (0.011) | |
| Recall (SD) | 0.804 (0.077) | 0.690 (0.095) | 0.642 (0.084) | 0.694 (0.078) | 0.542 (0.076) | 0.646 (0.128) | |
| F1 (SD) | 0.525 (0.061) | 0.493 (0.049) | 0.549 (0.051) | 0.430 (0.019) | 0.430 (0.034) | 0.402 (0.046) | |
Disclaimer/Publisher’s Note: The statements, opinions and data contained in all publications are solely those of the individual author(s) and contributor(s) and not of MDPI and/or the editor(s). MDPI and/or the editor(s) disclaim responsibility for any injury to people or property resulting from any ideas, methods, instructions or products referred to in the content. |
© 2023 by the authors. Licensee MDPI, Basel, Switzerland. This article is an open access article distributed under the terms and conditions of the Creative Commons Attribution (CC BY) license (https://creativecommons.org/licenses/by/4.0/).
Share and Cite
Teng, H.; Yang, X.; Liu, Z.; Liu, H.; Yan, O.; Jie, D.; Li, X.; Xu, J. The Performance of Different Machine Learning Algorithm and Regression Models in Predicting High-Grade Intracranial Meningioma. Brain Sci. 2023, 13, 594. https://doi.org/10.3390/brainsci13040594
Teng H, Yang X, Liu Z, Liu H, Yan O, Jie D, Li X, Xu J. The Performance of Different Machine Learning Algorithm and Regression Models in Predicting High-Grade Intracranial Meningioma. Brain Sciences. 2023; 13(4):594. https://doi.org/10.3390/brainsci13040594
Chicago/Turabian StyleTeng, Haibo, Xiang Yang, Zhiyong Liu, Hao Liu, Ouying Yan, Danyang Jie, Xueying Li, and Jianguo Xu. 2023. "The Performance of Different Machine Learning Algorithm and Regression Models in Predicting High-Grade Intracranial Meningioma" Brain Sciences 13, no. 4: 594. https://doi.org/10.3390/brainsci13040594