

Emotion Classification Based on Transformer and CNN for EEG Spatial–Temporal Feature Learning
Abstract
1. Introduction
2. Materials and Methods
2.1. Datasets
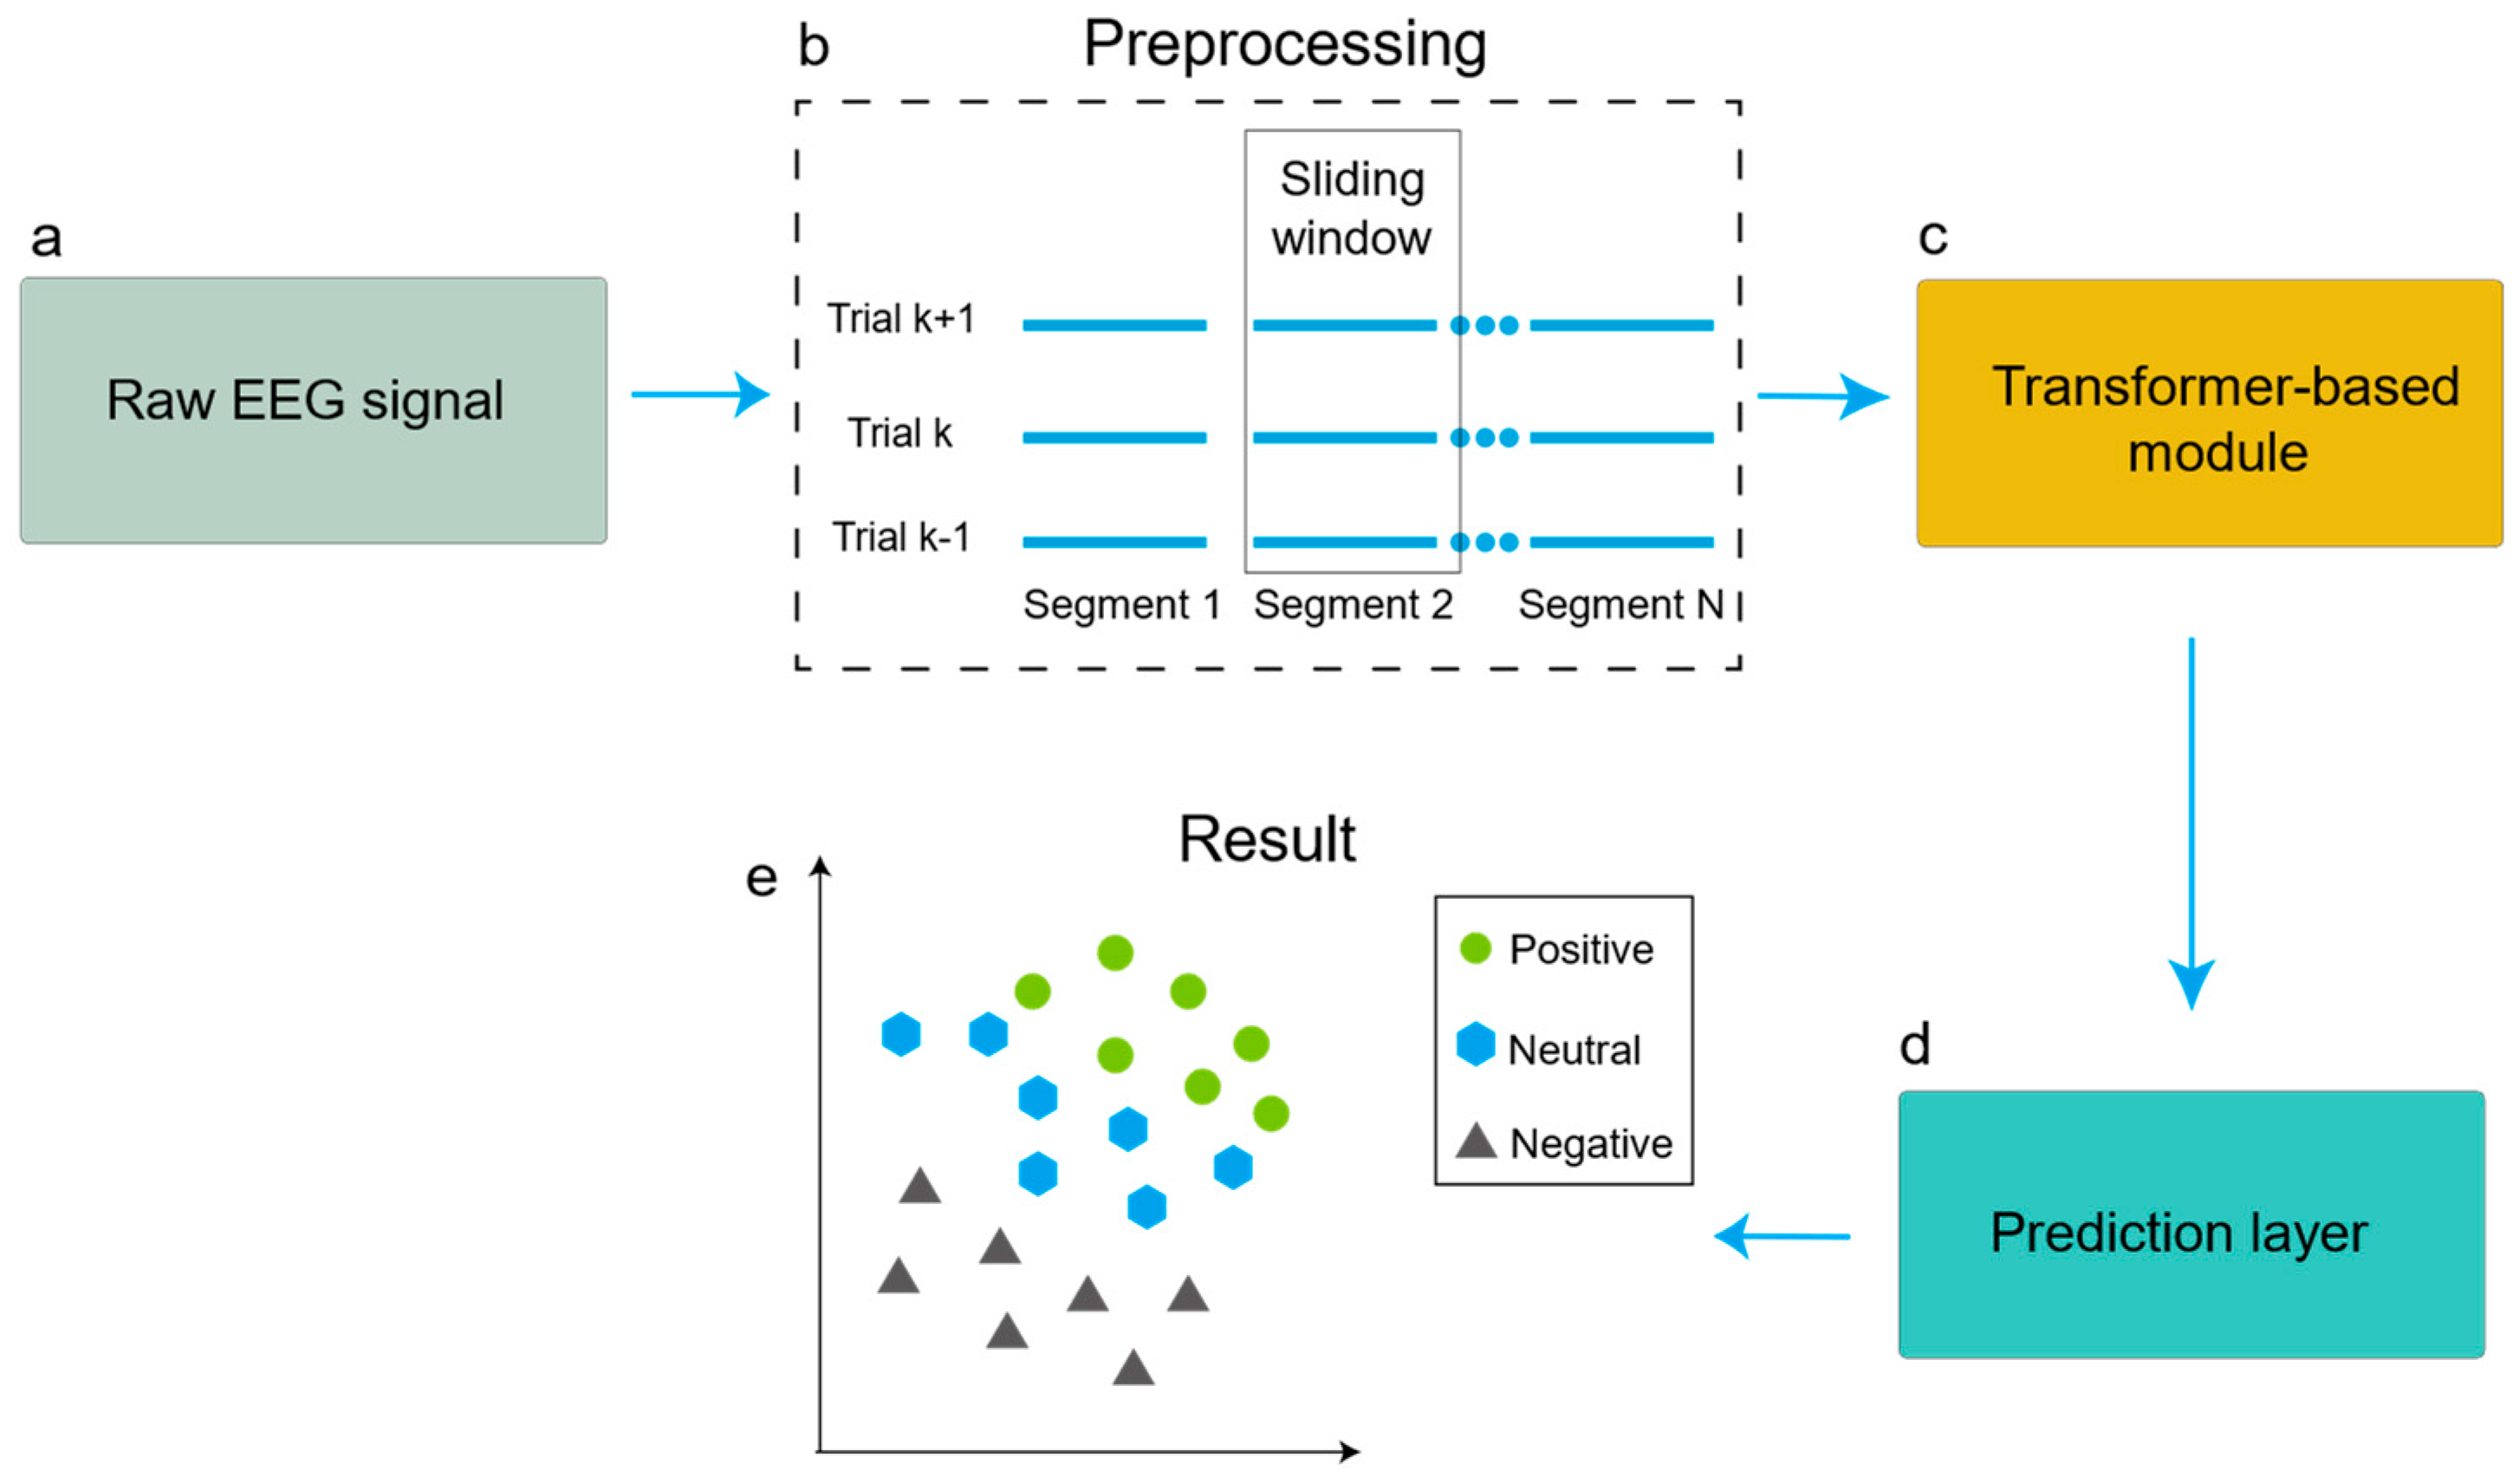
2.2. Preprocessing
2.3. Experimental Platform
2.4. Experimental Procedures
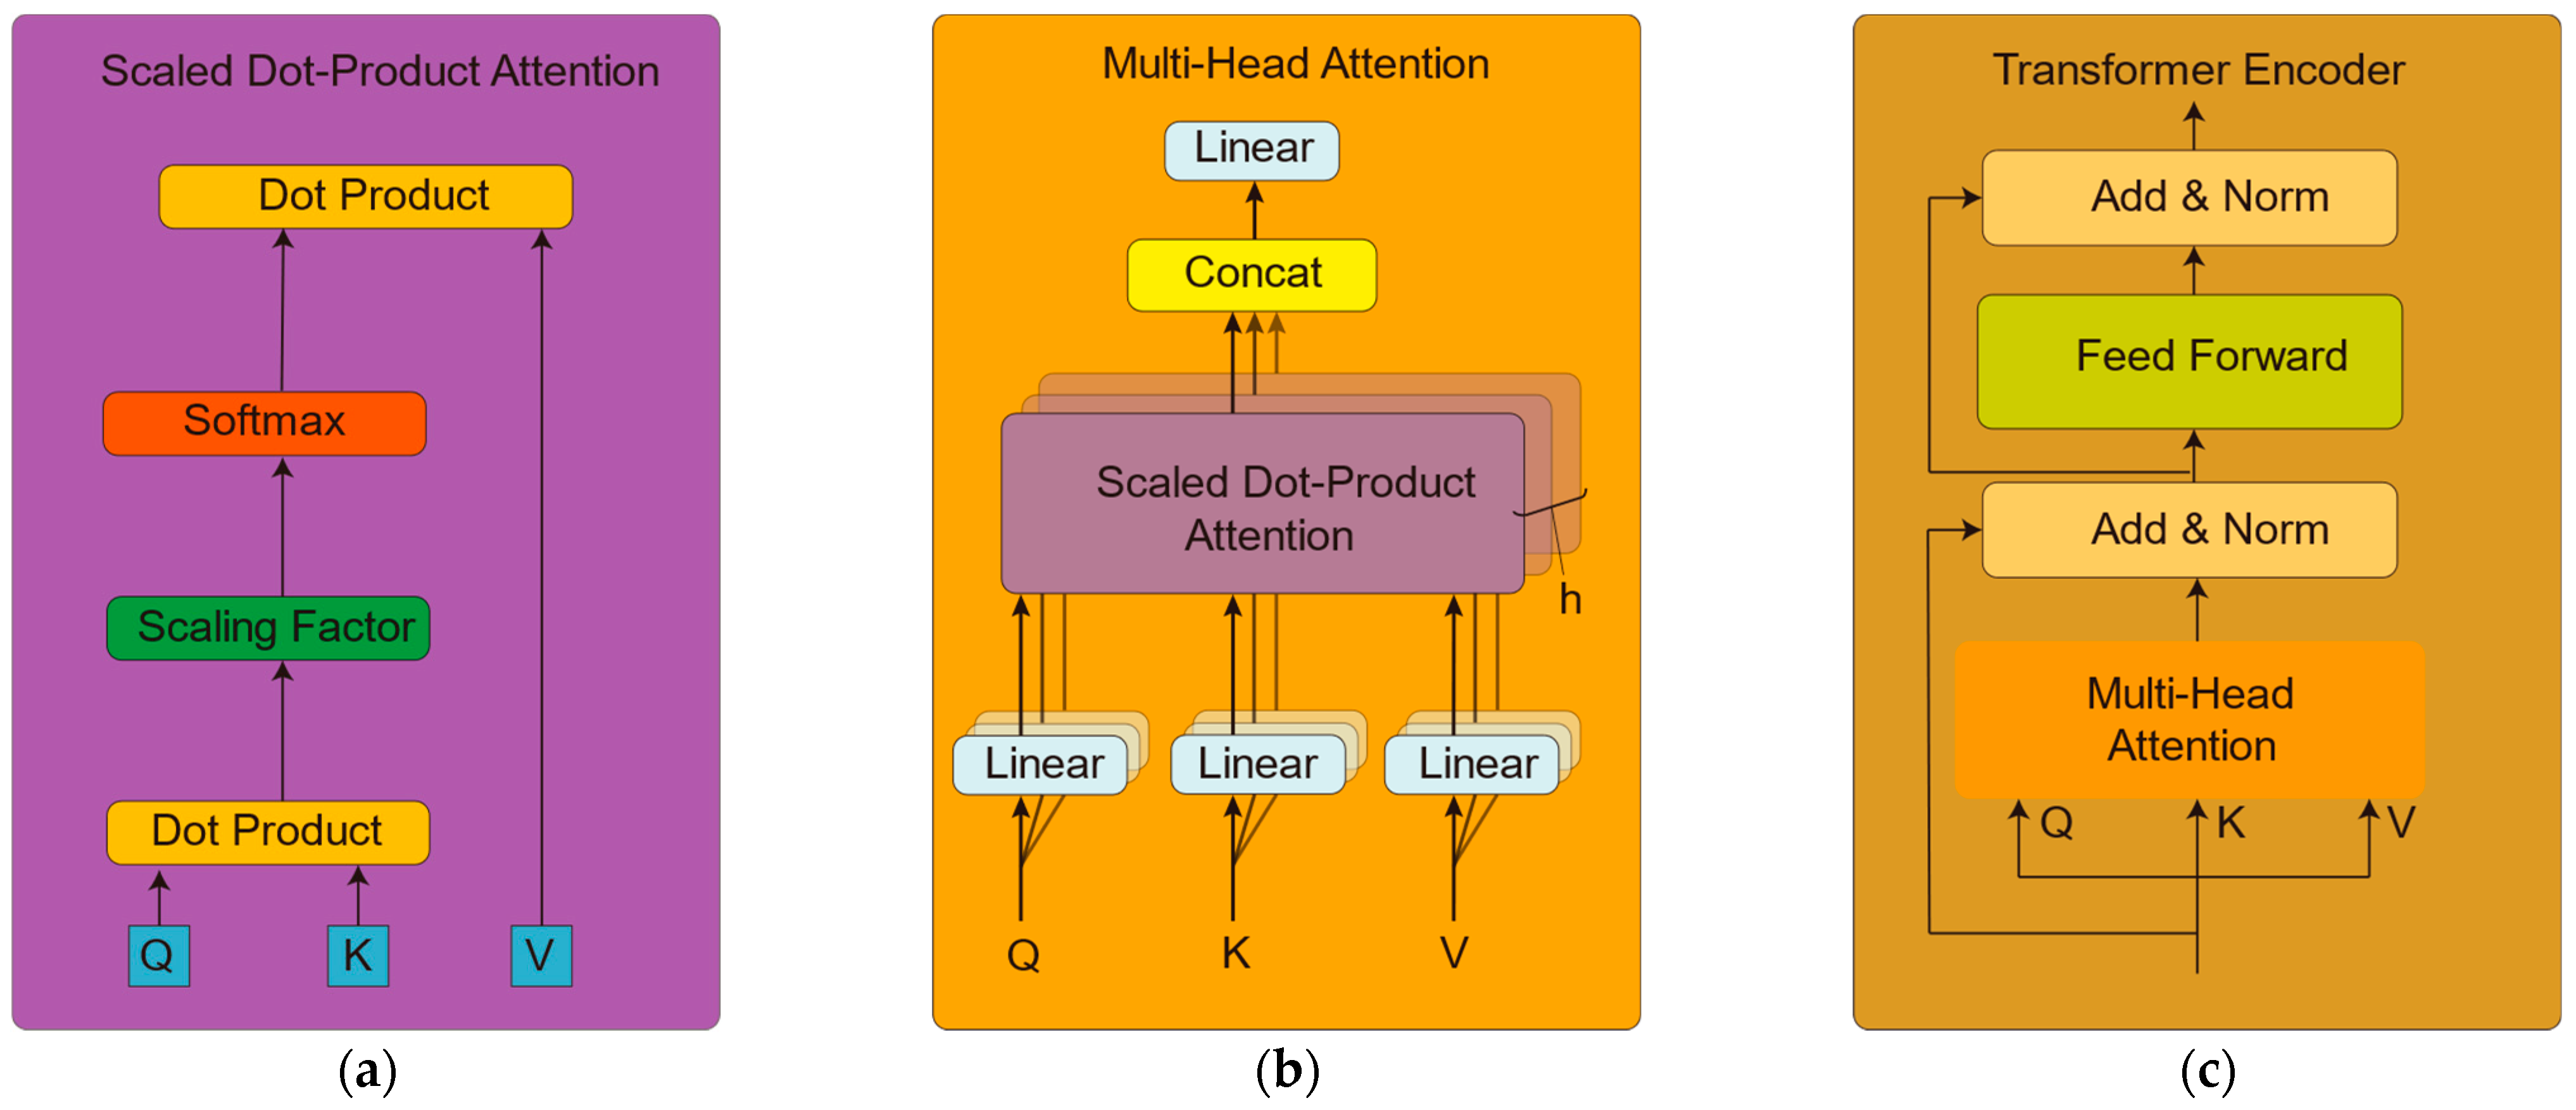
2.5. Transformer Encoder
2.5.1. Scaled Dot-Product Attention
2.5.2. Multi-Head Attention
2.5.3. Transformer Encoder
2.6. Transformer and CNN Models for Learning Emotion-Related EEG Temporal and Spatial Features
2.7. Model Training Strategy and Process
2.8. Evaluation Metrics
3. Results
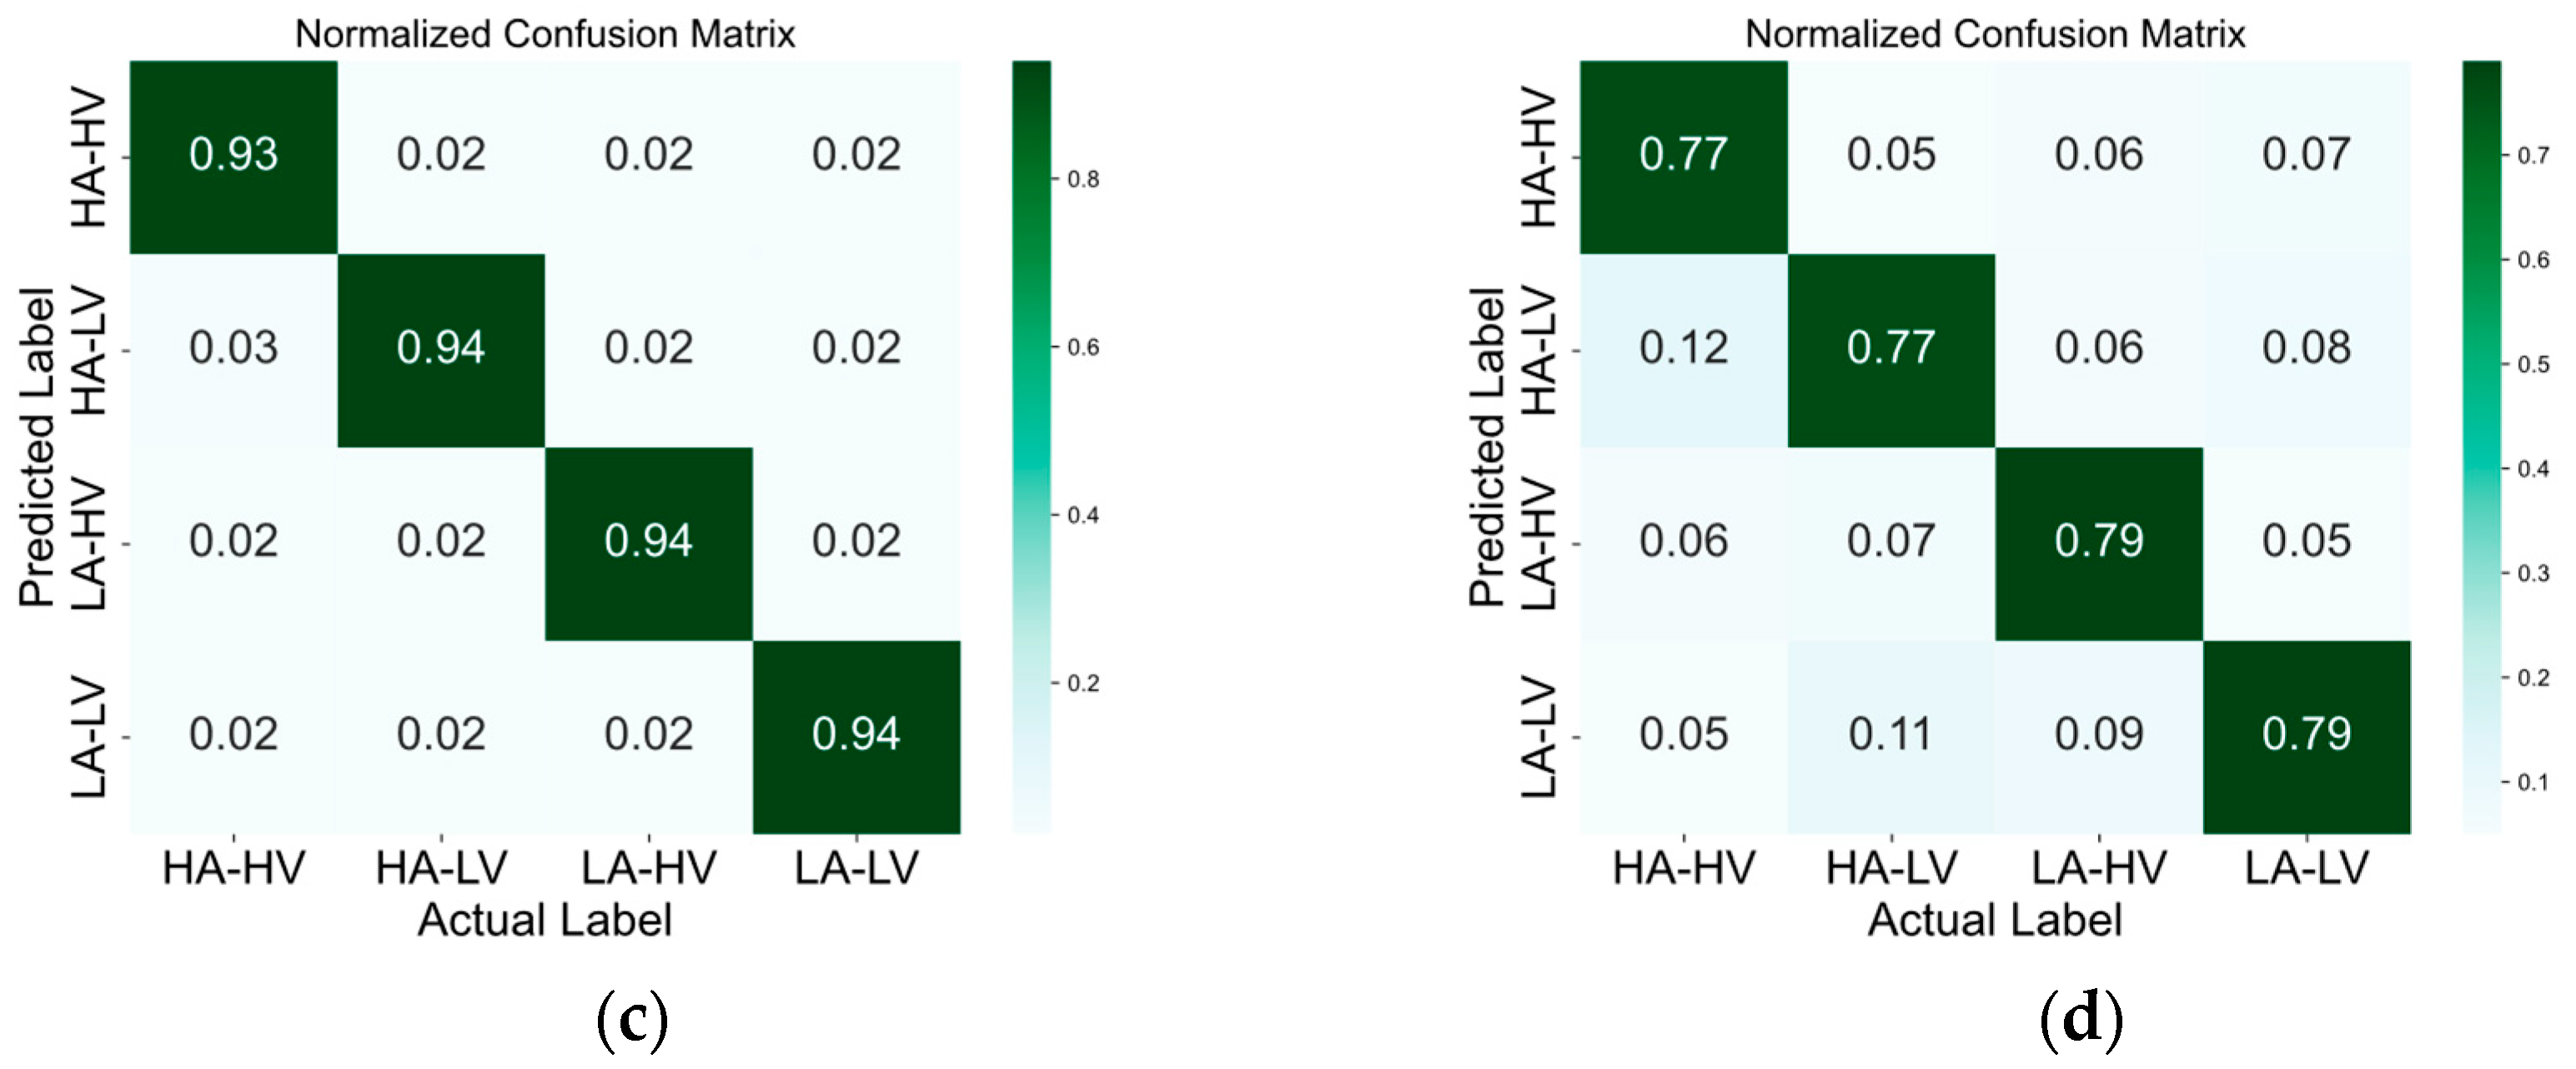
3.1. Classification Performance
3.2. Comparison of the Results Obtained Using Other Methods
4. Discussion
5. Conclusions
Author Contributions
Funding
Institutional Review Board Statement
Informed Consent Statement
Data Availability Statement
Conflicts of Interest
References
- Jerritta, S.; Murugappan, M.; Nagarajan, R.; Wan, K. Physiological signals based human emotion recognition: A review. In Proceedings of the 2011 IEEE 7th International Colloquium on Signal Processing and Its Applications, Penang, Malaysia, 4–6 March 2011; IEEE: Piscataway, NJ, USA, 2011; pp. 410–415. [Google Scholar]
- Shen, F.; Dai, G.; Lin, G.; Zhang, J.; Kong, W.; Zeng, H. EEG-based emotion recognition using 4D convolutional recurrent neural network. Cogn. Neurodyn. 2020, 14, 815–828. [Google Scholar] [CrossRef] [PubMed]
- Yan, J.; Zheng, W.; Xu, Q.; Lu, G.; Li, H.; Wang, B. Sparse kernel reduced-rank regression for bimodal emotion recognition from facial expression and speech. IEEE Trans. Multimed. 2016, 18, 1319–1329. [Google Scholar] [CrossRef]
- Zheng, W.L.; Zhu, J.Y.; Lu, B.L. Identifying stable patterns over time for emotion recognition from EEG. IEEE Trans. Affect. Comput. 2017, 10, 417–429. [Google Scholar] [CrossRef]
- Cai, Y.; Li, X.; Li, J. Emotion Recognition Using Different Sensors, Emotion Models, Methods and Datasets: A Comprehensive Review. Sensors 2023, 23, 2455. [Google Scholar] [CrossRef] [PubMed]
- Nunez, P.L.; Srinivasan, R. Electric Fields of the Brain: The Neurophysics of EEG; Oxford University Press: New York, NJ, USA, 2006. [Google Scholar]
- Suhaimi, N.S.; Mountstephens, J.; Teo, J. EEG-based emotion recognition: A state-of-the-art review of current trends and opportunities. Comput. Intell. Neurosci. 2020, 2020, 8875426. [Google Scholar] [CrossRef] [PubMed]
- Bhardwaj, A.; Gupta, A.; Jain, P.; Rani, A.; Yadav, J. Classification of human emotions from EEG signals using SVM and LDA Classifiers. In Proceedings of the 2015 2nd International Conference on Signal Processing and Integrated Networks (SPIN), Noida, India, 19–20 February 2015; IEEE: Piscataway, NJ, USA, 2015; pp. 180–185. [Google Scholar]
- Wang, X.W.; Nie, D.; Lu, B.L. EEG-based emotion recognition using frequency domain features and support vector machines. In Proceedings of the Neural Information Processing: 18th International Conference, ICONIP 2011, Shanghai, China, 13–17 November 2011; Proceedings, Part I 18. Springer: Berlin/Heidelberg, Germany, 2011; pp. 734–743. [Google Scholar]
- Xiao, G.; Shi, M.; Ye, M.; Xu, B.; Chen, Z.; Ren, Q. 4D attention-based neural network for EEG emotion recognition. Cogn. Neurodyn. 2022, 16, 805–818. [Google Scholar] [CrossRef] [PubMed]
- Koelstra, S.; Muhl, C.; Soleymani, M.; Lee, J.-S.; Yazdani, A.; Ebrahimi, T.; Pun, T.; Nijholt, A.; Patras, I. Deap: A database for emotion analysis; using physiological signals. IEEE Trans. Affect. Comput. 2011, 3, 18–31. [Google Scholar] [CrossRef]
- Zheng, W.L.; Lu, B.L. Investigating critical frequency bands and channels for EEG-based emotion recognition with deep neural networks. IEEE Trans. Auton. Ment. Dev. 2015, 7, 162–175. [Google Scholar] [CrossRef]
- An, Y.; Hu, S.; Duan, X.; Zhao, L.; Xie, C.; Zhao, Y. Electroencephalogram emotion recognition based on 3D feature fusion and convolutional autoencoder. Front. Comput. Neurosci. 2021, 15, 743426. [Google Scholar] [CrossRef] [PubMed]
- Vaswani, A.; Shazeer, N.; Parmar, N.; Uszkoreit, J.; Jones, L.; Gomez, A.N.; Kaiser, L.; Polosukhin, I. Attention is all you need. arXiv 2017, arXiv:1706.03762. [Google Scholar]
- Raffel, C.; Shazeer, N.; Roberts, A.; Lee, K.; Narang, S.; Matena, M.; Zhou, Y.; Li, W.; Liu, P.J. Exploring the limits of transfer learning with a unified text-to-text transformer. J. Mach. Learn. Res. 2020, 21, 5485–5551. [Google Scholar]
- Dosovitskiy, A.; Beyer, L.; Kolesnikov, A.; Weissenborn, D.; Zhai, X.; Unterthiner, T.; Dehghani, M.; Winther, J.B. An Image is Worth 16 × 16 Words: Transformers for Image Recognition at Scale. arXiv 2020, arXiv:2010.11929. [Google Scholar]
- Duan, R.N.; Zhu, J.Y.; Lu, B.L. Differential entropy feature for EEG-based emotion classification. In Proceedings of the 2013 6th International IEEE/EMBS Conference on Neural Engineering (NER), San Diego, CA, USA, 6–8 November 2013; IEEE: Piscataway, NJ, USA, 2013; pp. 81–84. [Google Scholar]
- Lashgari, E.; Liang, D.; Maoz, U. Data augmentation for deep-learning-based electroencephalography. J. Neurosci. Methods 2020, 346, 108885. [Google Scholar] [CrossRef] [PubMed]
- Li, Y.; Huang, J.; Zhou, H.; Zhong, N. Human emotion recognition with electroencephalographic multidimensional features by hybrid deep neural networks. Appl. Sci. 2017, 7, 1060. [Google Scholar] [CrossRef]
- Liu, S.; Zhao, Y.; An, Y.; Zhao, J.; Wang, S.H.; Yan, J. GLFANet: A global to local feature aggregation network for EEG emotion recognition. Biomed. Signal Process. Control. 2023, 85, 104799. [Google Scholar] [CrossRef]
- Zheng, F.; Hu, B.; Zheng, X.; Zhang, Y. Spatial–temporal features-based EEG emotion recognition using graph convolution network and long short-term memory. Physiol. Meas. 2023, 44, 065002. [Google Scholar] [CrossRef] [PubMed]
- Liu, J.; Wu, G.; Luo, Y.; Qiu, S.; Yang, S.; Li, W.; Bi, Y. EEG-based emotion classification using a deep neural network and sparse autoencoder. Front. Syst. Neurosci. 2020, 14, 43. [Google Scholar] [CrossRef] [PubMed]
- Yang, Y.; Wu, Q.; Fu, Y.; Chen, X. Continuous convolutional neural network with 3D input for EEG-based emotion recognition. In Proceedings of the Neural Information Processing: 25th International Conference, ICONIP 2018, Siem Reap, Cambodia, 13–16 December 2018; Proceedings, Part VII 25. Springer International Publishing: Berlin/Heidelberg, Germany, 2018; pp. 433–443. [Google Scholar]
- Wu, K.; Peng, H.; Chen, M.; Fu, J.; Chao, H. Rethinking and improving relative position encoding for vision transformer. In Proceedings of the IEEE/CVF International Conference on Computer Vision, Montreal, QC, Canada, 10–17 October 2021; pp. 10033–10041. [Google Scholar]
- Sun, Y.; Ayaz, H.; Akansu, A.N. Neural correlates of affective context in facial expression analysis: A simultaneous EEG-fNIRS study. In Proceedings of the 2015 IEEE Global Conference on Signal and Information Processing (GlobalSIP), Orlando, FL, USA, 14–16 December 2015; IEEE: Piscataway, NJ, USA, 2015; pp. 820–824. [Google Scholar]


| Dimension | Model | Acc/% | Variance |
|---|---|---|---|
| Positive–neutral–negative | EEG ST-TCNN | 96.67 | 2.88 |
| EEG ST-T | 95.98 | 3.11 | |
| EEG S-T | 84.29 | 5.66 | |
| EEG T-T | 85.27 | 3.71 | |
| Arousal–valence | EEG ST-TCNN | 95.73 | 5.40 |
| EEG ST-T | 93.80 | 6.19 | |
| EEG S-T | 75.97 | 5.66 | |
| EEG T-T | 78.03 | 6.35 | |
| Arousal | EEG ST-TCNN | 96.95 | 2.04 |
| EEG ST-T | 96.17 | 3.42 | |
| EEG S-T | 82.93 | 4.27 | |
| EEG T-T | 87.65 | 2.25 | |
| Valence | EEG ST-TCNN | 96.34 | 3.02 |
| EEG ST-T | 94.44 | 3.46 | |
| EEG S-T | 77.22 | 5.26 | |
| EEG T-T | 83.40 | 5.00 |
| Dimension | Comparison | t-Value | p-Value |
|---|---|---|---|
| Positive–neutral–negative | EEG ST-TCNN vs. EEG ST-T | 2.07 | 0.045 |
| EEG ST-TCNN vs. EEG S-T | 17.54 | <0.001 | |
| EEG ST-TCNN vs. EEG T-T | 17.19 | <0.001 | |
| EEG ST-T vs. EEG S-T | 16.47 | <0.001 | |
| EEG ST-T vs. EEG T-T | 15.87 | <0.001 | |
| EEG S-T vs. EEG T-T | −1.22 | 0.232 | |
| Arousal–valence | EEG ST-TCNN vs. EEG ST-T | 2.18 | 0.036 |
| EEG ST-TCNN vs. EEG S-T | 21.22 | <0.001 | |
| EEG ST-TCNN vs. EEG T-T | 19.56 | <0.001 | |
| EEG ST-T vs. EEG S-T | 20.65 | <0.001 | |
| EEG ST-T vs. EEG T-T | 18.89 | <0.001 | |
| EEG S-T vs. EEG T-T | −2.03 | 0.049 | |
| Arousal | EEG ST-TCNN vs. EEG ST-T | 2.01 | 0.053 |
| EEG ST-TCNN vs. EEG S-T | 17.51 | <0.001 | |
| EEG ST-TCNN vs. EEG T-T | 17.13 | <0.001 | |
| EEG ST-T vs. EEG S-T | 17.67 | <0.001 | |
| EEG ST-T vs. EEG T-T | 14.18 | <0.001 | |
| EEG S-T vs. EEG T-T | −5.84 | <0.001 | |
| Valence | EEG ST-TCNN vs. EEG ST-T | 2.09 | 0.044 |
| EEG ST-TCNN vs. EEG S-T | 22.20 | <0.001 | |
| EEG ST-TCNN vs. EEG T-T | 17.66 | <0.001 | |
| EEG ST-T vs. EEG S-T | 19.65 | <0.001 | |
| EEG ST-T vs. EEG T-T | 15.42 | <0.001 | |
| EEG S-T vs. EEG T-T | −7.28 | <0.001 |
| Model | Acc/% | P/% | R/% | F1-Score/% |
|---|---|---|---|---|
| EEG ST-TCNN | 96.67 | 96.70 | 96.64 | 96.67 |
| EEG ST-T | 95.98 | 95.64 | 95.54 | 95.59 |
| EEG S-T | 84.29 | 84.26 | 84.25 | 84.25 |
| EEG T-T | 85.27 | 85.27 | 85.24 | 85.25 |
| Method | Acc/% | P/% | R/% | F1-Score/% |
|---|---|---|---|---|
| EEG ST-TCNN | 95.73 | 95.72 | 95.72 | 95.72 |
| EEG ST-T | 93.80 | 93.80 | 93.78 | 93.79 |
| EEG S-T | 75.97 | 76.07 | 75.97 | 76.02 |
| EEG T-T | 78.03 | 78.15 | 78.03 | 78.09 |
| Method | Acc/% | P/% | R/% | F1-Score/% |
|---|---|---|---|---|
| EEG ST-TCNN | 96.95 | 96.95 | 96.91 | 96.95 |
| EEG ST-T | 96.17 | 96.17 | 96.17 | 96.17 |
| EEG S-T | 82.93 | 82.94 | 82.93 | 82.94 |
| EEG T-T | 87.65 | 87.69 | 87.65 | 87.67 |
| Method | Acc/% | P/% | R/% | F1-Score/% |
|---|---|---|---|---|
| EEG ST-TCNN | 96.34 | 96.36 | 96.33 | 96.34 |
| EEG ST-T | 94.44 | 94.44 | 94.45 | 94.44 |
| EEG S-T | 77.22 | 77.21 | 77.22 | 77.22 |
| EEG T-T | 83.40 | 83.40 | 83.41 | 83.41 |
| References | Methods | Features | P-N-N | A-V | A | V |
|---|---|---|---|---|---|---|
| Shen et al. [2] | 4D-CRNN | DE | 94.74 | - | 94.58 | 94.22 |
| Liu et al. [20] | GLFANet | DE | - | 92.92 | 94.91 | 94.53 |
| Zheng et al. [21] | CNN-SAE-DNN | DE | 94.92 | - | 90.33 | 90.67 |
| Liu et al. [22] | GCN + LSTM | spatial–temporal features | 96.77 | - | 92.86 | 89.49 |
| Yang et al. [23] | Continuous CNN | DE | - | 85.30 | 90.24 | 89.45 |
| Ours | EEG ST-TCNN | Raw EEG | 96.67 | 95.73 | 96.95 | 96.34 |
Disclaimer/Publisher’s Note: The statements, opinions and data contained in all publications are solely those of the individual author(s) and contributor(s) and not of MDPI and/or the editor(s). MDPI and/or the editor(s) disclaim responsibility for any injury to people or property resulting from any ideas, methods, instructions or products referred to in the content. |
© 2024 by the authors. Licensee MDPI, Basel, Switzerland. This article is an open access article distributed under the terms and conditions of the Creative Commons Attribution (CC BY) license (https://creativecommons.org/licenses/by/4.0/).
Share and Cite
Yao, X.; Li, T.; Ding, P.; Wang, F.; Zhao, L.; Gong, A.; Nan, W.; Fu, Y. Emotion Classification Based on Transformer and CNN for EEG Spatial–Temporal Feature Learning. Brain Sci. 2024, 14, 268. https://doi.org/10.3390/brainsci14030268
Yao X, Li T, Ding P, Wang F, Zhao L, Gong A, Nan W, Fu Y. Emotion Classification Based on Transformer and CNN for EEG Spatial–Temporal Feature Learning. Brain Sciences. 2024; 14(3):268. https://doi.org/10.3390/brainsci14030268
Chicago/Turabian StyleYao, Xiuzhen, Tianwen Li, Peng Ding, Fan Wang, Lei Zhao, Anmin Gong, Wenya Nan, and Yunfa Fu. 2024. "Emotion Classification Based on Transformer and CNN for EEG Spatial–Temporal Feature Learning" Brain Sciences 14, no. 3: 268. https://doi.org/10.3390/brainsci14030268
APA StyleYao, X., Li, T., Ding, P., Wang, F., Zhao, L., Gong, A., Nan, W., & Fu, Y. (2024). Emotion Classification Based on Transformer and CNN for EEG Spatial–Temporal Feature Learning. Brain Sciences, 14(3), 268. https://doi.org/10.3390/brainsci14030268