
Neurofilaments Light Chain in Neurodegenerative Dementias: A Review of Imaging Correlates


Abstract
:1. Introduction
2. Methods
2.1. Search Strategy
2.2. Inclusion and Exclusion Criteria
3. Results
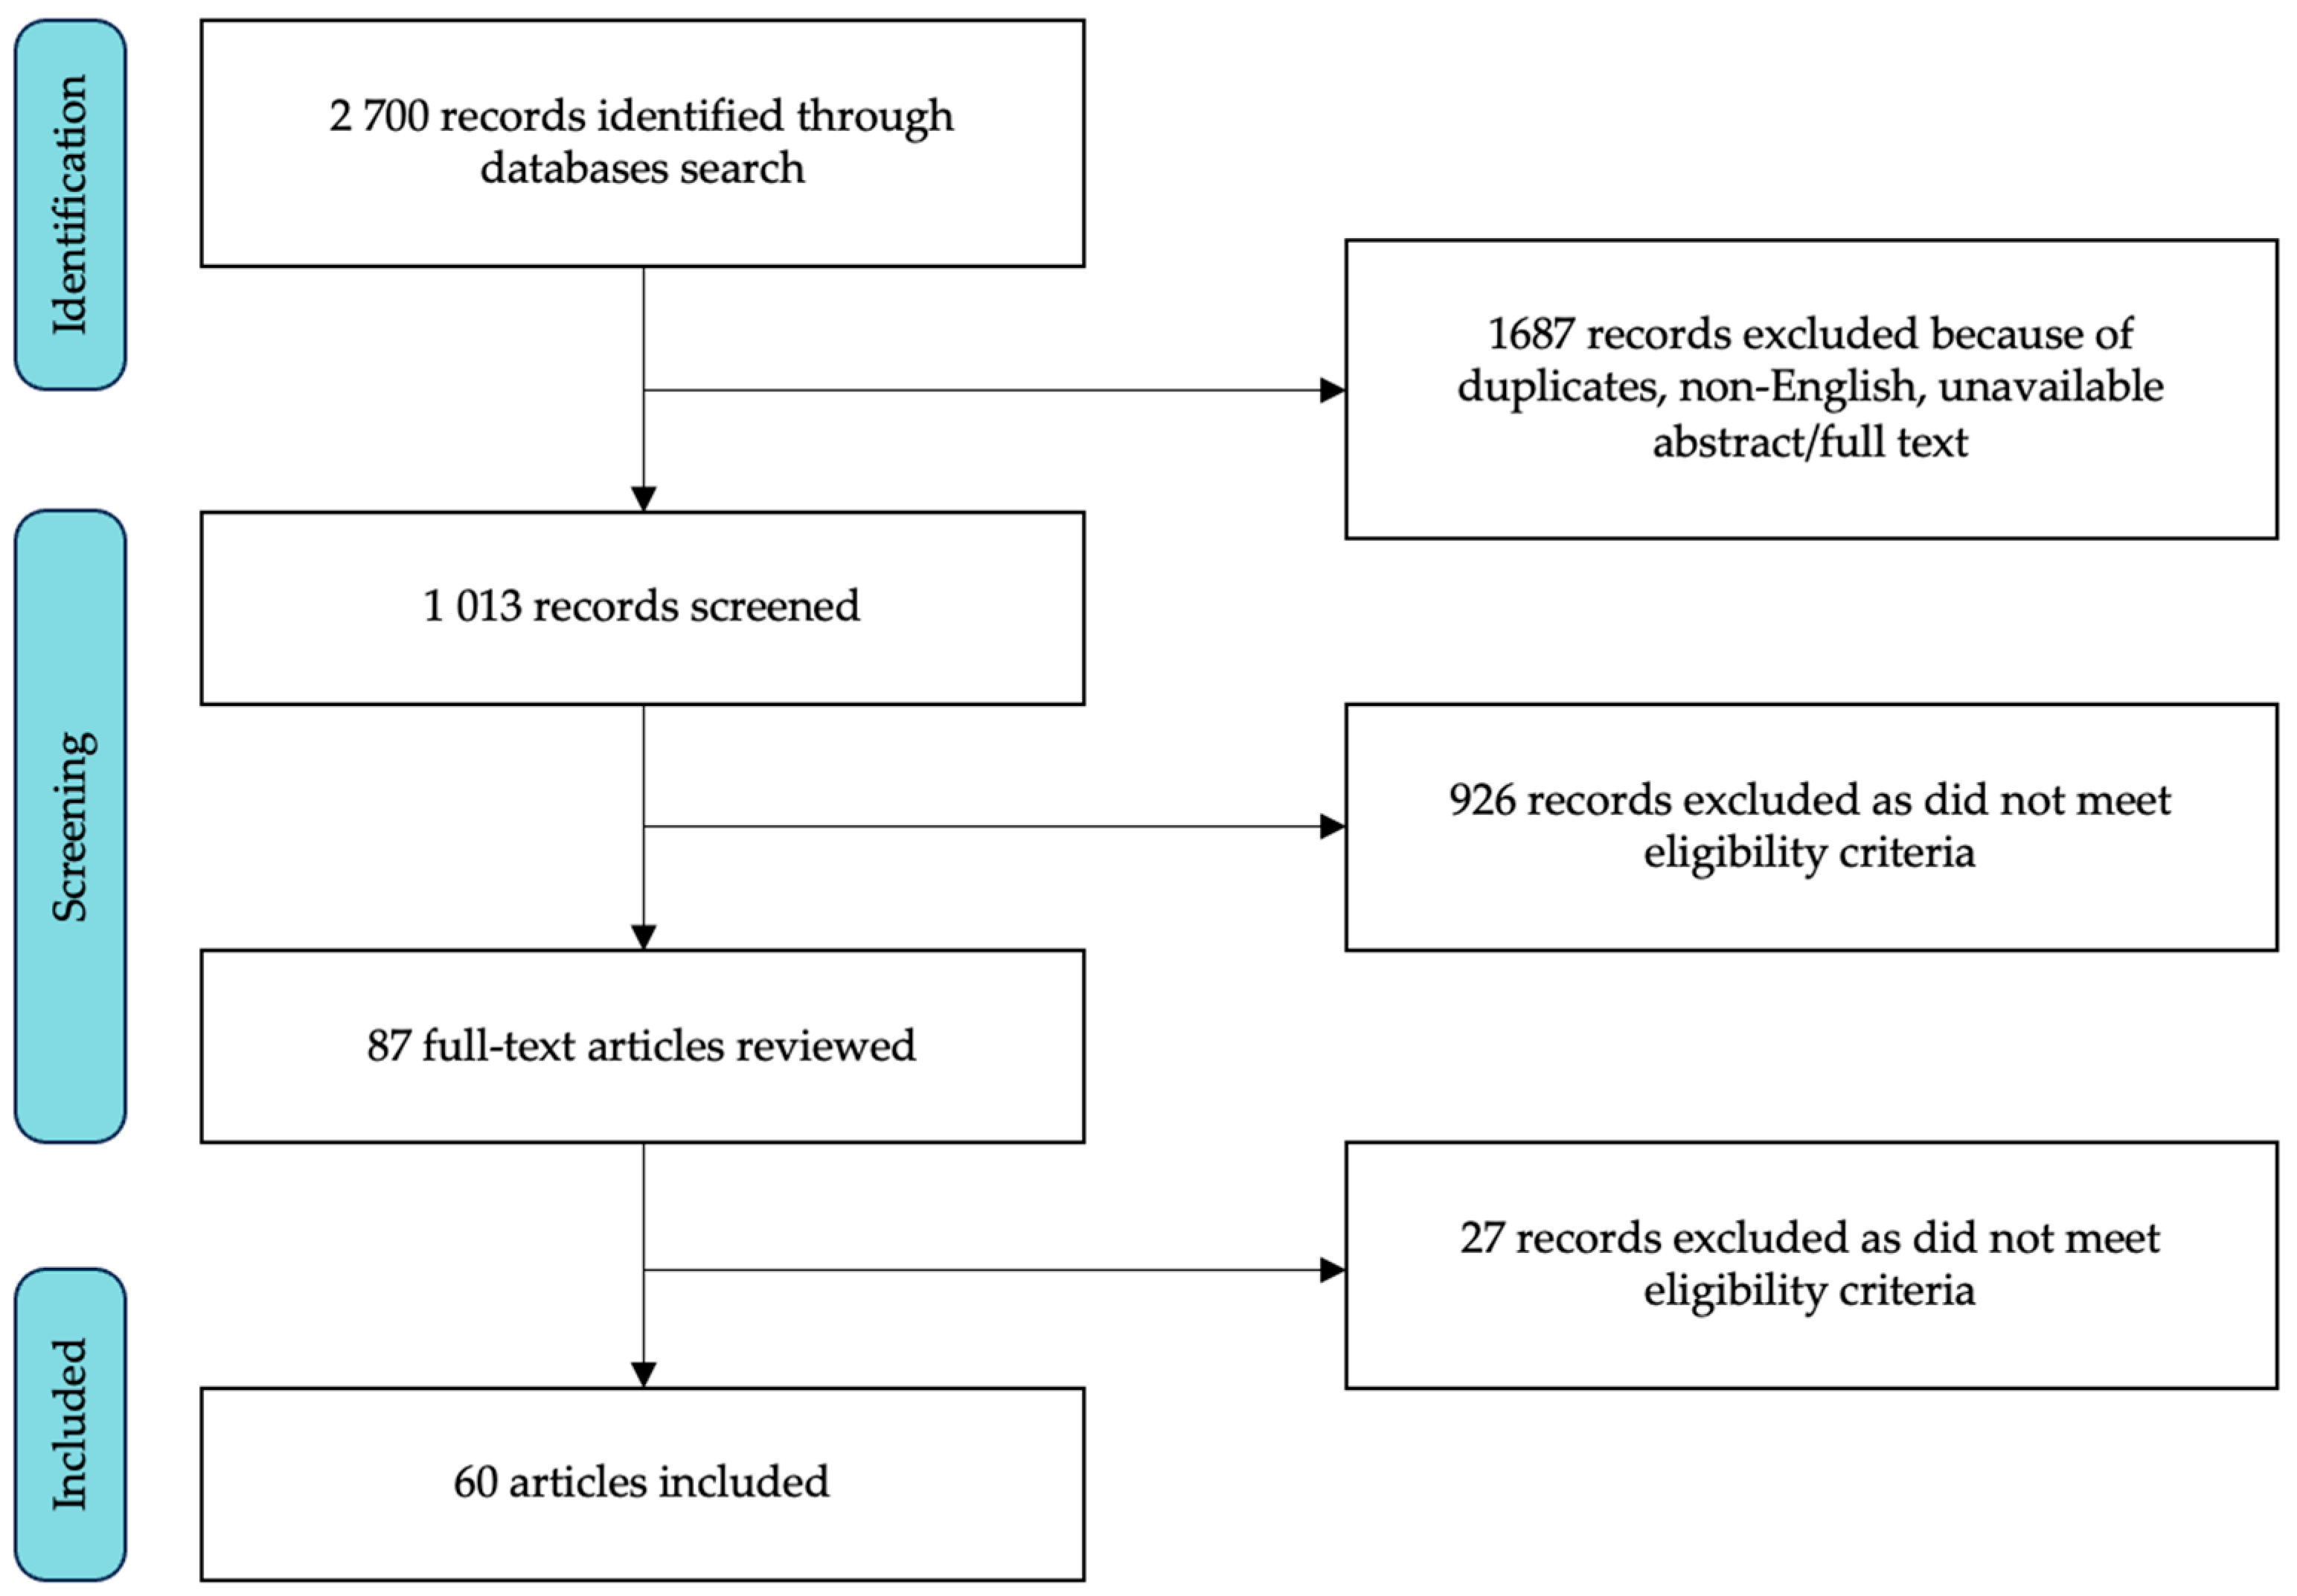
3.1. Study Selection and Characteristics
3.2. Alzheimer’s Disease
3.3. Frontotemporal Dementia Spectrum
3.4. Mild Cognitive Impairment and Subjective Cognitive Decline
3.5. Lewy Body Dementia
4. Discussion
5. Conclusions
Author Contributions
Funding
Data Availability Statement
Conflicts of Interest
References
- Yuan, A.; Rao, M.V.; Veeranna; Nixon, R.A. Neurofilaments and Neurofilament Proteins in Health and Disease. Cold Spring Harb. Perspect. Biol. 2017, 9, a018309. [Google Scholar] [CrossRef]
- Coppens, S.; Lehmann, S.; Hopley, C.; Hirtz, C. Neurofilament-Light, a Promising Biomarker: Analytical, Metrological and Clinical Challenges. Int. J. Mol. Sci. 2023, 24, 11624. [Google Scholar] [CrossRef]
- Gaetani, L.; Blennow, K.; Calabresi, P.; Di Filippo, M.; Parnetti, L.; Zetterberg, H. Neurofilament Light Chain as a Biomarker in Neurological Disorders. J. Neurol. Neurosurg. Psychiatry 2019, 90, 870–881. [Google Scholar] [CrossRef]
- Barro, C.; Chitnis, T.; Weiner, H.L. Blood Neurofilament Light: A Critical Review of Its Application to Neurologic Disease. Ann. Clin. Transl. Neurol. 2020, 7, 2508–2523. [Google Scholar] [CrossRef]
- Disanto, G.; Barro, C.; Benkert, P.; Naegelin, Y.; Schädelin, S.; Giardiello, A.; Zecca, C.; Blennow, K.; Zetterberg, H.; Leppert, D.; et al. Serum Neurofilament Light: A Biomarker of Neuronal Damage in Multiple Sclerosis. Ann. Neurol. 2017, 81, 857–870. [Google Scholar] [CrossRef]
- Alagaratnam, J.; von Widekind, S.; De Francesco, D.; Underwood, J.; Edison, P.; Winston, A.; Zetterberg, H.; Fidler, S. Correlation between CSF and Blood Neurofilament Light Chain Protein: A Systematic Review and Meta-Analysis. BMJ Neurol. Open 2021, 3, e000143. [Google Scholar] [CrossRef] [PubMed]
- Vermunt, L.; Otte, M.; Verberk, I.M.W.; Killestein, J.; Lemstra, A.W.; van der Flier, W.M.; Pijnenburg, Y.A.L.; Vijverberg, E.G.B.; Bouwman, F.H.; Gravesteijn, G.; et al. Age- and Disease-Specific Reference Values for Neurofilament Light Presented in an Online Interactive Support Interface. Ann. Clin. Transl. Neurol. 2022, 9, 1832–1837. [Google Scholar] [CrossRef] [PubMed]
- Khalil, M.; Teunissen, C.E.; Otto, M.; Piehl, F.; Sormani, M.P.; Gattringer, T.; Barro, C.; Kappos, L.; Comabella, M.; Fazekas, F.; et al. Neurofilaments as Biomarkers in Neurological Disorders. Nat. Rev. Neurol. 2018, 14, 577–589. [Google Scholar] [CrossRef] [PubMed]
- Mattsson, N.; Andreasson, U.; Zetterberg, H.; Blennow, K.; for the Alzheimer’s Disease Neuroimaging Initiative. Association of Plasma Neurofilament Light with Neurodegeneration in Patients with Alzheimer Disease. JAMA Neurol. 2017, 74, 557. [Google Scholar] [CrossRef] [PubMed]
- Del Prete, E.; Beatino, M.F.; Campese, N.; Giampietri, L.; Siciliano, G.; Ceravolo, R.; Baldacci, F. Fluid Candidate Biomarkers for Alzheimer’s Disease: A Precision Medicine Approach. J. Pers. Med. 2020, 10, 221. [Google Scholar] [CrossRef] [PubMed]
- Kern, S.; Syrjanen, J.A.; Blennow, K.; Zetterberg, H.; Skoog, I.; Waern, M.; Hagen, C.E.; van Harten, A.C.; Knopman, D.S.; Jack, C.R., Jr.; et al. Association of Cerebrospinal Fluid Neurofilament Light Protein with Risk of Mild Cognitive Impairment among Individuals without Cognitive Impairment. JAMA Neurol. 2019, 76, 187–193. [Google Scholar] [CrossRef]
- Preische, O.; Schultz, S.A.; Apel, A.; Kuhle, J.; Kaeser, S.A.; Barro, C.; Gräber, S.; Kuder-Buletta, E.; LaFougere, C.; Laske, C.; et al. Serum Neurofilament Dynamics Predicts Neurodegeneration and Clinical Progression in Presymptomatic Alzheimer’s Disease. Nat. Med. 2019, 25, 277–283. [Google Scholar] [CrossRef] [PubMed]
- Verde, F.; Otto, M.; Silani, V. Neurofilament Light Chain as Biomarker for Amyotrophic Lateral Sclerosis and Frontotemporal Dementia. Front. Neurosci. 2021, 15, 679199. [Google Scholar] [CrossRef] [PubMed]
- Rosengren, L.E.; Karlsson, J.E.; Sjögren, M.; Blennow, K.; Wallin, A. Neurofilament Protein Levels in CSF Are Increased in Dementia. Neurology 1999, 52, 1090–1093. [Google Scholar] [CrossRef] [PubMed]
- Sjögren, M.; Rosengren, L.; Minthon, L.; Davidsson, P.; Blennow, K.; Wallin, A. Cytoskeleton Proteins in CSF Distinguish Frontotemporal Dementia from AD. Neurology 2000, 54, 1960–1964. [Google Scholar] [CrossRef] [PubMed]
- Pijnenburg, Y.A.L.; Janssen, J.C.; Schoonenboom, N.S.M.; Petzold, A.; Mulder, C.; Stigbrand, T.; Norgren, N.; Heijst, H.; Hack, C.E.; Scheltens, P.; et al. CSF Neurofilaments in Frontotemporal Dementia Compared with Early Onset Alzheimer’s Disease and Controls. Dement. Geriatr. Cogn. Disord. 2007, 23, 225–230. [Google Scholar] [CrossRef]
- Landqvist Waldö, M.; Frizell Santillo, A.; Passant, U.; Zetterberg, H.; Rosengren, L.; Nilsson, C.; Englund, E. Cerebrospinal Fluid Neurofilament Light Chain Protein Levels in Subtypes of Frontotemporal Dementia. BMC Neurol. 2013, 13, 54. [Google Scholar] [CrossRef]
- Scherling, C.S.; Hall, T.; Berisha, F.; Klepac, K.; Karydas, A.; Coppola, G.; Kramer, J.H.; Rabinovici, G.; Ahlijanian, M.; Miller, B.L.; et al. Cerebrospinal Fluid Neurofilament Concentration Reflects Disease Severity in Frontotemporal Degeneration. Ann. Neurol. 2014, 75, 116–126. [Google Scholar] [CrossRef]
- Rohrer, J.D.; Woollacott, I.O.C.; Dick, K.M.; Brotherhood, E.; Gordon, E.; Fellows, A.; Toombs, J.; Druyeh, R.; Cardoso, M.J.; Ourselin, S.; et al. Serum Neurofilament Light Chain Protein Is a Measure of Disease Intensity in Frontotemporal Dementia. Neurology 2016, 87, 1329–1336. [Google Scholar] [CrossRef]
- Van der Ende, E.L.; Meeter, L.H.; Poos, J.M.; Panman, J.L.; Jiskoot, L.C.; Dopper, E.G.P.; Papma, J.M.; de Jong, F.J.; Verberk, I.M.W.; Teunissen, C.; et al. Serum Neurofilament Light Chain in Genetic Frontotemporal Dementia: A Longitudinal, Multicentre Cohort Study. Lancet Neurol. 2019, 18, 1103–1111. [Google Scholar] [CrossRef]
- Karantali, E.; Kazis, D.; Chatzikonstantinou, S.; Petridis, F.; Mavroudis, I. The Role of Neurofilament Light Chain in Frontotemporal Dementia: A Meta-Analysis. Aging Clin. Exp. Res. 2021, 33, 869–881. [Google Scholar] [CrossRef]
- Zhao, Y.; Xin, Y.; Meng, S.; He, Z.; Hu, W. Neurofilament Light Chain Protein in Neurodegenerative Dementia: A Systematic Review and Network Meta-Analysis. Neurosci. Biobehav. Rev. 2019, 102, 123–138. [Google Scholar] [CrossRef]
- Eratne, D.; Loi, S.M.; Walia, N.; Farrand, S.; Li, Q.-X.; Varghese, S.; Walterfang, M.; Evans, A.; Mocellin, R.; Dhiman, K.; et al. A Pilot Study of the Utility of Cerebrospinal Fluid Neurofilament Light Chain in Differentiating Neurodegenerative from Psychiatric Disorders: A “C-Reactive Protein” for Psychiatrists and Neurologists? Aust. N. Z. J. Psychiatry 2020, 54, 57–67. [Google Scholar] [CrossRef]
- Vijverberg, E.G.B.; Dols, A.; Krudop, W.A.; Del Campo Milan, M.; Kerssens, C.J.; Gossink, F.; Prins, N.D.; Stek, M.L.; Scheltens, P.; Teunissen, C.E.; et al. Cerebrospinal Fluid Biomarker Examination as a Tool to Discriminate Behavioral Variant Frontotemporal Dementia from Primary Psychiatric Disorders. Alzheimer’s Dement. 2017, 7, 99–106. [Google Scholar] [CrossRef] [PubMed]
- Fourier, A.; Formaglio, M.; Kaczorowski, F.; Mollion, H.; Perret-Liaudet, A.; Sauvee, M.; Quadrio, I. A Combination of Total Tau and Neurofilaments Discriminates between Neurodegenerative and Primary Psychiatric Disorders. Eur. J. Neurol. 2020, 27, 1164–1169. [Google Scholar] [CrossRef]
- Al Shweiki, M.R.; Steinacker, P.; Oeckl, P.; Hengerer, B.; Danek, A.; Fassbender, K.; Diehl-Schmid, J.; Jahn, H.; Anderl-Straub, S.; Ludolph, A.C.; et al. Neurofilament Light Chain as a Blood Biomarker to Differentiate Psychiatric Disorders from Behavioural Variant Frontotemporal Dementia. J. Psychiatr. Res. 2019, 113, 137–140. [Google Scholar] [CrossRef]
- Katisko, K.; Cajanus, A.; Jääskeläinen, O.; Kontkanen, A.; Hartikainen, P.; Korhonen, V.E.; Helisalmi, S.; Haapasalo, A.; Koivumaa-Honkanen, H.; Herukka, S.-K.; et al. Serum Neurofilament Light Chain Is a Discriminative Biomarker between Frontotemporal Lobar Degeneration and Primary Psychiatric Disorders. J. Neurol. 2020, 267, 162–167. [Google Scholar] [CrossRef] [PubMed]
- Ducharme, S.; Dols, A.; Laforce, R.; Devenney, E.; Kumfor, F.; van den Stock, J.; Dallaire-Théroux, C.; Seelaar, H.; Gossink, F.; Vijverberg, E.; et al. Recommendations to Distinguish Behavioural Variant Frontotemporal Dementia from Psychiatric Disorders. Brain 2020, 143, 1632–1650. [Google Scholar] [CrossRef] [PubMed]
- Pilotto, A.; Imarisio, A.; Carrarini, C.; Russo, M.; Masciocchi, S.; Gipponi, S.; Cottini, E.; Aarsland, D.; Zetterberg, H.; Ashton, N.J.; et al. Plasma Neurofilament Light Chain Predicts Cognitive Progression in Prodromal and Clinical Dementia with Lewy Bodies. J. Alzheimer’s Dis. 2021, 82, 913–919. [Google Scholar] [CrossRef] [PubMed]
- Sako, W.; Murakami, N.; Izumi, Y.; Kaji, R. Neurofilament Light Chain Level in Cerebrospinal Fluid Can Differentiate Parkinson’s Disease from Atypical Parkinsonism: Evidence from a Meta-Analysis. J. Neurol. Sci. 2015, 352, 84–87. [Google Scholar] [CrossRef]
- Zetterberg, H.; Teunissen, C.; van Swieten, J.; Kuhle, J.; Boxer, A.; Rohrer, J.D.; Mitic, L.; Nicholson, A.M.; Pearlman, R.; McCaughey, S.M.; et al. The Role of Neurofilament Light in Genetic Frontotemporal Lobar Degeneration. Brain Commun. 2022, 5, fcac310. [Google Scholar] [CrossRef] [PubMed]
- Asken, B.M.; VandeVrede, L.; Rojas, J.C.; Fonseca, C.; Staffaroni, A.M.; Elahi, F.M.; Lindbergh, C.A.; Apple, A.C.; You, M.; Weiner-Light, S.; et al. Lower White Matter Volume and Worse Executive Functioning Reflected in Higher Levels of Plasma GFAP among Older Adults with and without Cognitive Impairment. J. Int. Neuropsychol. Soc. 2022, 28, 588–599. [Google Scholar] [CrossRef] [PubMed]
- Benedet, A.L.; Leuzy, A.; Pascoal, T.A.; Ashton, N.J.; Mathotaarachchi, S.; Savard, M.; Therriault, J.; Kang, M.S.; Chamoun, M.; Schöll, M.; et al. Stage-Specific Links between Plasma Neurofilament Light and Imaging Biomarkers of Alzheimer’s Disease. Brain 2020, 143, 3793–3804. [Google Scholar] [CrossRef] [PubMed]
- Boerwinkle, A.H.; Wisch, J.K.; Chen, C.D.; Gordon, B.A.; Butt, O.H.; Schindler, S.E.; Sutphen, C.; Flores, S.; Dincer, A.; Benzinger, T.L.S.; et al. Temporal Correlation of CSF and Neuroimaging in the Amyloid-Tau-Neurodegeneration Model of Alzheimer Disease. Neurology 2021, 97, e76–e87. [Google Scholar] [CrossRef] [PubMed]
- Chen, Y.; Therriault, J.; Luo, J.; Ba, M.; Zhang, H.; Initiative, A.D.N. Neurofilament Light as a Biomarker of Axonal Degeneration in Patients with Mild Cognitive Impairment and Alzheimer’s Disease. J. Integr. Neurosci. 2021, 20, 861–870. [Google Scholar] [CrossRef] [PubMed]
- Chong, J.R.; Hilal, S.; Ashton, N.J.; Karikari, T.K.; Reilhac, A.; Vrooman, H.; Schöll, M.; Zetterberg, H.; Blennow, K.; Chen, C.P.; et al. Brain Atrophy and White Matter Hyperintensities Are Independently Associated with Plasma Neurofilament Light Chain in an Asian Cohort of Cognitively Impaired Patients with Concomitant Cerebral Small Vessel Disease. Alzheimer’s Dement. 2023, 15, e12396. [Google Scholar] [CrossRef] [PubMed]
- Contador, J.; Pérez-Millán, A.; Tort-Merino, A.; Balasa, M.; Falgàs, N.; Olives, J.; Castellví, M.; Borrego-Écija, S.; Bosch, B.; Fernández-Villullas, G.; et al. Longitudinal Brain Atrophy and CSF Biomarkers in Early-Onset Alzheimer’s Disease. NeuroImage Clin. 2021, 32, 102804. [Google Scholar] [CrossRef]
- Dhiman, K.; Gupta, V.B.; Villemagne, V.L.; Eratne, D.; Graham, P.L.; Fowler, C.; Bourgeat, P.; Li, Q.-X.; Collins, S.; Bush, A.I.; et al. Cerebrospinal Fluid Neurofilament Light Concentration Predicts Brain Atrophy and Cognition in Alzheimer’s Disease. Alzheimer’s Dement. 2020, 12, e12005. [Google Scholar] [CrossRef]
- Elahi, F.M.; Casaletto, K.B.; La Joie, R.; Walters, S.M.; Harvey, D.; Wolf, A.; Edwards, L.; Rivera-Contreras, W.; Karydas, A.; Cobigo, Y.; et al. Plasma Biomarkers of Astrocytic and Neuronal Dysfunction in Early- and Late-onset Alzheimer’s Disease. Alzheimer’s Dement. 2020, 16, 681–695. [Google Scholar] [CrossRef]
- Kang, M.S.; Aliaga, A.A.; Shin, M.; Mathotaarachchi, S.; Benedet, A.L.; Pascoal, T.A.; Therriault, J.; Chamoun, M.; Savard, M.; Devenyi, G.A.; et al. Amyloid-Beta Modulates the Association between Neurofilament Light Chain and Brain Atrophy in Alzheimer’s Disease. Mol. Psychiatry 2021, 26, 5989–6001. [Google Scholar] [CrossRef]
- Mao, C.; Sha, L.; Li, J.; Huang, X.; Chu, S.; Lei, D.; Wang, J.; Dong, L.; Liu, C.; Xu, Q.; et al. Relationship between General Cognition, Visual Assessed Cortical Atrophy, and Cerebrospinal Fluid Biomarkers in Alzheimer’s Disease: A Cross-Sectional Study from a Chinese PUMCH Cohort. J. Alzheimer’s Dis. 2021, 82, 205–214. [Google Scholar] [CrossRef]
- Mattsson, N.; Insel, P.S.; Palmqvist, S.; Portelius, E.; Zetterberg, H.; Weiner, M.; Blennow, K.; Hansson, O.; Alzheimer’s Disease Neuroimaging Initiative Cerebrospinal Fluid Tau. Neurogranin, and Neurofilament Light in Alzheimer’s Disease. EMBO Mol. Med. 2016, 8, 1184–1196. [Google Scholar] [CrossRef]
- Mattsson, N.; Cullen, N.C.; Andreasson, U.; Zetterberg, H.; Blennow, K. Association between Longitudinal Plasma Neurofilament Light and Neurodegeneration in Patients with Alzheimer Disease. JAMA Neurol. 2019, 76, 791–799. [Google Scholar] [CrossRef]
- Moscoso, A.; Grothe, M.J.; Ashton, N.J.; Karikari, T.K.; Lantero Rodríguez, J.; Snellman, A.; Suárez-Calvet, M.; Blennow, K.; Zetterberg, H.; Schöll, M.; et al. Longitudinal Associations of Blood Phosphorylated Tau181 and Neurofilament Light Chain with Neurodegeneration in Alzheimer Disease. JAMA Neurol. 2021, 78, 396–406. [Google Scholar] [CrossRef]
- Pereira, J.B.; Westman, E.; Hansson, O.; Alzheimer’s Disease Neuroimaging Initiative. Association between Cerebrospinal Fluid and Plasma Neurodegeneration Biomarkers with Brain Atrophy in Alzheimer’s Disease. Neurobiol. Aging 2017, 58, 14–29. [Google Scholar] [CrossRef]
- Rajan, K.B.; Aggarwal, N.T.; McAninch, E.A.; Weuve, J.; Barnes, L.L.; Wilson, R.S.; DeCarli, C.; Evans, D.A. Remote Blood Biomarkers of Longitudinal Cognitive Outcomes in a Population Study. Ann. Neurol. 2020, 88, 1065–1076. [Google Scholar] [CrossRef] [PubMed]
- Schultz, S.A.; Strain, J.F.; Adedokun, A.; Wang, Q.; Preische, O.; Kuhle, J.; Flores, S.; Keefe, S.; Dincer, A.; Ances, B.M.; et al. Serum Neurofilament Light Chain Levels Are Associated with White Matter Integrity in Autosomal Dominant Alzheimer’s Disease. Neurobiol. Dis. 2020, 142, 104960. [Google Scholar] [CrossRef] [PubMed]
- Shahid, S.S.; Wen, Q.; Risacher, S.L.; Farlow, M.R.; Unverzagt, F.W.; Apostolova, L.G.; Foroud, T.M.; Zetterberg, H.; Blennow, K.; Saykin, A.J.; et al. Hippocampal-Subfield Microstructures and Their Relation to Plasma Biomarkers in Alzheimer’s Disease. Brain 2022, 145, 2149–2160. [Google Scholar] [CrossRef] [PubMed]
- Simrén, J.; Leuzy, A.; Karikari, T.K.; Hye, A.; Benedet, A.L.; Lantero-Rodriguez, J.; Mattsson-Carlgren, N.; Schöll, M.; Mecocci, P.; Vellas, B.; et al. The Diagnostic and Prognostic Capabilities of Plasma Biomarkers in Alzheimer’s Disease. Alzheimer’s Dement. 2021, 17, 1145–1156. [Google Scholar] [CrossRef] [PubMed]
- Sjögren, M.; Blomberg, M.; Jonsson, M.; Wahlund, L.-O.; Edman, Å.; Lind, K.; Rosengren, L.; Blennow, K.; Wallin, A. Neurofilament Protein in Cerebrospinal Fluid: A Marker of White Matter Changes. J. Neurosci. Res. 2001, 66, 510–516. [Google Scholar] [CrossRef] [PubMed]
- Verberk, I.M.W.; Thijssen, E.; Koelewijn, J.; Mauroo, K.; Vanbrabant, J.; de Wilde, A.; Zwan, M.D.; Verfaillie, S.C.J.; Ossenkoppele, R.; Barkhof, F.; et al. Combination of Plasma Amyloid Beta(1-42/1-40) and Glial Fibrillary Acidic Protein Strongly Associates with Cerebral Amyloid Pathology. Alzheimer’s Res. Ther. 2020, 12, 118. [Google Scholar] [CrossRef]
- Walsh, P.; Sudre, C.H.; Fiford, C.M.; Ryan, N.S.; Lashley, T.; Frost, C.; Barnes, J.; ADNI Investigators. The Age-Dependent Associations of White Matter Hyperintensities and Neurofilament Light in Early- and Late-Stage Alzheimer’s Disease. Neurobiol. Aging 2021, 97, 10–17. [Google Scholar] [CrossRef]
- Weston, P.S.J.; Poole, T.; Ryan, N.S.; Nair, A.; Liang, Y.; Macpherson, K.; Druyeh, R.; Malone, I.B.; Ahsan, R.L.; Pemberton, H.; et al. Serum Neurofilament Light in Familial Alzheimer Disease: A Marker of Early Neurodegeneration. Neurology 2017, 89, 2167–2175. [Google Scholar] [CrossRef]
- Zetterberg, H.; Skillbäck, T.; Mattsson, N.; Trojanowski, J.Q.; Portelius, E.; Shaw, L.M.; Weiner, M.W.; Blennow, K.; for the Alzheimer’s Disease Neuroimaging Initiative. Association of Cerebrospinal Fluid Neurofilament Light Concentration with Alzheimer Disease Progression. JAMA Neurol. 2016, 73, 60. [Google Scholar] [CrossRef]
- Alcolea, D.; Vilaplana, E.; Suárez-Calvet, M.; Illán-Gala, I.; Blesa, R.; Clarimón, J.; Lladó, A.; Sánchez-Valle, R.; Molinuevo, J.L.; García-Ribas, G.; et al. CSF sAPPβ, YKL-40, and Neurofilament Light in Frontotemporal Lobar Degeneration. Neurology 2017, 89, 178–188. [Google Scholar] [CrossRef]
- Falgàs, N.; Ruiz-Peris, M.; Pérez-Millan, A.; Sala-Llonch, R.; Antonell, A.; Balasa, M.; Borrego-Écija, S.; Ramos-Campoy, O.; Augé, J.M.; Castellví, M.; et al. Contribution of CSF Biomarkers to Early-onset Alzheimer’s Disease and Frontotemporal Dementia Neuroimaging Signatures. Human Brain Mapp. 2020, 41, 2004–2013. [Google Scholar] [CrossRef]
- Illán-Gala, I.; Lleo, A.; Karydas, A.; Staffaroni, A.M.; Zetterberg, H.; Sivasankaran, R.; Grinberg, L.T.; Spina, S.; Kramer, J.H.; Ramos, E.M.; et al. Plasma Tau and Neurofilament Light in Frontotemporal Lobar Degeneration and Alzheimer Disease. Neurology 2021, 96, e671–e683. [Google Scholar] [CrossRef]
- Oeckl, P.; Anderl-Straub, S.; Danek, A.; Diehl-Schmid, J.; Fassbender, K.; Fliessbach, K.; Halbgebauer, S.; Huppertz, H.-J.; Jahn, H.; Kassubek, J.; et al. Relationship of Serum Beta-Synuclein with Blood Biomarkers and Brain Atrophy. Alzheimer’s Dement. 2023, 19, 1358–1371. [Google Scholar] [CrossRef]
- Benussi, A.; Karikari, T.K.; Ashton, N.; Gazzina, S.; Premi, E.; Benussi, L.; Ghidoni, R.; Rodriguez, J.L.; Emeršič, A.; Simrén, J.; et al. Diagnostic and Prognostic Value of Serum NfL and P-Tau181 in Frontotemporal Lobar Degeneration. J. Neurol. Neurosurg. Psychiatry 2020, 91, 960–967. [Google Scholar] [CrossRef]
- Cajanus, A.; Katisko, K.; Kontkanen, A.; Jääskeläinen, O.; Hartikainen, P.; Haapasalo, A.; Herukka, S.-K.; Vanninen, R.; Solje, E.; Hall, A.; et al. Serum Neurofilament Light Chain in FTLD: Association with C9orf72, Clinical Phenotype, and Prognosis. Ann. Clin. Transl. Neurol. 2020, 7, 903–910. [Google Scholar] [CrossRef]
- Illán-Gala, I.; Alcolea, D.; Montal, V.; Dols-Icardo, O.; Muñoz, L.; de Luna, N.; Turón-Sans, J.; Cortés-Vicente, E.; Sánchez-Saudinós, M.B.; Subirana, A.; et al. CSF sAPPβ, YKL-40, and NfL along the ALS-FTD Spectrum. Neurology 2018, 91, e1619–e1628. [Google Scholar] [CrossRef]
- Illán-Gala, I.; Montal, V.; Borrego-Écija, S.; Vilaplana, E.; Pegueroles, J.; Alcolea, D.; Sánchez-Saudinós, B.; Clarimón, J.; Turón-Sans, J.; Bargalló, N.; et al. Cortical Microstructure in the Behavioural Variant of Frontotemporal Dementia: Looking beyond Atrophy. Brain 2019, 142, 1121–1133. [Google Scholar] [CrossRef]
- Ljubenkov, P.A.; Staffaroni, A.M.; Rojas, J.C.; Allen, I.E.; Wang, P.; Heuer, H.; Karydas, A.; Kornak, J.; Cobigo, Y.; Seeley, W.W.; et al. Cerebrospinal Fluid Biomarkers Predict Frontotemporal Dementia Trajectory. Ann. Clin. Transl. Neurol. 2018, 5, 1250–1263. [Google Scholar] [CrossRef]
- Meeter, L.H.; Dopper, E.G.; Jiskoot, L.C.; Sanchez-Valle, R.; Graff, C.; Benussi, L.; Ghidoni, R.; Pijnenburg, Y.A.; Borroni, B.; Galimberti, D.; et al. Neurofilament Light Chain: A Biomarker for Genetic Frontotemporal Dementia. Ann. Clin. Transl. Neurol. 2016, 3, 623–636. [Google Scholar] [CrossRef]
- Meeter, L.H.H.; Gendron, T.F.; Sias, A.C.; Jiskoot, L.C.; Russo, S.P.; Donker Kaat, L.; Papma, J.M.; Panman, J.L.; van der Ende, E.L.; Dopper, E.G.; et al. Poly(GP), Neurofilament and Grey Matter Deficits in C9orf72 Expansion Carriers. Ann. Clin. Transl. Neurol. 2018, 5, 583–597. [Google Scholar] [CrossRef]
- Meeter, L.H.H.; Steketee, R.M.E.; Salkovic, D.; Vos, M.E.; Grossman, M.; McMillan, C.T.; Irwin, D.J.; Boxer, A.L.; Rojas, J.C.; Olney, N.T.; et al. Clinical Value of Cerebrospinal Fluid Neurofilament Light Chain in Semantic Dementia. J. Neurol. Neurosurg. Psychiatry 2019, 90, 997–1004. [Google Scholar] [CrossRef]
- Painous, C.; Pascual-Diaz, S.; Muñoz-Moreno, E.; Sánchez, V.; Pariente, J.C.; Prats-Galino, A.; Soto, M.; Fernández, M.; Pérez-Soriano, A.; Camara, A.; et al. Midbrain and Pons MRI Shape Analysis and Its Clinical and CSF Correlates in Degenerative Parkinsonisms: A Pilot Study. Eur. Radiol. 2023, 33, 4540–4551. [Google Scholar] [CrossRef]
- Rojas, J.C.; Karydas, A.; Bang, J.; Tsai, R.M.; Blennow, K.; Liman, V.; Kramer, J.H.; Rosen, H.; Miller, B.L.; Zetterberg, H.; et al. Plasma Neurofilament Light Chain Predicts Progression in Progressive Supranuclear Palsy. Ann. Clin. Transl. Neurol. 2016, 3, 216–225. [Google Scholar] [CrossRef]
- Rojas, J.C.; Bang, J.; Lobach, I.V.; Tsai, R.M.; Rabinovici, G.D.; Miller, B.L.; Boxer, A.L.; AL-108-231 Investigators. CSF Neurofilament Light Chain and Phosphorylated Tau 181 Predict Disease Progression in PSP. Neurology 2018, 90, e273–e281. [Google Scholar] [CrossRef]
- Rojas, J.C.; Wang, P.; Staffaroni, A.M.; Heller, C.; Cobigo, Y.; Wolf, A.; Goh, S.-Y.M.; Ljubenkov, P.A.; Heuer, H.W.; Fong, J.C.; et al. Plasma Neurofilament Light for Prediction of Disease Progression in Familial Frontotemporal Lobar Degeneration. Neurology 2021, 96, e2296–e2312. [Google Scholar] [CrossRef]
- Spotorno, N.; Lindberg, O.; Nilsson, C.; Landqvist Waldö, M.; van Westen, D.; Nilsson, K.; Vestberg, S.; Englund, E.; Zetterberg, H.; Blennow, K.; et al. Plasma Neurofilament Light Protein Correlates with Diffusion Tensor Imaging Metrics in Frontotemporal Dementia. PLoS ONE 2020, 15, e0236384. [Google Scholar] [CrossRef]
- Steinacker, P.; Semler, E.; Anderl-Straub, S.; Diehl-Schmid, J.; Schroeter, M.L.; Uttner, I.; Foerstl, H.; Landwehrmeyer, B.; von Arnim, C.A.F.; Kassubek, J.; et al. Neurofilament as a Blood Marker for Diagnosis and Monitoring of Primary Progressive Aphasias. Neurology 2017, 88, 961–969. [Google Scholar] [CrossRef]
- Steinacker, P.; Anderl-Straub, S.; Diehl-Schmid, J.; Semler, E.; Uttner, I.; von Arnim, C.A.F.; Barthel, H.; Danek, A.; Fassbender, K.; Fliessbach, K.; et al. Serum Neurofilament Light Chain in Behavioral Variant Frontotemporal Dementia. Neurology 2018, 91, e1390–e1401. [Google Scholar] [CrossRef]
- Sudre, C.H.; Bocchetta, M.; Heller, C.; Convery, R.; Neason, M.; Moore, K.M.; Cash, D.M.; Thomas, D.L.; Woollacott, I.O.C.; Foiani, M.; et al. White Matter Hyperintensities in Progranulin-Associated Frontotemporal Dementia: A Longitudinal GENFI Study. Neuroimage Clin. 2019, 24, 102077. [Google Scholar] [CrossRef]
- Andersson, E.; Janelidze, S.; Lampinen, B.; Nilsson, M.; Leuzy, A.; Stomrud, E.; Blennow, K.; Zetterberg, H.; Hansson, O. Blood and Cerebrospinal Fluid Neurofilament Light Differentially Detect Neurodegeneration in Early Alzheimer’s Disease. Neurobiol. Aging 2020, 95, 143–153. [Google Scholar] [CrossRef] [PubMed]
- Huang, Y.; Li, Y.; Xie, F.; Guo, Q. Associations of Plasma Phosphorylated Tau181 and Neurofilament Light Chain with Brain Amyloid Burden and Cognition in Objectively Defined Subtle Cognitive Decline Patients. CNS Neurosci. Ther. 2022, 28, 2195–2205. [Google Scholar] [CrossRef]
- Lee, E.-H.; Kwon, H.S.; Koh, S.-H.; Choi, S.H.; Jin, J.-H.; Jeong, J.H.; Jang, J.-W.; Park, K.W.; Kim, E.-J.; Kim, H.J.; et al. Serum Neurofilament Light Chain Level as a Predictor of Cognitive Stage Transition. Alzheimer’s Res. Ther. 2022, 14, 6. [Google Scholar] [CrossRef]
- Marks, J.D.; Syrjanen, J.A.; Graff-Radford, J.; Petersen, R.C.; Machulda, M.M.; Campbell, M.R.; Algeciras-Schimnich, A.; Lowe, V.; Knopman, D.S.; Jack, C.R.; et al. Comparison of Plasma Neurofilament Light and Total Tau as Neurodegeneration Markers: Associations with Cognitive and Neuroimaging Outcomes. Alzheimer’s Res. Ther. 2021, 13, 199. [Google Scholar] [CrossRef] [PubMed]
- Meeker, K.L.; Butt, O.H.; Gordon, B.A.; Fagan, A.M.; Schindler, S.E.; Morris, J.C.; Benzinger, T.L.S.; Ances, B.M. Cerebrospinal Fluid Neurofilament Light Chain Is a Marker of Aging and White Matter Damage. Neurobiol. Dis. 2022, 166, 105662. [Google Scholar] [CrossRef] [PubMed]
- Mielke, M.M.; Syrjanen, J.A.; Blennow, K.; Zetterberg, H.; Vemuri, P.; Skoog, I.; Machulda, M.M.; Kremers, W.K.; Knopman, D.S.; Jack, C.; et al. Plasma and CSF Neurofilament Light: Relation to Longitudinal Neuroimaging and Cognitive Measures. Neurology 2019, 93, e252–e260. [Google Scholar] [CrossRef]
- Moore, E.E.; Hohman, T.J.; Badami, F.S.; Pechman, K.R.; Osborn, K.E.; Acosta, L.M.Y.; Bell, S.P.; Babicz, M.A.; Gifford, K.A.; Anderson, A.W.; et al. Neurofilament Relates to White Matter Microstructure in Older Adults. Neurobiol. Aging 2018, 70, 233–241. [Google Scholar] [CrossRef] [PubMed]
- Moore, E.E.; Gifford, K.A.; Khan, O.A.; Liu, D.; Pechman, K.R.; Acosta, L.M.Y.; Bell, S.P.; Turchan, M.; Landman, B.A.; Blennow, K.; et al. Cerebrospinal Fluid Biomarkers of Neurodegeneration, Synaptic Dysfunction, and Axonal Injury Relate to Atrophy in Structural Brain Regions Specific to Alzheimer’s Disease. Alzheimer’s Dement. 2020, 16, 883–895. [Google Scholar] [CrossRef]
- Nabizadeh, F.; Balabandian, M.; Rostami, M.R.; Kankam, S.B.; Ranjbaran, F.; Pourhamzeh, M.; Alzheimer’s Disease Neuroimaging Initiative (ADNI). Plasma Neurofilament Light Levels Correlate with White Matter Damage Prior to Alzheimer’s Disease: Results from ADNI. Aging Clin. Exp. Res. 2022, 34, 2363–2372. [Google Scholar] [CrossRef] [PubMed]
- Osborn, K.E.; Liu, D.; Samuels, L.R.; Moore, E.E.; Cambronero, F.E.; Acosta, L.M.Y.; Bell, S.P.; Babicz, M.A.; Gordon, E.A.; Pechman, K.R.; et al. Cerebrospinal Fluid β-Amyloid42 and Neurofilament Light Relate to White Matter Hyperintensities. Neurobiol. Aging 2018, 68, 18–25. [Google Scholar] [CrossRef] [PubMed]
- Shi, Y.; Lu, X.; Zhang, L.; Shu, H.; Gu, L.; Wang, Z.; Gao, L.; Zhu, J.; Zhang, H.; Zhou, D.; et al. Potential Value of Plasma Amyloid-β, Total Tau, and Neurofilament Light for Identification of Early Alzheimer’s Disease. ACS Chem. Neurosci. 2019, 10, 3479–3485. [Google Scholar] [CrossRef] [PubMed]
- Sun, Y.; Tan, L.; Xu, W.; Wang, Z.-T.; Hu, H.; Li, J.-Q.; Dong, Q.; Tan, L.; Yu, J.-T.; Alzheimer’s Disease Neuroimaging Initiative. Plasma Neurofilament Light and Longitudinal Progression of White Matter Hyperintensity in Elderly Persons without Dementia. J. Alzheimer’s Dis. 2020, 75, 729–737. [Google Scholar] [CrossRef] [PubMed]
- Xie, L.; Das, S.R.; Wisse, L.E.M.; Ittyerah, R.; de Flores, R.; Shaw, L.M.; Yushkevich, P.A.; Wolk, D.A.; for the Alzheimer’s Disease Neuroimaging Initiative. Baseline Structural MRI and Plasma Biomarkers Predict Longitudinal Structural Atrophy and Cognitive Decline in Early Alzheimer’s Disease. Alzheimer’s Res. Ther. 2023, 15, 79. [Google Scholar] [CrossRef]
- Chen, C.-H.; Lee, B.-C.; Lin, C.-H. Integrated Plasma and Neuroimaging Biomarkers Associated with Motor and Cognition Severity in Parkinson’s Disease. J. Park. Dis. 2020, 10, 77–88. [Google Scholar] [CrossRef]
- Sampedro, F.; Pérez-González, R.; Martínez-Horta, S.; Marín-Lahoz, J.; Pagonabarraga, J.; Kulisevsky, J. Serum Neurofilament Light Chain Levels Reflect Cortical Neurodegeneration in de Novo Parkinson’s Disease. Park. Relat. Disord. 2020, 74, 43–49. [Google Scholar] [CrossRef]
- Welton, T.; Tan, Y.J.; Saffari, S.E.; Ng, S.Y.E.; Chia, N.S.Y.; Yong, A.C.W.; Choi, X.; Heng, D.L.; Shih, Y.-C.; Hartono, S.; et al. Plasma Neurofilament Light Concentration Is Associated with Diffusion-Tensor MRI-Based Measures of Neurodegeneration in Early Parkinson’s Disease. J. Park. Dis. 2022, 12, 2135–2146. [Google Scholar] [CrossRef]
- Wang, L.; Zhou, C.; Zhang, W.; Zhang, M.; Cheng, W.; Feng, J. Association of Cortical and Subcortical Microstructure with Clinical Progression and Fluid Biomarkers in Patients with Parkinson Disease. Neurology 2023, 101, e300–e310. [Google Scholar] [CrossRef] [PubMed]
- Bäckström, D.; Linder, J.; Jakobson Mo, S.; Riklund, K.; Zetterberg, H.; Blennow, K.; Forsgren, L.; Lenfeldt, N. NfL as a Biomarker for Neurodegeneration and Survival in Parkinson Disease. Neurology 2020, 95, e827–e838. [Google Scholar] [CrossRef] [PubMed]
- Pontecorvo, M.J.; Lu, M.; Burnham, S.C.; Schade, A.E.; Dage, J.L.; Shcherbinin, S.; Collins, E.C.; Sims, J.R.; Mintun, M.A. Association of Donanemab Treatment with Exploratory Plasma Biomarkers in Early Symptomatic Alzheimer Disease: A Secondary Analysis of the TRAILBLAZER-ALZ Randomized Clinical Trial. JAMA Neurol. 2022, 79, 1250–1259. [Google Scholar] [CrossRef] [PubMed]


| Study | Numbers | Imaging Measures | Significant Key Findings | Study Design | Assay | |
|---|---|---|---|---|---|---|
| Alzheimer’s Disease | ||||||
| Asken et al. (2022) [32] | Cohort 1: 11 MCI, 39 HC Cohort 2: 21 AD, 18 MCI, 32 HC | GM, WM | Plasma NfLs | All subjects (cohort 2): ↓ cross-sectional parietal GM volume | Cross-sectional | Simoa (plasma) |
| Benedet et al. (2020) [33] | 767 MCI/AD, 382 HC from ADNI database, 42 MCI/AD, 74 HC from the TRIAD database | GM, WM, amy-PET, tau-PET | Plasma NfLs | MCI/AD: -↓ cross-sectional fronto-temporal and longitudinal temporal GM volume ↓ cross-sectional and longitudinal whole-brain WM volume -↑ cross-sectional fronto-temporal tau burden HC: -↓ cross-sectional frontal and hippocampal and longitudinal fronto-temporal GM volume -↓ cross-sectional fronto-parietal and longitudinal superior periventricular WM volume -↑ cross-sectional fronto-parieto-temporal amyloid burden | Cross-sectional and longitudinal | Simoa (plasma) |
| Boerwinkle et al. (2021) [34] | 371 AD, MCI, and HC (group numbers not specified) | CTh | CSF NfLs | All subjects: ↓ cross-sectional temporo-parietal and hippocampal CTh AD: ↓ cross-sectional temporo-parietal and hippocampal CTh | Cross-sectional | ELISA (CSF) |
| Chen et al. (2021) [35] | 57 AD, 120 MCI, 67 HC from ADNI database | GM, ventricular volume, FDG-PET | CSF NfLs | MCI: ↓ cross-sectional hippocampal volume; ↑ cross-sectional ventricular volume AD: -↑ cross-sectional ventricular volume -↑ cross-sectional FDG hypometabolism HC: -↓ cross-sectional hippocampal volume; ↑ cross-sectional ventricular volume; -↑ cross-sectional FDG hypometabolism | Cross-sectional | Simoa (plasma), ELISA (CSF) |
| Plasma NfLs | MCI: -↓ cross-sectional hippocampal volume; ↑ cross-sectional ventricular volume -↑ cross-sectional FDG hypometabolism AD: ↓ cross-sectional hippocampal volume; ↑ cross-sectional ventricular volume HC: -↓ cross-sectional hippocampal volume; ↑ cross-sectional ventricular volume -↑ cross-sectional FDG hypometabolism | |||||
| Chong et al. (2023) [36] | 44 AD, 99 MCI, 22 VaD, 43 HC | GM, MTA score, WMHs, amy-PET | Plasma NfLs | All subjects: -↓ cross-sectional hippocampal volume; ↑ cross-sectional MTA score -↑ cross-sectional WMH volume | Cross-sectional | Simoa (plasma) |
| Contador et al. (2021) [37] | 12 early onset AD, 19 HC | CTh, subcortical GM, ventricular volume | CSF NfLs | All subjects: ↓ longitudinal CTh and subcortical structures GM volume AD: ↑ cross-sectional left lateral ventricle volume | Cross-sectional and longitudinal | ELISA (CSF) |
| Dhiman et al. (2020) [38] | 28 AD, 34 MCI, 159 HC from the AIBL database (179 cross-sectional MRI, 195 cross-sectional amy-PET, 118 longitudinal amy-PET) | GM, WM, amy-PET | CSF NfLs | All subjects: -↓ cross-sectional whole-brain and hippocampal volume -↑ cross-sectional amyloid burden | Cross-sectional and longitudinal | ELISA (CSF) |
| Elahi et al. (2020) [39] | 63 AD, 33 HC | WMHs | Plasma NfLs | All subjects: ↑ cross-sectional WMH volume Higher in AD with high WMHs burden than in AD with lower WMHs burden | Cross-sectional | Simoa (plasma) |
| Kang et al. (2021) [40] | 73 AD, 160 MCI (112 Aβ+, 48 Aβ-), 83 HC (17 Aβ+, 66 Aβ-) from ADNI database | GM | CSF NfLs | MCI Aβ+: ↓ cross-sectional fronto-temporo-parietal, hippocampal and thalamic GM volume AD: ↓ cross-sectional fronto-temporo-occipito-parietal, hippocampal and cerebellar GM volume HC Aβ+: ↓ cross-sectional cingulate GM volume HC Aβ-: ↓ cross-sectional orbitofrontal GM volume | Cross-sectional | Simoa (plasma), ELISA (CSF) |
| Plasma NfLs | MCI Aβ+: ↓ cross-sectional temporal and hippocampal GM volume MCI Aβ-: ↓ cross-sectional insular GM volume AD: ↓ cross-sectional fronto-temporo-occipito-parietal, hippocampal and cerebellar GM volume | |||||
| Mao et al. (2021) [41] | 112 AD, 30 HC | MTA, PA scores | CSF NfLs | No significant associations | Cross-sectional | ELISA (CSF) |
| Mattson et al. (2016) [42] | 93 AD, 187 MCI, 109 HC from ADNI database | GM, ventricular volume, FDG-PET | CSF NfLs | Aβ+: -↓ cross-sectional hippocampal volume; ↑ cross-sectional and longitudinal ventricular volume -↑ longitudinal FDG hypometabolism Aβ-: -↓ cross-sectional and longitudinal hippocampal volume; ↑ cross-sectional and longitudinal ventricular volume -↑ longitudinal FDG hypometabolism | Cross-sectional and longitudinal | ELISA (CSF) |
| Mattson et al. (2017) [9] | 180 AD, 197 MCI, 193 HC from ADNI database | CTh, GM, ventricular volume, WMHs, FDG-PET | Plasma NfLs | All subjects: -↓ cross-sectional and longitudinal hippocampal volume and occipito-temporal CTh; ↑ cross-sectional and longitudinal ventricular volume -↑ longitudinal FDG hypometabolism | Cross-sectional and longitudinal | Simoa (plasma), ELISA (CSF) |
| Mattsson et al. (2019) [43] | 327 AD, 855 MCI, 1583 HC from ADNI database | CTh, GM, WMHs, FDG-PET | Baseline plasma NfLs | All subjects: -↓ cross-sectional entorhinal cortex and hippocampal volume; ↑ cross-sectional ventricular volume -↑ cross-sectional FDG hypometabolism | Cross-sectional and longitudinal | Simoa (plasma) |
| Longitudinal plasma NfLs | All subjects: -↓ cross-sectional entorhinal cortex and hippocampal volume; ↑ cross-sectional ventricular volume -↑ cross-sectional FDG hypometabolism MCI: ↓ longitudinal entorhinal cortex and hippocampal volume; ↑ longitudinal ventricular volume AD: ↑ longitudinal ventricular volume HC: ↓ longitudinal entorhinal cortex and hippocampal volume; ↑ longitudinal ventricular volume | |||||
| Moscoso et al. (2021) [44] | 198 AD, 537 MCI, 378 HC from ADNI database (554 Aβ+, 559 Aβ-) | GM, FDG-PET | Plasma NfLs | All subjects: ↑ longitudinal FDG hypometabolism All subjects Aβ-: ↓ longitudinal dorso-frontal GM volume All subjects Aβ+: -↓ longitudinal temporal GM volume -↑ cross-sectional FDG hypometabolism MCI/AD: -↓ cross-sectional temporo-parietal GM volume; ↓ longitudinal frontal GM volume -↑ cross-sectional FDG hypometabolism HC: -↓ longitudinal frontal GM volume -↑ cross-sectional fronto-temporal FDG hypometabolism HC Aβ-: ↑ cross-sectional FDG hypometabolism | Cross-sectional and longitudinal | Simoa (plasma) |
| Pereira et al. (2017) [45] | 65 AD, 145 MCI (109 Aβ+, 36 Aβ-), 94 HC (37 Aβ+, 57 Aβ-) from ADNI database | CTh, subcortical GM | CSF NfLs | MCI Aβ+: ↓ cross-sectional fronto-temporo-parieto-occipital CTh and putamen GM volume MCI Aβ-: ↓ cross-sectional fronto-temporo-occipital CTh and subcortical structures GM volume AD: ↓ cross-sectional fronto-temporo-parietal CTh HC Aβ+: ↓ cross-sectional fronto-temporal CTh HC Aβ-: ↓ cross-sectional right cuneus CTh and accumbens GM volume | Cross-sectional | Simoa (plasma), ELISA (CSF) |
| Plasma NfLs | MCI Aβ+: ↓ cross-sectional fronto-temporo-parieto-occipital CTh and subcortical structures GM volume MCI Aβ-: ↓ cross-sectional fronto-temporal, parieto-cingulate, and insular CTh and subcortical structures GM volume AD: ↓ cross-sectional fronto-temporo-parietal CTh | |||||
| Rajan et al. (2020) [46] | 421 AD, 317 MCI, 634 HC (742 cross-sectional MRI, 183 longitudinal MRI) | GM, ventricular volume, WMHs | Blood NfLs | All subjects: -↓ cross-sectional whole-brain and longitudinal hippocampal volume; ↑ cross-sectional 3rd ventricular volume -↑ cross-sectional WMH volume | Cross-sectional and longitudinal | Simoa (blood) |
| Schultz et al. (2020) [47] | 117 familial AD 1 (76 asymptomatic carriers, 41 symptomatic carriers), 84 HC | WM | Serum NfLs | Mutation carriers: -↑ cross-sectional WMH volume -↓ cross-sectional posterior corpus callosum, SLF, ILF, UF, forceps, corticospinal and frontal tracts FA and ↑ MD, RD and AxD; ↓ longitudinal corpus callosum FA and ↑ MD, RD and AxD | Cross-sectional and longitudinal | Simoa (serum) |
| Shahid et al. (2022) [48] | 19 AD, 52 MCI, 47 HC | WM | Plasma NfLs | All subjects: ↓ cross-sectional NODDI-derived parameters of WM integrity in CA4-DG HC: ↓ cross-sectional NODDI-derived parameters of WM integrity in CA4-DG | Cross-sectional | Simoa (plasma) |
| Simrén et al. (2021) [49] | 103 AD, 107 MCI, 99 HC | GM | Plasma NfLs | No significant associations | Longitudinal | Simoa (plasma) |
| Sjögren et al. (2001) [50] | 22 AD (9 WMH+, 13 WMH-), 20 HC | WMHs | CSF NfLs | Higher in AD WMH+ patients than AD WMH- and HC | Cross-sectional | ELISA (CSF) |
| Verberk et al. (2020) [51] | 132 AD, 50 MCI, 70 SCD (182 cross-sectional MRI) | MTA score, amy-PET | Plasma NfLs | All subjects: ↑ cross-sectional MTA score and amyloid burden | Cross-sectional | Simoa (plasma) |
| Walsh et al. (2021) [52] | 130 AD, 431 MCI, 103 SCD, 163 HC from ADNI database | WMHs | Plasma NfLs | MCI: ↑ cross-sectional WMH volume AD: ↑ cross-sectional WMH volume SCD: ↑ cross-sectional WMH volume HC: ↑ cross-sectional WMH volume | Cross-sectional | Simoa (plasma) |
| Weston et al. (2017) [53] | 37 familial AD 1 (18 symptomatic, 19 asymptomatic), 11 HC (43 cross-sectional MRI, 33 longitudinal MRI) | GM, ventricular volume | Serum NfLs | Mutation carriers: ↓ cross-sectional whole-brain and hippocampal volume; ↓ longitudinal whole-brain volume; ↑ cross-sectional and longitudinal ventricular volume | Cross-sectional and longitudinal | Simoa (serum) |
| Zetterberg et al. (2016) [54] | 95 AD, 192 MCI, 110 HC from ADNI database | GM | CSF NfLs | All subjects: -↓ longitudinal whole-brain and hippocampal volume; ↑ longitudinal ventricular volume -↑ longitudinal WMH volume MCI: -↓ cross-sectional hippocampal volume -↑ cross-sectional WMH volume AD: ↑ cross-sectional WMH volume | Cross-sectional and longitudinal | ELISA (CSF) |
| Alzheimer’s Disease and Frontotemporal Dementia | ||||||
| Alcolea et al. (2017) [55] | 72 AD, 159 FTD, 76 HC (115 cross-sectional MRI) | CTh | CSF NfLs | FTD: ↓ cross-sectional fronto-temporo-parietal CTh AD: ↓ cross-sectional temporo-lateral CTh | Cross-sectional | ELISA (CSF) |
| Falgàs et al. (2020) [56] | 64 early onset AD, 26 FTD, 48 HC | CTh, WM | CSF NfLs | All subjects: ↓ cross-sectional hippocampal CTh FTD: -↓ cross-sectional frontal CTh -↓ cross-sectional forceps minor, anterior thalamic radiation, cingulum and left SLF FA AD: ↓ cross-sectional corticospinal tract, UF, ILF, and IFOF FA | Cross-sectional | ELISA (CSF) |
| Illán-Gala et al. (2021) [57] | 167 FTD spectrum (43 bvFTD, 28 nfvPPA, 18 svPPA, 36 PSP, 32 CBS, 10 FTD-ALS), 43 AD, 55 HC (240 cross-sectional MRI) | CTh | Plasma NfLs | FTD spectrum: ↓ cross-sectional frontal CTh AD: ↓ cross-sectional fronto-temporo-parietal CTh | Cross-sectional | Simoa (plasma) |
| Oeckl et al. (2023) [58] | 74 AD, 81 bvFTD, 41 svPPA, 55 nfvPPA, 25 lvPPA, 42 PSP, 25 CBS, 31 HC | GM | Serum NfLs | All subjects: ↓ cross-sectional fronto-temporo-parietal, cingulate, insular, hippocampal, and subcortical structures GM volume AD: ↓ cross-sectional fronto-temporo-parietal, cingulate, insular, hippocampal, and subcortical structures GM volume bvFTD: ↓ cross-sectional frontal and striatum GM volume svPPA: ↓ cross-sectional fronto-temporal and occipital GM volume nfvPPA: ↓ cross-sectional hippocampus and right amygdala GM volume CBS: ↓ cross-sectional left putamen and supramarginal gyrus GM volume | Cross-sectional | ELLA (serum) |
| Frontotemporal Dementia | ||||||
| Benussi et al. (2020) [59] | 134 bvFTD, 48 nfvPPA, 27 svPPA, 51 CBS, 31 PSP, 63 AD, 63 HC (132 cross-sectional MRI) | CTh | Serum NfLs | FTD spectrum: ↓ cross-sectional prefrontal and temporo-parietal CTh | Cross-sectional | Simoa (serum) |
| Cajanus et al. (2020) [60] | 26 FTD C9ORF72+, 52 FTD C9ORF72 (41 cross-sectional MRI, 11 longitudinal MRI) | CTh, subcortical GM | Serum NfLs | All subjects: ↓ cross-sectional median CTh and longitudinal frontal and subcortical structures GM volume | Cross-sectional and longitudinal | Simoa (serum) |
| Illán-Gala et al. (2018) [61] | 86 FTD, 38 ALS, 49 HC (70 cross-sectional MRI) | CTh | CSF NfLs | No significant associations | Cross-sectional | ELISA (CSF) |
| Illán-Gala et al. (2019) [62] | 70 bvFTD, 78 HC (32 available CSF) | CTh, WM | CSF NfLs | bvFTD: -↓ cross-sectional dorsolateral and medial prefrontal CTh -↑ cross-sectional fronto-temporo-parietal cortical MD | Cross-sectional | ELISA (CSF) |
| Ljubenkov et al. (2018) [63] | 40 bvFTD, 24 svPPA, 26 nfvPPA, 49 HC (81 cross-sectional MRI) | GM, WM | CSF NfLs | bvFTD: -↓ cross-sectional and longitudinal fronto-temporal GM volume -↓ longitudinal fronto-temporal FA nfvPPA: -↓ longitudinal fronto-temporal GM volume -↓ longitudinal fronto-temporal FA | Cross-sectional and longitudinal | ELISA (CSF) |
| Meeter et al. (2016) [64] | 165 genetic FTD 2 (102 symptomatic carriers, 63 asymptomatic carriers), 73 HC (101 cross-sectional MRI, 22 longitudinal MRI) | GM | CSF NfLs | All carriers: ↓ cross-sectional and longitudinal whole-brain and fronto-temporo-parietal, cingulate, and insular GM volume Symptomatic carriers: ↓ cross-sectional whole-brain, frontal, and insular GM volume Asymptomatic carriers: ↓ cross-sectional whole-brain and fronto-temporo-parietal GM volume | Cross-sectional and longitudinal | ECLIA (serum), ELISA (CSF) |
| Meeter et al. (2018) [65] | 89 C9ORF72 FTD (64 symptomatic, 25 asymptomatic), 12 HC (63 cross-sectional MRI) | GM | CSF NfLs | All carriers: ↓ cross-sectional frontal, insular, cingulate, and subcortical structures GM volume Symptomatic: ↓ cross-sectional frontal GM volume | Cross-sectional | ELISA (CSF) |
| Meeter et al. (2019) [66] | 162 svPPA (87 cross-sectional MRI, 37 longitudinal MRI) and 65 HC | GM | CSF NfLs | svPPA: ↓ parahippocampal gyrus (of the dominant atrophic side) GM volume | Cross-sectional and longitudinal | ELISA (CSF) |
| Painous et al. (2023) [67] | 21 PSP, 14 CBS, 26 MSA, 12 PD, 11 HC | Brainstem volume | CSF NfLs | PSP: ↓ cross-sectional midbrain and pons volume CBS: ↑ cross-sectional midbrain and pons volume | Cross-sectional | ELISA (CSF) |
| Rohrer et al. (2016) [19] | 67 FTD, HC 28 (46 cross-sectional MRI, 29 longitudinal MRI) | GM | Serum NfLs | FTD: ↓ longitudinal frontal GM volume | Cross-sectional and longitudinal | Simoa (serum) |
| Rojas et al. (2016) [68] | 147 PSP (124 longitudinal MRI) | GM | Plasma NfLs | Patients with higher levels at baseline (≥37.6 pg/mL): greater reduction in whole-brain, midbrain, and superior cerebellar peduncle GM volume and greater ventricle expansion than patients with lower levels | Longitudinal | Simoa (plasma), ELISA (CSF) |
| Rojas et al. (2018) [69] | 50 PSP with CSF (46 longitudinal MRI), 141 PSP with plasma (127 longitudinal MRI) | Brainstem volume | CSF NfLs | PSP: ↓ cross-sectional and longitudinal superior cerebellar peduncle volume | Cross-sectional and longitudinal | Simoa (plasma), ELISA (CSF) |
| Rojas et al. (2021) [70] | 187 genetic FTD 2 (95 symptomatic carriers, 92 asymptomatic carriers), 90 HC | GM | Plasma NfLs | All carriers: ↓ longitudinal fronto-temporal GM volume | Cross-sectional and longitudinal | Simoa (plasma, CSF) |
| Scherling et al. (2014) [18] | 79 FTD, 50 AD, 22 PSP, 17 CBS, 6 PD, 47 HC (66 cross-sectional MRI in the FTD group) | GM | CSF NfLs | FTD: ↓ cross-sectional fronto-temporo-occipital and parieto-cingulate GM volume | Cross-sectional | ELISA (CSF) |
| Spotorno et al. (2020) [71] | 20 bvFTD, 22 HC | CTh, WM | Plasma NfLs | bvFTD: -↓ cross-sectional frontal CTh -↑ cross-sectional UF, IFOF, anterior thalamic radiation, corpus callosum, left corticospinal tract and cerebral peduncle FA | Cross-sectional | Simoa (plasma) |
| Steinacker et al. (2017) [72] | 99 PPA, 35 HC (42 cross-sectional MRI, 33 longitudinal MRI) | GM | Longitudinal serum NfLs | All PPA: ↓ longitudinal bilateral frontal GM volume nfvPPA: ↓ longitudinal right middle frontal gyrus GM volume svPPA: ↓ longitudinal right middle frontal gyrus GM volume | Cross-sectional and longitudinal | ECLIA (serum), ELISA (CSF) |
| Steinacker et al. (2018) [73] | 74 bvFTD, 26 AD, 17 MCI, 15 HC (71 cross-sectional MRI, longitudinal not specified) | GM, WM | Serum NfLs | bvFTD: -↓ cross-sectional frontal, striatum, and right amygdala GM volume; ↓ longitudinal frontal GM volume -↓ cross-sectional frontal WM volume | Cross-sectional and longitudinal | Simoa (serum), ELISA (CSF) |
| Sudre et al. (2019) [74] | 133 GRN FTD (32 symptomatic, 101 asymptomatic), 203 HC (124 longitudinal MRI) | WMHs | Plasma NfLs | All carriers: ↑ cross-sectional and longitudinal WMHs load in the medial region and occipital lobe HC: ↑ longitudinal WMHs load in the medial region | Cross-sectional and longitudinal | Simoa (plasma) |
| van der Ende et al. (2019) [20] | 208 genetic FTD 2 (59 symptomatic, 149 asymptomatic), 127 HC (276 cross-sectional MRI, 258 longitudinal MRI) | GM | Longitudinal serum NfLs | All subjects: ↓ cross-sectional whole-brain, frontal, insular, cingulate, and temporal GM volume; ↓ longitudinal whole-brain, frontal, insular, cingulate, temporal, subcortical structure and cerebellar GM volume | Cross-sectional and longitudinal | Simoa (serum) |
| Mild Cognitive Impairment | ||||||
| Andersson et al. (2020) [75] | 113 AD, 227 MCI, 478 HC (cross-sectional MRI and amy-PET in MCI and HC only) | WM, amy-PET | CSF NfLs | All subjects: -↓ cross-sectional FA and ↑ MD in all WM tracts -↑ cross-sectional fronto-temporal, parieto-cingulate, and occipital amyloid burden MCI: ↓ cross-sectional FA and ↑ MD in all WM tracts HC: ↓ cross-sectional FA and ↑ MD in all WM tracts | Cross-sectional | Simoa (plasma), ELISA (CSF) |
| Plasma NfLs | MCI: ↓ cross-sectional FA in all WM tracts | |||||
| Huang et al. (2022) [76] | 111 SCD, 123 HC | CTh, GM, amy-PET | Plasma NfLs | All subjects: -↓ cross-sectional hippocampal volume and mean CTh -↑ cross-sectional amyloid burden | Cross-sectional | Simoa (plasma) |
| Lee et al. (2022) [77] | 53 MCI, 146 HC | CTh | Serum NfLs | All subjects: ↓ cross-sectional whole-brain and parieto-temporo-occipital CTh MCI: ↓ cross-sectional calcarine fissure and cortex, lingual gyrus, nucleus accumbens, hippocampal and putamen CTh HC: ↓ cross-sectional whole-brain and parieto-temporo-occipital CTh | Cross-sectional | Simoa (serum) |
| Marks et al. (2021) [78] | Mayo cohort: 131 MCI, 864 HC ADNI cohort: 197 MCI, 190 HC | CTh, GM, WM | Plasma NfLs | All subjects (Mayo cohort): -↓ cross-sectional fronto-temporo-parieto-occipital CTh; ↓ longitudinal temporal CTh and hippocampal volume -↓ longitudinal corpus callosum FA All subjects (ADNI cohort): ↓ cross-sectional and longitudinal hippocampal volume Aβ+ (Mayo cohort): ↓ cross-sectional corpus callosum FA | Cross-sectional and longitudinal | Simoa (plasma) |
| Meeker et al. (2022) [79] | 71 MCI, 348 HC | GM, WM, WMHs | CSF NfLs | All subjects: -↓ cross-sectional GM volume -↑ WMH volume (survives when accounting for GM, WM, and WMHs at the same time) | Cross-sectional | ELISA (CSF) |
| Mielke et al. (2019) [80] | 15 MCI, 64 HC | CTh, GM, WM, FDG-PET, amy-PET | Baseline plasma NfLs | All subjects: -↓ longitudinal hippocampal volume and global CTh -↓ longitudinal corpus callosum FA -↑ longitudinal FDG hypometabolism | Cross-sectional and longitudinal | Simoa (plasma), ELISA (CSF) |
| Longitudinal plasma NfLs | All subjects: ↑ longitudinal amyloid burden | |||||
| Moore et al. (2018) [81] | 70 MCI, 77 HC | WM | CSF NfLs | All subjects: ↓ cross-sectional striatum FA; ↑ cross-sectional striatum RD, fusiform gyrus MD, and rectus gyrus AxD MCI: ↓ cross-sectional superior corona radiata and posterior thalamic radiation FA, ↑ cross-sectional anterior corona radiata MD and AxD and striatum RD HC: ↑ cross-sectional posterior thalamic radiation RD | Cross-sectional | ELISA (CSF) |
| Moore et al. (2020) [82] | 71 MCI, 82 HC | CTh, GM | CSF NfLs | All subjects: ↓ cross-sectional parieto-temporal CTh and fronto-temporo-cingulate GM volume MCI: ↓ cross-sectional temporo-parietal CTh and fronto-temporo-cingulate GM volume | Cross-sectional and longitudinal | ELISA (CSF) |
| Nabizadeh et al. (2022) [83] | 92 MCI from ADNI database (47 ApoE ε4+, 45 ApoE ε4-) | WM | Plasma NfLs | ApoE ε4+: ↓ cross-sectional internal capsule, IFOF, fornix, and corpus callosum FA; ↑ cross-sectional corona radiata and sagittal stratum AxD, corona radiata, internal capsule, corpus callosum, IFOF, and fornix RD, and corona radiata, internal capsule, corpus callosum, and fornix MD ApoE ε4-: ↓ cross-sectional corona radiata FA; ↑ cross-sectional hippocampal cingulum, internal capsule, and UF AxD, and cingulum, hippocampal cingulum and UF RD and MD | Cross-sectional | Simoa (plasma) |
| Osborn et al. (2018) [84] | 71 MCI, 77 HC | WMHs | CSF NfLs | All subjects: ↑ cross-sectional WMH volume | Cross-sectional | ELISA (CSF) |
| Shi et al. (2019) [85] | 68 amnesic MCI, 87 HC | GM | Plasma NfLs | Amnesic MCI: ↓ cross-sectional temporal GM volume | Cross-sectional | Simoa (plasma) |
| Sun et al. (2020) [86] | 675 MCI, 354 HC from ADNI database (589 longitudinal MRI) | WMHs | Baseline plasma NfLs | All subjects: ↑ cross-sectional and longitudinal WMH volume HC: ↑ longitudinal WMH volume | Cross-sectional and longitudinal | Simoa (plasma) |
| Longitudinal plasma NfLs | All subjects: ↑ longitudinal WMH volume HC: ↑ longitudinal WMH volume | |||||
| Xie et al. (2023) [87] | 361 MCI, 245 HC from ADNI database | GM | Plasma NfLs | All subjects: ↓ longitudinal perirhinal cortex GM volume | Cross-sectional and longitudinal | Simoa (plasma) |
Disclaimer/Publisher’s Note: The statements, opinions and data contained in all publications are solely those of the individual author(s) and contributor(s) and not of MDPI and/or the editor(s). MDPI and/or the editor(s) disclaim responsibility for any injury to people or property resulting from any ideas, methods, instructions or products referred to in the content. |
© 2024 by the authors. Licensee MDPI, Basel, Switzerland. This article is an open access article distributed under the terms and conditions of the Creative Commons Attribution (CC BY) license (https://creativecommons.org/licenses/by/4.0/).
Share and Cite
Gallingani, C.; Carbone, C.; Tondelli, M.; Zamboni, G. Neurofilaments Light Chain in Neurodegenerative Dementias: A Review of Imaging Correlates. Brain Sci. 2024, 14, 272. https://doi.org/10.3390/brainsci14030272
Gallingani C, Carbone C, Tondelli M, Zamboni G. Neurofilaments Light Chain in Neurodegenerative Dementias: A Review of Imaging Correlates. Brain Sciences. 2024; 14(3):272. https://doi.org/10.3390/brainsci14030272
Chicago/Turabian StyleGallingani, Chiara, Chiara Carbone, Manuela Tondelli, and Giovanna Zamboni. 2024. "Neurofilaments Light Chain in Neurodegenerative Dementias: A Review of Imaging Correlates" Brain Sciences 14, no. 3: 272. https://doi.org/10.3390/brainsci14030272
APA StyleGallingani, C., Carbone, C., Tondelli, M., & Zamboni, G. (2024). Neurofilaments Light Chain in Neurodegenerative Dementias: A Review of Imaging Correlates. Brain Sciences, 14(3), 272. https://doi.org/10.3390/brainsci14030272