

Temporal Relationship between HbA1c and Depressive Symptom Trajectories in a Longitudinal Cohort Study: The Mediating Role of Healthy Lifestyles


Abstract
1. Introduction
2. Methods
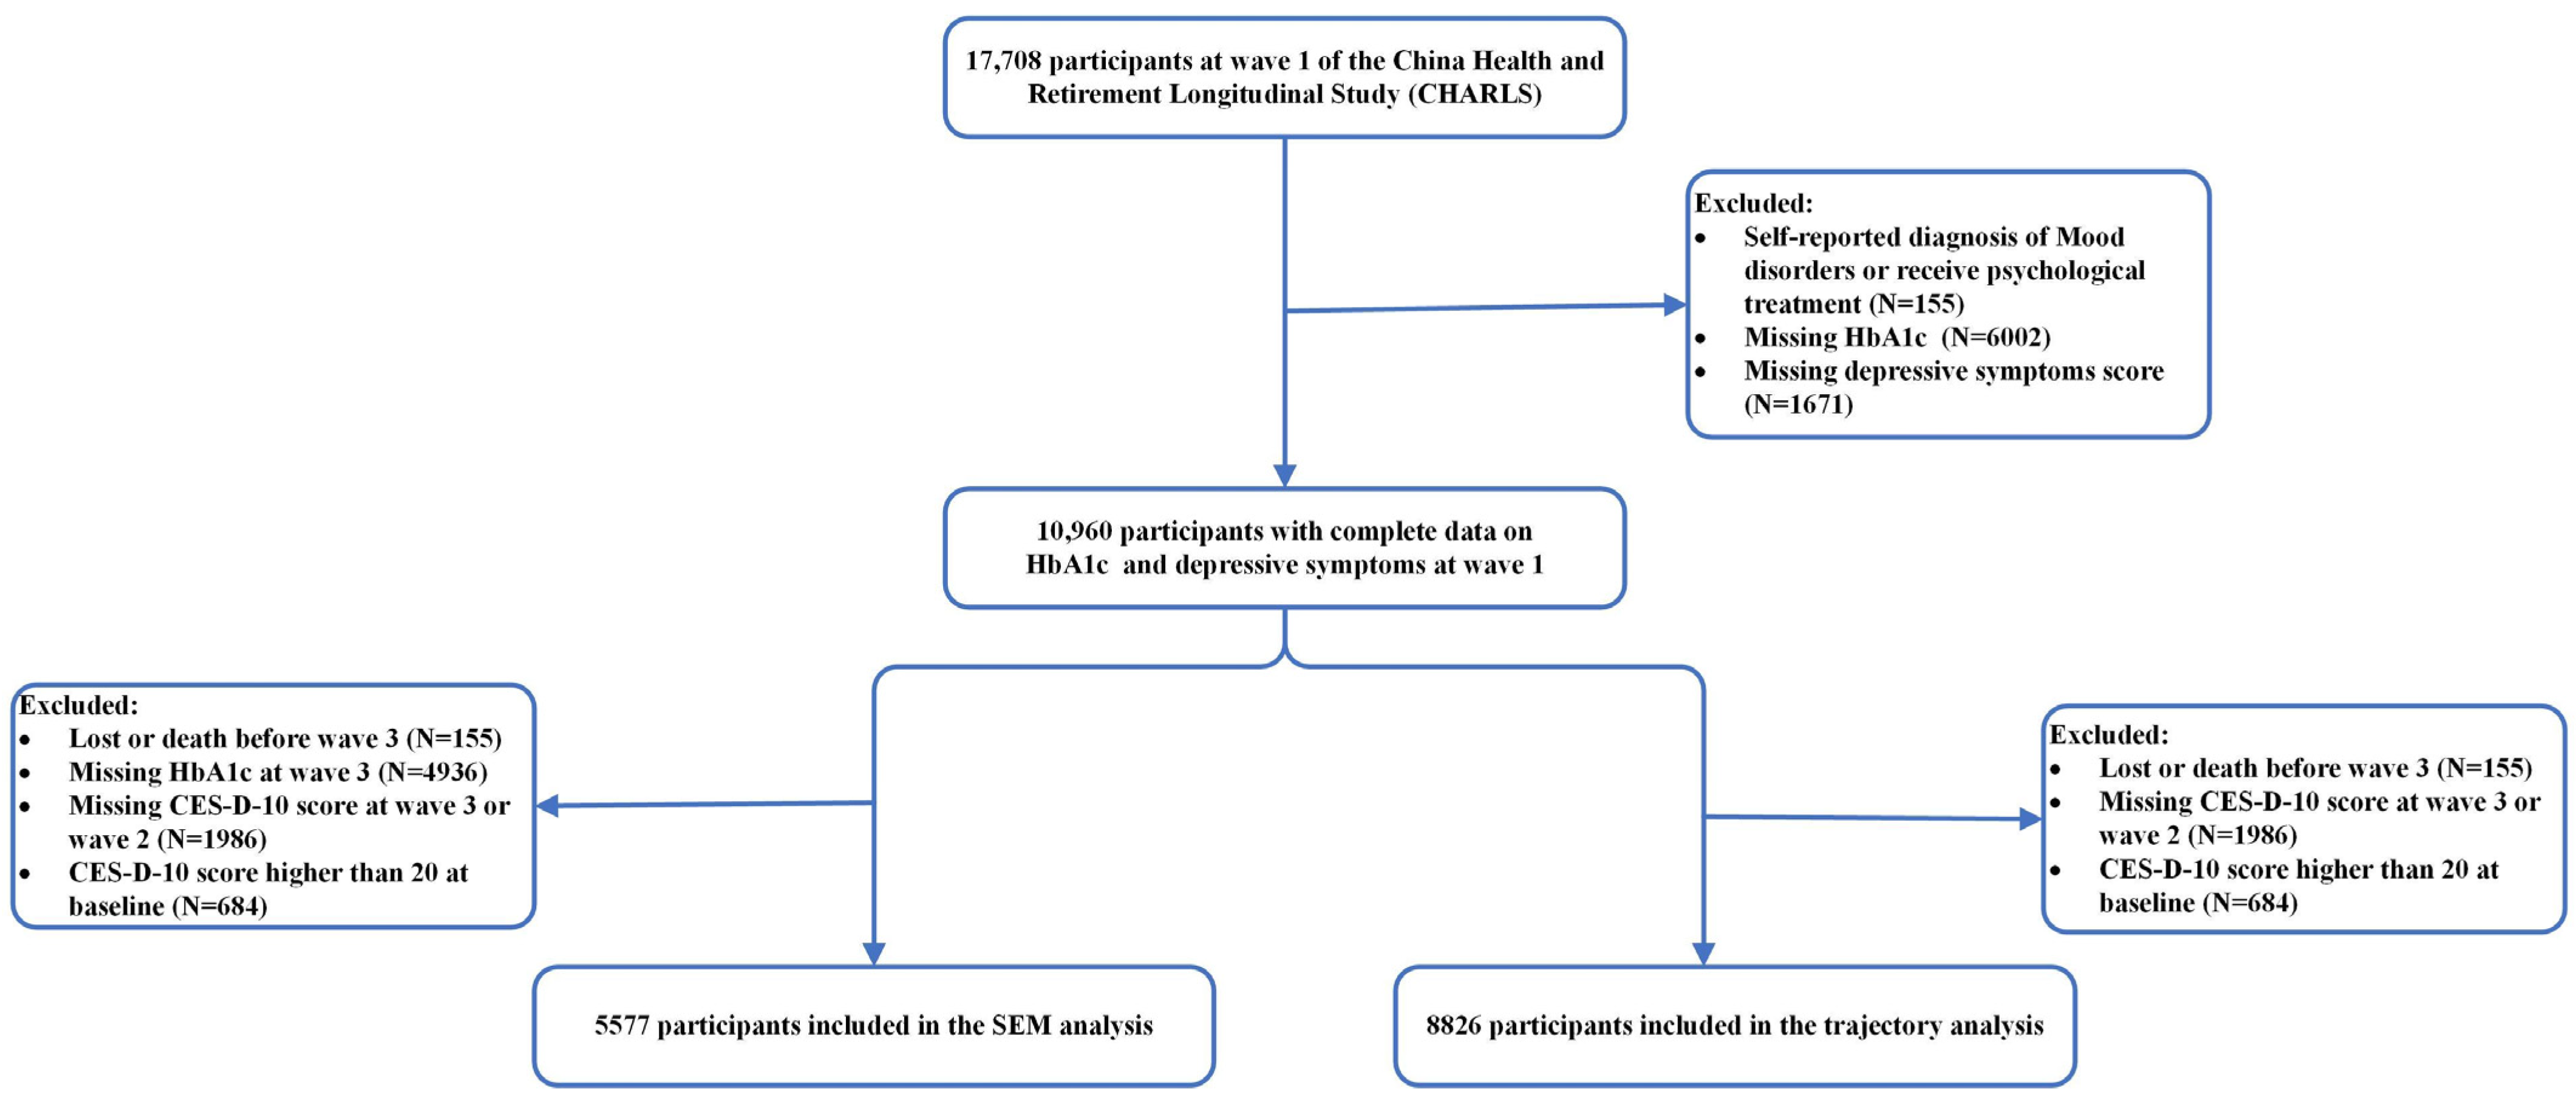
2.1. Participants
2.2. Blood Sample Collection and Measurements of HbA1c
2.3. Assessment of Depressive Symptoms
2.4. Definition of Healthy Lifestyle
2.5. Covariates
2.6. Statistical Analysis
3. Results
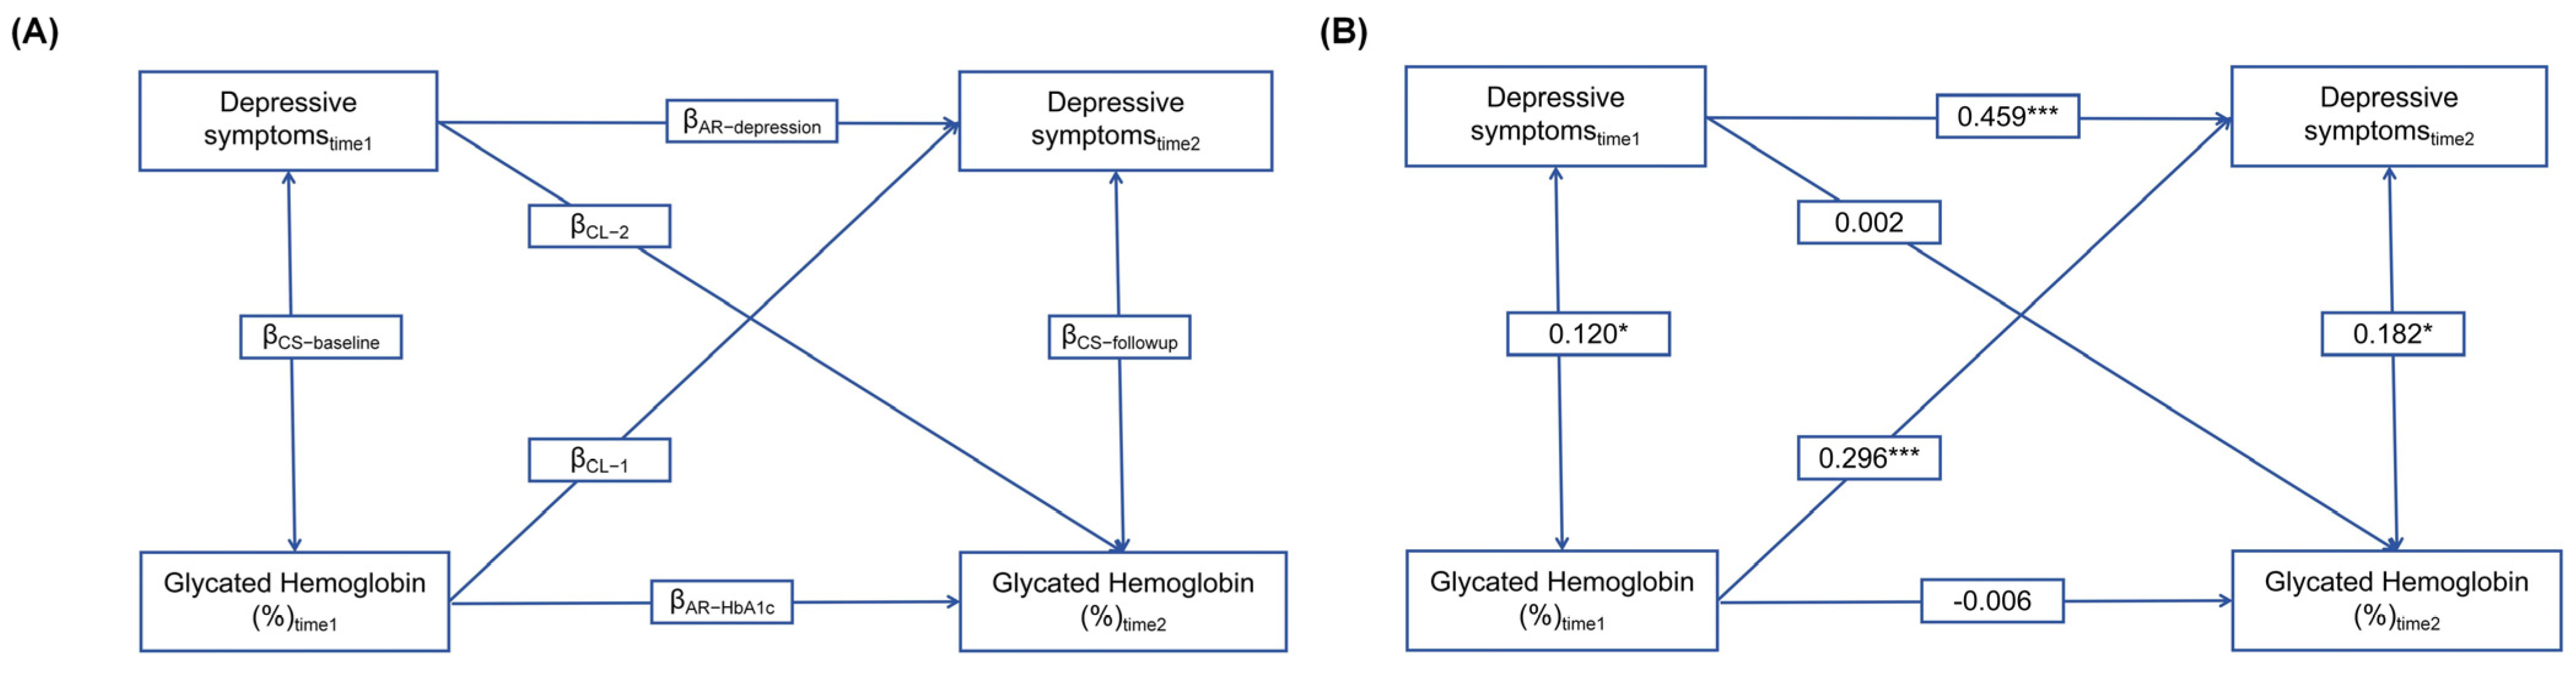
3.1. Association of HbA1c Levels and Depressive Symptoms by Cross-Lagged Analysis
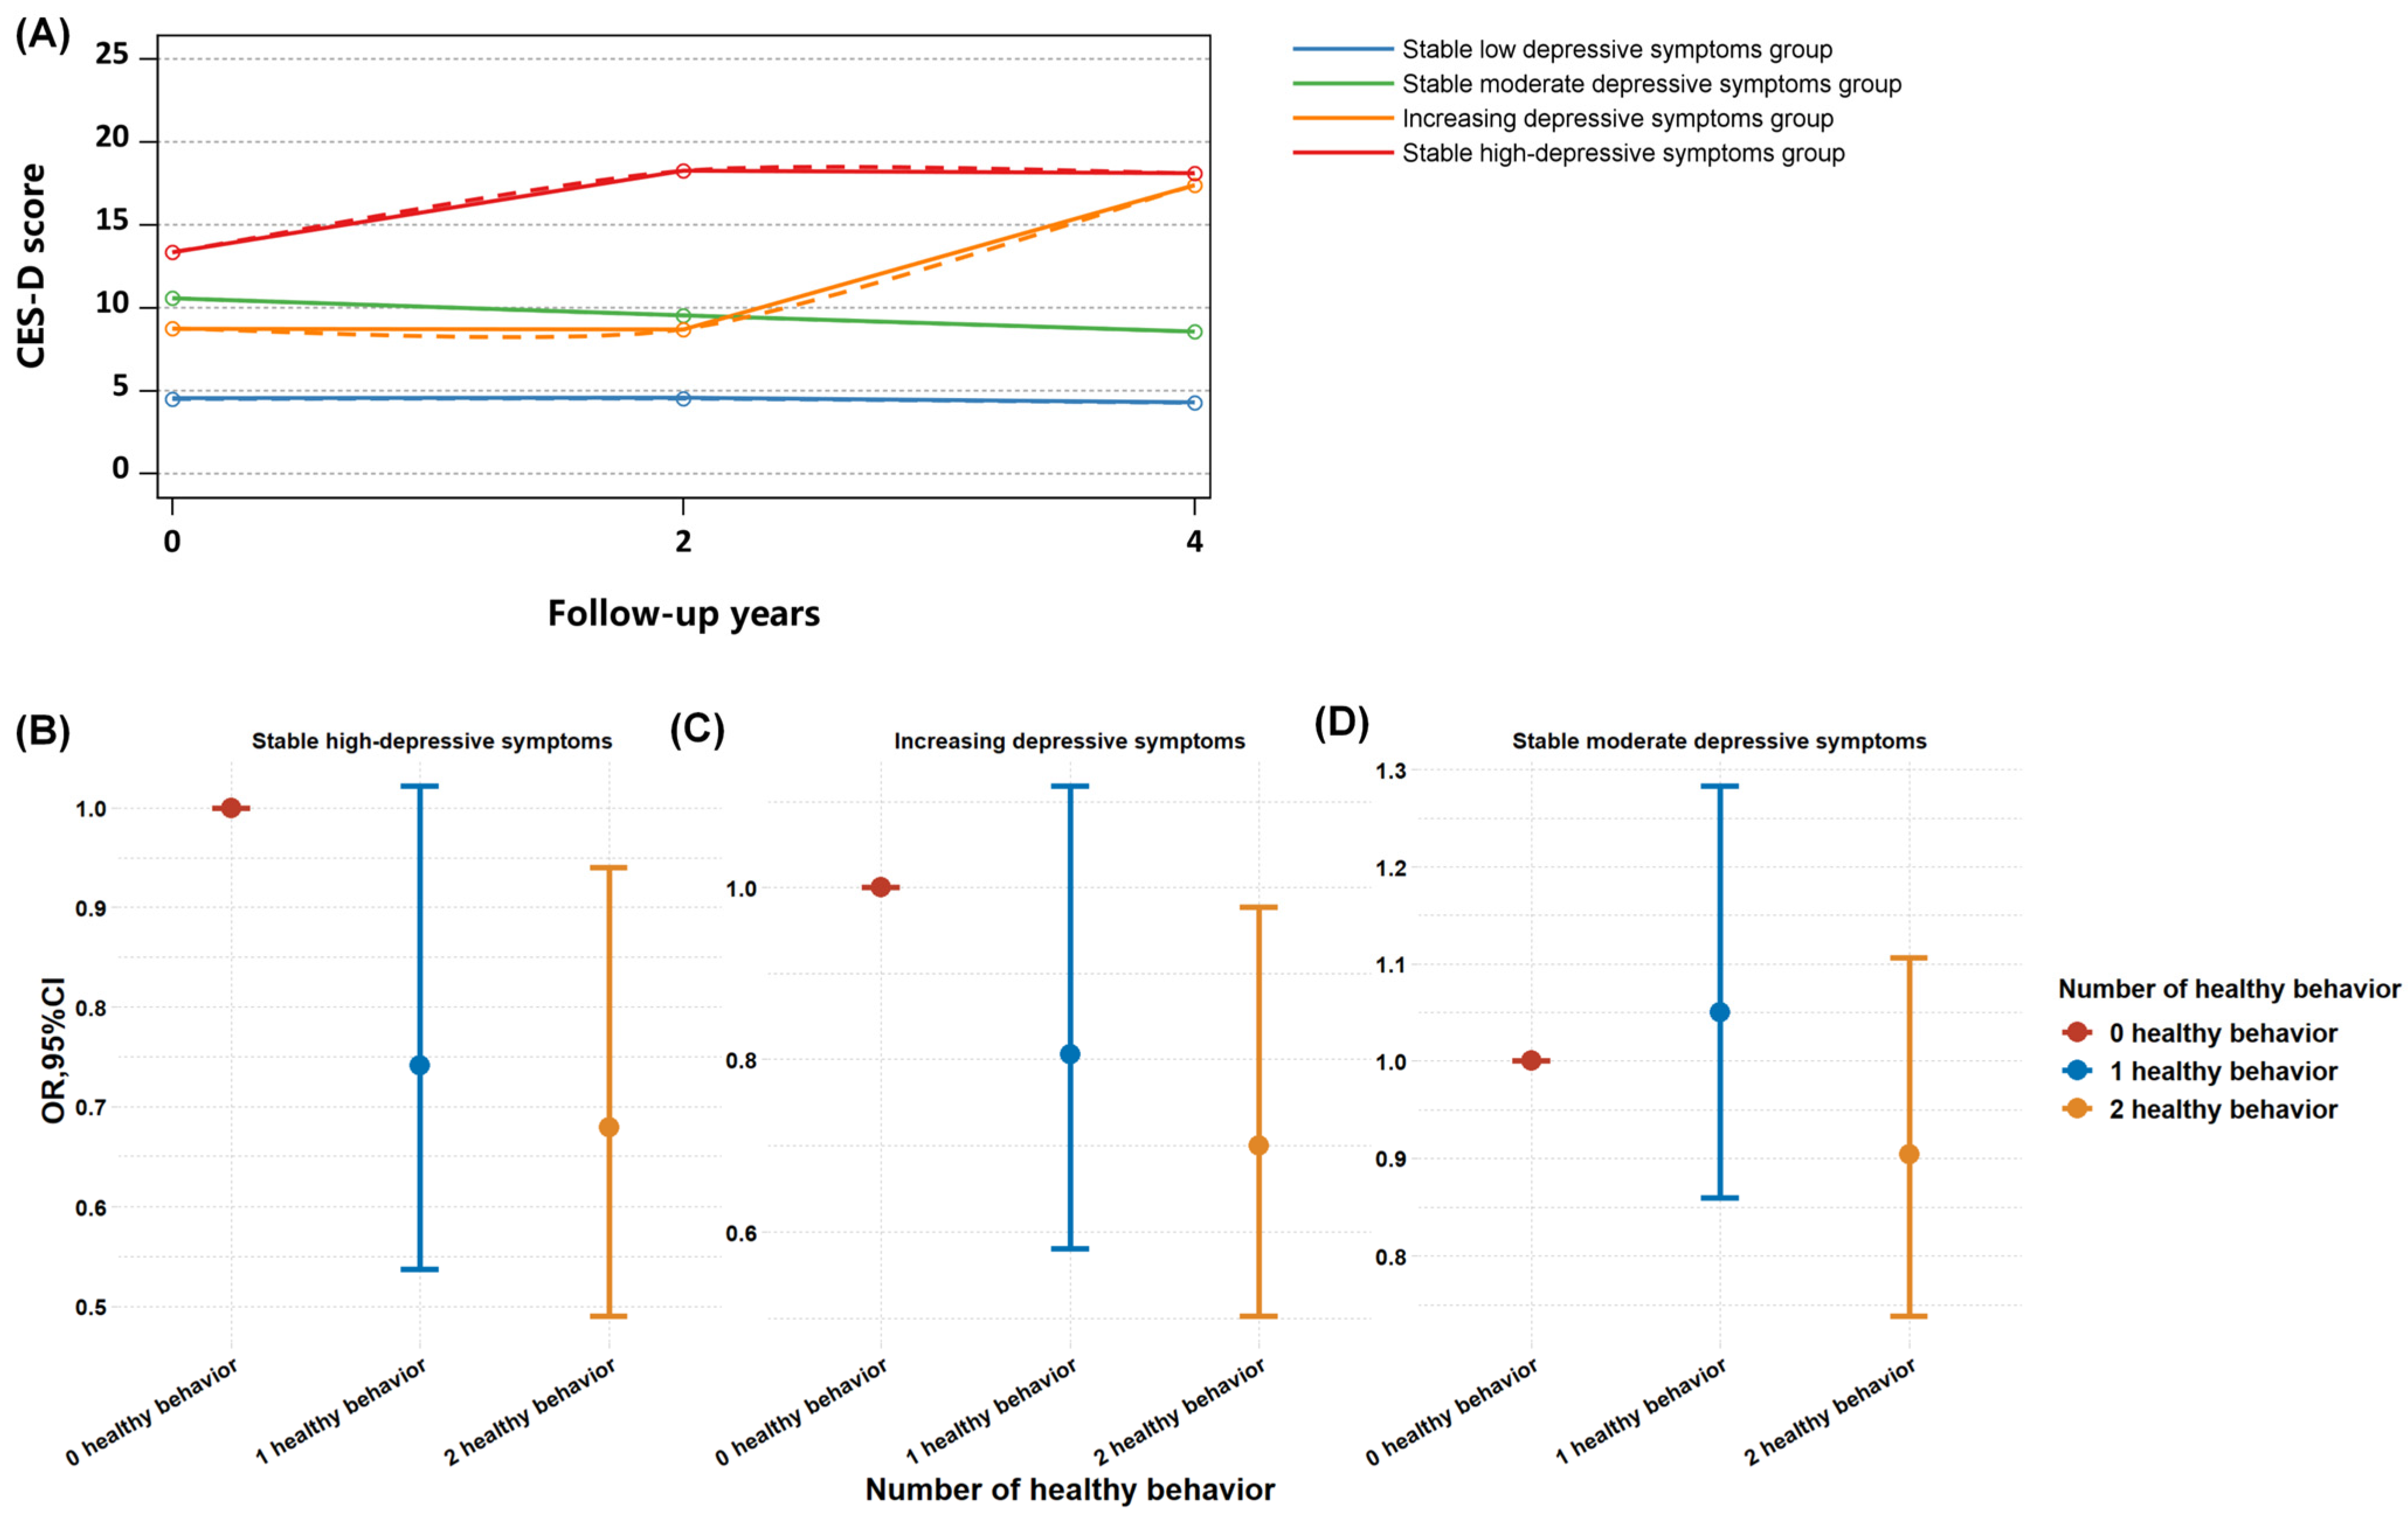
3.2. Predictive Relationship between HbA1c Levels and Longitudinal Trajectories of Depressive Symptoms, and the Ameliorating Impact of Healthy Lifestyles
4. Discussion
5. Conclusions
Supplementary Materials
Author Contributions
Funding
Institutional Review Board Statement
Informed Consent Statement
Data Availability Statement
Conflicts of Interest
References
- Beran, M.; Muzambi, R.; Geraets, A.; Albertorio-Diaz, J.R.; Adriaanse, M.C.; Iversen, M.M.; Kokoszka, A.; Nefs, G.; Nouwen, A.; Pouwer, F.; et al. The bidirectional longitudinal association between depressive symptoms and HbA(1c): A systematic review and meta-analysis. Diabet. Med. A J. Br. Diabet. Assoc. 2022, 39, e14671. [Google Scholar] [CrossRef] [PubMed]
- Alzoubi, A.; Abunaser, R.; Khassawneh, A.; Alfaqih, M.; Khasawneh, A.; Abdo, N. The Bidirectional Relationship between Diabetes and Depression: A Literature Review. Korean J. Fam. Med. 2018, 39, 137–146. [Google Scholar] [CrossRef]
- Joseph, J.J.; Golden, S.H. Cortisol dysregulation: The bidirectional link between stress, depression, and type 2 diabetes mellitus. Ann. N. Y. Acad. Sci. 2017, 1391, 20–34. [Google Scholar] [CrossRef] [PubMed]
- Maina, J.G.; Balkhiyarova, Z.; Nouwen, A.; Pupko, I.; Ulrich, A.; Boissel, M.; Bonnefond, A.; Froguel, P.; Khamis, A.; Prokopenko, I.; et al. Bidirectional Mendelian Randomization and Multiphenotype GWAS Show Causality and Shared Pathophysiology between Depression and Type 2 Diabetes. Diabetes Care 2023, 46, 1707–1714. [Google Scholar] [CrossRef] [PubMed]
- Mukherjee, N.; Chaturvedi, S.K. Depressive symptoms and disorders in type 2 diabetes mellitus. Curr. Opin. Psychiatry 2019, 32, 416–421. [Google Scholar] [CrossRef] [PubMed]
- Renn, B.N.; Feliciano, L.; Segal, D.L. The bidirectional relationship of depression and diabetes: A systematic review. Clin. Psychol. Rev. 2011, 31, 1239–1246. [Google Scholar] [CrossRef] [PubMed]
- Wang, Z.; Du, Z.; Lu, R.; Zhou, Q.; Jiang, Y.; Zhu, H. Causal relationship between diabetes and depression: A bidirectional Mendelian randomization study. J. Affect. Disord. 2024, 351, 956–961. [Google Scholar] [CrossRef] [PubMed]
- Nouwen, A.; Winkley, K.; Twisk, J.; Lloyd, C.E.; Peyrot, M.; Ismail, K.; Pouwer, F. Type 2 diabetes mellitus as a risk factor for the onset of depression: A systematic review and meta-analysis. Diabetologia 2010, 53, 2480–2486. [Google Scholar] [CrossRef]
- Owens-Gary, M.D.; Zhang, X.; Jawanda, S.; Bullard, K.M.; Allweiss, P.; Smith, B.D. The Importance of Addressing Depression and Diabetes Distress in Adults with Type 2 Diabetes. J. Gen. Intern. Med. 2019, 34, 320–324. [Google Scholar] [CrossRef]
- Schram, M.T.; Baan, C.A.; Pouwer, F. Depression and quality of life in patients with diabetes: A systematic review from the European depression in diabetes (EDID) research consortium. Curr. Diabetes Rev. 2009, 5, 112–119. [Google Scholar] [CrossRef]
- Bhattacharya, R.; Shen, C.; Wachholtz, A.B.; Dwibedi, N.; Sambamoorthi, U. Depression treatment decreases healthcare expenditures among working age patients with comorbid conditions and type 2 diabetes mellitus along with newly-diagnosed depression. BMC Psychiatry 2016, 16, 247. [Google Scholar] [CrossRef] [PubMed]
- Wu, C.S.; Hsu, L.Y.; Wang, S.H. Association of depression and diabetes complications and mortality: A population-based cohort study. Epidemiol. Psychiatr. Sci. 2020, 29, e96. [Google Scholar] [CrossRef] [PubMed]
- Liu, Y.T.; Lin, L.Y.; Tuan, C.W.; Yang, C.Y.; Tang, P.L. Analyzing the Association HbA1c control by Depression, social participation and Utilizing Self-management Questionnaire. Diabetes Res. Clin. Pract. 2019, 153, 103–110. [Google Scholar] [CrossRef] [PubMed]
- Geraets, A.F.J.; Köhler, S.; Muzambi, R.; Schalkwijk, C.G.; Oenema, A.; Eussen, S.; Dagnelie, P.C.; Stehouwer, C.D.A.; Schaper, N.C.; Henry, R.M.A.; et al. The association of hyperglycaemia and insulin resistance with incident depressive symptoms over 4 years of follow-up: The Maastricht Study. Diabetologia 2020, 63, 2315–2328. [Google Scholar] [CrossRef] [PubMed]
- Li, H.; Wang, A.; Feng, W.; Zheng, D.; Gao, Q.; Tao, L.; Guo, J.; Wang, X.; Li, X.; Wang, W.; et al. Prospective Study of Glycated Hemoglobin and Trajectories of Depressive Symptoms: The China Health and Retirement Longitudinal Study. Aging Dis. 2019, 10, 249–257. [Google Scholar] [CrossRef] [PubMed]
- Schmitz, N.; Deschênes, S.; Burns, R.; Smith, K.J. Depressive symptoms and glycated hemoglobin A1c: A reciprocal relationship in a prospective cohort study. Psychol. Med. 2016, 46, 945–955. [Google Scholar] [CrossRef] [PubMed]
- Kampling, H.; Mittag, O.; Herpertz, S.; Baumeister, H.; Kulzer, B.; Petrak, F. Can trajectories of glycemic control be predicted by depression, anxiety, or diabetes-related distress in a prospective cohort of adults with newly diagnosed type 1 diabetes? Results of a five-year follow-up from the German multicenter diabetes cohort study (GMDC-Study). Diabetes Res. Clin. Pract. 2018, 141, 106–117. [Google Scholar] [CrossRef] [PubMed]
- Rassart, J.; Luyckx, K.; Berg, C.A.; Bijttebier, P.; Moons, P.; Weets, I. Psychosocial functioning and glycemic control in emerging adults with Type 1 diabetes: A 5-year follow-up study. Health Psychol. Off. J. Div. Health Psychol. Am. Psychol. Assoc. 2015, 34, 1058–1065. [Google Scholar] [CrossRef]
- Aikens, J.E.; Perkins, D.W.; Lipton, B.; Piette, J.D. Longitudinal analysis of depressive symptoms and glycemic control in type 2 diabetes. Diabetes Care 2009, 32, 1177–1181. [Google Scholar] [CrossRef]
- Chiu, C.J.; Du, Y.F. Longitudinal investigation of the reciprocal relationship between depressive symptoms and glycemic control: The moderation effects of sex and perceived support. J. Diabetes Investig. 2019, 10, 801–808. [Google Scholar] [CrossRef]
- Blodgett, J.M.; Mitchell, J.J.; Stamatakis, E.; Chastin, S.; Hamer, M. Associations between the composition of daily time spent in physical activity, sedentary behaviour and sleep and risk of depression: Compositional data analyses of the 1970 British cohort Study. J. Affect. Disord. 2023, 320, 616–620. [Google Scholar] [CrossRef] [PubMed]
- Cao, Z.; Xu, C.; Zhang, P.; Wang, Y. Associations of sedentary time and physical activity with adverse health conditions: Outcome-wide analyses using isotemporal substitution model. EClinicalMedicine 2022, 48, 101424. [Google Scholar] [CrossRef] [PubMed]
- Sampasa-Kanyinga, H.; Colman, I.; Goldfield, G.S.; Janssen, I.; Wang, J.; Podinic, I.; Tremblay, M.S.; Saunders, T.J.; Sampson, M.; Chaput, J.P. Combinations of physical activity, sedentary time, and sleep duration and their associations with depressive symptoms and other mental health problems in children and adolescents: A systematic review. Int. J. Behav. Nutr. Phys. Act. 2020, 17, 72. [Google Scholar] [CrossRef]
- Zou, Y.; Meng, F.; Yan, X. The combined association of adherence to recommended physical activity and glycemic control with depression: An exploratory study with mediation and moderation models. BMC Public Health 2023, 23, 2146. [Google Scholar] [CrossRef] [PubMed]
- Blodgett, J.M.; Ahmadi, M.N.; Atkin, A.J.; Chastin, S.; Chan, H.W.; Suorsa, K.; Bakker, E.A.; Hettiarcachchi, P.; Johansson, P.J.; Sherar, L.B.; et al. Device-measured physical activity and cardiometabolic health: The Prospective Physical Activity, Sitting, and Sleep (ProPASS) consortium. Eur. Heart J. 2024, 45, 458–471. [Google Scholar] [CrossRef] [PubMed]
- Zhai, L.; Zhang, H.; Zhang, D. Sleep duration and depression among adults: A meta-analysis of prospective studies. Depress. Anxiety 2015, 32, 664–670. [Google Scholar] [CrossRef]
- Carney, C.E.; Edinger, J.D.; Kuchibhatla, M.; Lachowski, A.M.; Bogouslavsky, O.; Krystal, A.D.; Shapiro, C.M. Cognitive Behavioral Insomnia Therapy for Those With Insomnia and Depression: A Randomized Controlled Clinical Trial. Sleep 2017, 40. [Google Scholar] [CrossRef] [PubMed]
- Antza, C.; Kostopoulos, G.; Mostafa, S.; Nirantharakumar, K.; Tahrani, A. The links between sleep duration, obesity and type 2 diabetes mellitus. J. Endocrinol. 2021, 252, 125–141. [Google Scholar] [CrossRef] [PubMed]
- Lee, S.W.H.; Ng, K.Y.; Chin, W.K. The impact of sleep amount and sleep quality on glycemic control in type 2 diabetes: A systematic review and meta-analysis. Sleep Med. Rev. 2017, 31, 91–101. [Google Scholar] [CrossRef]
- Shan, Z.; Ma, H.; Xie, M.; Yan, P.; Guo, Y.; Bao, W.; Rong, Y.; Jackson, C.L.; Hu, F.B.; Liu, L. Sleep duration and risk of type 2 diabetes: A meta-analysis of prospective studies. Diabetes Care 2015, 38, 529–537. [Google Scholar] [CrossRef]
- Liu, J.; Richmond, R.C.; Bowden, J.; Barry, C.; Dashti, H.S.; Daghlas, I.; Lane, J.M.; Jones, S.E.; Wood, A.R.; Frayling, T.M.; et al. Assessing the Causal Role of Sleep Traits on Glycated Hemoglobin: A Mendelian Randomization Study. Diabetes Care 2022, 45, 772–781. [Google Scholar] [CrossRef] [PubMed]
- Zhao, Y.; Hu, Y.; Smith, J.P.; Strauss, J.; Yang, G. Cohort profile: The China Health and Retirement Longitudinal Study (CHARLS). Int. J. Epidemiol. 2014, 43, 61–68. [Google Scholar] [CrossRef] [PubMed]
- Andresen, E.M.; Malmgren, J.A.; Carter, W.B.; Patrick, D.L. Screening for depression in well older adults: Evaluation of a short form of the CES-D (Center for Epidemiologic Studies Depression Scale). Am. J. Prev. Med. 1994, 10, 77–84. [Google Scholar] [CrossRef] [PubMed]
- Zhou, L.; Ma, X.; Wang, W. Relationship between Cognitive Performance and Depressive Symptoms in Chinese Older Adults: The China Health and Retirement Longitudinal Study (CHARLS). J. Affect. Disord. 2021, 281, 454–458. [Google Scholar] [CrossRef] [PubMed]
- Chen, H.; Mui, A.C. Factorial validity of the Center for Epidemiologic Studies Depression Scale short form in older population in China. Int. Psychogeriatr. 2014, 26, 49–57. [Google Scholar] [CrossRef] [PubMed]
- Chen, R.; Chen, Q.; Lu, G.; Zhang, M.; Zhang, M.; Yang, H.; Qi, K.; Yu, H.; Zheng, M.; He, Q. Sleep duration and depressive symptoms in Chinese middle-aged and older adults: The moderating effects of grip strength. J. Affect. Disord. 2023, 339, 348–354. [Google Scholar] [CrossRef] [PubMed]
- Gao, Y.; Jia, Z.; Zhao, L.; Han, S. The Effect of Activity Participation in Middle-Aged and Older People on the Trajectory of Depression in Later Life: National Cohort Study. JMIR Public Health Surveill. 2023, 9, e44682. [Google Scholar] [CrossRef] [PubMed]
- McCarthy, M.; Edwardson, C.L.; Davies, M.J.; Henson, J.; Gray, L.; Khunti, K.; Yates, T. Change in Sedentary Time, Physical Activity, Bodyweight, and HbA1c in High-Risk Adults. Med. Sci. Sports Exerc. 2017, 49, 1120–1125. [Google Scholar] [CrossRef] [PubMed]
- Hamer, M.; Batty, G.D.; Kivimaki, M. Haemoglobin A1c, fasting glucose and future risk of elevated depressive symptoms over 2 years of follow-up in the English Longitudinal Study of Ageing. Psychol. Med. 2011, 41, 1889–1896. [Google Scholar] [CrossRef]
- Tombaugh, T.N.; McIntyre, N.J. The mini-mental state examination: A comprehensive review. J. Am. Geriatr. Soc. 1992, 40, 922–935. [Google Scholar] [CrossRef]
- Selig, J.P.; Little, T.D. Autoregressive and cross-lagged panel analysis for longitudinal data. In Handbook of Developmental Research Methods; The Guilford Press: New York, NY, USA, 2012. [Google Scholar]
- Jones, B.L.; Nagin, D.S.; Roeder, K. A SAS procedure based on mixture models for estimating developmental trajectories. Sociol. Methods Res. 2001, 29, 374–393. [Google Scholar] [CrossRef]
- Zhang, T.; Zhang, H.; Li, Y.; Sun, D.; Li, S.; Fernandez, C.; Qi, L.; Harville, E.; Bazzano, L.; He, J.; et al. Temporal Relationship between Childhood Body Mass Index and Insulin and Its Impact on Adult Hypertension: The Bogalusa Heart Study. Hypertension 2016, 68, 818–823. [Google Scholar] [CrossRef] [PubMed]
- Gal, A.M.; Arhire, L.I.; Gherasim, A.; Graur, M.; Nita, O.; Dumitrascu, O.; Soimaru, R.M.; Popa, A.D.; Mihalache, L. Association between Diet Quality and Eating Behavior in Type 2 Diabetes Adults: A Cross-Sectional Study. Nutrients 2024, 16, 2047. [Google Scholar] [CrossRef] [PubMed]
- Zaki, S.; Alam, M.F.; Sharma, S.; El-Ashker, S.; Ahsan, M.; Nuhmani, S. Impact of Concurrent Exercise Training on Cardiac Autonomic Modulation, Metabolic Profile, Body Composition, Cardiorespiratory Fitness, and Quality of Life in Type 2 Diabetes with Cardiac Autonomic Neuropathy: A Randomized Controlled Trial. J. Clin. Med. 2024, 13, 3910. [Google Scholar] [CrossRef] [PubMed]
- Pantanetti, P.; Cangelosi, G.; Alberti, S.; Di Marco, S.; Michetti, G.; Cerasoli, G.; Di Giacinti, M.; Coacci, S.; Francucci, N.; Petrelli, F.; et al. Changes in body weight and composition, metabolic parameters, and quality of life in patients with type 2 diabetes treated with subcutaneous semaglutide in real-world clinical practice. Front. Endocrinol. 2024, 15, 1394506. [Google Scholar] [CrossRef] [PubMed]
- Huttunen-Lenz, M.; Hansen, S.; Raben, A.; Westerterp-Plantenga, M.; Adam, T.; Macdonald, I.; Stratton, G.; Swindell, N.; Martinez, J.A.; Navas-Carretero, S.; et al. Hybrid Evaluation of a Lifestyle Change Program to Prevent the Development of Type 2 Diabetes Among Individuals With Prediabetes: Intended and Observed Changes in Intervening Mechanisms. J. Prim. Care Community Health 2024, 15, 21501319241248223. [Google Scholar] [CrossRef] [PubMed]
- Mallon, L.; Broman, J.-E.; Hetta, J. High incidence of diabetes in men with sleep complaints or short sleep duration: A 12-year follow-up study of a middle-aged population. Diabetes Care 2005, 28, 2762–2767. [Google Scholar] [CrossRef] [PubMed]
- Mezuk, B.; Eaton, W.W.; Albrecht, S.; Golden, S.H. Depression and type 2 diabetes over the lifespan: A meta-analysis. Diabetes Care 2008, 31, 2383–2390. [Google Scholar] [CrossRef]
- Ringin, E.; Dunstan, D.W.; Meyer, D.; McIntyre, R.S.; Owen, N.; Berk, M.; Hallgren, M.; Rossell, S.L.; Van Rheenen, T.E. Relative associations of behavioral and physiological risks for cardiometabolic disease with cognition in bipolar disorder during mid and later-life: Findings from the UK biobank. Psychol. Med. 2024, 1–11. [Google Scholar] [CrossRef]
- Firth, J.; Solmi, M.; Wootton, R.E.; Vancampfort, D.; Schuch, F.B.; Hoare, E.; Gilbody, S.; Torous, J.; Teasdale, S.B.; Jackson, S.E.; et al. A meta-review of “lifestyle psychiatry”: The role of exercise, smoking, diet and sleep in the prevention and treatment of mental disorders. World Psychiatry Off. J. World Psychiatr. Assoc. (WPA) 2020, 19, 360–380. [Google Scholar] [CrossRef]
- Luo, Y.; Li, Y.; Xie, J.; Duan, Y.; Gan, G.; Zhou, Y.; Luo, X.; Wang, J.; Chen, Z.; Zhang, Q.; et al. Symptoms of depression are related to sedentary behavior and sleep duration in elderly individuals: A cross-sectional study of 49,317 older Chinese adults. J. Affect. Disord. 2022, 308, 407–412. [Google Scholar] [CrossRef]
- Wagner, J.A.; Bermúdez-Millán, A.; Buckley, T.E.; Buxton, O.M.; Feinn, R.S.; Kong, S.; Kuoch, T.; Master, L.; Scully, M.F. Secondary analysis of a randomized trial testing community health educator interventions for diabetes prevention among refugees with depression: Effects on nutrition, physical activity and sleep. Int. J. Behav. Nutr. Phys. Act. 2023, 20, 107. [Google Scholar] [CrossRef]
- Zhang, H.; Zhang, Y.; Sheng, S.; Xing, Y.; Mou, Z.; Zhang, Y.; Shi, Z.; Yu, Z.; Gao, Q.; Cai, W.; et al. Relationship between Physical Exercise and Cognitive Impairment Among Older Adults with Type 2 Diabetes: Chain Mediating Roles of Sleep Quality and Depression. Psychol. Res. Behav. Manag. 2023, 16, 817–828. [Google Scholar] [CrossRef]


| Characteristic | Total |
|---|---|
| Age (years), (mean ± SD) | 57.66 ± 9.04 |
| Gender, N (%) | |
| Male | 2583 (46.32) |
| Female | 2994 (53.68) |
| Residential area, N (%) | |
| Urban | 1815 (32.54) |
| Rural | 3762 (67.46) |
| Education, N (%) | |
| Illiterate | 1572 (28.19) |
| Primary school | 2269 (40.68) |
| Middle school | 1173 (21.03) |
| High school/vocational high school | 505 (9.06) |
| Junior college or above | 58 (1.04) |
| Average household income (CNY), N (%) | |
| <1000 | 2552 (45.76) |
| 1000–5000 | 754 (13.52) |
| 5000–10,000 | 404 (7.24) |
| 10,000–20,000 | 523 (9.38) |
| >20,000 | 1344 (24.10) |
| Marital status, N (%) | |
| Married | 4584 (82.19) |
| Separated | 241 (4.32) |
| Unmarried/divorced/widowed | 752 (13.48) |
| Ever/current smoke, N (%) | |
| No | 3130 (56.12) |
| Yes | 1500 (26.90) |
| Ever smoke | 947 (16.98) |
| Ever/current alcohol, N (%) | |
| No | 3050 (54.69) |
| Yes | 1834 (32.89) |
| Ever alcohol | 93 (12.43) |
| Daily sleep time (hours, mean ± SD) | 6.35 ± 1.47 |
| Physical comorbidities, N (%) | |
| No | 1658 (30.79) |
| Yes | 3727 (69.21) |
| MMSE score, (median, Q25–Q75) | 15.00 (12.00, 17.50) |
| BMI (kg/m2, mean ± SD) | 24.40 (33.61) |
| CES-D-10 score at wave 1 (median, Q25–Q75) | 7.00 (4.00, 12.00) |
| CES-D-10 score at wave 2 (median, Q25–Q75) | 7.00 (4.00, 11.00) |
| CES-D-10 score at wave 3 (median, Q25–Q75) | 7.00 (3.00, 12.00) |
| Healthy lifestyle, N (%) | |
| 0–1 healthy lifestyle | 3178 (56.98) |
| 2 healthy lifestyle | 2399 (43.02) |
| With diabetes, N (%) | |
| No | 5244 (94.03) |
| Yes | 333 (5.97) |
| Taken medicine for diabetes, N (%) | 182 (3.26) |
| HbA1C (mmol/L, mean ± SD) | 5.23 ± 0.75 |
| HbA1C levels | |
| <6.4% mmol/L | 5344 (95.82) |
| 6.4%~8.0% mmol/L | 154 (2.76) |
| >8.0% mmol/L | 79 (1.42) |
| Variables | LSD Group (N = 4809) | SMD Group (N = 2759) | ID Group (N = 616) | SHD Group (N = 642) | Total (N = 8826) | p Value * |
|---|---|---|---|---|---|---|
| Age (years), (mean ±SD) | 57.76 ± 9.26 | 58.64 ± 9.51 | 59.01 ± 9.31 | 57.95 ± 8.71 | 58.14 ± 9.31 | <0.001 |
| Gender, N (%) | ||||||
| Male | 2578 (53.61) | 1115 (40.41) | 217 (35.23) | 193 (30.06) | 4103 (46.49) | <0.001 |
| Female | 2231 (46.39) | 1644 (59.59) | 399 (64.77) | 449 (69.94) | 4723 (53.51) | |
| Residential area, N (%) | ||||||
| Urban | 1979 (41.15) | 895 (32.44) | 154 (25.00) | 175 (27.26) | 3203 (36.29) | <0.001 |
| Rural | 2830 (58.85) | 1864 (67.56) | 462 (75.00) | 467 (72.74) | 5623 (63.71) | |
| Education, N (%) | ||||||
| Illiterate | 1081 (22.48) | 826 (29.94) | 226 (36.69) | 243 (37.85) | 2376 (26.92) | <0.001 |
| Primary school | 1871 (38.91) | 1237 (44.84) | 261 (42.37) | 280 (43.61) | 3649 (41.34) | |
| Middle school | 1163 (24.18) | 495 (17.94) | 98 (15.91) | 84 (13.08) | 1840 (20.85) | |
| High school/vocational high school | 610 (12.68) | 181 (6.56) | 30 (4.87) | 34 (5.30) | 855 (9.69) | |
| Junior college or above | 84 (1.75) | 20 (0.72) | 1 (0.16) | 1 (0.16) | 106 (1.20) | |
| Average household income (CNY), N (%) | ||||||
| <1000 | 2276 (47.33) | 1259 (45.63) | 260 (42.21) | 264 (41.12) | 4059 (45.99) | <0.001 |
| 1000–5000 | 501 (10.42) | 412 (14.93) | 81 (13.15) | 104 (16.20) | 1098 (12.44) | |
| 5000–10,000 | 281 (5.84) | 212 (7.68) | 63 (10.23) | 65 (10.12) | 621 (7.04) | |
| 10,000–20,000 | 400 (8.32) | 267 (9.68) | 59 (9.58) | 79 (12.31) | 805 (9.12) | |
| >20,000 | 1351 (28.09) | 609 (22.07) | 153 (24.84) | 130 (20.25) | 2243 (25.41) | |
| Marital status, N (%) | ||||||
| Married | 4110 (85.46) | 2168 (78.58) | 474 (76.95) | 488 (76.01) | 7240 (82.03) | <0.001 |
| Separated | 198 (4.12) | 137 (4.97) | 24 (3.90) | 27 (4.21) | 386 (4.37) | |
| Unmarried/divorced/widowed | 501 (10.42) | 454 (16.46) | 118 (19.16) | 127 (19.78) | 1200 (13.60) | |
| Ever/current smoke, N (%) | ||||||
| No | 2499 (52.00) | 1638 (59.41) | 385 (62.50) | 425 (66.20) | 4947 (56.08) | <0.001 |
| Yes | 1420 (29.55) | 680 (24.66) | 140 (22.73) | 129 (20.09) | 2369 (26.86) | |
| Ever smoke | 887 (18.46) | 439 (15.92) | 91 (14.77) | 88 (13.71) | 1505 (17.06) | |
| Ever/current alcohol, N (%) | ||||||
| No | 2484 (51.69) | 1612 (58.47) | 364 (59.09) | 421 (65.58) | 4881 (55.33) | <0.001 |
| Yes | 1775 (36.93) | 800 (29.02) | 170 (27.60) | 141 (21.96) | 2886 (32.72) | |
| Ever drink alcohol | 547 (11.38) | 345 (12.51) | 82 (13.31) | 80 (12.46) | 1054 (11.95) | |
| Daily sleep time, (hours), (mean ± SD) | 6.40 (1.54) | 6.29 (1.60) | 6.20 (1.59) | 6.25 (1.61) | 6.34 (1.57) | 0.002 |
| Physical comorbidities, N (%) | ||||||
| No | 25 (0.52) | 23 (0.83) | 2 (0.32) | 6 (0.93) | 56 (0.63) | 0.205 |
| Yes | 331 (6.89) | 288 (10.45) | 64 (10.39) | 97 (15.13) | 780 (8.85) | <0.001 |
| MMSE score, (median, Q25–Q75) | 16.00 (13.00, 19.00) | 14.00 (11.00, 17.00) | 13.42 (10.00, 16.00) | 14.00 (10.00, 16.00) | 15.00 (11.50, 18.00) | <0.001 |
| BMI (kg/m2, mean ± SD) | 24.86 ± 37.72 | 23.36 ± 3.92 | 24.37 ± 19.47 | 23.50 ± 5.88 | 24.26 ± 28.47 | 0.153 |
| CES-D-10 score at wave 1 (median, Q25–Q75) | 4.00 (2.00, 6.00) | 11.00 (8.00, 14.00) | 8.00 (5.00, 12.00) | 14.00 (11.00, 17.00) | 7.00 (3.00, 11.00) | <0.001 |
| CES-D-10 score at wave 2 (median, Q25–Q75) | 4.00 (2.00, 6.00) | 11.00 (8.00, 14.00) | 8.00 (5.00, 12.00) | 14.00 (11.00, 17.00) | 7.00 (3.00, 11.00) | <0.001 |
| CES-D-10 score at wave 3 (median, Q25–Q75) | 4.00 (2.00, 6.00) | 9.00 (6.00, 12.00) | 18.00 (16.00, 21.00) | 18.00 (15.00, 21.00) | 6.00 (3.00, 11.00) | <0.001 |
| Healthy lifestyle, N (%) | 0.0212 | |||||
| 0–1 healthy lifestyle | 2205 (45.85) | 1335 (48.39) | 309 (50.16) | 324 (50.47) | ||
| 2 healthy lifestyle | 2604 (54.14) | 1424 (51.61) | 307 (49.84) | 318 (49.53) |
| SHD Group vs. LSD Group, OR (95%CI) | p Value | ID Group vs. LSD Group, OR (95%CI) | p Value | SMD Group vs. LSD Group, OR (95%CI) | p Value | |
|---|---|---|---|---|---|---|
| Overall population (N = 8826) | ||||||
| HbA1c levels | 1.12 (1.01–1.23) | 0.0261 | 1.2 (1.1–1.31) | <0.001 | 1.07 (1.01–1.13) | 0.0271 |
| Middle-aged adults, age < 60 (N = 5185) | ||||||
| HbA1c levels | 1.17 (1.04–1.32) | 0.0113 | 1.22 (1.09–1.38) | 0.0006 | 1.05 (0.97–1.14) | 0.2209 |
| Older adults, age ≥ 60 (N = 3641) | ||||||
| HbA1c levels | 1.02 (0.87–1.2) | 0.8157 | 1.18 (1.03–1.35) | 0.0139 | 1.1 (1.01–1.2) | 0.039 |
| Female adults (N = 4723) | ||||||
| HbA1c levels | 1.11 (0.99–1.25) | 0.0724 | 1.25 (1.13–1.39) | <0.001 | 1.05 (0.97–1.14) | 0.237 |
| Male adults (N = 4103) | ||||||
| HbA1c levels | 1.13 (0.95–1.35) | 0.1802 | 1.09 (0.91–1.3) | 0.3505 | 1.11 (1.02–1.22) | 0.0166 |
| Adherence to healthy lifestyle (N = 4353) | ||||||
| HbA1c levels | 1.00 (0.75–1.32) | 0.9708 | 0.96 (0.71–1.31) | 0.7906 | 1.00(0.84–1.21) | 0.9825 |
| Not adherence to healthy lifestyle (N = 4473) | ||||||
| HbA1c levels | 1.14 (1.01–1.3) | 0.0402 | 1.22 (1.08–1.37) | 0.0014 | 1.06 (0.97–1.15) | 0.2114 |
| Pathway | β | 95% CI | SE | Z | P |
|---|---|---|---|---|---|
| HbA1C levels → depressive symptoms | 0.226 | (0.001, 0.437) | 0.113 | 2.004 | 0.045 |
| Healthy lifestyle → depressive symptoms | −0.815 | (−1.009, −0.602) | 0.104 | −7.805 | <0.001 |
| HbA1C levels → healthy lifestyle → depressive symptoms | −0.027 | (−0.055, −0.002) | 0.014 | −2.033 | 0.042 |
Disclaimer/Publisher’s Note: The statements, opinions and data contained in all publications are solely those of the individual author(s) and contributor(s) and not of MDPI and/or the editor(s). MDPI and/or the editor(s) disclaim responsibility for any injury to people or property resulting from any ideas, methods, instructions or products referred to in the content. |
© 2024 by the authors. Licensee MDPI, Basel, Switzerland. This article is an open access article distributed under the terms and conditions of the Creative Commons Attribution (CC BY) license (https://creativecommons.org/licenses/by/4.0/).
Share and Cite
Zeng, N.; Li, C.; Mei, H.; Wu, S.; Liu, C.; Wang, X.; Bao, Y. Temporal Relationship between HbA1c and Depressive Symptom Trajectories in a Longitudinal Cohort Study: The Mediating Role of Healthy Lifestyles. Brain Sci. 2024, 14, 780. https://doi.org/10.3390/brainsci14080780
Zeng N, Li C, Mei H, Wu S, Liu C, Wang X, Bao Y. Temporal Relationship between HbA1c and Depressive Symptom Trajectories in a Longitudinal Cohort Study: The Mediating Role of Healthy Lifestyles. Brain Sciences. 2024; 14(8):780. https://doi.org/10.3390/brainsci14080780
Chicago/Turabian StyleZeng, Na, Chao Li, Huan Mei, Shuilin Wu, Chang Liu, Xiaokun Wang, and Yanping Bao. 2024. "Temporal Relationship between HbA1c and Depressive Symptom Trajectories in a Longitudinal Cohort Study: The Mediating Role of Healthy Lifestyles" Brain Sciences 14, no. 8: 780. https://doi.org/10.3390/brainsci14080780
APA StyleZeng, N., Li, C., Mei, H., Wu, S., Liu, C., Wang, X., & Bao, Y. (2024). Temporal Relationship between HbA1c and Depressive Symptom Trajectories in a Longitudinal Cohort Study: The Mediating Role of Healthy Lifestyles. Brain Sciences, 14(8), 780. https://doi.org/10.3390/brainsci14080780