
Early Boost of Linguistic Skills? Individualized Non-Invasive Brain Stimulation in Early Postacute Aphasia

Abstract
:1. Introduction
2. Materials and Methods
2.1. Study Design
2.2. Participants
2.3. Clinical Assessment
2.3.1. Language Assessment
- (1)
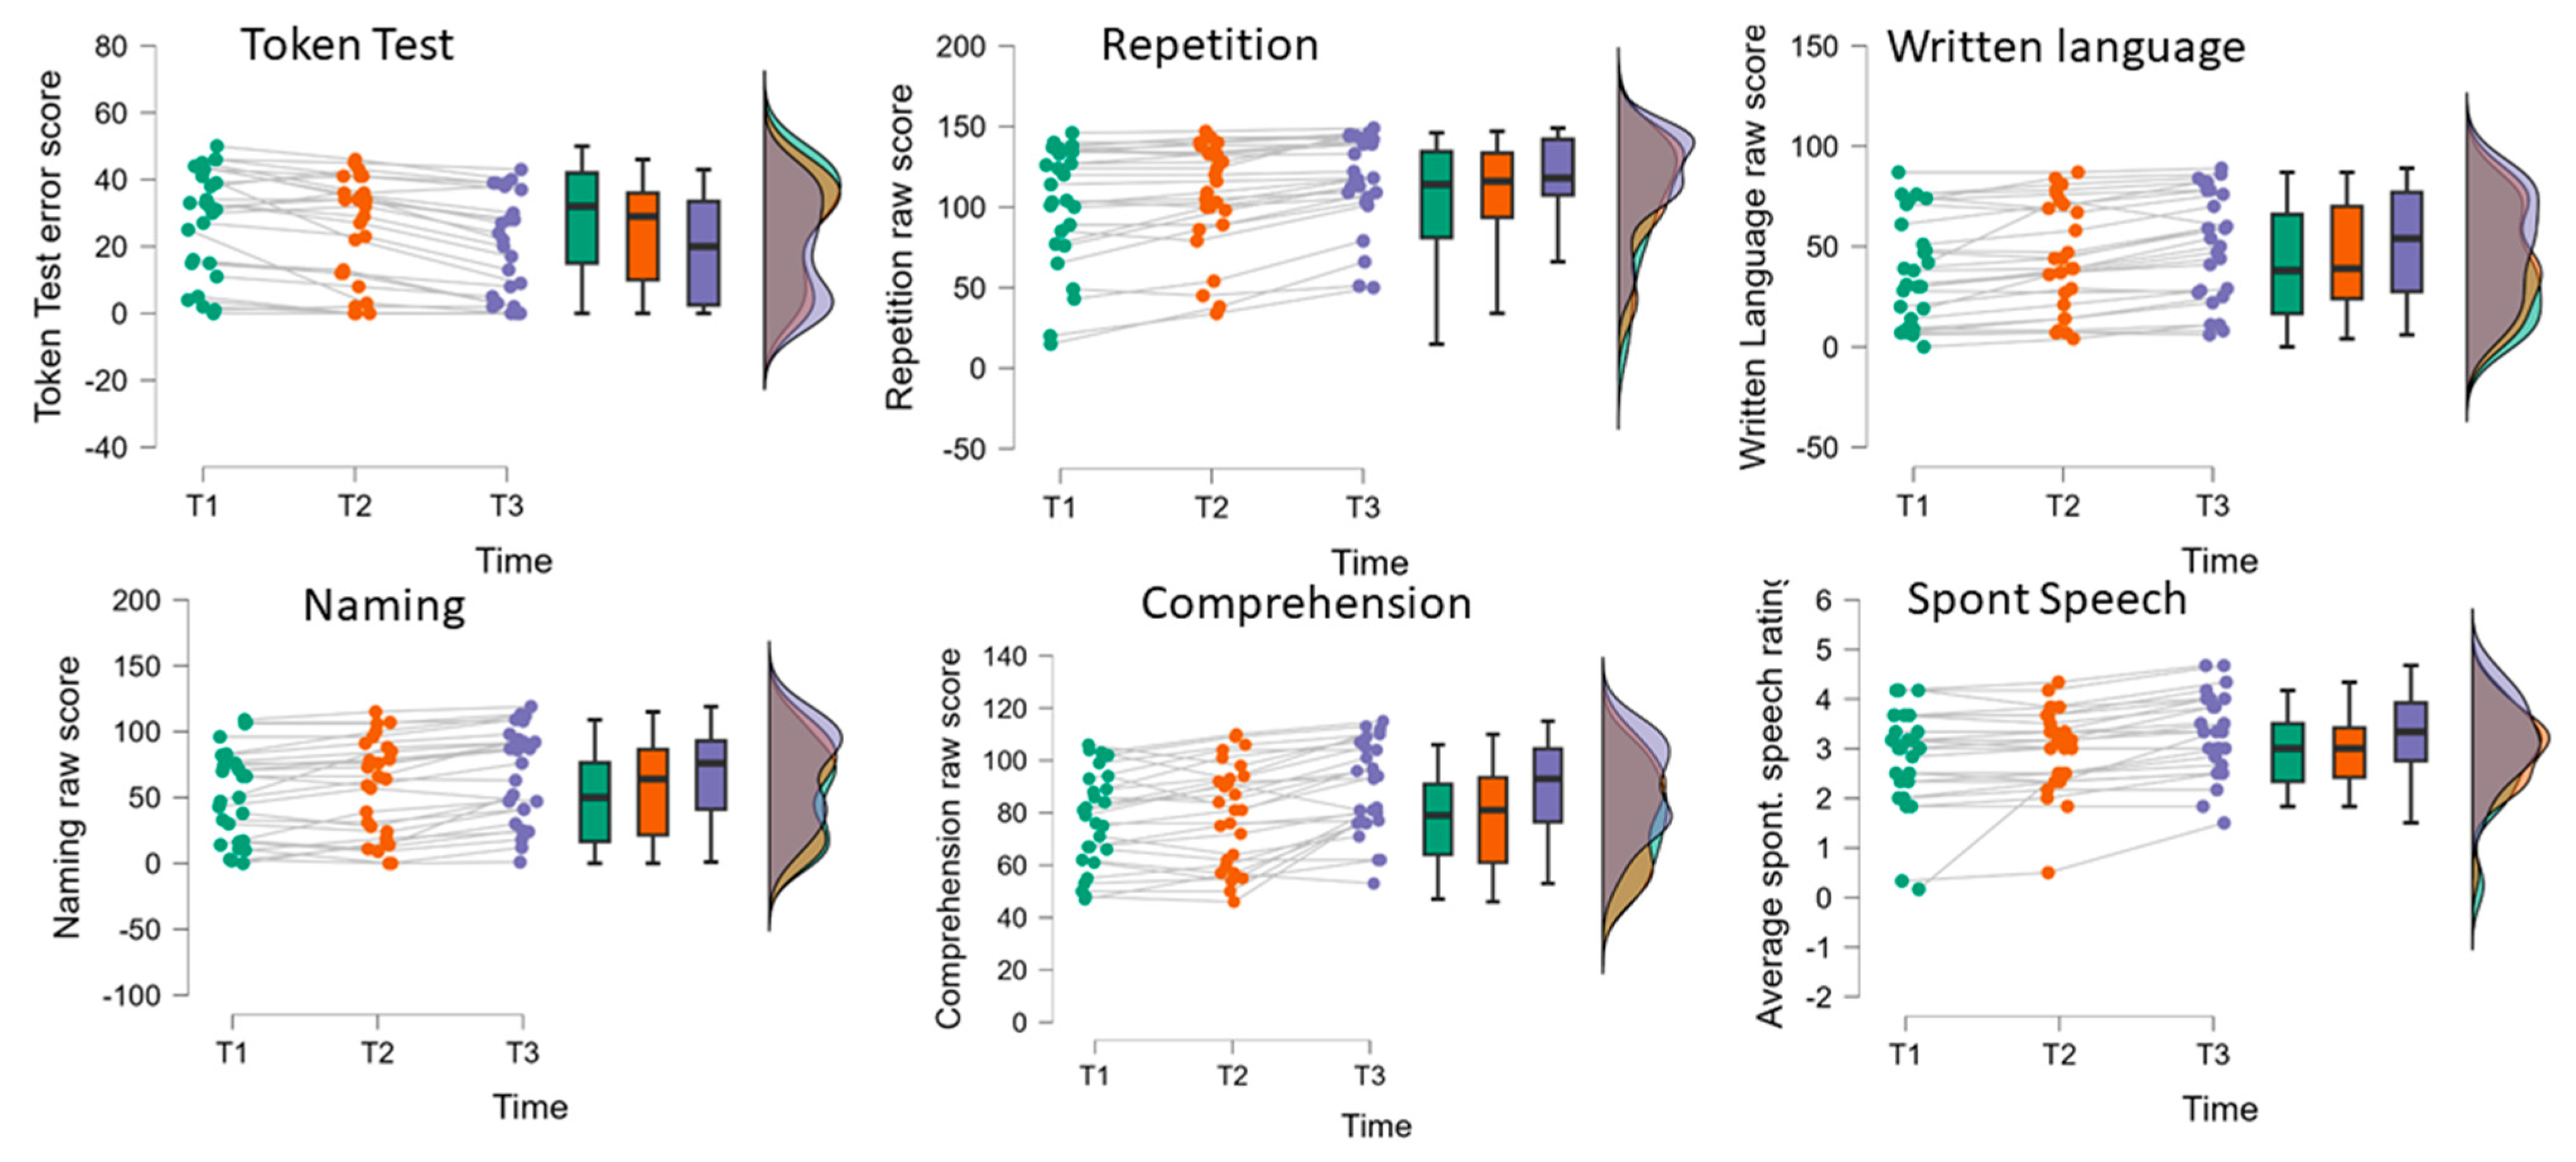
- Participants with the ability to communicate verbally, at least at a basic level (n = 27), were assessed with the Aachen Aphasia Test (AAT) (for a summary presentation of test properties in English, [37]). The AAT includes an evaluation of spontaneous language production on 6-point rating scales and 5 subtests: Token Test (TT), repetition (REP), written language (WRIT) (reading aloud, composing words and sentences from anagrams, writing to dictation), and naming (NAM), as well as auditory and written comprehension (COMP). The AAT allows for a probabilistic decision about the presence of aphasia (yes/no) and a probabilistic assignment to one aphasic type/syndrome, such as global aphasia, Wernicke’s aphasia, Broca’s aphasia, and anomic aphasia. The pattern of severity of impairments is provided in a subtest performance profile with subtest raw scores transformed into T-norm standardized scores for intersubtest comparisons of severity among language functions (T-scores based on a normative sample of 376 PwA). An overall estimate of severity of aphasia is given by the reliability-weighted average T-score across all AAT subtests (the so-called “profile level”). Syndrome-specific estimates for the expected spontaneous recovery from AAT assessments at 1, 4, and 7 months postonset in a historical control study by Willmes and Poeck [43] (see also Luzzatti et al. [44], Supplementary Materials) are available. Based on these data, correction factors were computed for the expected non-linear recovery across each of the two treatment periods P1 and P2 for the T-score profile level and the individual subtest raw scores (see Appendix C for details). Psychometric single-case analysis procedures (see Willmes [45]) were used to test for significant improvement in profile level and individual subtest performances for each individual PwA. A correction for expected spontaneous recovery in profile level and subtest performance can also be included (see Luzzatti et al. [44] for an example). At the group level, observed differences in performance across a therapy period were tested against zero as well as against these correction factors (listed in Appendix A Table A1) to be able to ascertain “pure” treatment effects.
- (2)
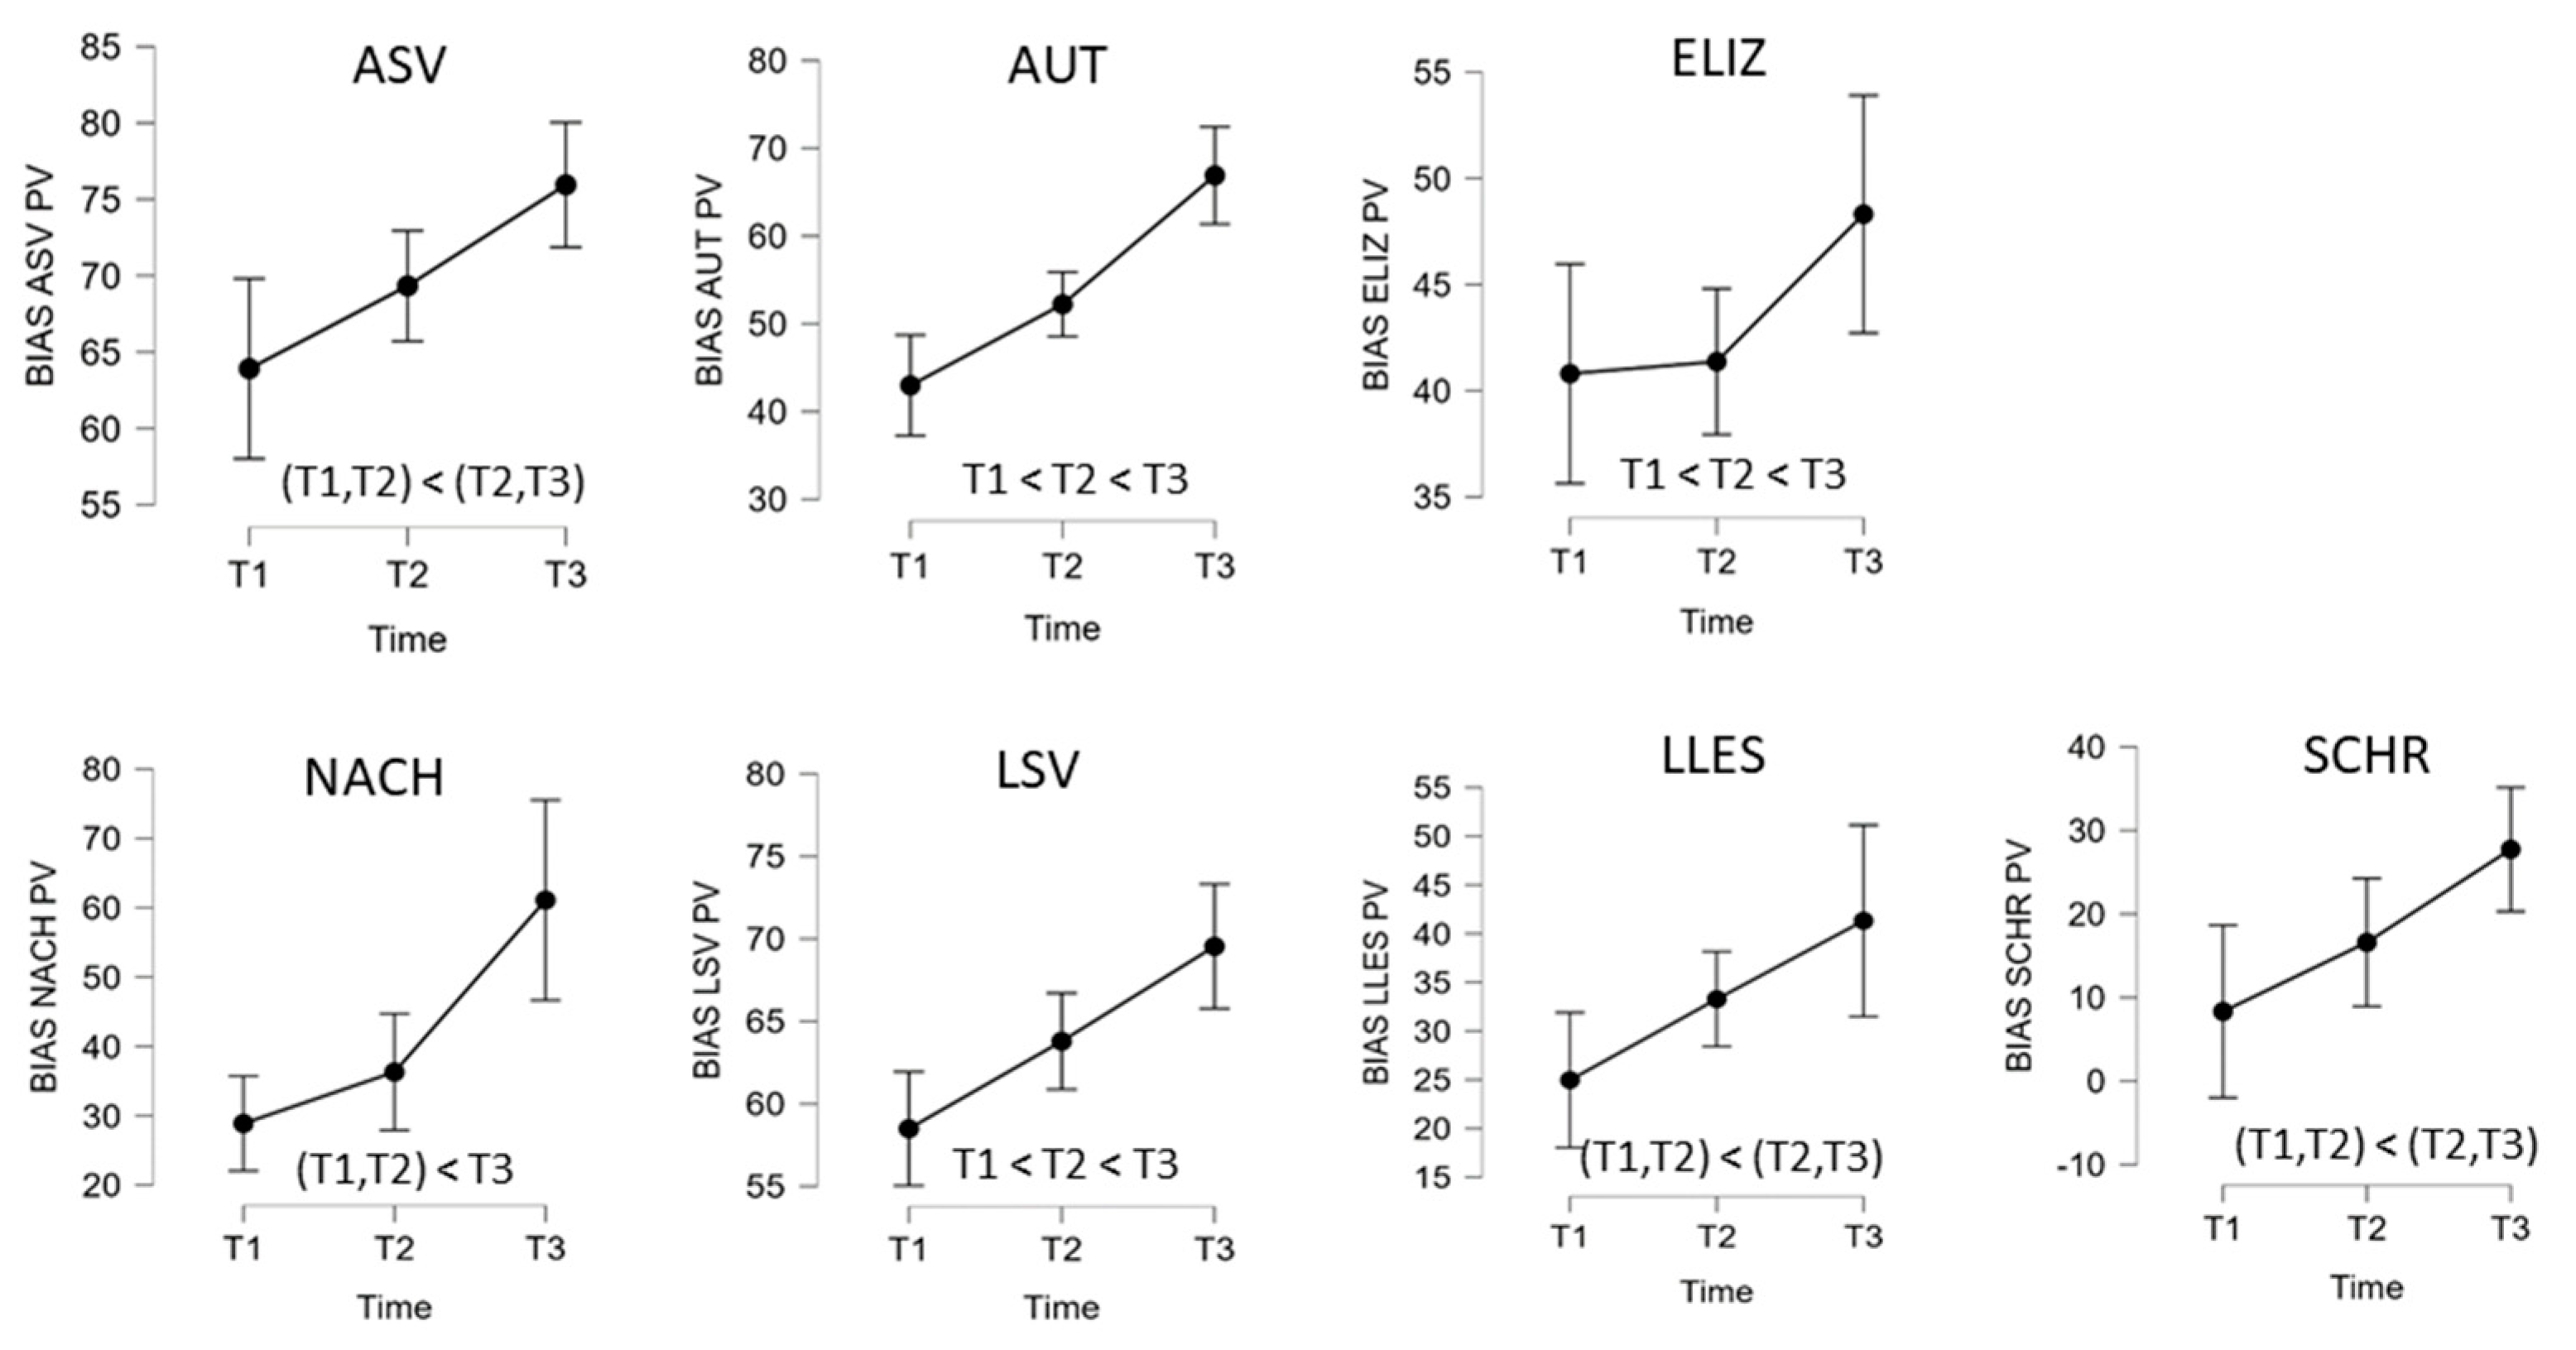
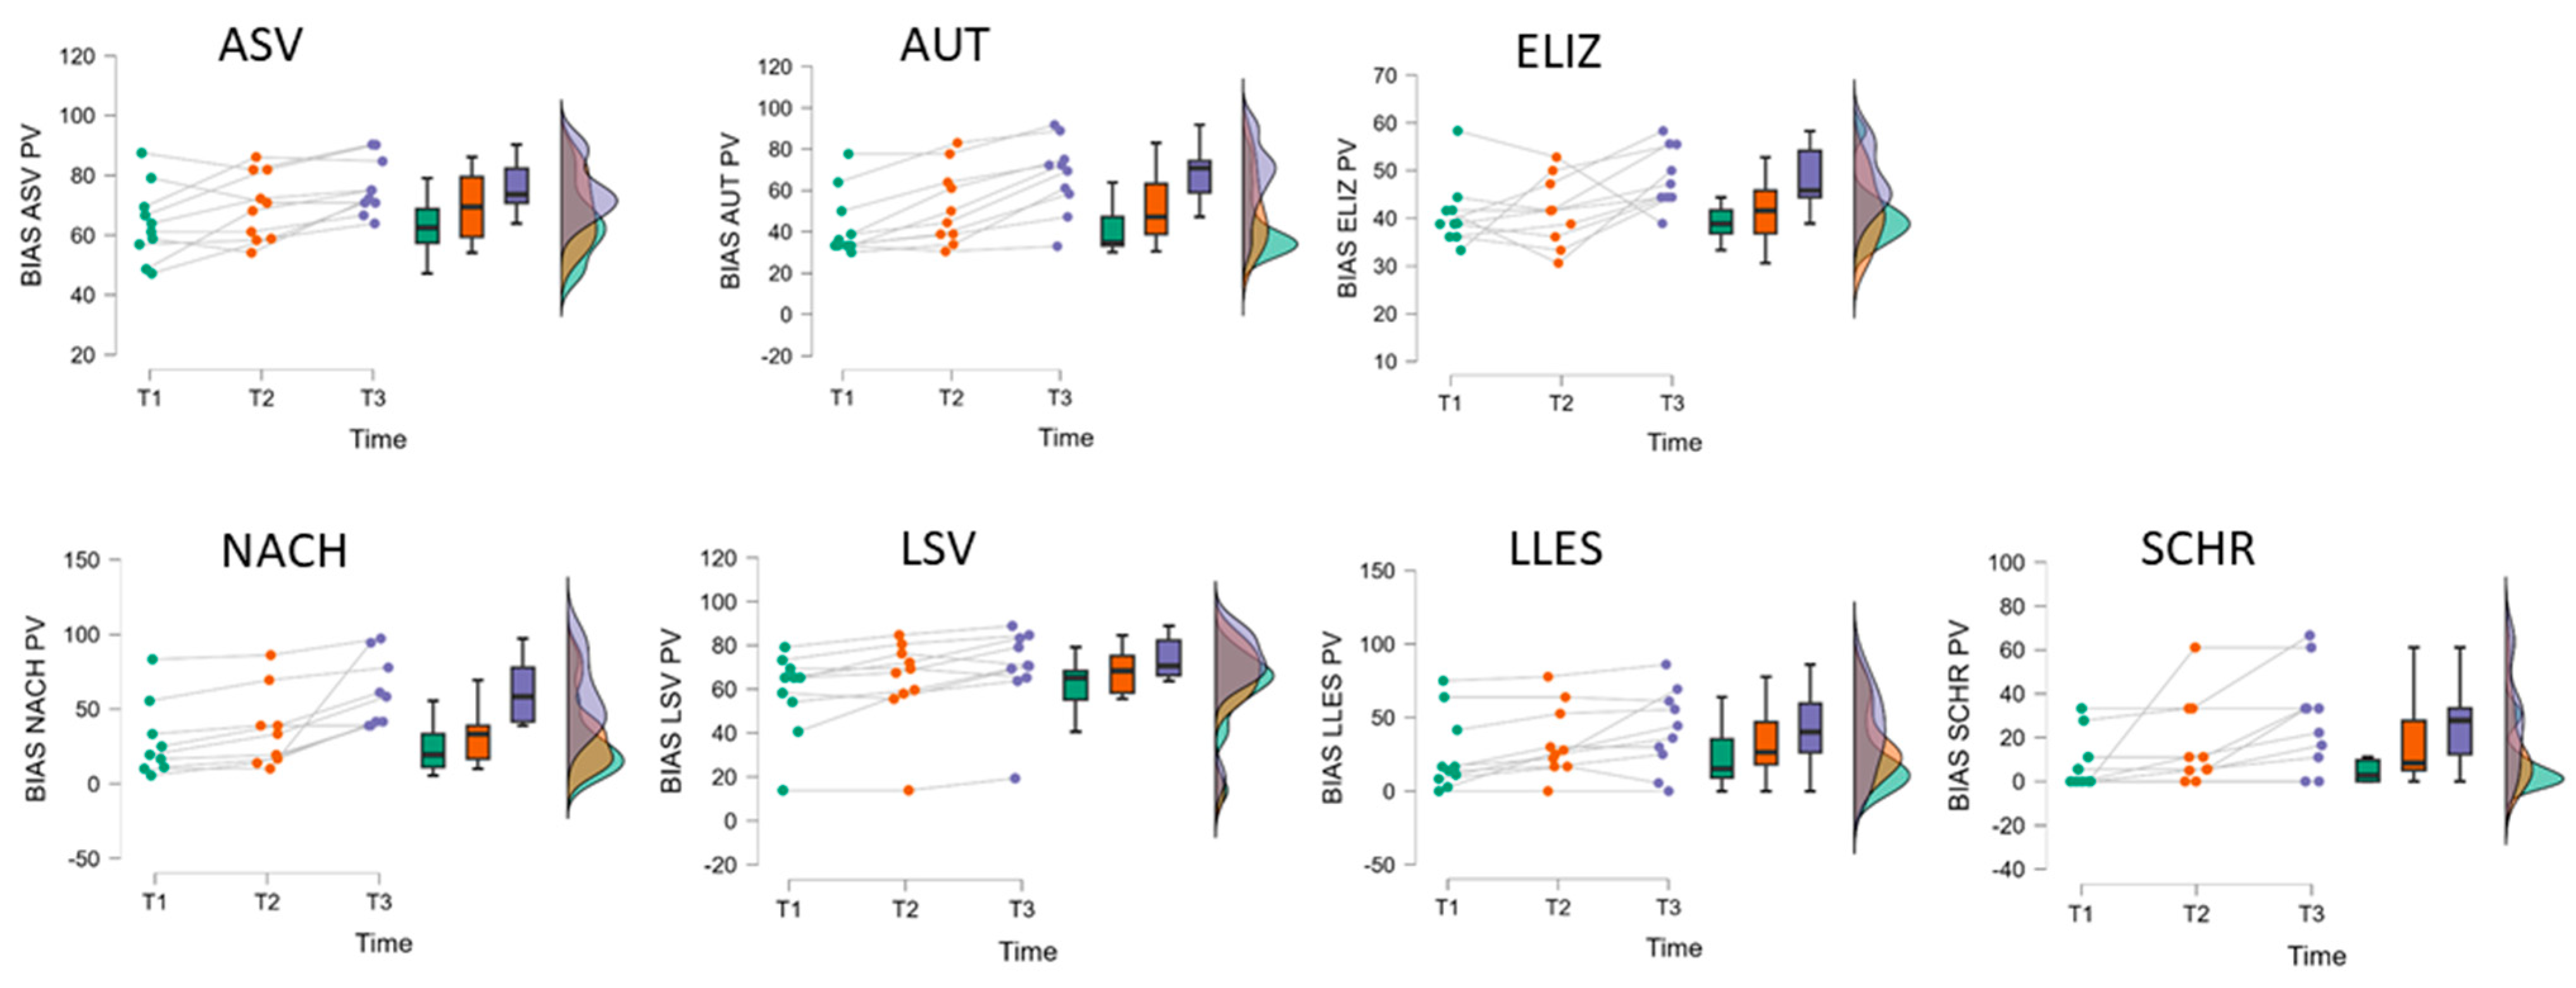
- Participants with severe aphasia or without deliberate verbal-expressive communication skills (for example, due to severe apraxia of speech) were assessed with the Bielefeld Aphasia Screening Rehabilitation (BIAS-R) [46]. The BIAS-R is a linguistic assessment of aphasic impairments for persons with subacute aphasia, but unlike the AAT, it allows cues to provoke and support verbal responses in various subtests. The BIAS-R includes an optional analysis of spontaneous speech and eight subtests: auditory comprehension (ASV), automatic language use (AUT), naming (ELIZ), verbal fluency (WFL), repetition (REP), reading comprehension (LSV), reading aloud (LLES), and writing of words (WRIT). The overall severity of aphasia is determined by the average of the individual subtest percentage-of-maximum-value attained score. This average “raw” score can be transformed into a percentile rank or T-score based on a normative sample of 104 PwA. The test’s authors also provide critical differences for each subtest and the mean percentage value to identify (treatment-related) changes in performance that are probably beyond measurement error for the individual PwA.
2.3.2. Overall Disability and Side Effects
2.4. tDCS Treatment
2.5. Behavioral Therapy
2.6. Statistical Analyses
3. Results
3.1. Group Comparability
3.2. Primary Outcome Measure

| A | AAT | T1 | T2 | T3 | ANOVA Factor Time | Post Hoc Compar. § | ||
| (n = 27) | M (SD) | M (SD) | M (SD) | F(2,52) # | p | η2p | ||
| Profile level (T-norm) | 49.60 (7.02) | 51.04 (7.50) | 54.10 (8.50) | 63.97 | <0.001 | 0.71 | T1 < T2 < T3 | |
| Spont. | Ave. spont. speech rating | 2.83 (1.91) | 2.95 (0.82) | 3.27 (0.82) | 14.08 | <0.001 | 0.35 | (T1,T2) < T3 |
| TT | Token Test (errors) | 27.78 (16.10) | 24.04 (16.24) | 19.00 (15.67) | 25.37 | <0.001 | 0.49 | T1 < T2 < T3 |
| REP | Repetition | 102.70 (37.80) | 107.82 (33.68) | 117.82 (28.77) | 26.98 | <0.001 | 0.51 | T1 < T2 < T3 |
| WRIT | Written language | 39.44 (26.68) | 44.34 (26.76) | 50.56 (26.85) | 33.64 | <0.001 | 0.56 | T1 < T2 < T3 |
| NAM | Naming | 51.74 (35.04) | 56.70 (36.71) | 67.15 (35.39) | 25.41 | <0.001 | 0.49 | T1 < T2 < T3 |
| COMP | Comprehension | 77.33 (18.30) | 79.59 (19.66) | 89.11 (17.44) | 26.64 | <0.001 | 0.51 | (T1,T2) < T3 |
| B | BIAS-R | T1 | T2 | T3 | ANOVA Factor Time | Post Hoc Compar. § | ||
| (n = 10) | M (SD) | M (SD) | M (SD) | F(2,18) # | p | η2p | ||
| Profile level (T-norm) | 37.40 (3.81) | 39.35 (2.97) | 42.35 (2.45) | 35.55 | <0.001 | 0.80 | T1 < T2 < T3 | |
| ASV | Auditory comprehension | 63.91 (12.57) | 69.33 (11.26) | 75.95 (9.35) | 8.64 | 0.002 | 0.49 | (T1,T2) < (T2,T3) |
| AUT | Automated sequences | 42.98 (15.98) | 52.22 (18.39) | 66.90 (17.86) | 29.02 | <0.001 | 0.76 | T1 < T2 < T3 |
| ELIZ | Confrontation naming | 40.80 (6.94) | 41.37 (7.11) | 48.31 (6.31) | 3.85 | 0.041 | 0.30 | (T1,T2,T3) |
| NACH (n = 9) | Repetition | 28.88 (25.39) | 36.30 (26.12) | 61.09 (23.57) | 13.92 | <0.001 | 0.64 | (T1,T2) < T3 |
| LSV | Reading comprehension | 58.49 (18.94) | 63.79 (20.00) | 69.54 (19.59) | 17.24 | <0.001 | 0.66 | T1 < T2 < T3 |
| LLES | Reading aloud | 24.97 (26.14) | 33.28 (24.01) | 41.32 (27.51) | 6.09 | 0.010 | 0.40 | (T1,T2) < (T2,T3) |
| SCHR | Written language | 8.33 (12.35) | 16.60 (19.80) | 27.73 (22.83) | 6.61 | 0.007 | 0.42 | (T1,T2) < (T2,T3) |

3.3. Secondary Outcome Measures
3.4. Correlational Analyses
4. Discussion
4.1. tCDS in Combination with SLT in the Subacute Stage of Aphasia
4.2. Primary Outcome Measures
4.3. Secondary Outcome Measures
4.4. Use of Different Severity-Specific Language Tests
4.5. Stimulation Site
4.6. Implementation in Clinical Practice
4.7. Limitations
5. Conclusions
Author Contributions
Funding
Institutional Review Board Statement
Informed Consent Statement
Data Availability Statement
Acknowledgments
Conflicts of Interest
Abbreviations
| AAT | Aachen Aphasia Test |
| BIAS-R | Bielefeld Aphasia Screening-Reha |
| FIM | Functional Independence Measure |
| FPC | frontopolar cortex |
| IFG | inferior frontal gyrus |
| M1 | primary motor cortex |
| MIC | minimal important changes |
| PwA | person with aphasia |
| PROM | patient-reported outcome measure |
| SLT | speech and language therapy |
| SLP | speech and language pathologist |
| tDCS | transcranial direct current stimulation |
| (r)TMS | repetitive transcranial magnetic stimulation |
Appendix A. Additional Tables
| A | Assessment | Difference | |||||||
| AAT | T1 | T2 | T3 | Period 1 | Period 2 | Period 2 − 1 | Period 1 + 2 | Expected | |
| (n = 27) | M (SD) | M (SD) | M (SD) | M (SD) | M (SD) | M (SD) | M (SD) | P1 | P2 |
| Profile level | 49.60 (7.02) | 51.04 (7.50) | 54.10 (8.50) | 1.43 (81.86) | 3.06 (1.37) | 1.63 (1.61) | 4.50 (2.84) | 1.34 | 0.97 |
| Spont. | 2.83 (1.91) | 2.95 (0.82) | 3.27 (0.82) | 0.12 (0.47) | 0.32 (0.29) | 0.19 (0.56) | 0.44 (0.54) | - | - |
| TT | 27.78 (16.10) | 24.04 (16.24) | 19.00 (15.67) | −3.74 (6.17) | −5.04 (4.23) | −1.30 (6.63) | −8.78 (8.24) | 1.74 | 1.27 |
| REP | 102.70 (37.80) | 107.82 (33.68) | 117.82 (28.77) | 5.11 (8.61) | 10.00 (8.37) | 4.89 (8.82) | 15.11 (14.51) | 3.78 | 2.74 |
| WRIT | 39.44 (26.68) | 44.34 (26.76) | 50.56 (26.85) | 4.93 (7.37) | 6.19 (6.36) | 1.26 (11.62) | 11.11 (7.38) | 3.85 | 2.73 |
| NAM | 51.74 (35.04) | 56.70 (36.71) | 67.15 (35.39) | 4.96 (11.57) | 10.44 (9.33) | 5.48 (16.38) | 15.41 (13.17) | 4.34 | 2.97 |
| COMP | 77.33 (18.30) | 79.59 (19.66) | 89.11 (17.44) | 2.26 (7.37) | 9.52 (9.62) | 7.26 (14.24) | 11.78 (9.53) | 3.34 | 2.42 |
| B | Assessment | Difference | |||||||
| BIAS | T1 | T2 | T3 | Period 1 | Period 2 | Period 2 − 1 | Period 1 + 2 | ||
| (n = 10) | M (SD) | M (SD) | M (SD) | M (SD) | M (SD) | M (SD) | M (SD) | ||
| Profile level | 37.40 (3.81) | 39.35 (2.97) | 42.35 (2.45) | 1.95 (1.52) | 3.00 (1.39) | 1.05 (1.50) | 4.95 (2.50) | ||
| ASV | 63.91 (12.57) | 69.33 (11.26) | 75.95 (9.35) | 5.42 (3.60) | 6.62 (5.70) | 1.20 (12.40) | 12.04 (10.82) | ||
| AUT | 42.98 (15.98) | 52.22 (18.39) | 66.90 (17.86) | 9.25 (8.96) | 14.68 (8.51) | 5.44 (12.53) | 23.93 (12.18) | ||
| ELIZ | 40.80 (6.94) | 41.37 (7.11) | 48.31 (6.31) | 0.57 (7.72) | 6.94 (8.80) | 6.37 (11.76) | 7.51 (11.65) | ||
| NACH (n = 9) | 28.88 (25.39) | 36.30 (26.12) | 61.09 (23.57) | 7.42 (5.38) | 24.79 (24.05) | 17.36 (26.79) | 32.21 (22.28) | ||
| LSV | 58.49 (18.94) | 63.79 (20.00) | 69.54 (19.59) | 5.30 (5.90) | 5.75 (6.62) | 0.45 (10.00) | 11.05 (7.55) | ||
| LLES | 24.97 (26.14) | 33.28 (24.01) | 41.32 (27.51) | 8.31 (7.83) | 8.04 (15.85) | −0.27 (16.68) | 16.35 (18.61) | ||
| SCHR | 8.33 (12.35) | 16.60 (19.80) | 27.73 (22.83) | 8.27 (18.94) | 11.13 (12.53 | 2.86 (26.20) | 19.40 (18.58) | ||
| AAT | Period 1 | Period 2 | Period 2 − 1 | Period 1 + 2 | ||||||||
|---|---|---|---|---|---|---|---|---|---|---|---|---|
| (n = 27) | t(26) * (p-v.) | Cohen d [95%-CI] | Bayes Factor | t(26) * (p-v.) | Cohen d [95%-CI] | Bayes Factor | t(26) * (p-v.) | Cohen d [95%-CI] | Bayes Factor | t(26) * (p-v.) | Cohen d [95%-CI] | Bayes Factor |
| Profile | 3.99 (<0.001) | 0.77 [0.40–] | BF+0 131 | 11.61 (<0.001) | 2.24 [1.63–] | BF+0 2 × 10⁹ | 5.29 (<0.001) | 1.02 [0.62–] | BF+0 2840 | 8.23 (<0.001) | 1.58 [1.10–] | BF+0 2.5 × 10⁶ |
| Spont. | 1.38 (0.089) | 0.27 [−0.06–] | BF0+ 1.16 | 5.64 (<0.001) | 1.09 [0.68–] | BF+0 6617 | 1.79 (0.043) | 0.34 [0.02–] | BF+0 1.56 | 4.24 (<0.001) | 0.82 [0.44–] | BF+0 232 |
| TT | 3.15 (0.002) | 0.61 [0.26–] | BF+0 20 | 6.19 (<0.001) | 1.19 [0.77–] | BF+0 24,259 | 1.02 (0.16) | 0.20 [−0.13–] | BF0+ 1.85 | 5.53 (<0.001) | 1.07 [0.66–] | BF+0 5094 |
| REP | 3.09 (0.002) | 0.59 [0.25–] | BF+0 17 | 6.21 (<0.001) | 1.20 [0.77–] | BF+0 25,311 | 2.88 (0.004) | 0.55 [0.21–] | BF+0 11 | 5.41 (<0.001) | 1.04 [0.64–] | BF+0 232 |
| WRIT | 3.47 (<0.001) | 0.67 [0.31–] | BF+0 40 | 5.06 (<0.001) | 0.97 [0.58–] | BF+0 1629 | 0.56 (0.29) | 0.11 [−0.21–] | BF0+ 3.02 | 7.82 (<0.001) | 1.51 [1.03–] | BF+0 232 |
| NAM | 2.23 (0.017) | 0.43 [0.09–] | BF+0 3.27 | 5.82 (<0.001) | 1.12 [0.71–] | BF+0 10,118 | 1.74 (0.047) | 0.34 [0.01–] | BF+0 1.45 | 6.08 (<0.001) | 1.17 [0.75–] | BF+0 232 |
| COMP | 1.59 (0.062) | 0.31 [−0.02–] | BF+0 1.16 | 5.14 (<0.001) | 0.99 [0.59–] | BF+0 2000 | 2.65 (0.007) | 0.51 [0.17–] | BF+0 7.15 | 6.42 (<0.001) | 1.24 [0.80–] | BF+0 232 |
Appendix B


Appendix C. Details of the Expected Spontaneous Recovery Estimation Procedure for AAT Performances
Appendix D. Additional Tables and Material
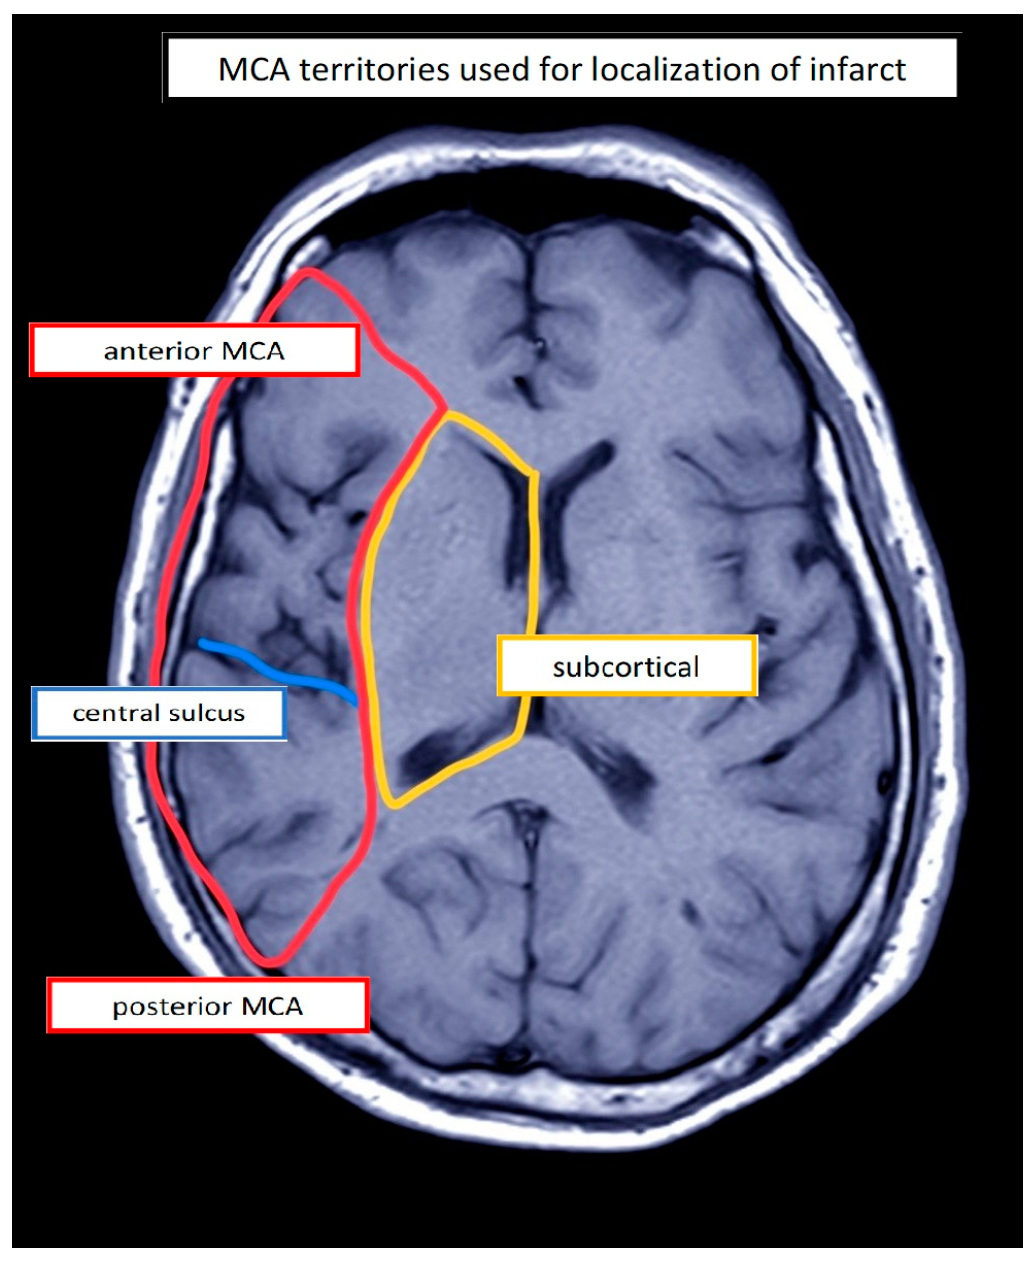
| PwA | Etiology | Lesion Location 1 | Stimulation Site (Left) | Sex | Age (Years) | Education (Years) | Duration (Days) | Assessment | Aphasia 2 | Aphasia Severity 3,4 | Initial Severity (ERBI) 5 (FIM) 6 (−325 to +105) (18–126) | |
|---|---|---|---|---|---|---|---|---|---|---|---|---|
| 1 | IS | a/sc | IFG | M | 58 | 18 | 25 | AAT | Wernicke | Moderate 2 | 55 | 102 |
| 2 | IS | a | IFG | F | 82 | 10 | 33 | AAT | Wernicke | Mild | 40 | 62 |
| 3 | IS | a | IFG | M | 70 | 16 | 21 | AAT | Wernicke | Severe | 25 | 68 |
| 4 | IS | sc | IFG | M | 66 | 17 | 57 | AAT | Anomic | Mild | 60 | 86 |
| 5 | IHS | sc | IFG | F | 63 | 16 | 29 | AAT | Anomic | Mild | −15 | 47 |
| 6 | IHS | p/sc | IFG | F | 57 | 17 | 25 | AAT | Anomic | Residual | 40 | 107 |
| 7 | IS | a/p | IFG | M | 69 | 16 | 107 | AAT | Wernicke | Moderate | 50 | 79 |
| 8 | IHS | a/sc | FPC | M | 41 | 16 | 77 | AAT | Anomic | Moderate | −15 | 81 |
| 9 | IHS | p | IFG | M | 64 | 13 | 47 | AAT | Wernicke | Moderate | −65 | 70 |
| 10 | IS | a | IFG | F | 64 | 13 | 13 | AAT | Global | Severe | 5 | 107 |
| 11 | IS | a/sc | IFG | M | 52 | 17 | 32 | AAT | Global | Severe | 35 | 92 |
| 12 | IS | sc | IFG | M | 36 | 12 | 29 | AAT | Global | Severe | 45 | 89 |
| 13 | IS | a/sc | IFG | M | 71 | 13 | 55 | AAT | Broca | Mild | −30 | 53 |
| 14 | IS | a/sc | IFG | M | 48 | 17 | 15 | AAT | Broca | Severe | 60 | 84 |
| 15 | IS | a/p | IFG | M | 73 | 17 | 16 | AAT | Wernicke | Severe | 10 | 93 |
| 16 | IS | sc | IFG | F | 62 | 17 | 46 | AAT | Global | Moderate | −20 | 52 |
| 17 | IS | sc | IFG | M | 50 | 17 | 99 | AAT | Broca | Mild | 10 | 80 |
| 18 | IS | sc | IFG | M | 58 | 10 | 83 | AAT | Global | Severe | 30 | 46 |
| 19 | IS | a | IFG | F | 67 | 10 | 56 | AAT | Anomic | Mild | 15 | 60 |
| 20 | IS | a/p | IFG | M | 66 | 10 | 64 | AAT | Global | Severe | −10 | 47 |
| 21 | IS | a | IFG | M | 69 | 13 | 102 | AAT | Broca | Moderate | −15 | 29 |
| 22 | IS | p | IFG | F | 81 | 10 | 66 | AAT | Wernicke | Severe | 25 | 92 |
| 23 | IS | a | IFG | M | 50 | 16 | 41 | AAT | Broca | Severe | 30 | 81 |
| 24 | IS | sc | IFG | M | 62 | 12 | 24 | AAT | Broca | Moderate | 55 | 95 |
| 25 | IS | a/sc | IFG | M | 60 | 9 | 85 | AAT | Wernicke | Moderate | 5 | 64 |
| 26 | IS | a | IFG | F | 83 | 13 | 31 | AAT | Wernicke | Moderate | 50 | 84 |
| 27 | IS | a/sc | IFG | M | 51 | 16 | 54 | AAT | Wernicke | Moderate | 0 | 90 |
| 28 | IS | a/sc | IFG | M | 80 | 20 | 34 | BIAS-R | Subacute Aph. | Severe 3 | −75 | 78 |
| 29 | IHS | sc | IFG | M | 67 | 13 | 92 | BIAS-R | Subacute Aph. | Severe | −70 | 47 |
| 30 | IS | a/sc/p | M1 | M | 55 | 16 | 99 | BIAS_R | Subacute Aph. | Severe | −20 | 44 |
| 31 | IHS | a/sc | FPC | F | 54 | 17 | 135 | BIAS-R | Subacute Aph. | Severe | −70 | 57 |
| 32 | IS | a/sc | IFG | F | 65 | 10 | 33 | BIAS-R | Subacute Aph. | Severe | −60 | 38 |
| 33 | IS | a/sc | IFG | M | 57 | 17 | 43 | BIAS-R | Subacute Aph. | Severe | −60 | 54 |
| 34 | IS | a/p/sc | M1 | M | 54 | 13 | 50 | BIAS-R | Subacute Aph. | Severe | −125 | 48 |
| 35 | IS | a/sc | FPC | F | 38 | 13 | 144 | BIAS-R | Subacute Aph. | Severe | −65 | 55 |
| 36 | IHS | a/sc | IFG | F | 65 | 17 | 51 | BIAS-R | Subacute Aph. | Severe | −65 | 55 |
| 37 | IS | a/p/sc | M1 | F | 48 | 10 | 85 | BIAS-R | Subacute Aph. | Severe | 40 | 90 |
| PwA | Spontaneous Speech Ratings | Profile Level | Token Test 1 (Errors) | Repetition 1 | Written Language 1 | Naming 1 | Comprehension 1 | ||||||||||||||
|---|---|---|---|---|---|---|---|---|---|---|---|---|---|---|---|---|---|---|---|---|---|
| (0–5) | (T-Norm) | (Max. 50) | (Max. 150) | (Max. 90) | (Max. 120) | (Max. 120) | |||||||||||||||
| T1 | T2 | T3 | T1 | T2 | T3 | T1 | T2 | T3 | T1 | T2 | T3 | T1 | T2 | T3 | T1 | T2 | T3 | T1 | T2 | T3 | |
| 1 | 2 5 4 3 4 4 | 3 5 4 3 4 4 | 3 5 5 3 4 4 | 52.22 | 52.88 | 56.33 | 34 | 34 | 28 | 138 | 143 | 144 | 39 | 44 | 59 | 66 | 66 | 94 | 94 | 81 | 96 |
| 2 | 2 4 5 3 4 4 | 2 5 4 3 4 4 | 3 5 5 3 4 4 | 57.13 | 58.80 | 61.39 | 16 | 12 | 8 | 140 | 140 | 144 | 76 | 78 | 82 | 82 | 91 | 98 | 82 | 92 | 93 |
| 3 | 2 5 4 3 2 4 | 2 5 4 3 2 4 | 2 5 5 3 2 4 | 44.70 | 44.83 | 47.13 | 27 | 23 | 13 | 49 | 45 | 51 | 30 | 36 | 44 | 30 | 24 | 41 | 75 | 81 | 94 |
| 4 | 3 3 5 3 2 4 | 3 3 5 3 2 4 | 4 4 5 4 3 4 | 60.53 | 61.68 | 64.25 | 5 | 0 | 0 | 136 | 133 | 142 | 73 | 76 | 78 | 107 | 107 | 108 | 99 | 106 | 110 |
| 5 | 3 4 5 3 3 4 | 3 4 5 3 2 4 | 3 4 5 4 3 4 | 55.80 | 62.39 | 67.27 | 25 | 3 | 0 | 133 | 140 | 146 | 72 | 84 | 86 | 96 | 96 | 109 | 93 | 104 | 104 |
| 6 | 3 5 5 4 4 4 | 3 5 5 4 5 4 | 4 5 5 4 5 5 | 63.70 | 67.55 | 73.17 | 4 | 0 | 0 | 146 | 147 | 149 | 87 | 87 | 89 | 83 | 100 | 112 | 102 | 109 | 113 |
| 7 | 2 2 4 3 2 2 | 2 2 4 3 2 2 | 2 2 4 3 2 4 | 47.71 | 47.66 | 49.14 | 30 | 32 | 24 | 103 | 105 | 109 | 28 | 27 | 28 | 66 | 59 | 76 | 76 | 76 | 77 |
| 8 | 2 5 4 3 4 4 | 2 5 4 3 4 4 | 3 5 5 3 5 4 | 54.43 | 54.93 | 56.82 | 32 | 34 | 28 | 137 | 143 | 142 | 71 | 67 | 76 | 76 | 76 | 87 | 81 | 90 | 96 |
| 9 | 4 5 5 3 4 4 | 3 5 4 3 4 4 | 4 5 5 4 4 4 | 49.31 | 50.63 | 54.29 | 11 | 8 | 5 | 76 | 98 | 113 | 38 | 39 | 50 | 70 | 78 | 87 | 104 | 93 | 112 |
| 10 | 1 1 0 0 0 0 | 1 1 0 0 0 1 | 1 2 0 3 2 1 | 40.17 | 43.58 | 45.56 | 33 | 29 | 20 | 15 | 38 | 66 | 14 | 21 | 29 | 0 | 16 | 30 | 79 | 91 | 81 |
| 11 | 1 4 4 1 1 0 | 1 4 4 1 1 0 | 1 4 4 1 1 0 | 40.91 | 42.20 | 44.22 | 46 | 41 | 37 | 43 | 54 | 79 | 9 | 14 | 22 | 16 | 9 | 18 | 67 | 72 | 81 |
| 12 | 1 0 0 0 0 0 | 2 3 4 2 2 2 | 2 3 4 3 2 2 | 39.95 | 43.73 | 48.41 | 50 | 46 | 40 | 65 | 86 | 109 | 19 | 37 | 47 | 2 | 14 | 52 | 61 | 54 | 82 |
| 13 | 3 3 5 3 2 3 | 3 3 5 3 2 3 | 4 3 4 4 4 4 | 58.34 | 60.33 | 65.73 | 2 | 0 | 0 | 127 | 128 | 144 | 61 | 71 | 78 | 106 | 106 | 113 | 88 | 101 | 107 |
| 14 | 1 2 4 3 2 0 | 2 2 4 3 2 1 | 3 3 5 3 2 4 | 45.44 | 50.28 | 53.46 | 41 | 22 | 9 | 77 | 100 | 112 | 30 | 39 | 54 | 47 | 88 | 92 | 89 | 94 | 105 |
| 15 | 2 5 3 2 3 3 | 2 5 3 2 3 3 | 2 5 3 2 3 3 | 45.28 | 47.13 | 48.99 | 44 | 35 | 27 | 114 | 116 | 118 | 7 | 14 | 25 | 43 | 57 | 47 | 47 | 57 | 76 |
| 16 | 1 4 3 3 2 1 | 1 4 4 3 2 1 | 2 4 5 3 2 2 | 46.73 | 47.44 | 49.51 | 44 | 34 | 22 | 120 | 120 | 122 | 20 | 29 | 27 | 38 | 28 | 48 | 71 | 64 | 71 |
| 17 | 2 4 4 3 3 3 | 2 4 4 3 2 3 | 2 4 4 3 2 3 | 57.97 | 57.40 | 61.57 | 1 | 2 | 2 | 134 | 134 | 141 | 74 | 69 | 82 | 74 | 79 | 86 | 106 | 98 | 109 |
| 18 | 1 4 4 3 4 1 | 1 5 4 3 4 1 | 1 5 4 3 4 1 | 43.20 | 41.78 | 43.55 | 46 | 45 | 43 | 104 | 100 | 106 | 6 | 7 | 8 | 11 | 0 | 1 | 66 | 62 | 62 |
| 19 | 4 3 5 4 4 5 | 4 3 4 4 4 5 | 5 4 5 5 4 5 | 61.01 | 63.79 | 69.80 | 0 | 0 | 0 | 124 | 124 | 145 | 76 | 81 | 84 | 109 | 115 | 119 | 103 | 110 | 115 |
| 20 | 1 1 3 3 2 2 | 2 1 3 3 2 2 | 2 1 3 3 2 2 | 44.24 | 43.58 | 45.42 | 38 | 43 | 39 | 89 | 89 | 103 | 9 | 8 | 11 | 33 | 31 | 41 | 55 | 60 | 76 |
| 21 | 1 1 4 3 2 0 | 1 1 4 3 2 1 | 2 1 5 3 2 2 | 49.67 | 50.40 | 54.75 | 15 | 12 | 3 | 100 | 103 | 117 | 42 | 73 | 60 | 71 | 73 | 92 | 67 | 75 | 80 |
| 22 | 1 5 2 1 3 3 | 1 5 2 1 2 3 | 1 5 3 1 2 3 | 37.87 | 40.19 | 42.24 | 43 | 41 | 39 | 20 | 34 | 50 | 0 | 4 | 11 | 10 | 19 | 24 | 53 | 55 | 62 |
| 23 | 1 3 4 3 2 1 | 1 3 4 3 2 1 | 2 3 4 2 3 1 | 45.43 | 45.91 | 48.60 | 31 | 36 | 30 | 85 | 79 | 101 | 31 | 37 | 41 | 14 | 39 | 47 | 84 | 87 | 101 |
| 24 | 3 3 5 3 3 2 | 3 3 5 3 3 2 | 3 3 5 3 3 4 | 50.72 | 52.43 | 56.21 | 15 | 13 | 2 | 101 | 109 | 117 | 51 | 58 | 70 | 77 | 85 | 91 | 86 | 84 | 97 |
| 25 | 2 4 3 3 3 3 | 2 4 3 3 3 3 | 2 4 3 3 3 3 | 47.03 | 46.68 | 47.98 | 45 | 36 | 38 | 136 | 138 | 139 | 7 | 7 | 6 | 3 | 0 | 12 | 62 | 57 | 53 |
| 26 | 2 4 3 3 4 3 | 2 5 3 3 4 3 | 2 5 3 3 4 3 | 49.41 | 48.53 | 50.47 | 39 | 41 | 39 | 135 | 132 | 133 | 48 | 47 | 59 | 17 | 11 | 25 | 48 | 46 | 77 |
| 27 | 2 4 4 3 2 3 | 2 4 5 3 2 3 | 3 4 5 3 2 3 | 50.25 | 51.22 | 54.42 | 33 | 27 | 17 | 126 | 133 | 139 | 47 | 44 | 59 | 50 | 64 | 63 | 50 | 50 | 76 |
| PwA | Profile Level Mean Percentage Value | ASV 1 Auditory Comprehension | AUT 1 Automatic Language | ELIZ 1 Naming | WFL 2 Verbal Fluency | NACH 1 Repetition | LSV 1 Reading Comprehension | LLES 1 Reading Aloud | SCHR 1 Writing | ||||||||||||||||||
|---|---|---|---|---|---|---|---|---|---|---|---|---|---|---|---|---|---|---|---|---|---|---|---|---|---|---|---|
| (T-Norm) | (Max. 72) | (Max. 36) | (Max. 36) | (Max. 15) | (Max. 36) | (Max. 72) | (Max. 36) | (Max. 18) | |||||||||||||||||||
| T1 | T2 | T3 | T1 | T2 | T3 | T1 | T2 | T3 | T1 | T2 | T3 | T1 | T2 | T3 | T1 | T2 | T3 | T1 | T2 | T3 | T1 | T2 | T3 | T1 | T2 | T3 | |
| 1 | 31.5 | 35.5 | 38.5 | 41 | 42 | 46 | 13 | 22 | 27 | 16 | 15 | 17 | 0 | 0 | 0 | 10 | 10 | 14 | 4 | 9 | 13 | 0 | 0 | 0 | |||
| 2 | 41 | 41 | 41.5 | 57 | 51 | 51 | 12 | 18 | 26 | 21 | 19 | 14 | 0 | 0 | 0 | 12 | 14 | 14 | 39 | 43 | 50 | 23 | 23 | 22 | 0 | 0 | 0 |
| 3 | 34 | 36 | 40.5 | 46 | 52 | 54 | 11 | 12 | 22 | 14 | 15 | 20 | 0 | 0 | 0 | 2 | 4 | 14 | 47 | 52 | 60 | 0 | 0 | 0 | 0 | 1 | 2 |
| 4 | 41.5 | 43.5 | 44.5 | 63 | 62 | 65 | 23 | 30 | 32 | 12 | 18 | 20 | 0 | 0 | 1 | 20 | 25 | 28 | 53 | 58 | 61 | 6 | 11 | 12 | 5 | 6 | 6 |
| 5 | 35 | 40 | 44.5 | 35 | 49 | 54 | 18 | 23 | 26 | 14 | 13 | 16 | 0 | 0 | 0 | 4 | 4 | 34 | 29 | 41 | 46 | 6 | 8 | 25 | 0 | 11 | 11 |
| 6 | 43.5 | 44 | 47 | 50 | 62 | 61 | 28 | 28 | 33 | 14 | 17 | 21 | 0 | 0 | 1 | 30 | 31 | 35 | 47 | 48 | 57 | 27 | 28 | 31 | 2 | 2 | 6 |
| 7 | 35.5 | 37 | 41.5 | 44 | 44 | 48 | 12 | 14 | 17 | 15 | 11 | 18 | 0 | 0 | 0 | 7 | 12 | 18 | 42 | 40 | 51 | 0 | 10 | 16 | 1 | 1 | 3 |
| 8 | 35 | 37 | 40.5 | 34 | 42 | 51 | 12 | 14 | 21 | 13 | 14 | 16 | 0 | 0 | 0 | 6 | 7 | 15 | 47 | 55 | 51 | 3 | 6 | 2 | 1 | 1 | 6 |
| 9 | 38.5 | 39.5 | 42.5 | 48 | 59 | 65 | 12 | 11 | 12 | 13 | 12 | 16 | 0 | 0 | 0 | 4 | 6 | 15 | 57 | 61 | 64 | 5 | 6 | 9 | 6 | 6 | 12 |
| 10 | 38.5 | 40 | 42.5 | 42 | 39 | 52 | 14 | 16 | 25 | 15 | 15 | 16 | 0 | 0 | 0 | 9 | 14 | 22 | 50 | 50 | 47 | 15 | 19 | 20 | 0 | 2 | 4 |
| PwA | Stim | Th1 | Th2 | Th3 | Th4 | Th5 | Th6 | Th7 | Th8 | Th9 | Th10 |
|---|---|---|---|---|---|---|---|---|---|---|---|
| IFG 1 | 3 | 2 | 1 | 1 | 1 | 1 | 1 | 2 | 1 | 1 | |
| 2 | IFG | 0 | 9 | 2 | 2 | 2 | 2 | 2 | 2 | 1 | 1 |
| 3 | IFG | 2 | 2 | 1 | 1 | 1 | 1 | 1 | 1 | 1 | 1 |
| 4 | M1 2 | 0 | 0 | 0 | 0 | 0 | 0 | 0 | 0 | 0 | 0 |
| 5 | FPC 3 | 5 | 5 | 3 | 3 | 2 | 2 | 2 | 2 | 2 | 2 |
| 6 | IFG | 0 | 0 | 1 | 0 | 1 | 0 | 1 | 0 | 1 | 0 |
| 7 | IFG | 0 | 0 | 0 | 0 | 0 | 0 | 0 | 0 | 0 | 0 |
| 8 | IFG | 4 | 0 | 0 | 0 | 0 | 0 | 0 | 0 | 0 | 0 |
| 9 | IFG | 0 | 0 | 0 | 0 | 0 | 0 | 0 | 0 | 0 | 0 |
| 10 | IFG | 2 | 2 | 2 | 2 | 2 | 0 | 0 | 2 | 2 | 0 |
| 11 | M1 | 0 | 0 | 0 | 1 | 0 | 0 | 0 | 1 | 0 | 0 |
| 12 | IFG | 2 | 2 | 2 | 1 | 1 | 1 | 1 | 1 | 1 | 1 |
| 13 | IFG | 2 | 1 | 2 | 1 | 1 | 1 | 0 | 1 | 1 | 0 |
| 14 | IFG | 6 | 4 | 5 | 4 | 4 | 3 | 2 | 4 | 2 | 2 |
| 15 | FPC | 4 | 3 | 3 | 3 | 3 | 2 | 2 | 3 | 2 | 2 |
| 16 | IFG | 1 | 1 | 1 | 1 | 1 | 1 | 1 | 1 | 1 | 1 |
| 17 | IFG | 0 | 0 | 0 | 0 | 0 | 0 | 0 | 0 | 0 | 0 |
| 18 | IFG | 4 | 4 | 4 | 4 | 5 | 5 | 5 | 5 | 5 | 6 |
| 19 | IFG | 2 | 2 | 1 | 1 | 1 | 1 | 1 | 1 | 0 | 1 |
| 20 | IFG | 0 | 0 | 0 | 0 | 0 | 0 | 0 | 0 | 0 | 0 |
| 21 | IFG | 8 | 7 | 7 | 6 | 6 | 6 | 7 | 7 | 6 | 7 |
| 22 | IFG | 0 | 0 | 0 | 0 | 0 | 0 | 0 | 0 | 0 | 0 |
| 23 | IFG | 3 | 2 | 3 | 1 | 1 | 2 | 2 | 2 | 0 | 2 |
| 24 | FPC | 2 | 2 | 2 | 2 | 1 | 1 | 1 | 1 | 1 | 1 |
| 25 | IFG | 2 | 2 | 2 | 2 | 2 | 2 | 2 | 2 | 2 | 2 |
| 26 | M1 | 0 | 0 | 0 | 0 | 0 | 0 | 0 | 0 | 0 | 0 |
| 27 | IFG | 4 | 2 | 2 | 2 | 2 | 2 | 2 | 1 | 1 | 1 |
| 28 | IFG | 6 | 6 | 6 | 5 | 6 | 6 | 7 | 6 | 6 | 6 |
| 29 | IFG | 0 | 0 | 0 | 0 | 0 | 0 | 0 | 0 | 0 | 0 |
| 30 | IFG | 6 | 5 | 6 | 3 | 4 | 3 | 3 | 3 | 3 | 3 |
| 31 | IFG | 6 | 7 | 7 | 7 | 6 | 8 | 6 | 6 | 6 | 7 |
| 32 | IFG | 3 | 3 | 1 | 1 | 1 | 2 | 2 | 3 | 2 | 3 |
| 33 | IFG | 0 | 0 | 0 | 0 | 0 | 0 | 0 | 0 | 0 | 0 |
| 34 | IFG | 0 | 0 | 0 | 0 | 0 | 0 | 0 | 0 | 0 | 0 |
| 35 | IFG | 4 | 2 | 0 | 2 | 0 | 0 | 0 | 0 | 0 | 0 |
| 36 | IFG | 2 | 2 | 1 | 2 | 3 | 2 | 1 | 2 | 4 | 4 |
| 37 | IFG | 0 | 0 | 0 | 0 | 0 | 1 | 0 | 0 | 0 | 0 |
Appendix E

References
- Mitchell, C.; Gittins, M.; Tyson, S.; Vail, A.; Conroy, P.; Paley, L.; Bowen, A. Prevalence of aphasia and dysarthria among inpatient stroke survivors: Describing the population, therapy provision and outcomes on discharge. Aphasiology 2021, 35, 950–960. [Google Scholar] [CrossRef]
- Engelter, S.T.; Gostynski, M.; Papa, S.; Frei, M.; Born, C.; Ajdacic-Gross, V.; Gutzwiller, F.; Lyrer, P.A. Epidemiology of aphasia attributable to first ischemic stroke: Incidence, severity, fluency, etiology, and thrombolysis. Stroke 2006, 37, 1379–1384. [Google Scholar] [CrossRef]
- Berthier, M.L. Poststroke aphasia : Epidemiology, pathophysiology and treatment. Drugs Aging 2005, 22, 163–182. [Google Scholar] [CrossRef]
- Hilari, K.; Cruice, M.; Sorin-Peters, R.; Worrall, L. Quality of Life in Aphasia: State of the Art. Folia Phoniatr. Logop. Off. Organ Int. Assoc. Logop. Phoniatr. (IALP) 2015, 67, 114–118. [Google Scholar] [CrossRef] [PubMed]
- Hilari, K.; Byng, S. Health-related quality of life in people with severe aphasia. Int. J. Lang. Commun. Disord. 2009, 44, 193–205. [Google Scholar] [CrossRef] [PubMed]
- Stahl, B.; Millrose, S.; Denzler, P.; Lucchese, G.; Jacobi, F.; Flöel, A. Intensive Social Interaction for Treatment of Poststroke Depression in Subacute Aphasia: The CONNECT Trial. Stroke 2022, 53, 3530–3537. [Google Scholar] [CrossRef]
- Baker, C.; Worrall, L.; Rose, M.; Hudson, K.; Ryan, B.; O’Byrne, L. A systematic review of rehabilitation interventions to prevent and treat depression in post-stroke aphasia. Disabil. Rehabil. 2018, 40, 1870–1892. [Google Scholar] [CrossRef]
- Breitenstein, C.; Grewe, T.; Flöel, A.; Ziegler, W.; Springer, L.; Martus, P.; Huber, W.; Willmes, K.; Ringelstein, E.B.; Haeusler, K.G.; et al. Intensive speech and language therapy in patients with chronic aphasia after stroke: A randomised, open-label, blinded-endpoint, controlled trial in a health-care setting. Lancet 2017, 389, 1528–1538. [Google Scholar]
- Brady, M.C.; Kelly, H.; Godwin, J.; Enderby, P.; Campbell, P. Speech and language therapy for aphasia following stroke. Cochrane Database Syst. Rev. 2016, 2016, CD000425. [Google Scholar] [CrossRef] [PubMed]
- Kiran, S.; Thompson, C.K. Neuroplasticity of Language Networks in Aphasia: Advances, Updates, and Future Challenges. Front. Neurol. 2019, 10, 295. [Google Scholar] [CrossRef]
- Husak, R.S.; Wallace, S.E.; Marshall, R.C.; Visch-Brink, E.G. A systematic review of aphasia therapy provided in the early period of post-stroke recovery. Aphasiology 2023, 37, 143–176. [Google Scholar] [CrossRef]
- Eley, E.; van den Berg, M.; Rose, M.L.; Pierce, J.E.; Foster, A.; Lamborn, E.; D’Souza, S.; Godecke, E.; Lanyon, L.; Shiggins, C.; et al. The effects of cognitive-linguistic interventions to treat aphasia in the first 90 days post-stroke: A systematic review. Aphasiology 2023, 38, 1351–1376. [Google Scholar] [CrossRef]
- Godecke, E.; Armstrong, E.; Rai, T.; Ciccone, N.; Rose, M.L.; Middleton, S.; Whitworth, A.; Holland, A.; Ellery, F.; Hankey, G.J.; et al. A randomized control trial of intensive aphasia therapy after acute stroke: The Very Early Rehabilitation for SpEech (VERSE) study. Int. J. Stroke 2021, 16, 556–572. [Google Scholar] [CrossRef] [PubMed]
- Ding, X.; Zhang, S.; Huang, W.; Zhang, S.; Zhang, L.; Hu, J.; Li, J.; Ge, Q.; Wang, Y.; Ye, X.; et al. Comparative efficacy of non-invasive brain stimulation for post-stroke aphasia: A network meta-analysis and meta-regression of moderators. Neurosci. Biobehav. Rev. 2022, 140, 104804. [Google Scholar] [CrossRef] [PubMed]
- Kielar, A.; Patterson, D.; Chou, Y. Efficacy of repetitive transcranial magnetic stimulation in treating stroke aphasia: Systematic review and meta-analysis. Clin. Neurophysiol. Off. J. Int. Fed. Clin. Neurophysiol. 2022, 140, 196–227. [Google Scholar] [CrossRef] [PubMed]
- Elsner, B.; Kugler, J.; Mehrholz, J. Transcranial direct current stimulation (tDCS) for improving aphasia after stroke: A systematic review with network meta-analysis of randomized controlled trials. J. NeuroEng. Rehabil. 2020, 17, 88. [Google Scholar] [CrossRef] [PubMed]
- Nitsche, M.A.; Paulus, W. Sustained excitability elevations induced by transcranial DC motor cortex stimulation in humans. Neurology 2001, 57, 1899–1901. [Google Scholar] [CrossRef] [PubMed]
- Thiel, A.; Zumbansen, A. The pathophysiology of post-stroke aphasia: A network approach. Restor. Neurol. Neurosci. 2016, 34, 507–518. [Google Scholar] [CrossRef] [PubMed]
- Harvey, D.Y.; Hamilton, R. Noninvasive brain stimulation to augment language therapy for poststroke aphasia. Handb. Clin. Neurol. 2022, 185, 241–250. [Google Scholar]
- Biou, E.; Cassoudesalle, H.; Cogné, M.; Sibon, I.; de Gabory, I.; Dehail, P.; Aupy, J.; Glize, B. Transcranial direct current stimulation in post-stroke aphasia rehabilitation: A systematic review. Ann. Phys. Rehabil. Med. 2019, 62, 104–121. [Google Scholar] [CrossRef]
- Meinzer, M.; Darkow, R.; Lindenberg, R.; Flöel, A. Electrical stimulation of the motor cortex enhances treatment outcome in post-stroke aphasia. Brain 2016, 139, 1152–1163. [Google Scholar] [CrossRef] [PubMed]
- Branscheidt, M.; Hoppe, J.; Zwitserlood, P.; Liuzzi, G. tDCS over the motor cortex improves lexical retrieval of action words in poststroke aphasia. J. Neurophysiol. 2018, 119, 621–630. [Google Scholar] [CrossRef]
- Hamilton, R.H.; Chrysikou, E.G.; Coslett, B. Mechanisms of aphasia recovery after stroke and the role of noninvasive brain stimulation. Brain Lang. 2011, 118, 40–50. [Google Scholar] [CrossRef]
- Hamilton, R.H. Neuroplasticity in the language system: Reorganization in post-stroke aphasia and in neuromodulation interventions. Restor. Neurol. Neurosci. 2016, 34, 467–471. [Google Scholar] [CrossRef]
- Shah-Basak, P.; Boukrina, O.; Li, X.R.; Jebahi, F.; Kielar, A. Targeted neurorehabilitation strategies in post-stroke aphasia. Restor. Neurol. Neurosci. 2023, 41, 129–191. [Google Scholar] [CrossRef]
- Marangolo, P. The potential effects of transcranial direct current stimulation (tDCS) on language functioning: Combining neuromodulation and behavioral intervention in aphasia. Neurosci. Lett. 2020, 719, 133329. [Google Scholar] [CrossRef] [PubMed]
- Vines, B.W.; Norton, A.C.; Schlaug, G. Non-invasive brain stimulation enhances the effects of melodic intonation therapy. Front. Psychol. 2011, 2, 230. [Google Scholar] [CrossRef]
- Spielmann, K.; van de Sandt-Koenderman, W.M.E.; Heijenbrok-Kal, M.H.; Ribbers, G.M. Transcranial Direct Current Stimulation Does Not Improve Language Outcome in Subacute Poststroke Aphasia. Stroke 2018, 49, 1018–1020. [Google Scholar] [CrossRef] [PubMed]
- Stockbridge, M.D.; Elm, J.; Breining, B.L.; Tippett, D.C.; Sebastian, R.; Cassarly, C.; Teklehaimanot, A.; Spell, L.A.; Sheppard, S.M.; Vitti, E.; et al. Transcranial Direct-Current Stimulation in Subacute Aphasia: A Randomized Controlled Trial. Stroke 2023, 54, 912–920. [Google Scholar] [CrossRef]
- You, D.S.; Kim, D.-Y.; Chun, M.H.; Jung, S.E.; Park, S.J. Cathodal transcranial direct current stimulation of the right Wernicke’s area improves comprehension in subacute stroke patients. Brain Lang. 2011, 119, 1–5. [Google Scholar] [CrossRef]
- Hamilton, R.H.; Kessler, S.K.; Castillo-Saavedra, L.; Fregni, F.; Martin, D.; Loo, C.; Knotkova, H.; Woods, A.J. Methodological Considerations for Transcranial Direct Current Stimulation in Clinical Trials. In Practical Guide to Transcranial Direct Current Stimulation: Principles, Procedures and Applications; Knotkova, H., Ed.; Springers: Cham, Switzerland, 2019; pp. 347–377. [Google Scholar]
- Samanta, D.; Landes, S.J. Implementation Science to Improve Quality of Neurological Care. Pediatr. Neurol. 2021, 121, 67–74. [Google Scholar] [CrossRef]
- Juckett, L.A.; Wengerd, L.R.; Faieta, J.; Griffin, C.E. Evidence-Based Practice Implementation in Stroke Rehabilitation: A Scoping Review of Barriers and Facilitators. Am. J. Occup. Ther. Off. Publ. Am. Occup. Ther. Assoc. 2020, 74, 7401205050p1–7401205050p14. [Google Scholar] [CrossRef] [PubMed]
- van Stan, J.H.; Holmes, J.; Wengerd, L.; Juckett, L.A.; Whyte, J.; Pinto, S.M.; Katz, L.W.; Wolfberg, J. Rehabilitation Treatment Specification System: Identifying Barriers, Facilitators, and Strategies for Implementation in Research, Education, and Clinical Care. Arch. Phys. Med. Rehabil. 2023, 104, 562–568. [Google Scholar] [CrossRef]
- Douglas, N.F.; Feuerstein, J.L.; Oshita, J.Y.; Schliep, M.E.; Danowski, M.L. Implementation Science Research in Communication Sciences and Disorders: A Scoping Review. Am. J. Speech-Lang. Pathol. 2022, 31, 1054–1083. [Google Scholar] [CrossRef]
- Biniek, R.; Huber, W.; Glindemann, R.; Willmes, K.; Klumm, H. Der Aachener Aphasie-Bedside-Test—Testpsychologische Gütekriterien. Nervenarzt 1992, 63, 473–479. [Google Scholar] [PubMed]
- Huber, W.; Poeck, K.; Willmes, K. The Aachen Aphasia Test. Adv. Neurol. 1984, 42, 291–303. [Google Scholar]
- Peitz, D.; Schumann-Werner, B.; Hussmann, K.; Pinho, J.; Chen, H.; Binkofski, F.; Huber, W.; Willmes, K.; Heim, S.; Schulz, J.B.; et al. Success rates of intensive aphasia therapy: Real-world data from 448 patients between 2003 and 2020. J. Neurol. 2024; in press. [Google Scholar] [CrossRef] [PubMed]
- Shah-Basak, P.P.; Norise, C.; Garcia, G.; Torres, J.; Faseyitan, O.; Hamilton, R.H. Individualized treatment with transcranial direct current stimulation in patients with chronic non-fluent aphasia due to stroke. Front. Hum. Neurosci. 2015, 9, 201. [Google Scholar] [CrossRef]
- de Aguiar, V.; Bastiaanse, R.; Capasso, R.; Gandolfi, M.; Smania, N.; Rossi, G.; Miceli, G. Can tDCS enhance item-specific effects and generalization after linguistically motivated aphasia therapy for verbs? Front. Behav. Neurosci. 2015, 9, 190. [Google Scholar] [CrossRef]
- Bernhardt, J.; Hayward, K.S.; Kwakkel, G.; Ward, N.S.; Wolf, S.L.; Borschmann, K.; Krakauer, J.W.; Boyd, L.A.; Carmichael, S.T.; Corbett, D.; et al. Agreed definitions and a shared vision for new standards in stroke recovery research: The Stroke Recovery and Rehabilitation Roundtable taskforce. Int. J. Stroke 2017, 12, 444–450. [Google Scholar] [CrossRef]
- Salmaso, D.; Longoni, A.M. Problems in the assessment of hand preference. Cortex 1985, 21, 533–549. [Google Scholar] [CrossRef] [PubMed]
- Willmes, K.; Poeck, K.; Willmes, K.; Poeck, K. Ergebnisse einer multizentrischen untersuchung über die spontanprognose von aphasien vaskulärer ätiologie. Nervenarzt 1984, 55, 62–71. [Google Scholar]
- Luzzatti, C.; de Bleser, R.; Scola, I.; Frustaci, M.; Willmes, K. Update on the psychometric properties for the Italian version of the Aachen Aphasia Test (IT-AAT). Aphasiology 2023, 37, 658–695. [Google Scholar] [CrossRef]
- Willmes, K. An approach to analyzing a single subject’s scores obtained in a standardized test with application to the Aachen Aphasia Test (AAT). J. Clin. Exp. Neuropsychol. 1985, 7, 331–352. [Google Scholar] [CrossRef]
- Richter, K.; Hielscher-Fastabend, M. BIAS A&R: Bielefelder Aphasie Screening Akut und Reha; zur Diagnostik Akuter und Postakuter Aphasien; Natverlag: Hofheim am Taunus, Germany, 2018. [Google Scholar]
- Rollnik, J.D. The Early Rehabilitation Barthel Index (ERBI). Die Rehabil. 2011, 50, 408–411. [Google Scholar] [CrossRef]
- Granger, C.V.; Hamilton, B.B.; Linacre, J.M.; Heinemann, A.W.; Wright, B.D. Performance profiles of the functional independence measure. Am. J. Phys. Med. Rehabil. 1993, 72, 84–89. [Google Scholar] [CrossRef]
- Fregni, F.; Nitsche, M.A.; Loo, C.K.; Brunoni, A.R.; Marangolo, P.; Leite, J.; Carvalho, S.; Bolognini, N.; Caumo, W.; Paik, N.J.; et al. Regulatory Considerations for the Clinical and Research Use of Transcranial Direct Current Stimulation (tDCS): Review and recommendations from an expert panel. Clin. Res. Regul. Aff. 2015, 32, 22–35. [Google Scholar] [CrossRef]
- Friederici, A.D. The brain basis of language processing: From structure to function. Physiol. Rev. 2011, 91, 1357–1392. [Google Scholar] [CrossRef] [PubMed]
- Datta, A.; Baker, J.M.; Bikson, M.; Fridriksson, J. Individualized model predicts brain current flow during transcranial direct-current stimulation treatment in responsive stroke patient. Brain Stimul. 2011, 4, 169–174. [Google Scholar] [CrossRef]
- Pulvermüller, F.; Fadiga, L. Active perception: Sensorimotor circuits as a cortical basis for language. Nat. Rev. Neurosci. 2010, 11, 351–360. [Google Scholar] [CrossRef]
- Datta, A.; Bikson, M.; Fregni, F. Transcranial direct current stimulation in patients with skull defects and skull plates: High-resolution computational FEM study of factors altering cortical current flow. NeuroImage 2010, 52, 1268–1278. [Google Scholar] [CrossRef] [PubMed]
- Nitsche, M.A.; Doemkes, S.; Karaköse, T.; Antal, A.; Liebetanz, D.; Lang, N.; Tergau, F.; Paulus, W. Shaping the effects of transcranial direct current stimulation of the human motor cortex. J. Neurophysiol. 2007, 97, 3109–3117. [Google Scholar] [CrossRef] [PubMed]
- van Hees, S.; McMahon, K.; Angwin, A.; de Zubicaray, G.; Read, S.; Copland, D.A. A functional MRI study of the relationship between naming treatment outcomes and resting state functional connectivity in post-stroke aphasia. Hum. Brain Mapp. 2014, 35, 3919–3931. [Google Scholar] [CrossRef] [PubMed]
- Thompson, C.K.; den Ouden, D.-B. Neuroimaging and recovery of language in aphasia. Curr. Neurol. Neurosci. Rep. 2008, 8, 475–483. [Google Scholar] [CrossRef] [PubMed]
- Hickey, J.; Shrubsole, K.; Worrall, P.L.; Power, E. Implementing aphasia recommendations in the acute setting: Speech-language pathologists’ perspectives of a behaviour change intervention. Aphasiology 2019, 33, 606–628. [Google Scholar] [CrossRef]
- Brown, S.E.; Brady, M.C.; Worrall, L.; Scobbie, L. A narrative review of communication accessibility for people with aphasia and implications for multi-disciplinary goal setting after stroke. Aphasiology 2021, 35, 1–32. [Google Scholar] [CrossRef]
- Springer, L. Chapter 10—Reduced Syntax Therapy (REST)-A Compensatory Approach to Agrammatism. In The Sciences of Aphasia; Papathanasiou, I., de Bleser, R., Eds.; Pergamon: Amsterdam, The Netherlands, 2003; pp. 149–160. [Google Scholar]
- JAS 24. JASP Team (2024). JASP (Version 0.18.3)[Computer software].
- Faul, F.; Erdfelder, E.; Buchner, A.; Lang, A.-G. Statistical power analyses using G*Power 3.1: Tests for correlation and regression analyses. Behav. Res. Methods 2009, 41, 1149–1160. [Google Scholar] [CrossRef] [PubMed]
- Holm, S. A simple sequentially rejective multiple test procedure. Scand. J. Statist. 1979, 6, 65–70. [Google Scholar]
- Morey, R.D. Confidence Intervals from Normalized Data: A correction to Cousineau (2005). Tutor. Quant. Methods Psychol. 2008, 4, 61–64. [Google Scholar] [CrossRef]
- Cohen, J. Statistical Power Analysis for the Behavioral Sciences, 2nd ed.; Taylor and Francis: Hoboken, NJ, USA, 2013. [Google Scholar]
- Lakens, D. Calculating and reporting effect sizes to facilitate cumulative science: A practical primer for t-tests and ANOVAs. Front. Psychol. 2013, 4, 863. [Google Scholar] [CrossRef]
- Shrout, P.E.; Fleiss, J.L. Intraclass correlations: Uses in assessing rater reliability. Psychol. Bull. 1979, 86, 420–428. [Google Scholar] [CrossRef] [PubMed]
- Kristinsson, S.; Basilakos, A.; den Ouden, D.B.; Cassarly, C.; Spell, L.A.; Bonilha, L.; Rorden, C.; Hillis, A.E.; Hickok, G.; Johnson, L.; et al. Predicting Outcomes of Language Rehabilitation: Prognostic Factors for Immediate and Long-Term Outcomes After Aphasia Therapy. J. Speech Lang. Hear. Res. 2023, 66, 1068–1084. [Google Scholar] [CrossRef] [PubMed]
- Plowman, E.; Hentz, B.; Ellis, C. Post-stroke aphasia prognosis: A review of patient-related and stroke-related factors. J. Eval. Clin. Pract. 2012, 18, 689–694. [Google Scholar] [CrossRef] [PubMed]
- Watila, M.M.; Balarabe, S.A. Factors predicting post-stroke aphasia recovery. J. Neurol. Sci. 2015, 352, 12–18. [Google Scholar] [PubMed]
- Wilson, S.M.; Entrup, J.L.; Schneck, S.M.; Onuscheck, C.F.; Levy, D.F.; Rahman, M.; Willey, E.; Casilio, M.; Yen, M.; Brito, A.C.; et al. Recovery from aphasia in the first year after stroke. Brain 2023, 146, 1021–1039. [Google Scholar] [CrossRef] [PubMed]
- Wilmskoetter, J.; He, X.; Caciagli, L.; Jensen, J.H.; Marebwa, B.; Davis, K.A.; Fridriksson, J.; Basilakos, A.; Johnson, L.P.; Rorden, C.; et al. Language Recovery after Brain Injury: A Structural Network Control Theory Study. J. Neurosci. 2022, 42, 657–669. [Google Scholar] [CrossRef]
- Marangolo, P.; Fiori, V.; Sabatini, U.; de Pasquale, G.; Razzano, C.; Caltagirone, C.; Gili, T. Bilateral Transcranial Direct Current Stimulation Language Treatment Enhances Functional Connectivity in the Left Hemisphere: Preliminary Data from Aphasia. J. Cogn. Neurosci. 2016, 28, 724–738. [Google Scholar] [CrossRef]
- DeDe, G.; Hoover, E. Measuring Change at the Discourse-Level Following Conversation Treatment. Top. Lang. Disord. 2021, 41, 5–26. [Google Scholar] [CrossRef]
- Hoover, E.L.; Caplan, D.; Waters, G.; Budson, A. Effects of impairment-based individual and socially oriented group therapies on verb production in aphasia. Aphasiology 2015, 29, 781–798. [Google Scholar] [CrossRef]
- Nicholas, L.E.; Brookshire, R.H. A system for quantifying the informativeness and efficiency of the connected speech of adults with aphasia. J. Speech Hear. Res. 1993, 36, 338–350. [Google Scholar] [CrossRef]
- Harvey, S.; Stone, M.; Zingelman, S.; Copland, D.A.; Kilkenny, M.F.; Godecke, E.; Cadilhac, D.A.; Kim, J.; Olaiya, M.T.; Rose, M.L.; et al. Comprehensive quality assessment for aphasia rehabilitation after stroke: Protocol for a multicentre, mixed-methods study. BMJ Open 2024, 14, e080532. [Google Scholar] [CrossRef] [PubMed]
- Hilari, K.; Byng, S.; Lamping, D.L.; Smith, S.C. Stroke and Aphasia Quality of Life Scale-39 (SAQOL-39): Evaluation of acceptability, reliability, and validity. Stroke 2003, 34, 1944–1950. [Google Scholar] [CrossRef]
- Stahl, B.; Henseler, I.; Turner, R.; Geyer, S.; Kotz, S.A. How to engage the right brain hemisphere in aphasics without even singing: Evidence for two paths of speech recovery. Front. Hum. Neurosci. 2013, 7, 35. [Google Scholar] [CrossRef]
- Stockert, A.; Wawrzyniak, M.; Klingbeil, J.; Wrede, K.; Kümmerer, D.; Hartwigsen, G.; Kaller, C.P.; Weiller, C.; Saur, D. Dynamics of language reorganization after left temporo-parietal and frontal stroke. Brain 2020, 143, 844–861. [Google Scholar] [CrossRef] [PubMed]
- Saur, D.; Lange, R.; Baumgaertner, A.; Schraknepper, V.; Willmes, K.; Rijntjes, M.; Weiller, C. Dynamics of language reorganization after stroke. Brain 2006, 129, 1371–1384. [Google Scholar] [CrossRef] [PubMed]
- Heiss, W.-D.; Thiel, A. A proposed regional hierarchy in recovery of post-stroke aphasia. Brain Lang. 2006, 98, 118–123. [Google Scholar] [CrossRef]
- Saur, D.; Hartwigsen, G. Neurobiology of language recovery after stroke: Lessons from neuroimaging studies. Arch. Phys. Med. Rehabil. 2012, 93, S15–S25. [Google Scholar] [CrossRef] [PubMed]
- Galletta, E.E.; Conner, P.; Vogel-Eyny, A.; Marangolo, P. Use of tDCS in Aphasia Rehabilitation: A Systematic Review of the Behavioral Interventions Implemented With Noninvasive Brain Stimulation for Language Recovery. Am. J. Speech-Lang. Pathol. 2016, 25, S854–S867. [Google Scholar] [CrossRef]
- Stahl, B.; Darkow, R.; von Podewils, V.; Meinzer, M.; Grittner, U.; Reinhold, T.; Grewe, T.; Breitenstein, C.; Flöel, A. Transcranial Direct Current Stimulation to Enhance Training Effectiveness in Chronic Post-Stroke Aphasia: A Randomized Controlled Trial Protocol. Front. Neurol. 2019, 10, 1089. [Google Scholar] [CrossRef] [PubMed]
- Saur, D.; Kreher, B.W.; Schnell, S.; Kümmerer, D.; Kellmeyer, P.; Vry, M.-S.; Umarova, R.; Musso, M.; Glauche, V.; Abel, S.; et al. Ventral and dorsal pathways for language. Proc. Natl. Acad. Sci. USA 2008, 105, 18035–18040. [Google Scholar] [CrossRef]
- Hickok, G.; Poeppel, D. The cortical organization of speech processing. Nat. Reviews. Neurosci. 2007, 8, 393–402. [Google Scholar] [CrossRef] [PubMed]
- Kümmerer, D.; Hartwigsen, G.; Kellmeyer, P.; Glauche, V.; Mader, I.; Klöppel, S.; Suchan, J.; Karnath, H.-O.; Weiller, C.; Saur, D. Damage to ventral and dorsal language pathways in acute aphasia. Brain 2013, 136, 619–629. [Google Scholar] [CrossRef] [PubMed]
- Hartwigsen, G.; Volz, L.J. Probing rapid network reorganization of motor and language functions via neuromodulation and neuroimaging. NeuroImage 2021, 224, 117449. [Google Scholar] [CrossRef] [PubMed]
- Boros, K.; Poreisz, C.; Münchau, A.; Paulus, W.; Nitsche, M.A. Premotor transcranial direct current stimulation (tDCS) affects primary motor excitability in humans. Eur. J. Neurosci. 2008, 27, 1292–1300. [Google Scholar] [CrossRef]
- Stagg, C.J.; O’Shea, J.; Kincses, Z.T.; Woolrich, M.; Matthews, P.M.; Johansen-Berg, H. Modulation of movement-associated cortical activation by transcranial direct current stimulation. Eur. J. Neurosci. 2009, 30, 1412–1423. [Google Scholar] [CrossRef] [PubMed]
- Peña-Gómez, C.; Sala-Lonch, R.; Junqué, C.; Clemente, I.C.; Vidal, D.; Bargalló, N.; Falcón, C.; Valls-Solé, J.; Pascual-Leone, Á.; Bartrés-Faz, D. Modulation of large-scale brain networks by transcranial direct current stimulation evidenced by resting-state functional MRI. Brain Stimul. 2012, 5, 252–263. [Google Scholar] [CrossRef] [PubMed]
- Darkow, R.; Martin, A.; Würtz, A.; Flöel, A.; Meinzer, M. Transcranial direct current stimulation effects on neural processing in post-stroke aphasia. Hum. Brain Mapp. 2017, 38, 1518–1531. [Google Scholar] [CrossRef] [PubMed]
- Dreyer, F.R.; Doppelbauer, L.; Büscher, V.; Arndt, V.; Stahl, B.; Lucchese, G.; Hauk, O.; Mohr, B.; Pulvermüller, F. Increased Recruitment of Domain-General Neural Networks in Language Processing Following Intensive Language-Action Therapy: fMRI Evidence From People With Chronic Aphasia. Am. J. Speech-Lang. Pathol. 2021, 30, 455–465. [Google Scholar] [CrossRef]
- Richardson, J.; Datta, A.; Dmochowski, J.; Parra, L.C.; Fridriksson, J. Feasibility of using high-definition transcranial direct current stimulation (HD-tDCS) to enhance treatment outcomes in persons with aphasia. NeuroRehabilitation 2015, 36, 115–126. [Google Scholar] [CrossRef]
- Fridriksson, J.; Rorden, C.; Elm, J.; Sen, S.; George, M.S.; Bonilha, L. Transcranial Direct Current Stimulation vs Sham Stimulation to Treat Aphasia After Stroke: A Randomized Clinical Trial. JAMA Neurol. 2018, 75, 1470–1476. [Google Scholar] [CrossRef]
- Shah-Basak, P.P.; Sivaratnam, G.; Teti, S.; Francois-Nienaber, A.; Yossofzai, M.; Armstrong, S.; Nayar, S.; Jokel, R.; Meltzer, J. High definition transcranial direct current stimulation modulates abnormal neurophysiological activity in post-stroke aphasia. Sci. Rep. 2020, 10, 19625. [Google Scholar] [CrossRef] [PubMed]
- Zumbansen, A.; Black, S.E.; Chen, J.L.; J Edwards, D.; Hartmann, A.; Heiss, W.-D.; Lanthier, S.; Lesperance, P.; Mochizuki, G.; Paquette, C.; et al. Non-invasive brain stimulation as add-on therapy for subacute post-stroke aphasia: A randomized trial (NORTHSTAR). Eur. Stroke J. 2020, 5, 402–413. [Google Scholar] [CrossRef]
- Curran, G.M.; Bauer, M.; Mittman, B.; Pyne, J.M.; Stetler, C. Effectiveness-implementation hybrid designs: Combining elements of clinical effectiveness and implementation research to enhance public health impact. Med. Care 2012, 50, 217–226. [Google Scholar] [CrossRef] [PubMed]
- Morris, Z.S.; Wooding, S.; Grant, J. The answer is 17 years, what is the question: Understanding time lags in translational research. J. R. Soc. Med. 2011, 104, 510–520. [Google Scholar] [CrossRef] [PubMed]
- Morris, J.H.; Bernhardsson, S.; Bird, M.-L.; Connell, L.; Lynch, E.; Jarvis, K.; Kayes, N.M.; Miller, K.; Mudge, S.; Fisher, R. Implementation in rehabilitation: A roadmap for practitioners and researchers. Disabil. Rehabil. 2020, 42, 3265–3274. [Google Scholar] [CrossRef] [PubMed]
- Lefaucheur, J.-P.; Antal, A.; Ayache, S.S.; Benninger, D.H.; Brunelin, J.; Cogiamanian, F.; Cotelli, M.; de Ridder, D.; Ferrucci, R.; Langguth, B.; et al. Evidence-based guidelines on the therapeutic use of transcranial direct current stimulation (tDCS). Clin. Neurophysiol. Off. J. Int. Fed. Clin. Neurophysiol. 2017, 128, 56–92. [Google Scholar] [CrossRef] [PubMed]
- Cohen Kadosh, R.; Soskic, S.; Iuculano, T.; Kanai, R.; Walsh, V. Modulating neuronal activity produces specific and long-lasting changes in numerical competence. Curr. Biol. CB 2010, 20, 2016–2020. [Google Scholar] [CrossRef] [PubMed]
- Meinzer, M.; Jähnigen, S.; Copland, D.A.; Darkow, R.; Grittner, U.; Avirame, K.; Rodriguez, A.D.; Lindenberg, R.; Flöel, A. Transcranial direct current stimulation over multiple days improves learning and maintenance of a novel vocabulary. Cortex A J. Devoted Study Nerv. Syst. Behav. 2014, 50, 137–147. [Google Scholar] [CrossRef] [PubMed]
- Reis, J.; Schambra, H.M.; Cohen, L.G.; Buch, E.R.; Fritsch, B.; Zarahn, E.; Celnik, P.A.; Krakauer, J.W. Noninvasive cortical stimulation enhances motor skill acquisition over multiple days through an effect on consolidation. Proc. Natl. Acad. Sci. USA 2009, 106, 1590–1595. [Google Scholar] [CrossRef]
- Campana, S.; Caltagirone, C.; Marangolo, P. Combining Voxel-based Lesion-symptom Mapping (VLSM) with A-tDCS Language Treatment: Predicting Outcome of Recovery in Nonfluent Chronic Aphasia. Brain Stimul. 2015, 8, 769–776. [Google Scholar] [CrossRef]
- Fridriksson, J.; Richardson, J.D.; Baker, J.M.; Rorden, C. Transcranial direct current stimulation improves naming reaction time in fluent aphasia: A double-blind, sham-controlled study. Stroke 2011, 42, 819–821. [Google Scholar] [CrossRef] [PubMed]

| Group | AAT | BIAS-R | |
|---|---|---|---|
| Etiology (stroke) | IS | 23 | 7 |
| IHS | 4 | 3 | |
| Stimulation site (left) | IFG | 26 | 5 |
| M1 | 3 | ||
| FPC | 1 | 2 | |
| Sex | Male | 19 | 5 |
| Female | 8 | 5 | |
| Age (years) | M (SD) | 61.96 (11.63) | 58.3 (11.57) |
| Median (range) | 63 (36–83) | 56 (38–80) | |
| Education (years) | M (SD) | 14.11 (2.91) | 14.6 (3.31) |
| Median (range) | 16 (9–18) | 14.5 (10–20) | |
| Duration (days) | M (SD) | 49.33 (28.04) | 76.6 (40.79) |
| Median (range) | 46 (13–107) | 68 (33–145) | |
| Aphasia type 1 | Global | 6 | |
| Wernicke | 10 | ||
| Broca | 6 | ||
| Anomic | 5 | ||
| Subacute aphasia | 10 | ||
| Aphasia severity 2,3 | Severe | 10 | 10 |
| Moderate | 10 | ||
| Mild | 6 | ||
| Residual | 1 | ||
| Severity ERBI 4 (−325–105) | M (SD) | +17.59 (31.72) | −57 (42.44) |
| Median (range) | +25 (−65 to +60) | −65 (−125 to +40) | |
| Severity FIM 5 (18–126) | M (SD) | 75.56 (20.58) | 56.6 (15.86) |
| Median (range) | 81 (29–107) | 54.5 (38–90) |
| A | Period 1 | Period 2 | Period 2 − 1 | Period 1 + 2 | ||||||||
| AAT (n = 27) | t(26) * (p-v.) | Cohen d [95%-CI] | Bayes Factor | t(26) * (p-v.) | Cohen d [95%-CI] | Bayes Factor | t(26) * (p-v.) | Cohen d [95%-CI] | Bayes Factor | t(26) * (p-v.) | Cohen d [95%-CI] | Bayes Factor |
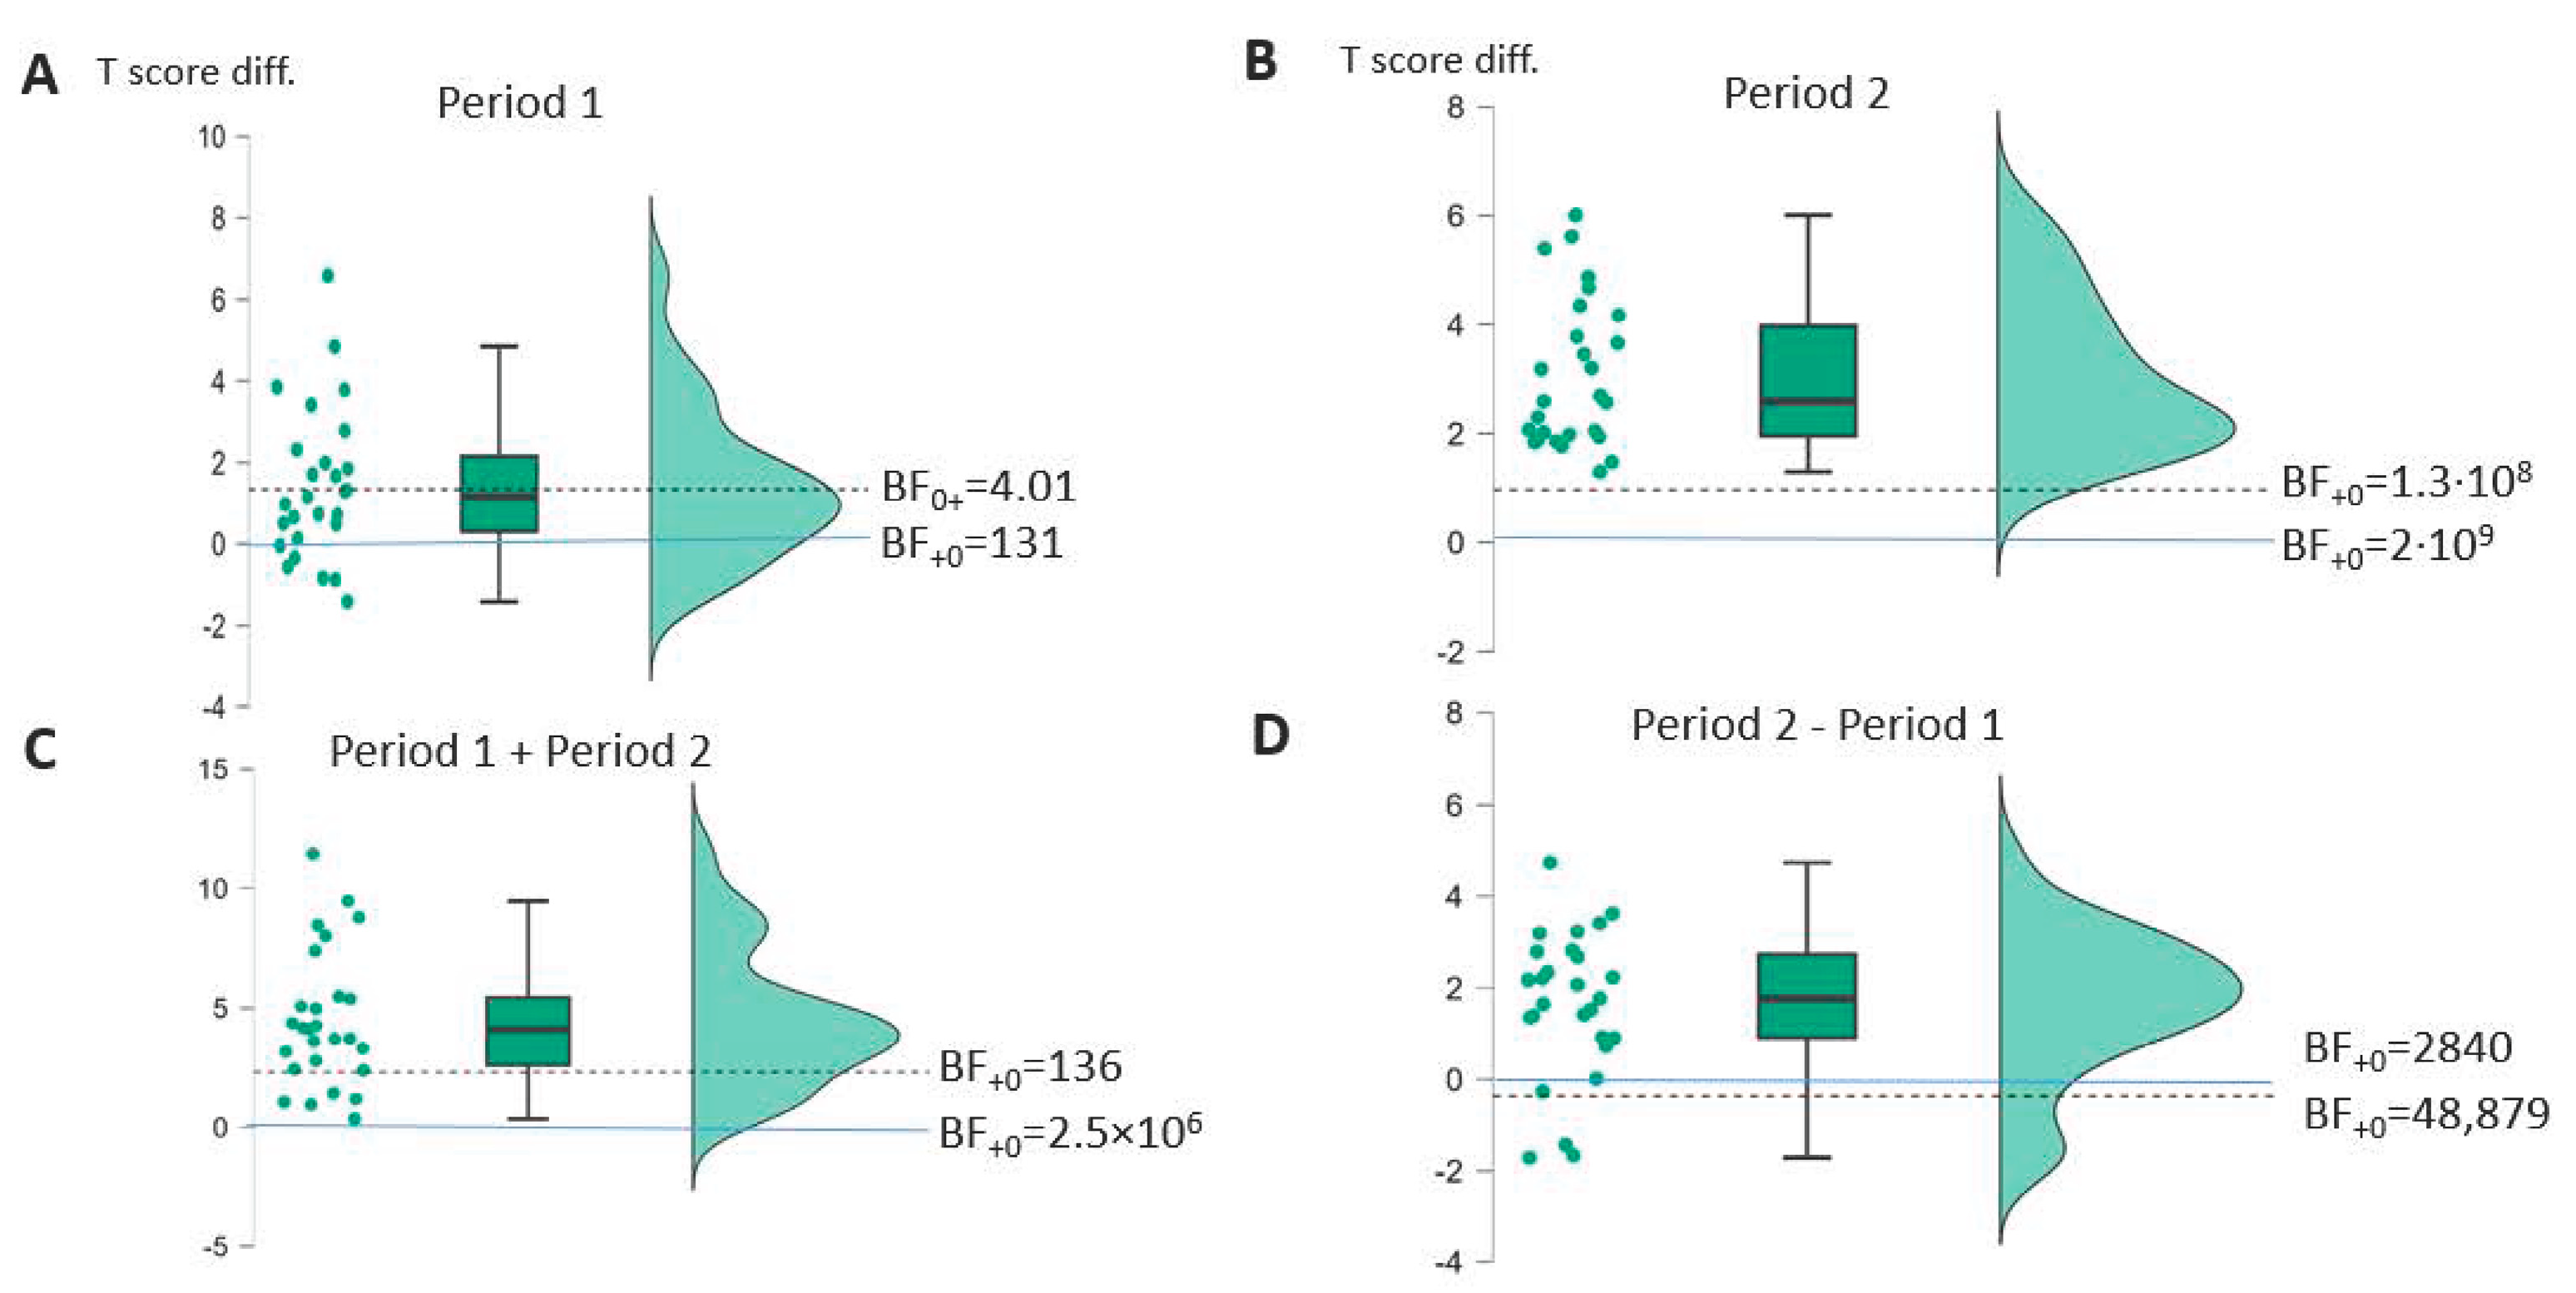
| Profile | 0.25 (0.40) | 0.19 [−0.27–∞] | BF0+ 4.01 | 7.94 (<0.001) | 1.53 [1.05–∞] | BF+0 1.3 × 10⁸ | 6.49 (<0.001) | 1.25 [0.82–∞] | BF+0 48,879 | 4.01 (<0.001) | 0.77 [0.40–∞] | BF+0 136 |
| TT | 1.69 (0.052) | 0.32 [−0.01–∞] | BF0+ 1.33 | 4.63 (<0.001) | 0.89 [0.51–∞] | BF+0 585 | 1.39 (0.089) | 0.27 [−0.06–∞] | BF0+ 1.16 | 4.44 (<0.001) | 0.85 [0.48–∞] | BF+0 58 |
| REP | 0.80 (0.21) | 0.16 [−0.17–∞] | BF0+ 2.36 | 4.51 (<0.001) | 0.87 [0.49–∞] | BF+0 438 | 3.49 (<0.001) | 0.67 [0.32–∞] | BF+0 42 | 3.08 (0.002) | 0.59 [0.24–∞] | BF+0 17 |
| WRIT | 0.76 (0.23) | 0.15 [−0.17–∞] | BF0+ 2.47 | 2.83 (0.004) | 0.54 [0.20–∞] | BF+0 10.2 | 1.06 (0.15) | 0.21 [−0.12–∞] | BF0+ 1.75 | 3.19 (0.002) | 0.61 [0.26–∞] | BF+0 22 |
| NAM | 0.28 (0.39) | 0.05 [−0.26–∞] | BF0+ 3.91 | 4.17 (<0.001) | 0.80 [0.43–∞] | BF+0 196 | 2.17 (0.019) | 0.42 [0.08–∞] | BF+0 2.96 | 3.19 (0.002) | 0.62 [0.26–∞] | BF+0 7.55 |
| COMP | −0.76 (0.77) | −0.15 [−0.46–∞] | BF0+ 7.99 | 3.84 (<0.001) | 0.74 [0.37–∞] | BF+0 91 | 2.98 (0.003) | 0.57 [0.23–∞] | BF+0 14 | 3.28 (0.001) | 0.63 [0.28–∞] | BF+0 27 |
| B | Period 1 | Period 2 | Period 2−1 | Period 1 + 2 | ||||||||
| BIAS (n = 10) | t(9) * (p-v.) | Cohen d [95%-CI] | Bayes Factor | t(9) * (p-v.) | Cohen d [95%-CI] | Bayes Factor | t(9) * (p-v.) | Cohen d [95%-CI] | Bayes Factor | t(9) * (p-v.) | Cohen d [95%-CI] | Bayes Factor |
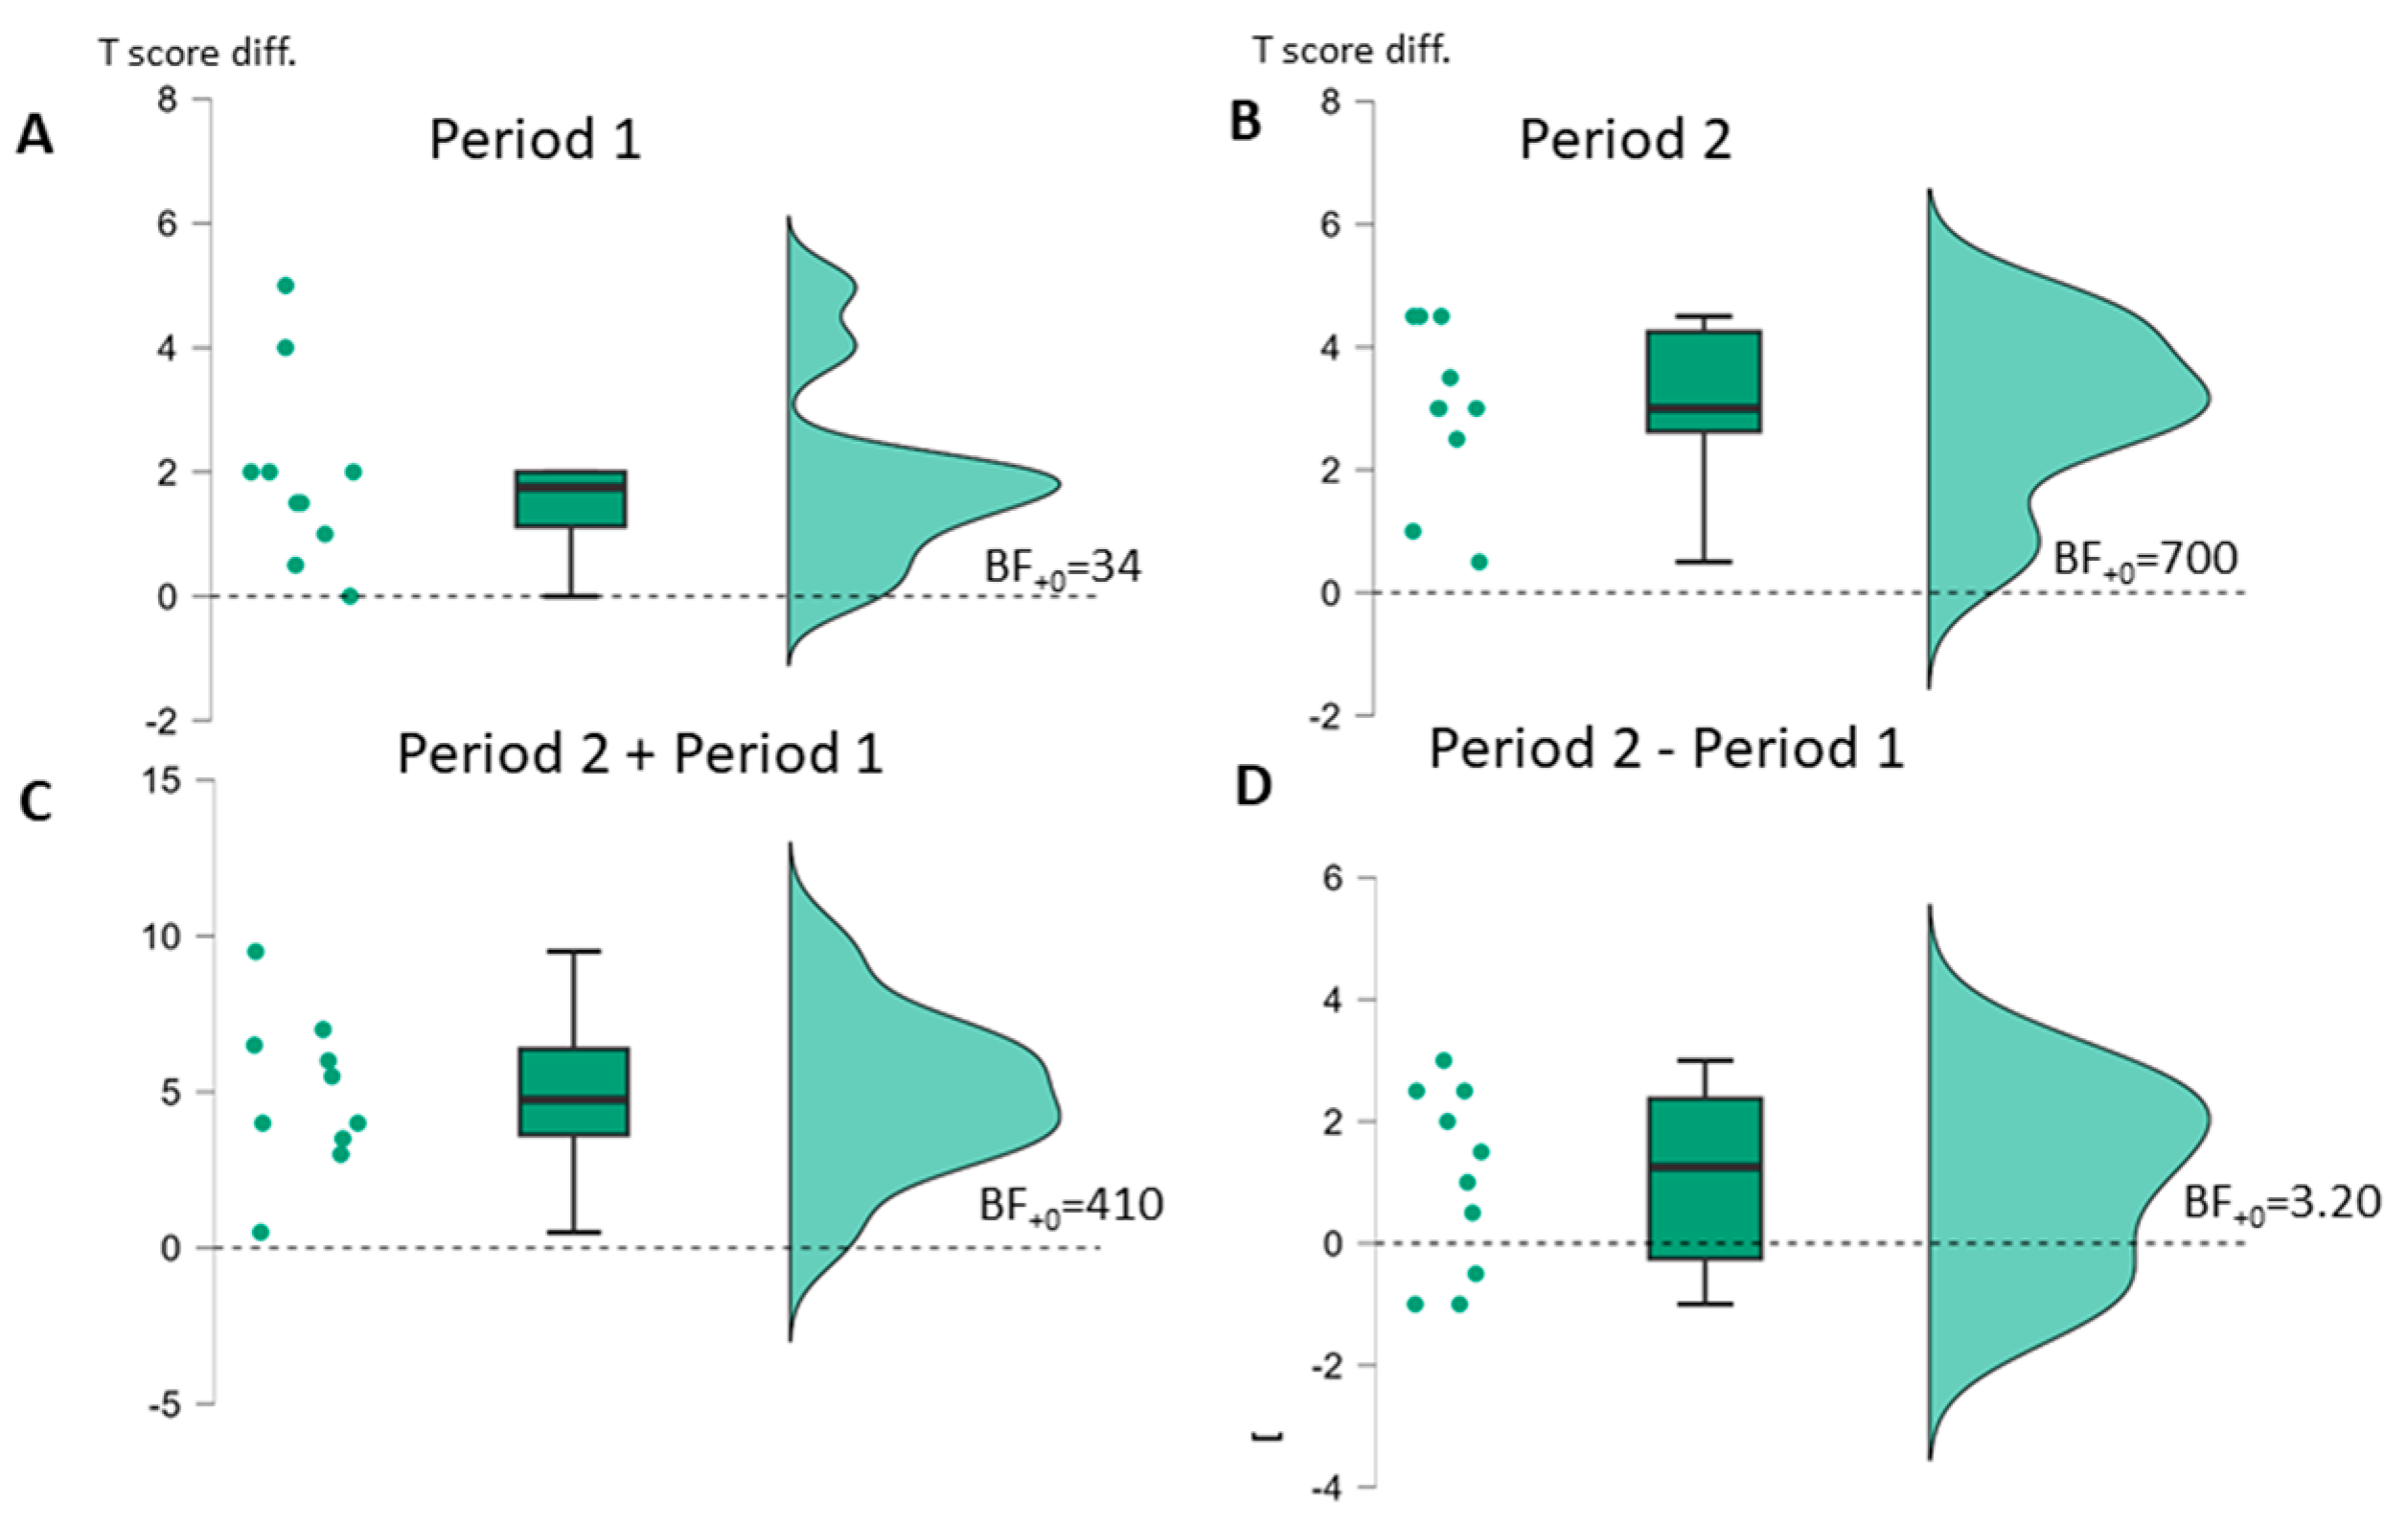
| Profile | 4.06 (0.001) | 1.29 [0.55–∞] | BF+0 34 | 6.80 (<0.001) | 2.15 [1.15–∞] | BF+0 700 | 2.22 (0.027) | 0.70 [0.10–∞] | BF+0 3.20 | 6.26 (<0.001) | 1.98 [1.03–∞] | BF+0 410 |
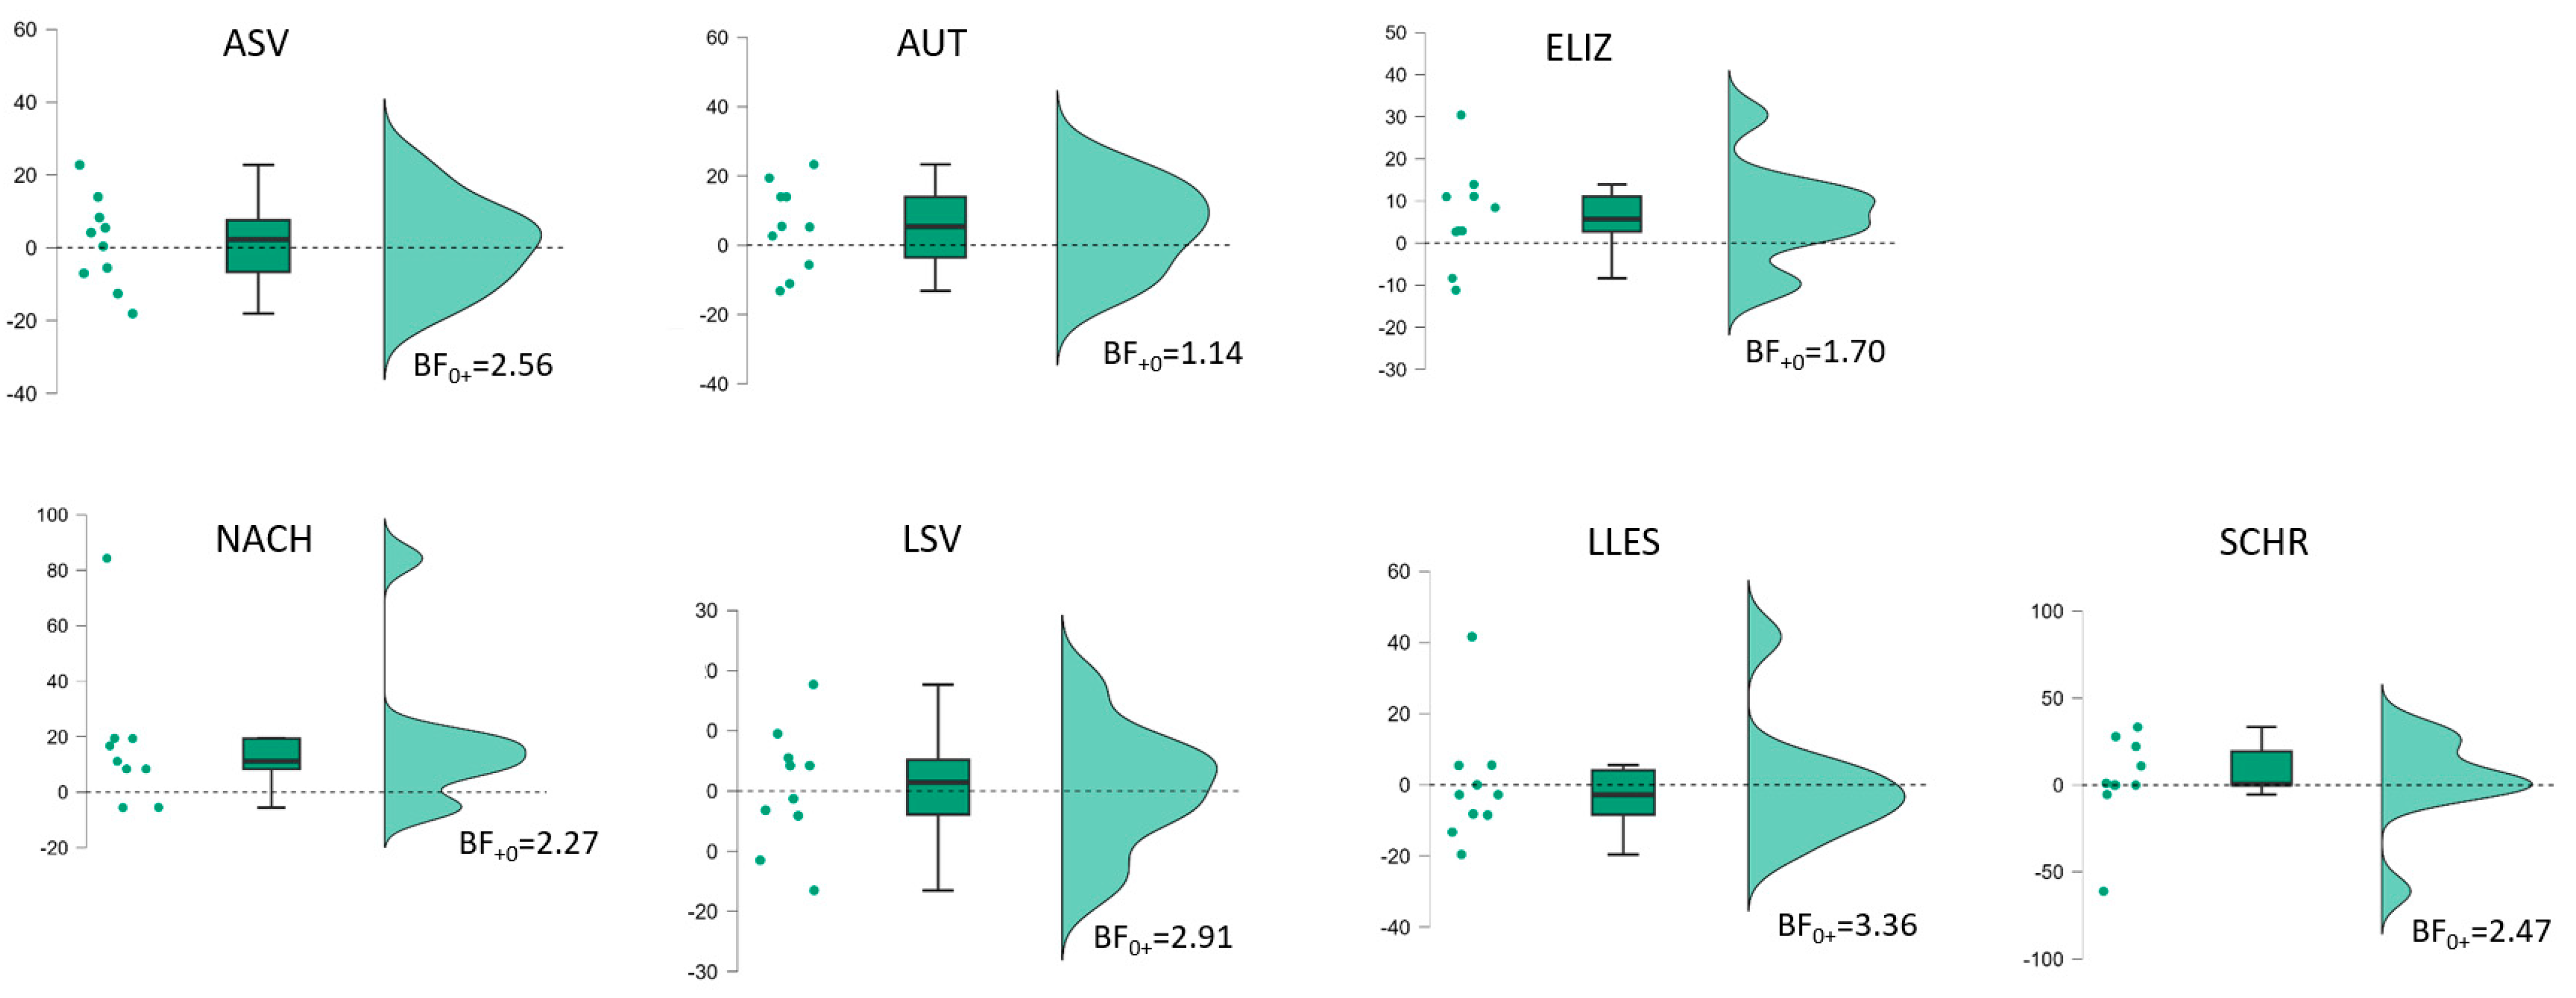
| ASV | 1.69 (0.063) | 0.54 [−0.04–∞] | BF+0 1.65 | 3.68 (0.003) | 1.16 [0.46–∞] | BF+0 21 | 0.31 (0.38) | 0.10 [−0.43–∞] | BF0+ 2.56 | 3.52 (0.003) | 1.11 [0.42–∞] | BF+0 17 |
| AUT | 3.26 (0.005) | 10.03 [0.36–∞] | BF+0 12 | 5.46 (<0.001) | 1.73 [0.50–∞] | BF+0 176 | 1.37 (0.102) | 0.43 [−0.12–∞] | BF+0 1.14 | 6.21 (<0.001) | 1.96 [1.02–∞] | BF+0 390 |
| ELIZ | 0.23 (0.41) | 0.07 [−0.45–∞] | BF0+ 2.71 | 2.49 (0.017) | 0.79 [0.11–∞] | BF+0 4.59 | 1.71 (0.060) | 0.54 [−0.0–∞] | BF+0 1.70 | 2.04 (0.036) | 0.65 [0.05–∞] | BF+0 2.56 |
| NACH (n = 9) | 4.14 (0.002) | 10.38 [0.57–∞] | BF+0 31 | 3.09 (0.007) | 1.03 [0.32–∞] | BF+0 9.19 | 1.94 (0.044) | 0.65 [0.02–∞ | BF+0 2.91 | 4.34 (0.001) | 1.45 [0.62–∞] | BF+0 39 |
| LSV | 2.84 (0.010) | 0.90 [0.26–∞] | BF+0 7.23 | 2.75 (0.011) | 0.87 [0.23–∞] | BF+0 6.40 | 0.14 (0.45) | 0.04 [−0.48–∞] | BF0+ 3.36 | 4.63 (<0.001) | 1.46 [0.67–∞] | BF+0 68 |
| LLES | 3.36 (0.004) | 10.06 [0.38–∞] | BF+0 14 | 1.61 (0.072) | 0.51 [−0.06–∞] | BF+0 1.49 | −0.05 (0.52) | −0.02 [−0.54–∞] | BF0+ 2.56 | 2.78 (0.011) | 0.88 [0.24–∞] | BF+0 6.65 |
| SCHR | 1.38 (0.100) | 0.44 [−0.12–∞] | BF+0 1.15 | 2.81 (0.010) | 0.89 [0.25–∞] | BF+0 6.92 | 0.35 (0.37) | 0.11 [−0.42–∞] | BF0+ 2.47 | 3.30 (0.005) | 1.04 [0.37–∞] | BF+0 13 |
| AAT Profile Level | Period | ||
|---|---|---|---|
| 1 | 2 | 1 + 2 | |
| MS (time) # | 27.879 | 126.745 | 273.510 |
| MS (PwA) # | 103.846 | 127.602 | 117.610 |
| MS (residual) # | 1.718 | 0.940 | 4.035 |
| Estim. σ2 (time) | 0.969 | 4.659 | 9.981 |
| Estim. σ2 (PwA) | 51.064 | 63.331 | 56.7875 |
| Estim. σ2 (residual) | 1.718 | 0.940 | 4.035 |
| Pearson r | 0.970 | 0.993 | 0.951 |
| ICC (consistency) § | 0.967 | 0.985 | 0.934 |
| ICC (agreement) § | 0.950 | 0.919 | 0.802 |
Disclaimer/Publisher’s Note: The statements, opinions and data contained in all publications are solely those of the individual author(s) and contributor(s) and not of MDPI and/or the editor(s). MDPI and/or the editor(s) disclaim responsibility for any injury to people or property resulting from any ideas, methods, instructions or products referred to in the content. |
© 2024 by the authors. Licensee MDPI, Basel, Switzerland. This article is an open access article distributed under the terms and conditions of the Creative Commons Attribution (CC BY) license (https://creativecommons.org/licenses/by/4.0/).
Share and Cite
Rubi-Fessen, I.; Gerbershagen, K.; Stenneken, P.; Willmes, K. Early Boost of Linguistic Skills? Individualized Non-Invasive Brain Stimulation in Early Postacute Aphasia. Brain Sci. 2024, 14, 789. https://doi.org/10.3390/brainsci14080789
Rubi-Fessen I, Gerbershagen K, Stenneken P, Willmes K. Early Boost of Linguistic Skills? Individualized Non-Invasive Brain Stimulation in Early Postacute Aphasia. Brain Sciences. 2024; 14(8):789. https://doi.org/10.3390/brainsci14080789
Chicago/Turabian StyleRubi-Fessen, Ilona, Kathrin Gerbershagen, Prisca Stenneken, and Klaus Willmes. 2024. "Early Boost of Linguistic Skills? Individualized Non-Invasive Brain Stimulation in Early Postacute Aphasia" Brain Sciences 14, no. 8: 789. https://doi.org/10.3390/brainsci14080789