
Release of Iron-Loaded Ferritin in Sodium Iodate-Induced Model of Age Related Macular Degeneration: An In-Vitro and In-Vivo Study

 , , and
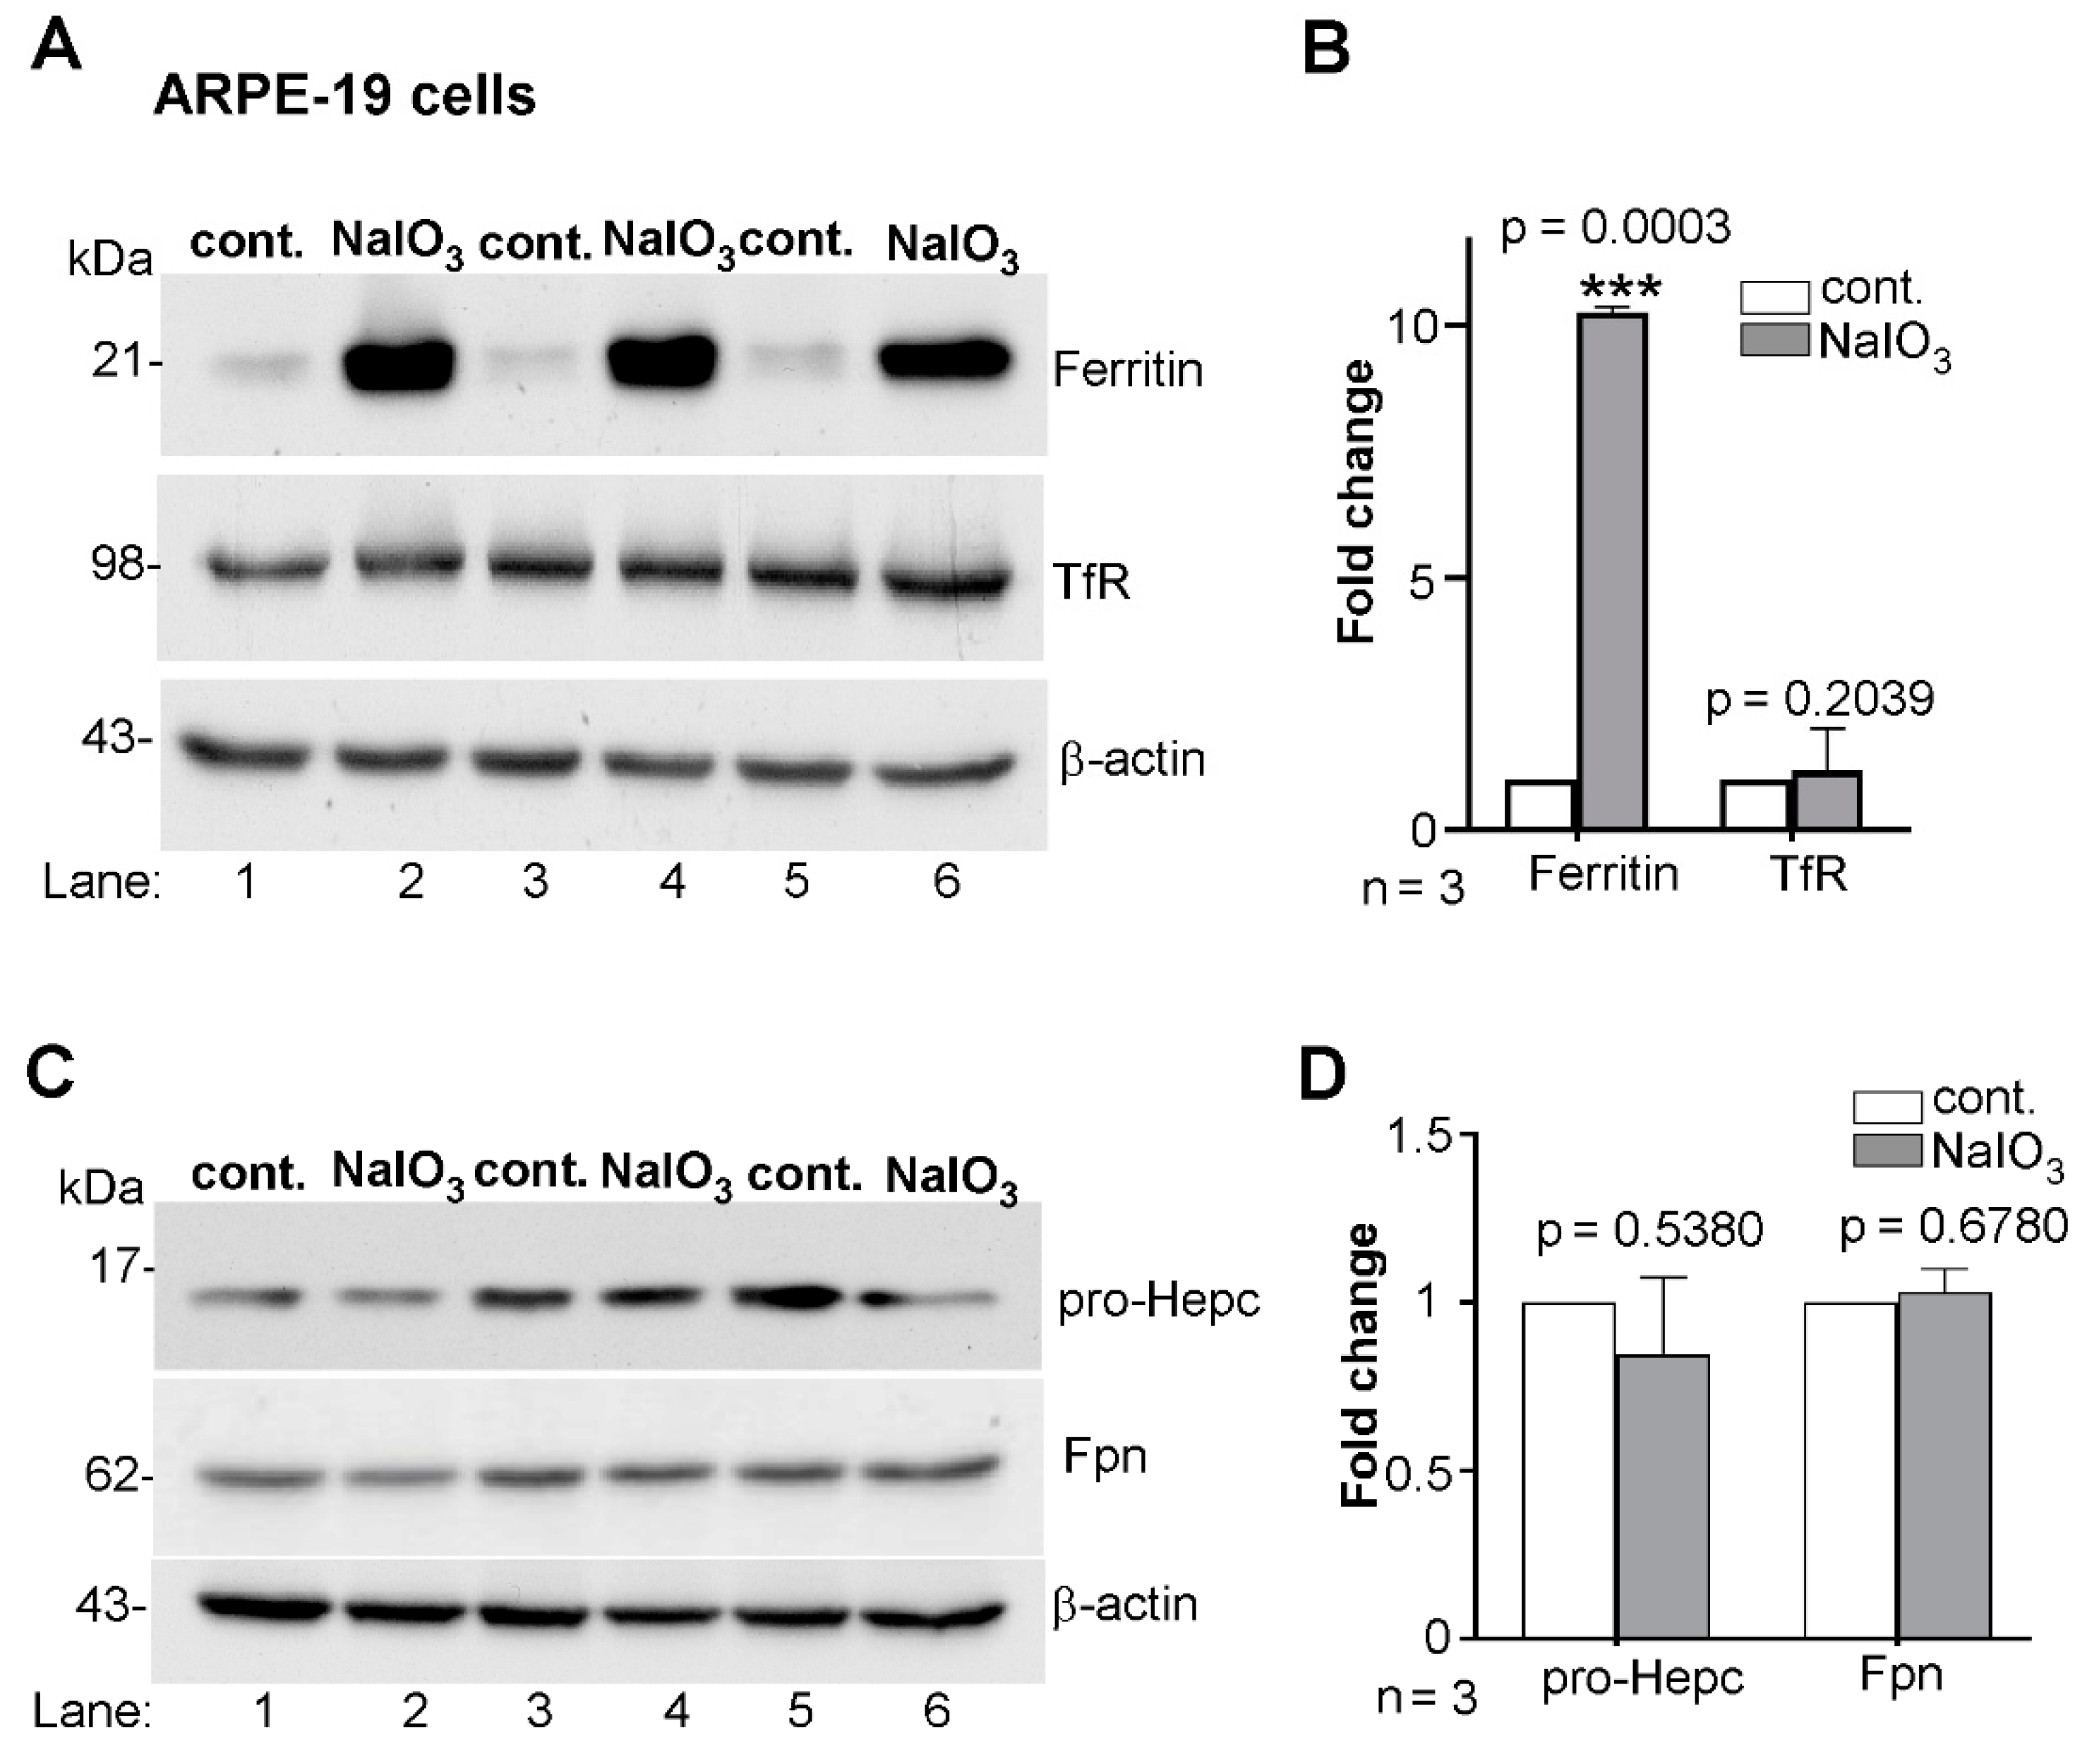
Abstract
1. Introduction
2. Methods
2.1. Ethics Statement
2.2. Antibodies and Chemicals
2.3. Animals
2.4. Cell Culture
2.5. Sodium Dodecyl Sulfate Polyacrylamide Gel Electrophoresis (SDS-PAGE) and Western Blotting
2.6. Quantitative Reverse-Transcriptase Polymerase Chain Reaction (RT-qPCR)
2.7. Immunostaining
2.8. Perls’ Staining
2.9. Statistical Analysis
3. Results
3.1. Ferritin Is Upregulated by Sodium Iodate in ARPE-19 Cells
3.2. Ferritin Co-Localizes with the Autophagosomal Marker LC3II
3.3. Ferritin Accumulates in Lysosomes and Is Released in LAMP-1 Positive Vesicles
3.4. Ferritin Accumulates in the Retina of Sodium-Iodate-Injected Mice
3.5. Accumulated Ferritin Is Loaded with Iron
4. Conclusions
Supplementary Materials
Author Contributions
Funding
Institutional Review Board Statement
Informed Consent Statement
Data Availability Statement
Acknowledgments
Conflicts of Interest
References
- Dunaief, J.L. Iron induced oxidative damage as a potential factor in age-related macular degeneration: The Cogan Lecture. Investig. Ophthalmol. Vis. Sci. 2006, 47, 4660–4664. [Google Scholar] [CrossRef] [PubMed]
- Hahn, P.; Qian, Y.; Dentchev, T.; Chen, L.; Beard, J.; Harris, Z.L.; Dunaief, J.L. Disruption of ceruloplasmin and hephaestin in mice causes retinal iron overload and retinal degeneration with features of age-related macular degeneration. Proc. Natl. Acad. Sci. USA 2004, 101, 13850–13855. [Google Scholar] [CrossRef] [PubMed]
- Biesemeier, A.; Yoeruek, E.; Eibl, O.; Schraermeyer, U. Iron accumulation in Bruch’s membrane and melanosomes of donor eyes with age-related macular degeneration. Exp. Eye Res. 2015, 137, 39–49. [Google Scholar] [CrossRef] [PubMed]
- Datta, S.; Cano, M.; Ebrahimi, K.; Wang, L.; Handa, J.T. The impact of oxidative stress and inflammation on RPE degeneration in non-neovascular AMD. Prog. Retin. Eye Res. 2017, 60, 201–218. [Google Scholar] [CrossRef]
- Hou, X.W.; Wang, Y.; Pan, C.W. Metabolomics in age-related macular degeneration: A systematic review. Investig. Ophthalmol. Vis. Sci. 2020, 61, 13. [Google Scholar] [CrossRef]
- Kevany, B.M.; Palczewski, K. Phagocytosis of retinal rod and cone photoreceptors. Physiology 2010, 25, 8–15. [Google Scholar] [CrossRef] [PubMed]
- Lim, L.S.; Mitchell, P.; Seddon, J.M.; Holz, F.G.; Wong, T.Y. Age-related macular degeneration. Lancet 2012, 379, 1728–1738. [Google Scholar] [CrossRef]
- Rickman, C.B.; Farsiu, S.; Toth, C.A.; Klingeborn, M. Dry age-related macular degeneration: Mechanisms, therapeutic targets, and imaging. Investig. Ophthalmol. Vis. Sci. 2013, 54, ORSF68–ORSF80. [Google Scholar] [CrossRef]
- Bird, A. Role of retinal pigment epithelium in age-related macular disease: A systematic review. Br. J. Ophthalmol. 2020. [CrossRef] [PubMed]
- Strauss, O. The retinal pigment epithelium in visual function. Physiol. Rev. 2005, 85, 845–881. [Google Scholar] [CrossRef] [PubMed]
- Kwon, W.; Freeman, S.A. Phagocytosis by the Retinal Pigment Epithelium: Recognition, Resolution, Recycling. Front. Immunol. 2020, 11, 604205. [Google Scholar] [CrossRef]
- Ashok, A.; Singh, N.; Chaudhary, S.; Bellamkonda, V.; Kritikos, A.E.; Wise, A.S.; Rana, N.; McDonald, D.; Ayyagari, R. Retinal degeneration and Alzheimer’s Disease: An evolving link. Int. J. Mol. Sci. 2020, 21, 7290. [Google Scholar] [CrossRef] [PubMed]
- Gnana-Prakasam, J.P.; Tawfik, A.; Romej, M.; Ananth, S.; Martin, P.M.; Smith, S.B.; Ganapathy, V. Iron-mediated retinal degeneration in haemojuvelin-knockout mice. Biochem. J. 2012, 441, 599–608. [Google Scholar] [CrossRef]
- Song, D.; Kanu, L.N.; Li, Y.; Kelly, K.L.; Bhuyan, R.K.; Aleman, T.; Morgan, J.I.; Dunaief, J.L. AMD-like retinopathy associated with intravenous iron. Exp. Eye Res. 2016, 151, 122–133. [Google Scholar] [CrossRef]
- Hahn, P.; Ying, G.-S.; Beard, J.; Dunaief, J.L. Iron levels in human retina: Sex difference and increase with age. Neuroreport 2006, 17, 1803–1806. [Google Scholar] [CrossRef]
- Hadziahmetovic, M.; Dentchev, T.; Song, Y.; Haddad, N.; He, X.; Hahn, P.; Pratico, D.; Wen, R.; Harris, Z.L.; Lambris, J.D.; et al. Ceruloplasmin/hephaestin knockout mice model morphologic and molecular features of AMD. Investig. Ophthalmol. Vis. Sci. 2008, 49, 2728–2736. [Google Scholar] [CrossRef]
- Chen, H.; Lukas, T.J.; Du, N.; Suyeoka, G.; Neufeld, A.H. Dysfunction of the retinal pigment epithelium with age: Increased iron decreases phagocytosis and lysosomal activity. Investig. Ophthalmol. Vis. Sci. 2009, 50, 1895–1902. [Google Scholar] [CrossRef]
- Regan, C.; De Grip, W.; Daemen, F.; Bonting, S. Degradation of rhodopsin by a lysosomal fraction of retinal pigment epithelium: Biochemical aspects of the visual process. XLI. Exp. Eye Res. 1980, 30, 183–191. [Google Scholar] [CrossRef]
- Chowers, G.; Cohen, M.; Marks-Ohana, D.; Stika, S.; Eijzenberg, A.; Banin, E.; Obolensky, A. Course of Sodium Iodate-Induced Retinal Degeneration in Albino and Pigmented Mice. Investig. Ophthalmol. Vis. Sci. 2017, 58, 2239–2249. [Google Scholar] [CrossRef]
- Balmer, J.; Zulliger, R.; Roberti, S.; Enzmann, V. Retinal Cell Death Caused by Sodium Iodate Involves Multiple Caspase-Dependent and Caspase-Independent Cell-Death Pathways. Int. J. Mol. Sci. 2015, 16, 15086–15103. [Google Scholar] [CrossRef]
- Hanus, J.; Anderson, C.; Sarraf, D.; Ma, J.; Wang, S. Retinal pigment epithelial cell necroptosis in response to sodium iodate. Cell Death Discov. 2016, 2, 16054. [Google Scholar] [CrossRef]
- Moriguchi, M.; Nakamura, S.; Inoue, Y.; Nishinaka, A.; Nakamura, M.; Shimazawa, M.; Hara, H. Irreversible Photoreceptors and RPE Cells Damage by Intravenous Sodium Iodate in Mice Is Related to Macrophage Accumulation. Investig. Ophthalmol. Vis. Sci. 2018, 59, 3476–3487. [Google Scholar] [CrossRef] [PubMed]
- Wang, J.; Iacovelli, J.; Spencer, C.; Saint-Geniez, M. Direct effect of sodium iodate on neurosensory retina. Investig. Ophthalmol. Vis. Sci. 2014, 55, 1941–1953. [Google Scholar] [CrossRef]
- Zhang, X.Y.; Ng, T.K.; Brelen, M.E.; Wu, D.; Wang, J.X.; Chan, K.P.; Yung, J.S.Y.; Cao, D.; Wang, Y.; Zhang, S.; et al. Continuous exposure to non-lethal doses of sodium iodate induces retinal pigment epithelial cell dysfunction. Sci. Rep. 2016, 6, 37279. [Google Scholar] [CrossRef]
- Zhao, J.; Kim, H.J.; Sparrow, J.R. Multimodal Fundus Imaging of Sodium Iodate-Treated Mice Informs RPE Susceptibility and Origins of Increased Fundus Autofluorescence. Investig. Ophthalmol. Vis. Sci. 2017, 58, 2152–2159. [Google Scholar] [CrossRef][Green Version]
- Hadziahmetovic, M.; Pajic, M.; Grieco, S.; Song, Y.; Song, D.; Li, Y.; Cwanger, A.; Iacovelli, J.; Chu, S.; Ying, G.-S.; et al. The oral iron chelator deferiprone protects against retinal degeneration induced through diverse mechanisms. Transl. Vis. Sci. Technol. 2012, 1, 2. [Google Scholar] [CrossRef]
- Baksi, S.; Singh, N. α-Synuclein impairs ferritinophagy in the retinal pigment epithelium: Implications for retinal iron dyshomeostasis in Parkinson’s disease. Sci. Rep. 2017, 7, 1–14. [Google Scholar]
- Ashok, A.; Chaudhary, S.; McDonald, D.; Kritikos, A.; Bhargava, D.; Singh, N. Local synthesis of hepcidin in the anterior segment of the eye: A novel observation with physiological and pathological implications. Exp. Eye Res. 2020, 190, 107890. [Google Scholar] [CrossRef]
- Asthana, A.; Baksi, S.; Ashok, A.; Karmakar, S.; Mammadova, N.; Kokemuller, R.; Greenlee, M.H.; Kong, Q.; Singh, N. Prion protein facilitates retinal iron uptake and is cleaved at the β-site: Implications for retinal iron homeostasis in prion disorders. Sci. Rep. 2017, 7, 1–14. [Google Scholar] [CrossRef]
- Ashok, A.; Kang, M.H.; Wise, A.S.; Pattabiraman, P.; Johnson, W.M.; Lonigro, M.; Ravikumar, R.; Rhee, D.J.; Singh, N. Prion protein modulates endothelial to mesenchyme-like transition in trabecular meshwork cells: Implications for primary open angle glaucoma. Sci. Rep. 2019, 9, 1–15. [Google Scholar] [CrossRef]
- Ashok, A.; Singh, N. Prion protein modulates glucose homeostasis by altering intracellular iron. Sci. Rep. 2018, 8, 1–15. [Google Scholar] [CrossRef]
- Tripathi, A.K.; Karmakar, S.; Asthana, A.; Ajay, A.; Vilok, D.; Shounak, B.; Neena, S. Transport of non-transferrin bound iron to the brain: Implications for Alzheimer’s disease. J. Alzheimers Dis. 2017, 58, 1109–1119. [Google Scholar] [CrossRef]
- Gnana-Prakasam, J.P.; Martin, P.M.; Mysona, B.A.; Roon, P.; Smith, S.B.; Ganapathy, V. Hepcidin expression in mouse retina and its regulation via lipopolysaccharide/Toll-like receptor-4 pathway independent of Hfe. Biochem. J. 2008, 411, 79–88. [Google Scholar] [CrossRef] [PubMed]
- Fujimaki, M.; Furuya, N.; Saiki, S.; Amo, T.; Imamichi, Y.; Hattori, N. Iron supply via NCOA4-mediated ferritin degradation maintains mitochondrial functions. Mol. Cell Biol. 2019, 39. [Google Scholar] [CrossRef]
- Runwal, G.; Stamatakou, E.; Siddiqi, F.H.; Puri, C.; Zhu, Y.; Rubinsztein, D.C. LC3-positive structures are prominent in autophagy-deficient cells. Sci. Rep. 2019, 9, 1–14. [Google Scholar] [CrossRef]
- Yadati, T.; Houben, T.; Bitorina, A.; Shiri-Sverdlov, R. The ins and outs of cathepsins: Physiological function and role in disease management. Cells 2020, 9, 1679. [Google Scholar] [CrossRef]
- Zaidi, N.; Maurer, A.; Nieke, S.; Kalbacher, H. Cathepsin D: A cellular roadmap. Biochem. Biophys. Res. Commun. 2008, 376, 5–9. [Google Scholar] [CrossRef] [PubMed]
- Zhang, Y.; Mikhael, M.; Xu, D.; Li, Y.; Soe-Lin, S.; Ning, B.; Li, W.; Nie, G.; Zhao, Y.; Ponka, P. Lysosomal proteolysis is the primary degradation pathway for cytosolic ferritin and cytosolic ferritin degradation is necessary for iron exit. Antioxid. Redox Signal. 2010, 13, 999–1009. [Google Scholar] [CrossRef]
- Ganz, T. Systemic iron homeostasis. Physiol. Rev. 2013, 93, 1721–1741. [Google Scholar] [CrossRef]
- Bellelli, R.; Federico, G.; Matte, A.; Colecchia, D.; Iolascon, A.; Chiariello, M.; Santoro, M.; De Franceschi, L.; Carlomagno, F. NCOA4 deficiency impairs systemic iron homeostasis. Cell Rep. 2016, 14, 411–421. [Google Scholar] [CrossRef] [PubMed]
- Masaldan, S.; Clatworthy, S.A.S.; Gamell, C.; Meggyesy, P.M.; Rigopoulos, A.-T.; Haupt, S.; Haupt, Y.; Denoyer, D.; Adlard, P.A.; Bush, A.; et al. Iron accumulation in senescent cells is coupled with impaired ferritinophagy and inhibition of ferroptosis. Redox Biol. 2018, 14, 100–115. [Google Scholar] [CrossRef] [PubMed]
- Nai, A.; Lidonnici, M.R.; Federico, G.; Pettinato, M.; Olivari, V.; Carrillo, F.; Crich, S.G.; Ferrari, G.; Camaschella, C.; Silvestri, L.; et al. NCOA4-mediated ferritinophagy in macrophages is crucial to sustain erythropoiesis in mice. Haematologica 2021, 106, 795–805. [Google Scholar] [CrossRef] [PubMed]
- Truman-Rosentsvit, M.; Berenbaum, D.; Spektor, L.; Cohen, L.A.; Belizowsky-Moshe, S.; Lifshitz, L.; Marianna, T.-R.; Li, W.; Kesselman, E.; Abutbul-Ionita, I.; et al. Ferritin is secreted via 2 distinct nonclassical vesicular pathways. Blood 2018, 131, 342–352. [Google Scholar] [CrossRef] [PubMed]
- Chiou, B.; Connor, J.R. Emerging and dynamic biomedical uses of ferritin. Pharmaceuticals 2018, 11, 124. [Google Scholar] [CrossRef]
- Mendes-Jorge, L.; Ramos, D.; Valença, A.; López-Luppo, M.; Pires, V.M.R.; Catita, J.; Nacher, V.; Navarro, M.; Carretero, A.; Rodriguez-Baeza, A.; et al. L-ferritin binding to scara5: A new iron traffic pathway potentially implicated in retinopathy. PLoS ONE 2014, 9, e106974. [Google Scholar] [CrossRef] [PubMed]
- Atienzar-Aroca, S.; Serrano-Heras, G.; Freire Valls, A.; de Almodovar, C.R.; Muriach, M.; Barcia, J.M.; Garcia-Verdugo, J.M.; Romero, F.J.; Sancho-Pelluz, J. Role of retinal pigment epithelium-derived exosomes and autophagy in new blood vessel formation. J. Cell Mol. Med. 2018, 22, 5244–5256. [Google Scholar] [CrossRef]
- Klingeborn, M.; Dismuke, W.M.; Skiba, N.P.; Kelly, U.; Stamer, W.D.; Bowes Rickman, C. Directional Exosome Proteomes Reflect Polarity-Specific Functions in Retinal Pigmented Epithelium Monolayers. Sci. Rep. 2017, 7, 4901. [Google Scholar] [CrossRef]
- Lin, Y.-C.; Horng, L.-Y.; Sung, H.-C.; Wu, R.-T. Sodium iodate disrupted the mitochondrial-lysosomal axis in cultured retinal pigment epithelial cells. J. Ocul. Pharmacol. Ther. 2018, 34, 500–511. [Google Scholar] [CrossRef]
- Bassal, M.; Liu, J.; Jankowiak, W.; Saftig, P.; Bartsch, U. Rapid and progressive loss of multiple retinal cell types in cathepsin D-deficient mice—An animal model of CLN10 disease. Cells 2021, 10, 696. [Google Scholar] [CrossRef]


Publisher’s Note: MDPI stays neutral with regard to jurisdictional claims in published maps and institutional affiliations. |
© 2021 by the authors. Licensee MDPI, Basel, Switzerland. This article is an open access article distributed under the terms and conditions of the Creative Commons Attribution (CC BY) license (https://creativecommons.org/licenses/by/4.0/).
Share and Cite
Ashok, A.; Chaudhary, S.; Wise, A.S.; Rana, N.A.; McDonald, D.; Kritikos, A.E.; Lindner, E.; Singh, N. Release of Iron-Loaded Ferritin in Sodium Iodate-Induced Model of Age Related Macular Degeneration: An In-Vitro and In-Vivo Study. Antioxidants 2021, 10, 1253. https://doi.org/10.3390/antiox10081253
Ashok A, Chaudhary S, Wise AS, Rana NA, McDonald D, Kritikos AE, Lindner E, Singh N. Release of Iron-Loaded Ferritin in Sodium Iodate-Induced Model of Age Related Macular Degeneration: An In-Vitro and In-Vivo Study. Antioxidants. 2021; 10(8):1253. https://doi.org/10.3390/antiox10081253
Chicago/Turabian StyleAshok, Ajay, Suman Chaudhary, Aaron S. Wise, Neil A. Rana, Dallas McDonald, Alexander E. Kritikos, Ewald Lindner, and Neena Singh. 2021. "Release of Iron-Loaded Ferritin in Sodium Iodate-Induced Model of Age Related Macular Degeneration: An In-Vitro and In-Vivo Study" Antioxidants 10, no. 8: 1253. https://doi.org/10.3390/antiox10081253
APA StyleAshok, A., Chaudhary, S., Wise, A. S., Rana, N. A., McDonald, D., Kritikos, A. E., Lindner, E., & Singh, N. (2021). Release of Iron-Loaded Ferritin in Sodium Iodate-Induced Model of Age Related Macular Degeneration: An In-Vitro and In-Vivo Study. Antioxidants, 10(8), 1253. https://doi.org/10.3390/antiox10081253