
Untargeted Metabolomic Approach of Curcuma longa to Neurodegenerative Phytocarrier System Based on Silver Nanoparticles

 , , and
Abstract
:1. Introduction
2. Materials and Methods
2.1. Preparation of Phytocarrier System Components
2.2. Plant Preparation for Chemical Screening
2.3. GC-MS Analysis
2.4. GC-MS Separation Conditions
2.5. Mass Spectrometry
2.6. Phytocarrier System Preparation
2.7. Characterisation of the Phytocarrier System
2.8. Fourier Transform Infrared (FTIR) Spectroscopy
2.9. XDR Spectroscoy
2.10. Scanning Electron Microscopy (SEM)
2.11. Dynamic Light Scattering (DLS) Particle Size Distribution Analysis
2.12. High-Resolution Transmission Electron Microscopy (HR-TEM)
2.13. Zeta Potential Analysis
2.14. Antioxidant Activity
2.15. Determination of Total Phenolic Content
2.16. DPPH Radical Scavenging Assay
2.17. Statistical Analysis
2.18. Trolox Equivalent Antioxidant Capacity (TEAC) Electrochemical Assays
3. Results and Discussions

| No | Retention Time (RT) | Retention Index (RI) | Adams Index (AI) | Area% | Compound Name | Ref. |
|---|---|---|---|---|---|---|
| 1 | 14.771 | 1439 | 1417 | 0.36 | α-caryophyllene | [70] |
| 2 | 16.057 | 1502 | 1479 | 8.84 | Ar-curcumene | [71,72,73,74,75] |
| 3 | 16.337 | 1516 | 1493 | 0.71 | α-zingiberene | [74,75,76,77,78] |
| 4 | 16.6 | 1529 | 1505 | 1.14 | β-cisabolene | [70,74,75,76] |
| 5 | 16.92 | 1545 | 1521 | 1.08 | β-sesquiphellandrene | [70,72,74,75,76] |
| 6 | 18.515 | 1624 | 1718 | 0.42 | santalol, cis,β- | [75,76] |
| 6 | 19.618 | 1678 | 1668 | 50.01 | Ar-turmerone | [72,74,75] |
| 7 | 19.703 | 1682 | 1664 | 8.70 | turmerone | [72,74,75,76,77] |
| 8 | 20.315 | 1713 | 1699 | 18.47 | curlone | [70,72,75,76,77,78] |
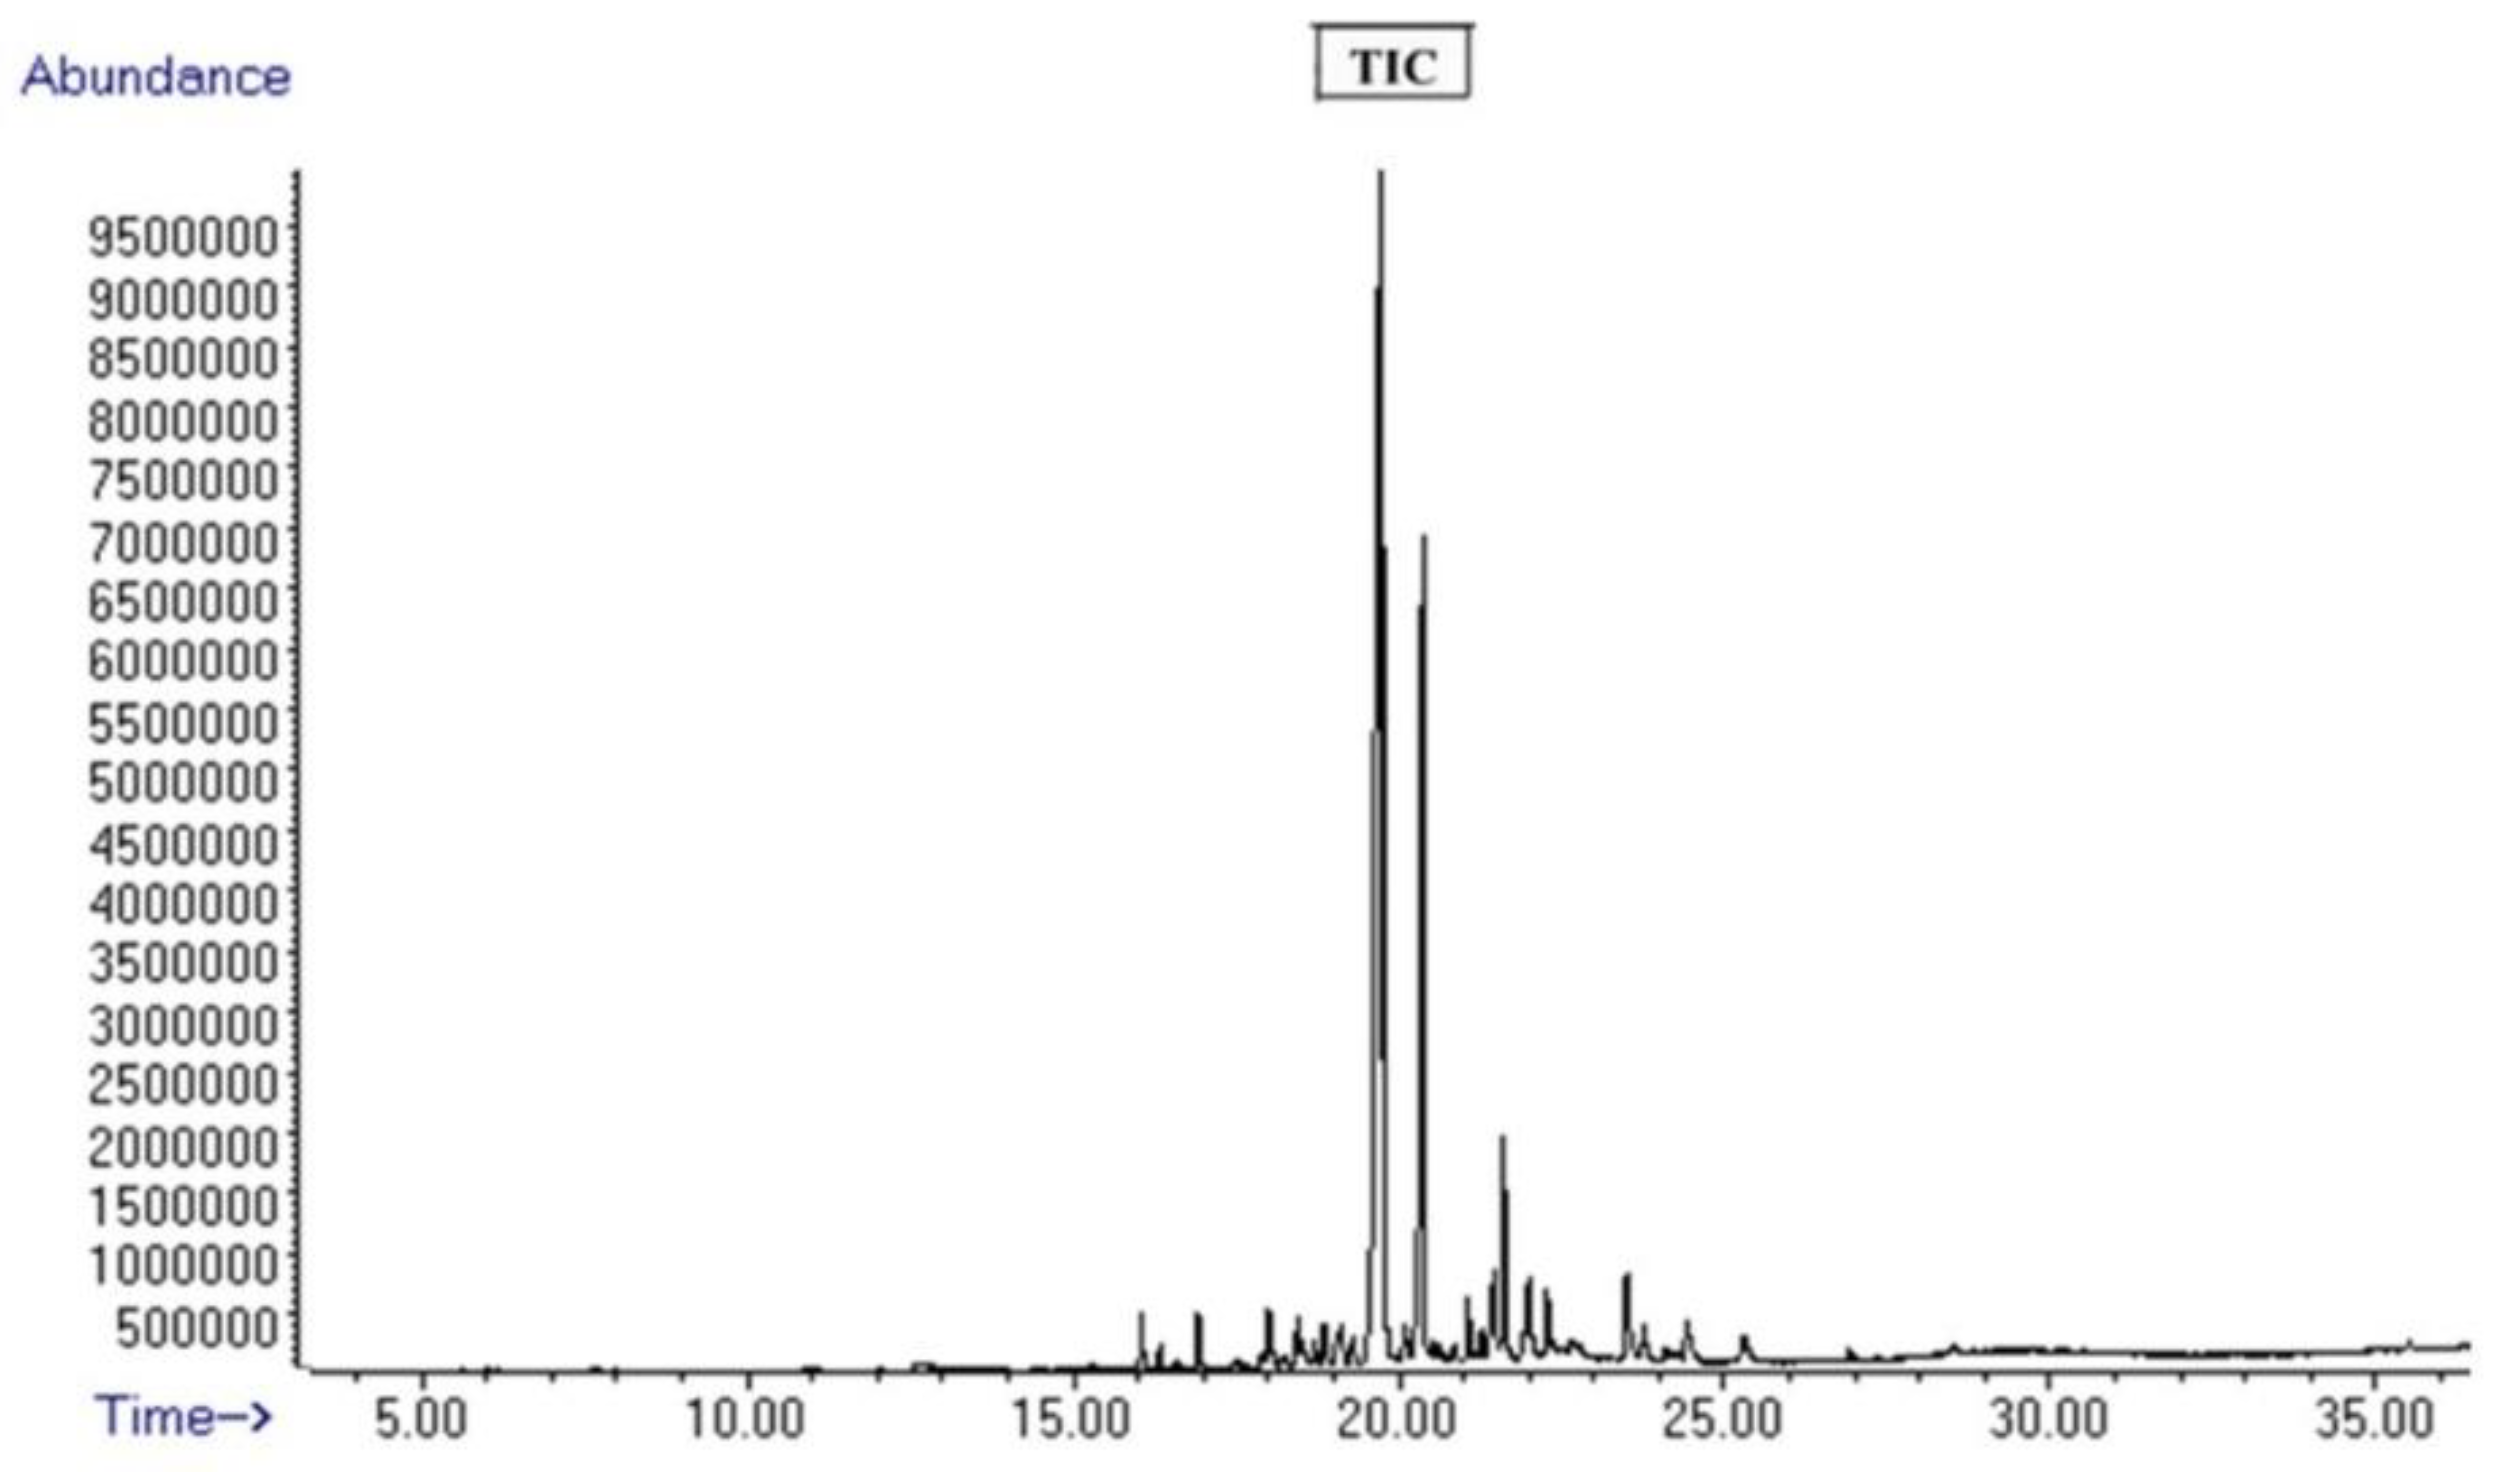
3.1. Mass Spectrometric Analysis of Curcuma Sample

| No | Detected m/z | Theoretic m/z | Formula | Tentative Identification | Category | Ref. |
|---|---|---|---|---|---|---|
| 1 | 75.09 | 75.07 | C2H5NO2 | glycine | amino acid | [83] |
| 2 | 89.08 | 89.09 | C3H7NO2 | alanine | amino acid | [83] |
| 3 | 105.08 | 105.09 | C3H7NO3 | serine | amino acid | [83] |
| 4 | 115.11 | 115.13 | C5H9NO2 | proline | amino acid | [83] |
| 5 | 117.14 | 117.15 | C5H11NO2 | valine | amino acid | [83] |
| 6 | 120.19 | 120.19 | C9H12 | trimethylbenzene | miscellaneous | [84] |
| 7 | 131.15 | 131.17 | C6H13NO2 | leucine | amino acid | [73] |
| 8 | 133.11 | 133.10 | C4H7NO4 | aspartic acid | amino acid | [83] |
| 9 | 134.21 | 134.22 | C10H14 | cymene | terpenoid | [85] |
| 10 | 136.22 | 136.23 | C10H16 | limonene | terpenoid | [86] |
| 11 | 136.24 | 136.23 | C10H16 | terpinene | terpenoid | [65,85] |
| 12 | 146.12 | 146.14 | C9H6O2 | coumarin | coumarin | [82] |
| 13 | 147.11 | 147.13 | C5H9NO4 | glutamic acid | amino acid | [83] |
| 14 | 148.15 | 148.16 | C9H8O2 | cinnamic acid | phenolic acid | [87] |
| 15 | 149.22 | 149.21 | C5H11NO2S | methionine | amino acid | [83] |
| 16 | 150.23 | 150.22 | C10H14O | tymol | terpenoid | [75,77] |
| 17 | 152.24 | 152.23 | C10H16O | thujone | terpenoids | [88] |
| 18 | 154.11 | 154.12 | C7H6O4 | protocatechuic acid | phenolic acid | [82] |
| 19 | 154.27 | 154.25 | C10H18O | terpineol | terpenoid | [85] |
| 20 | 164.17 | 164.16 | C9H8O3 | p-coumaric acid | phenolic acid | [86] |
| 21 | 164.19 | 164.20 | C10H12O2 | eugenol | terpenoids | [86] |
| 22 | 165.21 | 165.19 | C9H11NO2 | phenylalanine | amino acid | [83] |
| 23 | 170.13 | 170.12 | C7H6O5 | gallic acid | phenolic acid | [82] |
| 24 | 170.30 | 170.29 | C11H22O | undecan-2-one | miscellaneous | [74] |
| 25 | 174.21 | 174.20 | C6H14N4O2 | arginine | amino acid | [83] |
| 26 | 180.15 | 180.16 | C9H8O4 | caffeic acid | phenolic acid | [86] |
| 27 | 182.29 | 182.30 | C12H22O | dodec-11-en-2-one | miscellaneous | [84] |
| 28 | 192.23 | 192.21 | C11H12O3 | dehydrozingerone | flavonoids | [84,89] |
| 29 | 194.19 | 194.18 | C10H10O4 | ferulic acid | phenolic acid | [82] |
| 30 | 194.24 | 194.23 | C11H14O3 | zingiberone | terpenoids | [79] |
| 31 | 202.31 | 202.33 | C15H22 | β-curcumene | terpenoid | [85] |
| 32 | 204.33 | 204.35 | C15H24 | zingiberene | terpenoid | [85] |
| 33 | 216.33 | 216.32 | C15H20O | turmerone | terpenoid | [85] |
| 34 | 218.31 | 218.33 | C15H22O | germacrone | terpenoid | [85,89] |
| 35 | 220.33 | 220.35 | C15H24O | turmerol | terpenoid | [85,89] |
| 36 | 204.34 | 204.35 | C15H24 | zingibrene | terpenoids | [74,75,87,88,89,90] |
| 37 | 216.31 | 216.32 | C15H20O | curzerene | terpenoid | [89,91] |
| 38 | 218.34 | 218.33 | C15H22O | a-costal | terpenoid | [75] |
| 39 | 220.36 | 220.35 | C15H24O | santanol | terpenoid | [74] |
| 40 | 222.34 | 222.35 | C15H24O | a-copaen-11-ol | terpenoid | [75] |
| 41 | 222.26 | 222.37 | C15H26O | a-bisabolol | terpenoid | [87,88] |
| 42 | 230.29 | 230.30 | C15H18O2 | curzerenone | terpenoid | [74,85] |
| 43 | 232.33 | 232.32 | C15H20O2 | glechomanolide | terpenoids | [89] |
| 44 | 234.31 | 234.33 | C15H22O2 | curcumenol | terpenoids | [83] |
| 45 | 236.37 | 236.35 | C15H24O2 | curdione | terpenoids | [89] |
| 46 | 246.31 | 246.30 | C15H18O3 | zederone | terpenoids | [89] |
| 47 | 250.32 | 250.33 | C15H22O3 | procurcumadiol | terpenoids | [86] |
| 48 | 252.33 | 252.35 | C15H24O3 | bisacurone | terpenoids | [92] |
| 49 | 254.23 | 254.24 | C15H10O4 | 2-hydroxy-3-(hydroxymethyl)anthraquinone | miscellaneous | [89] |
| 50 | 256.41 | 256.42 | C16H32O2 | palmitic acid | fatty acid | [67] |
| 51 | 270.23 | 270.24 | C15H10O5 | apigenin | flavonoids | [83] |
| 52 | 272.23 | 272.25 | C15H12O5 | naringenin | flavonoids | [80] |
| 53 | 280.39 | 280.40 | C18H32O2 | linoleic acid | fatty acid | [67] |
| 54 | 282.49 | 282.5 | C18H34O2 | oleic acid | fatty acid | [67] |
| 55 | 284.51 | 284.5 | C18H36O2 | stearic acid | fatty acid | [67] |
| 56 | 290.28 | 290.27 | C15H14O6 | epicatechin | flavonoids | [82] |
| 57 | 290.39 | 290.4 | C19H30O2 | methyl stearidonate | fatty acids | [84] |
| 58 | 302.22 | 302.23 | C15H10O7 | quercetin | flavonoids | [80] |
| 59 | 308.29 | 308.30 | C19H16O4 | bisdemethoxycurcumin | flavonoids | [85] |
| 60 | 316.39 | 316.4 | C19H24O4 | 1,7-bis(4-hydroxyphenyl)-3,5-heptanediol | diarylheptanoid | [93] |
| 61 | 318.21 | 318.23 | C15H10O8 | myricetin | flavonoids | [82] |
| 62 | 326.29 | 326.3 | C19H18O5 | 1,5-bis(4-hydroxy-3-methoxyphenyl)-1,4-pentadien-3-one | diarylheptanoid | [93] |
| 63 | 354.29 | 354.31 | C16H18O9 | chlorogenic acid | phenolic acid | [82] |
| 64 | 368.37 | 368.39 | C21H20O6 | curcumin | diarylheptanoid | [85] |
| 65 | 368.41 | 368.40 | C21H20O6 | cyclocurcumin | diarylheptanoid | [92] |
| 66 | 370.39 | 370.4 | C21H22O6 | 1,2-dihydrocurcumin | diarylheptanoid | [93] |
| 67 | 390.49 | 390.5 | C23H34O5 | gitoxigenin | steroids | [93] |
| 68 | 386.39 | 396.40 | C23H24O6 | dimethoxycurcumin | diarylheptanoid | [85] |
| 69 | 386.69 | 386.70 | C27H46O | cholesterol | sterols | [86] |
| 70 | 400.68 | 400.70 | C28H48O | campesterol | sterols | [86] |
| 71 | 402.49 | 402.50 | C25H26N2O3 | aurantiamide | alkaloid | [80] |
| 72 | 412.68 | 412.70 | C29H48O | beta-stigmasterol | steroids | [94] |
| 73 | 414.69 | 414.70 | C29H50O | sitosterol | steroids | [94] |
| 74 | 424.49 | 424.5 | C25H28O6 | tetramethylcurcumin | diarylheptanoid | [93] |
| 75 | 432.39 | 432.4 | C21H20O10 | tetrahydroxycurcumin | diarylheptanoid | [93] |
| 76 | 536.89 | 536.9 | C40H56 | beta-carotene | miscellaneous | [86] |
| 77 | 594.49 | 594.5 | C27H30O15 | kaempferol-3-rutinoside | flavonoid | [93] |
| 78 | 610.49 | 610.50 | C27H30O16 | rutin | flavonoid | [82] |
| 79 | 588.71 | 588.70 | C36H44O7 | terpecurcumin A | terpenoids | [95] |
| 80 | 602.71 | 602.70 | C36H42O8 | terpecurcumin D | terpenoids | [95] |
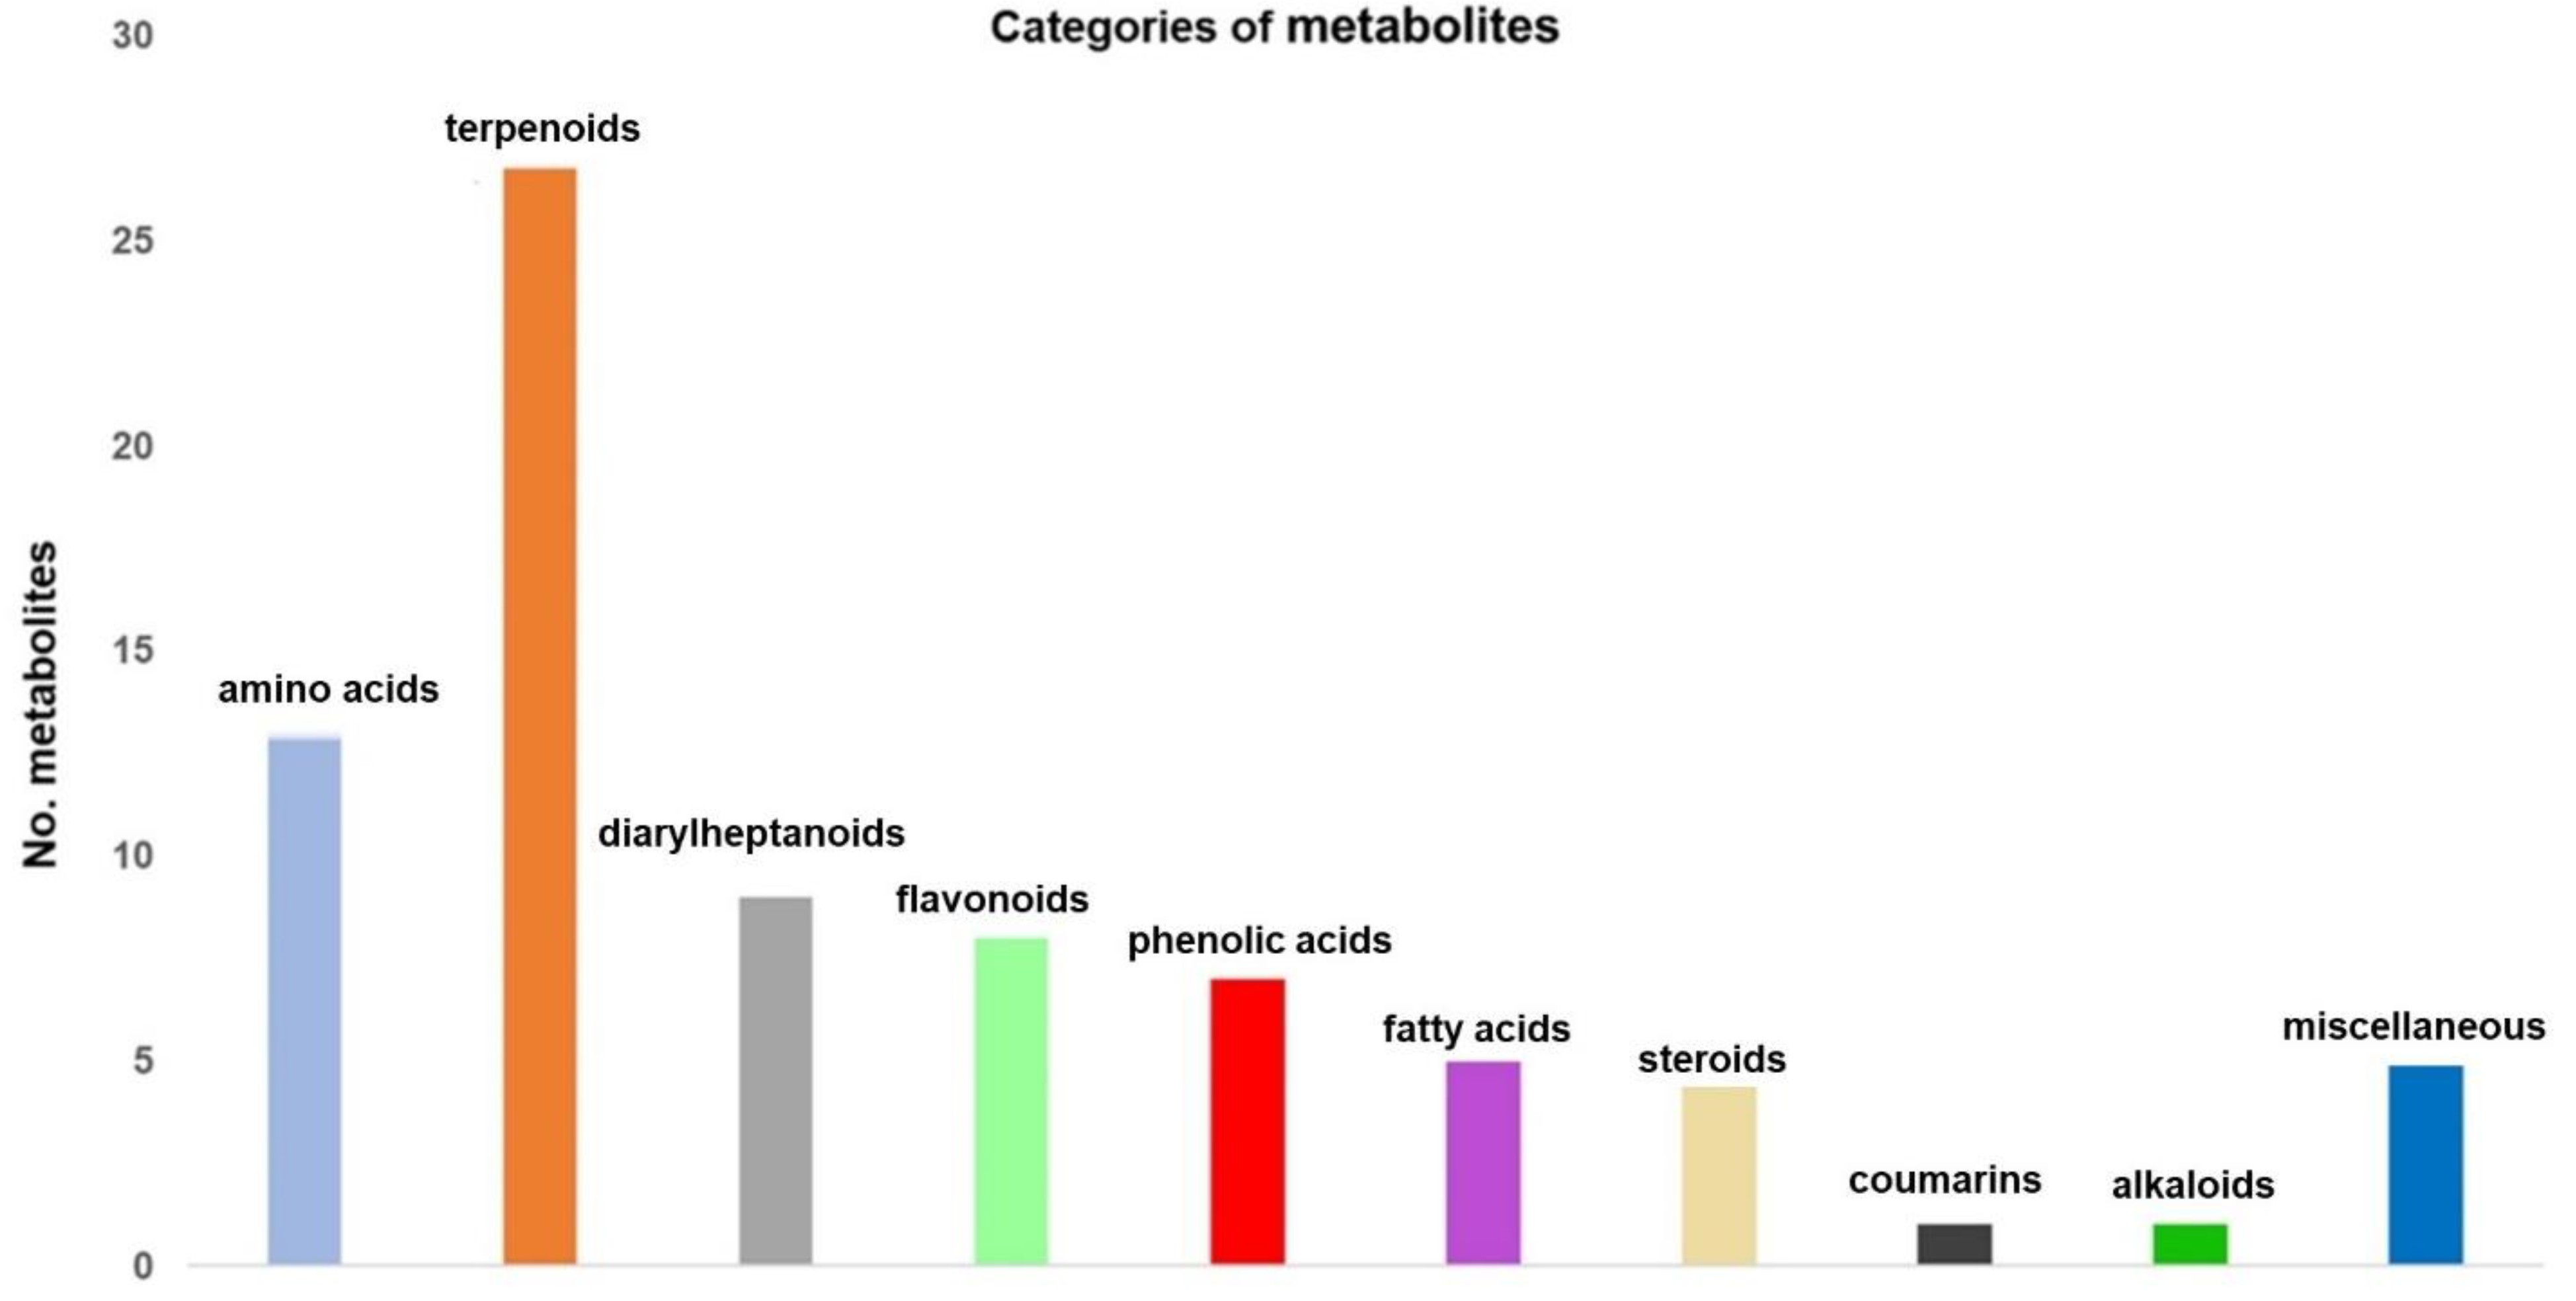
3.2. Screening and Classification of the Differential Metabolites
3.3. Phytoengineered Carrier System
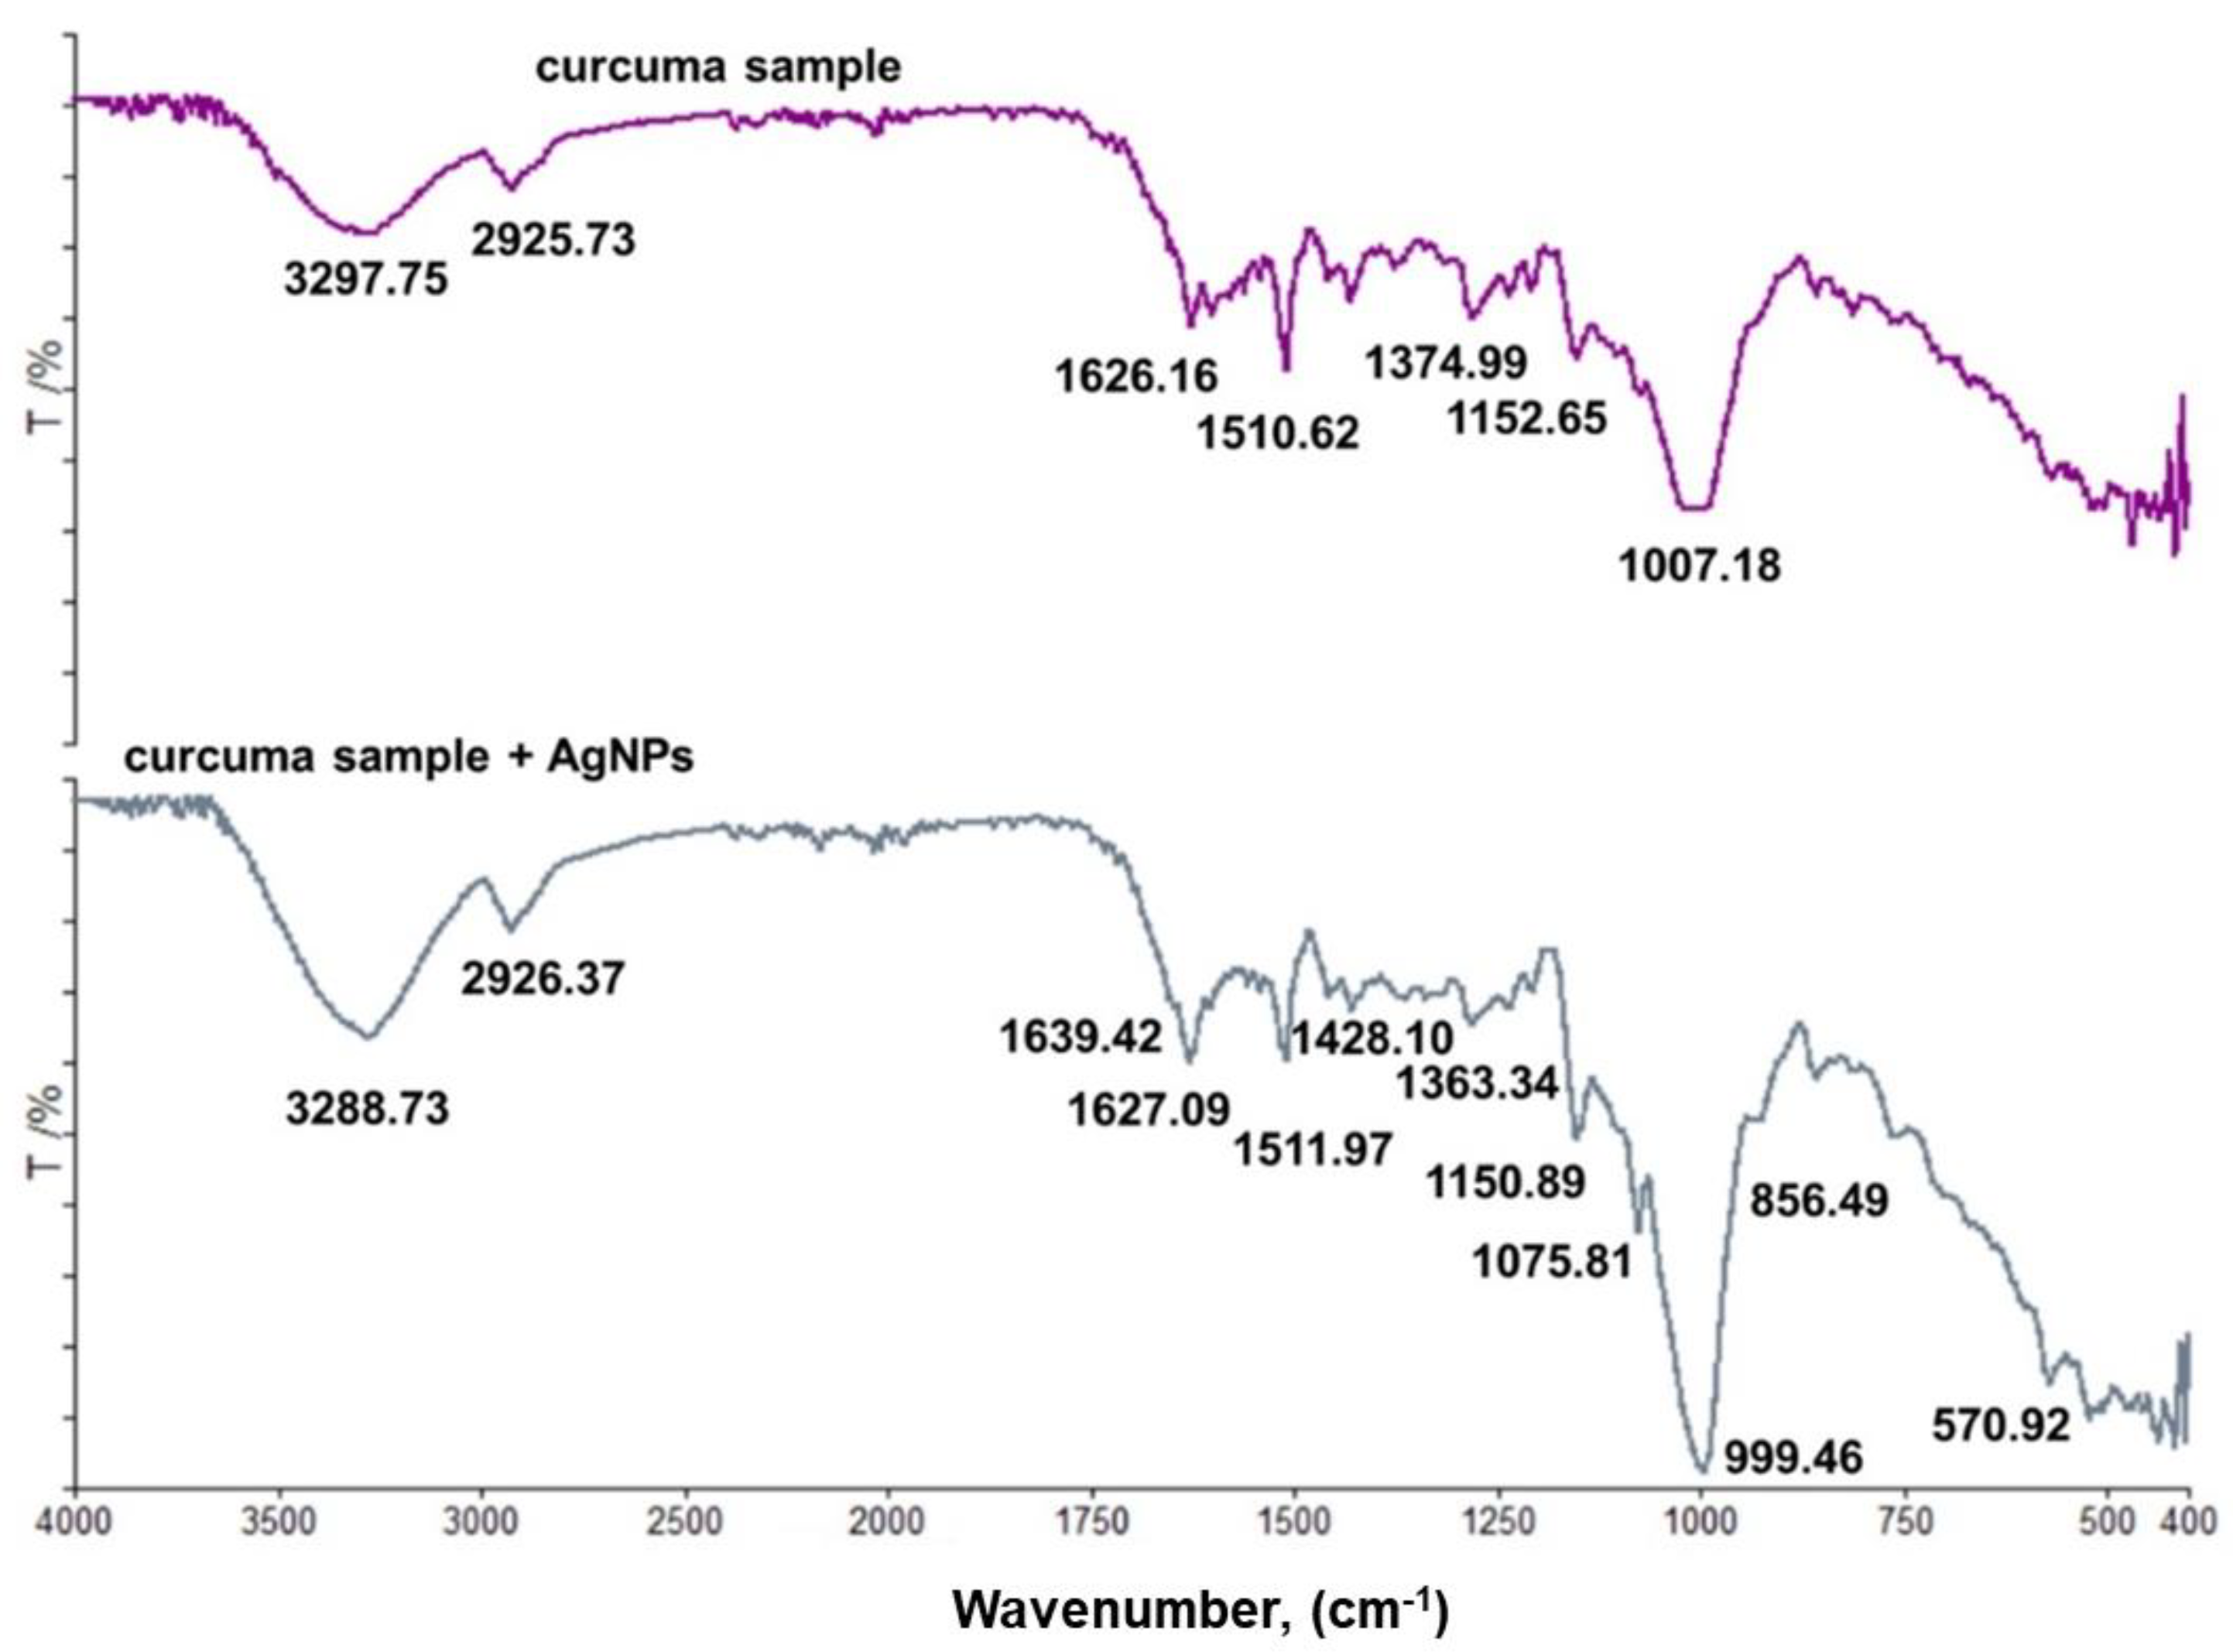
3.4. FT-IR Spectroscopy
3.5. UV-Vis Spectroscopy
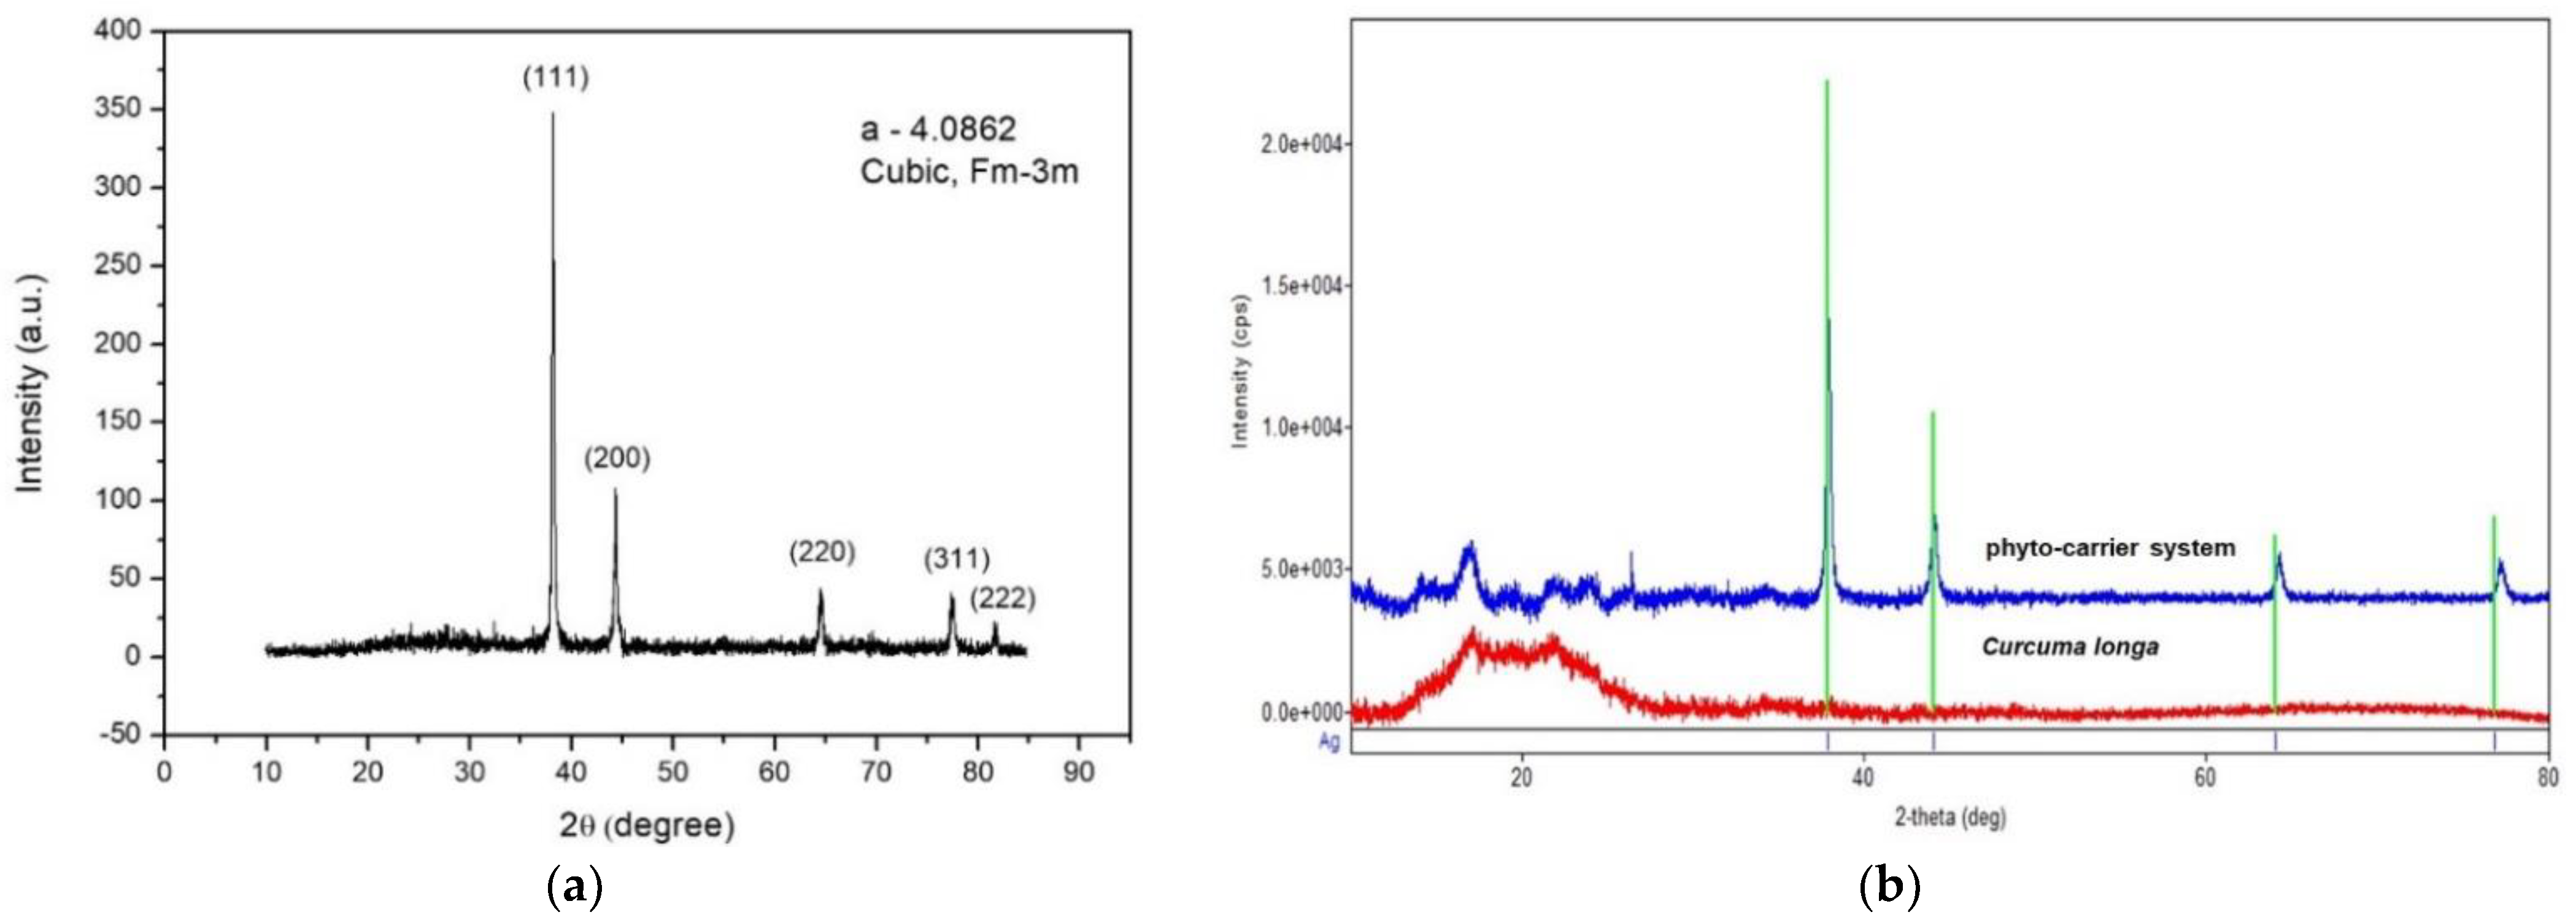
3.6. X-ray Diffraction Spectroscopy
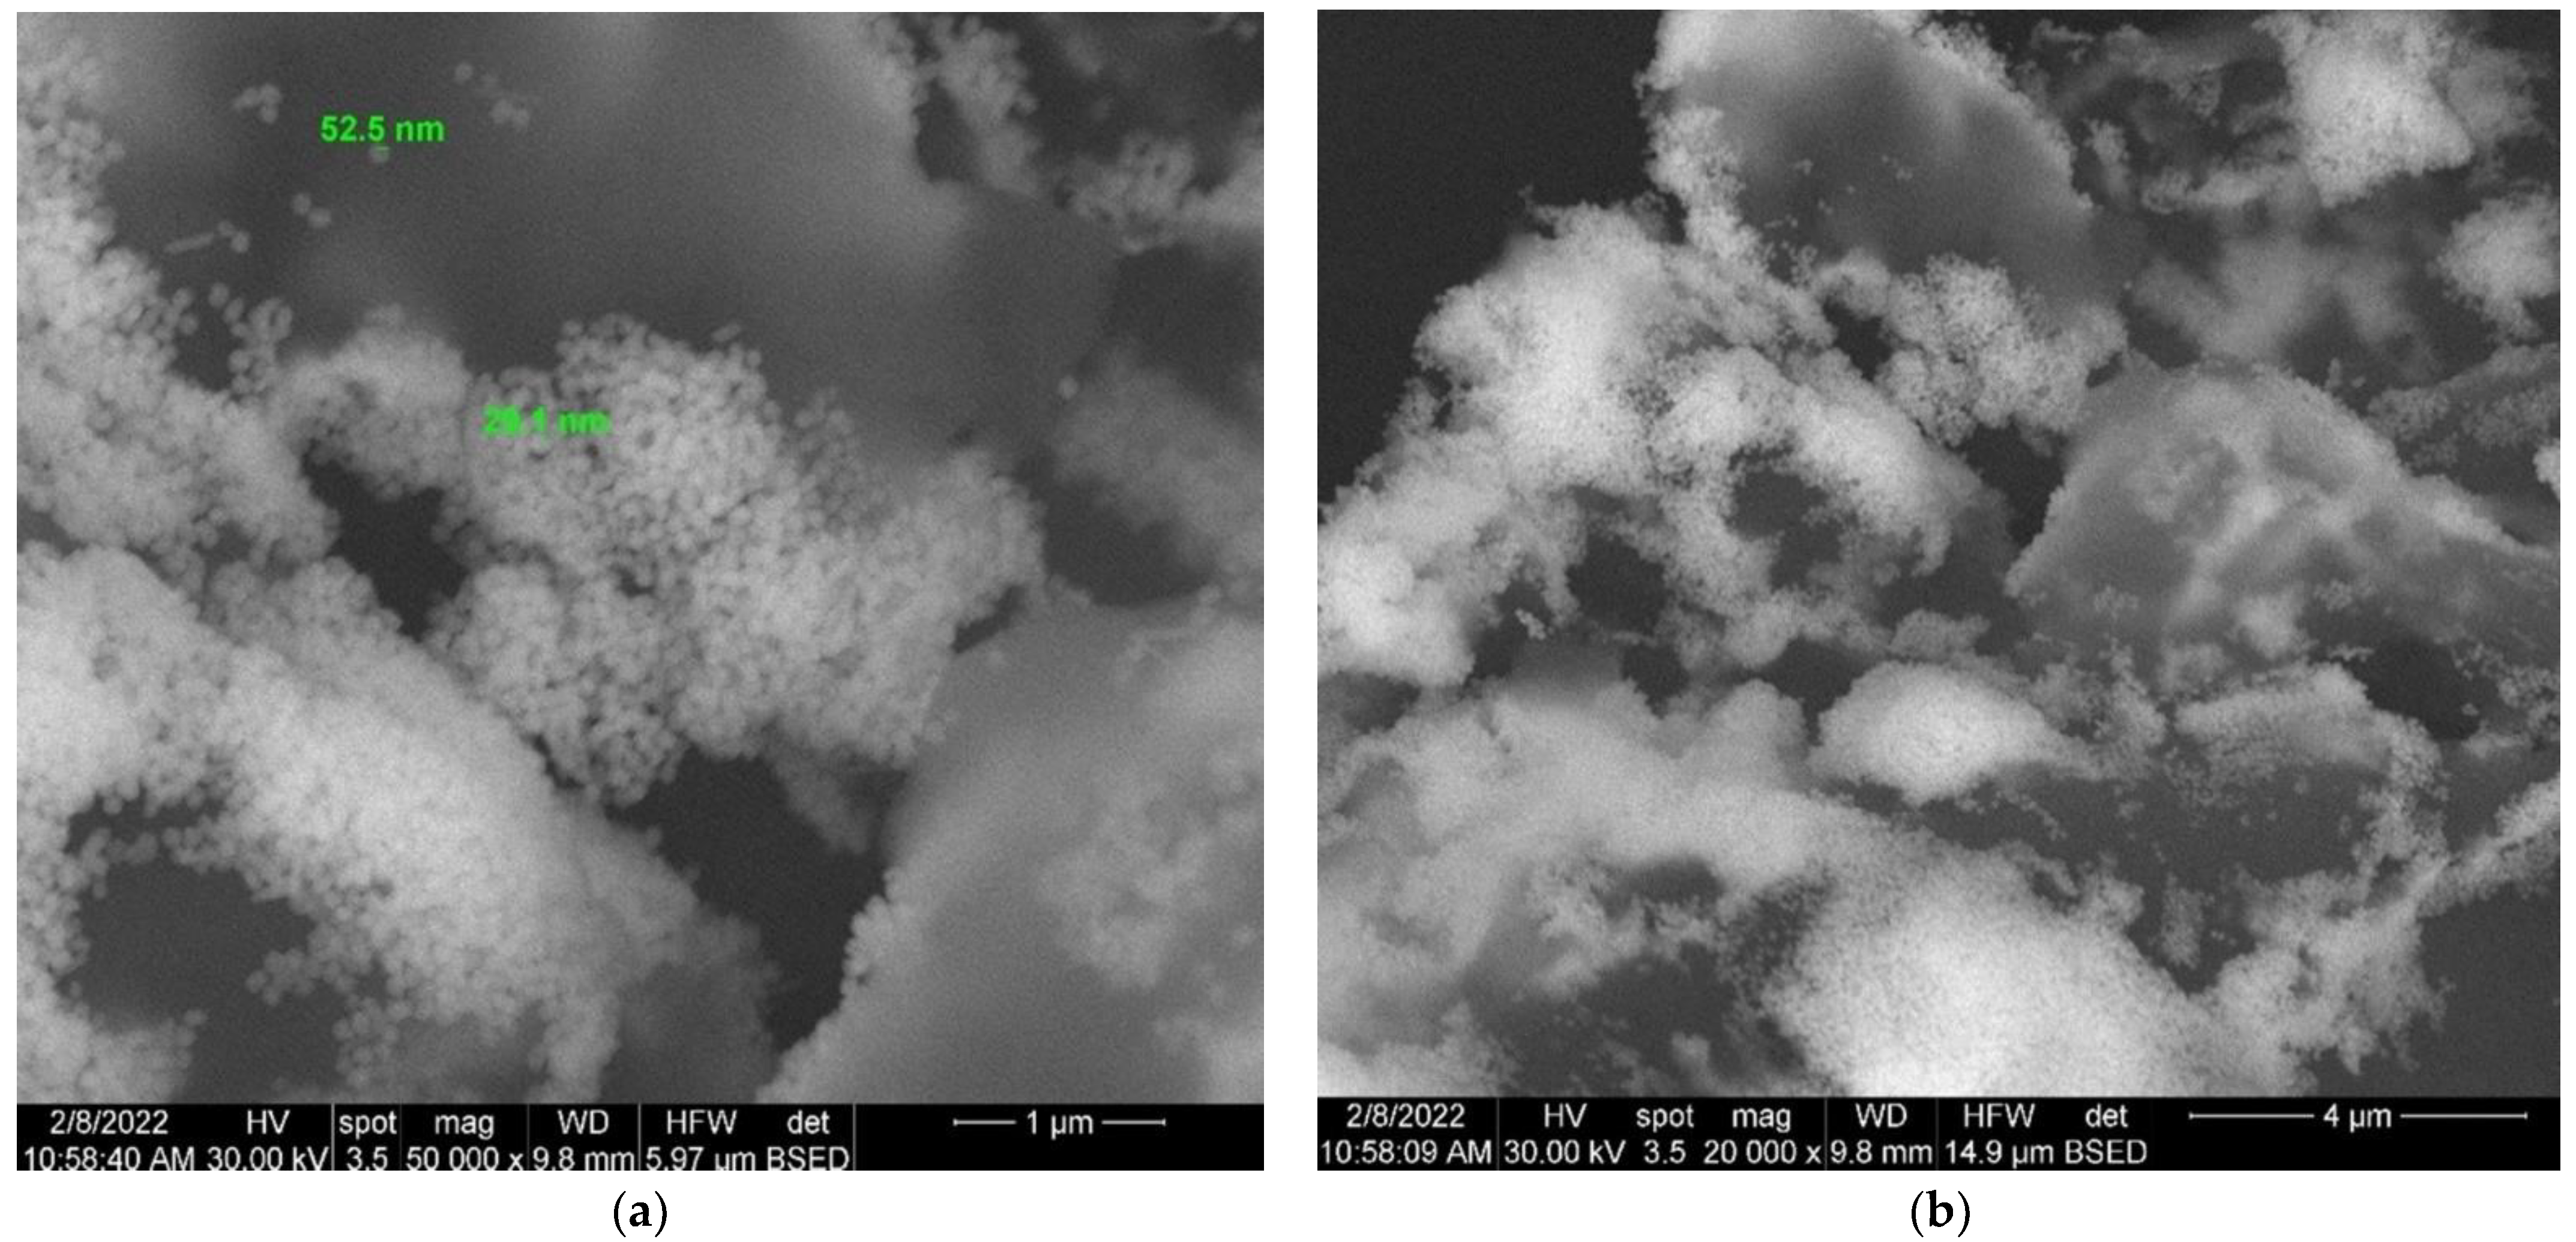
3.7. Scanning Electron Microscopy (SEM)
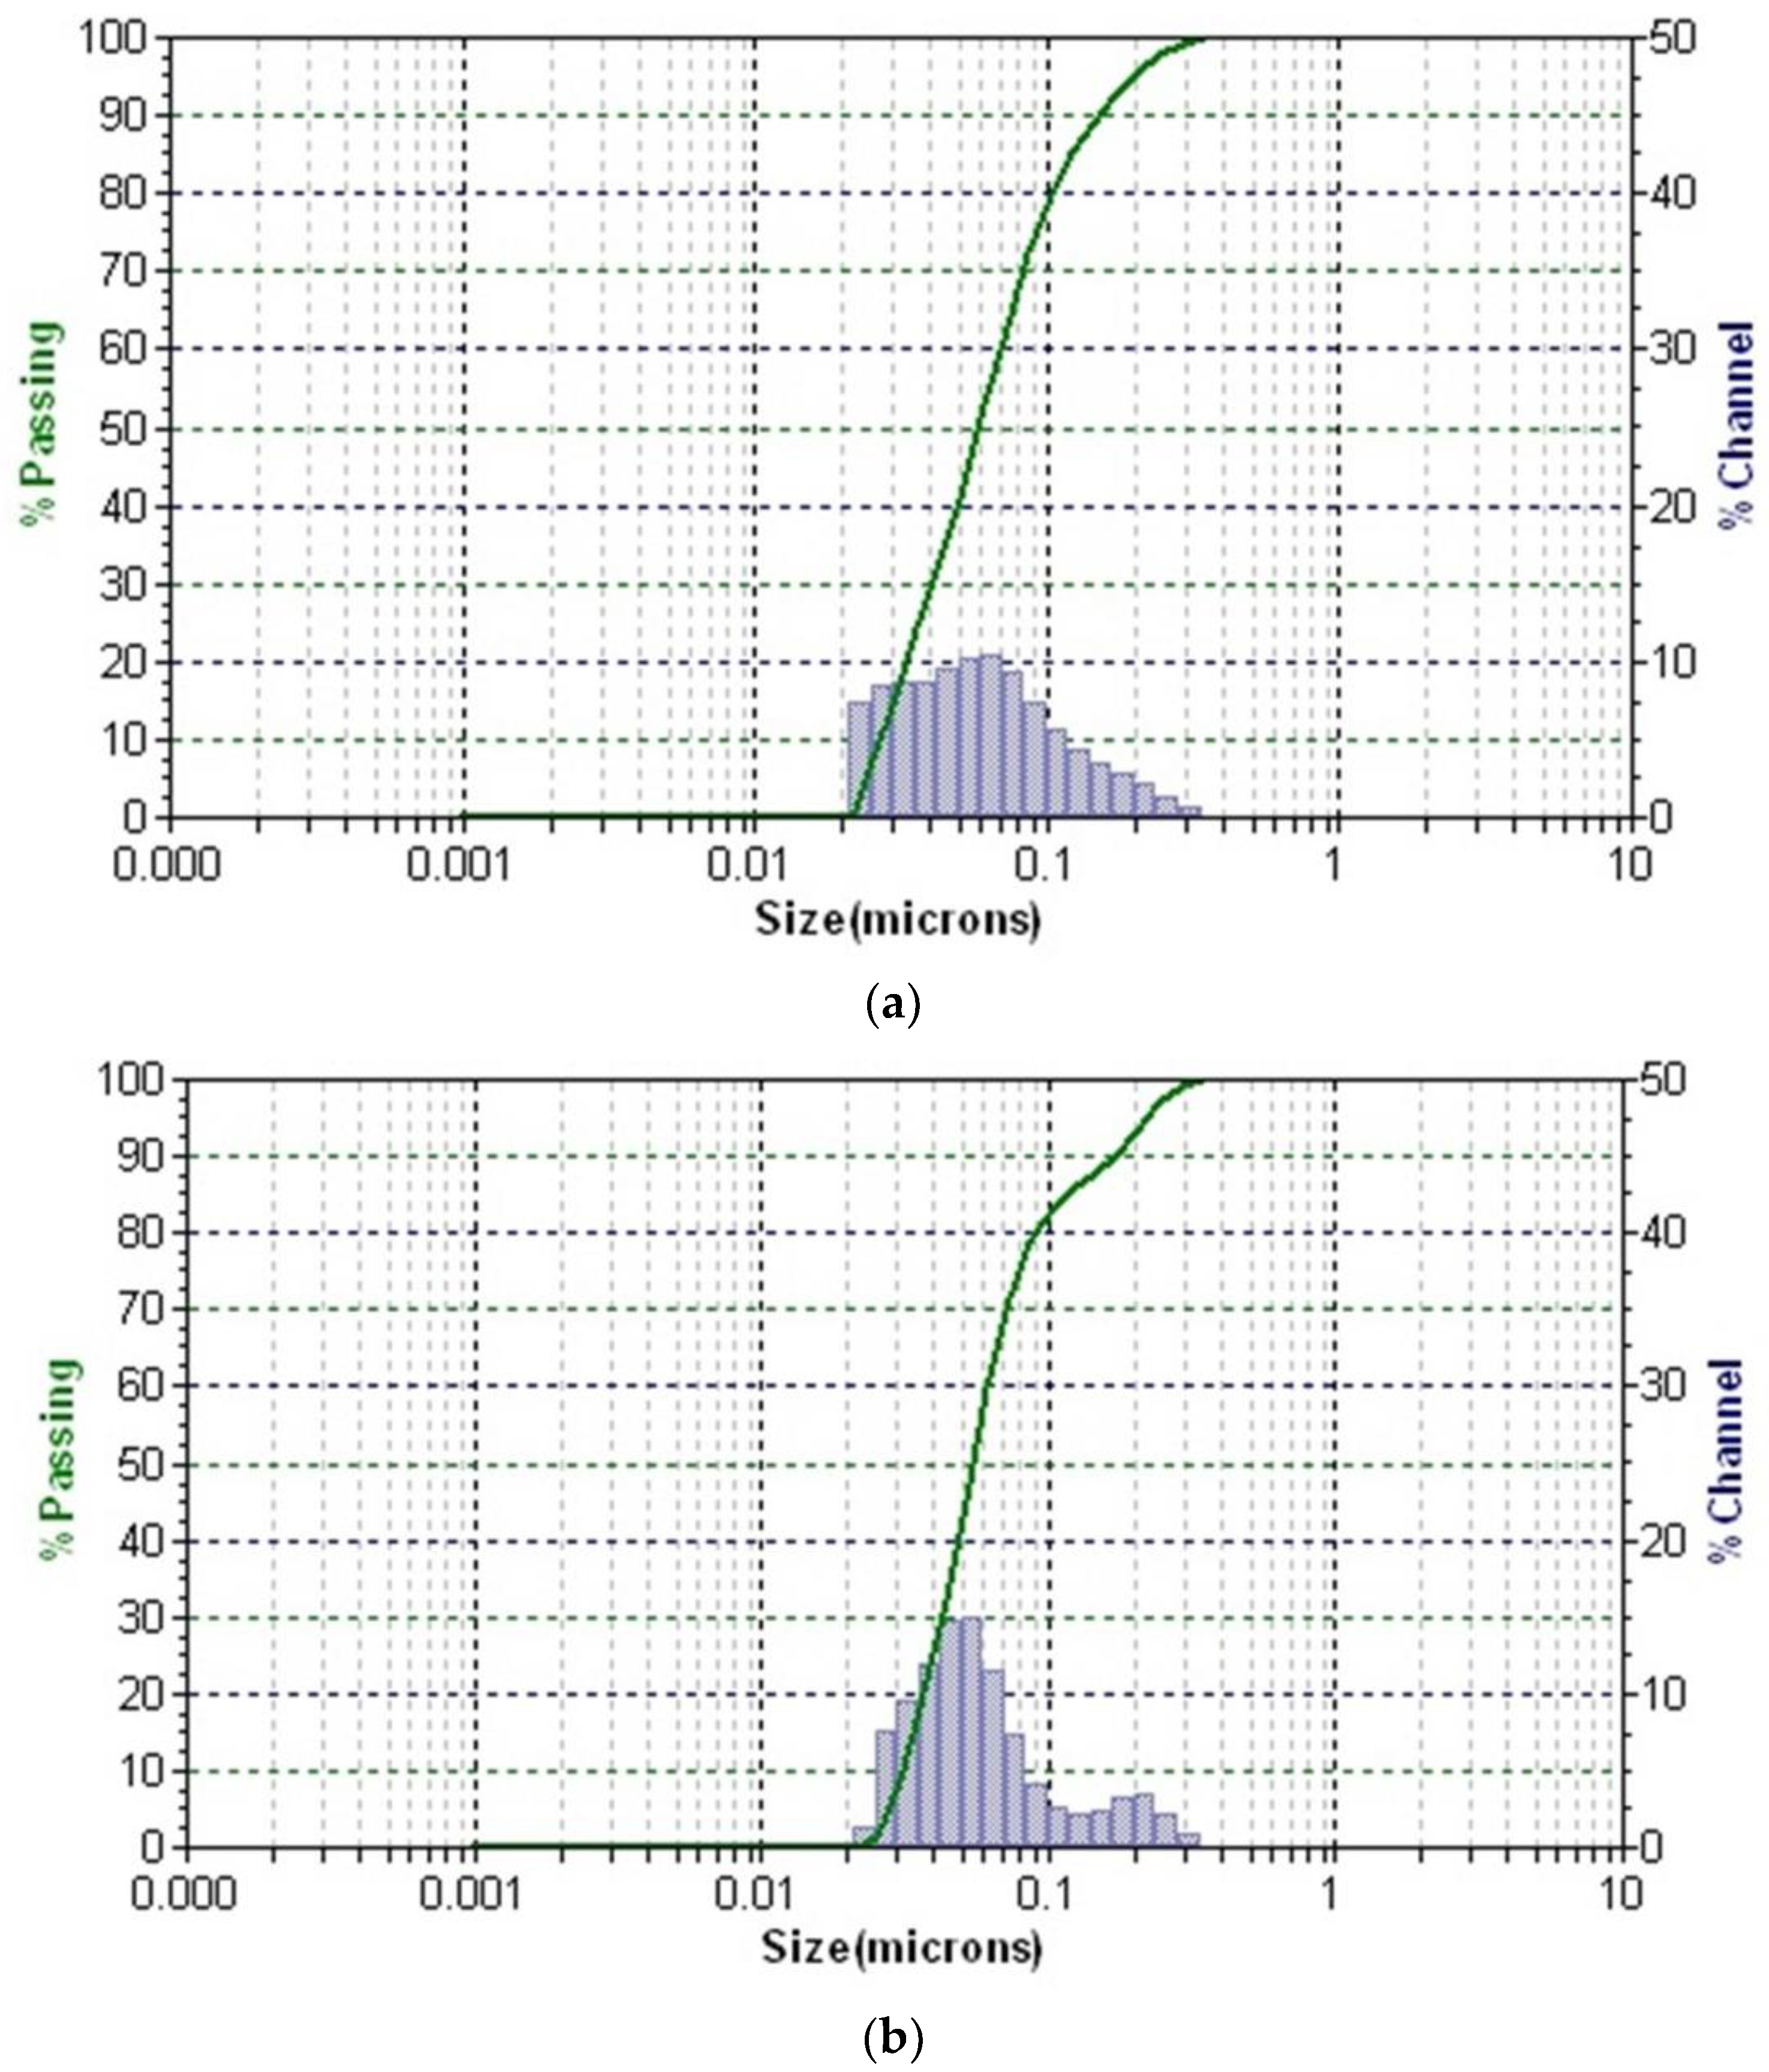
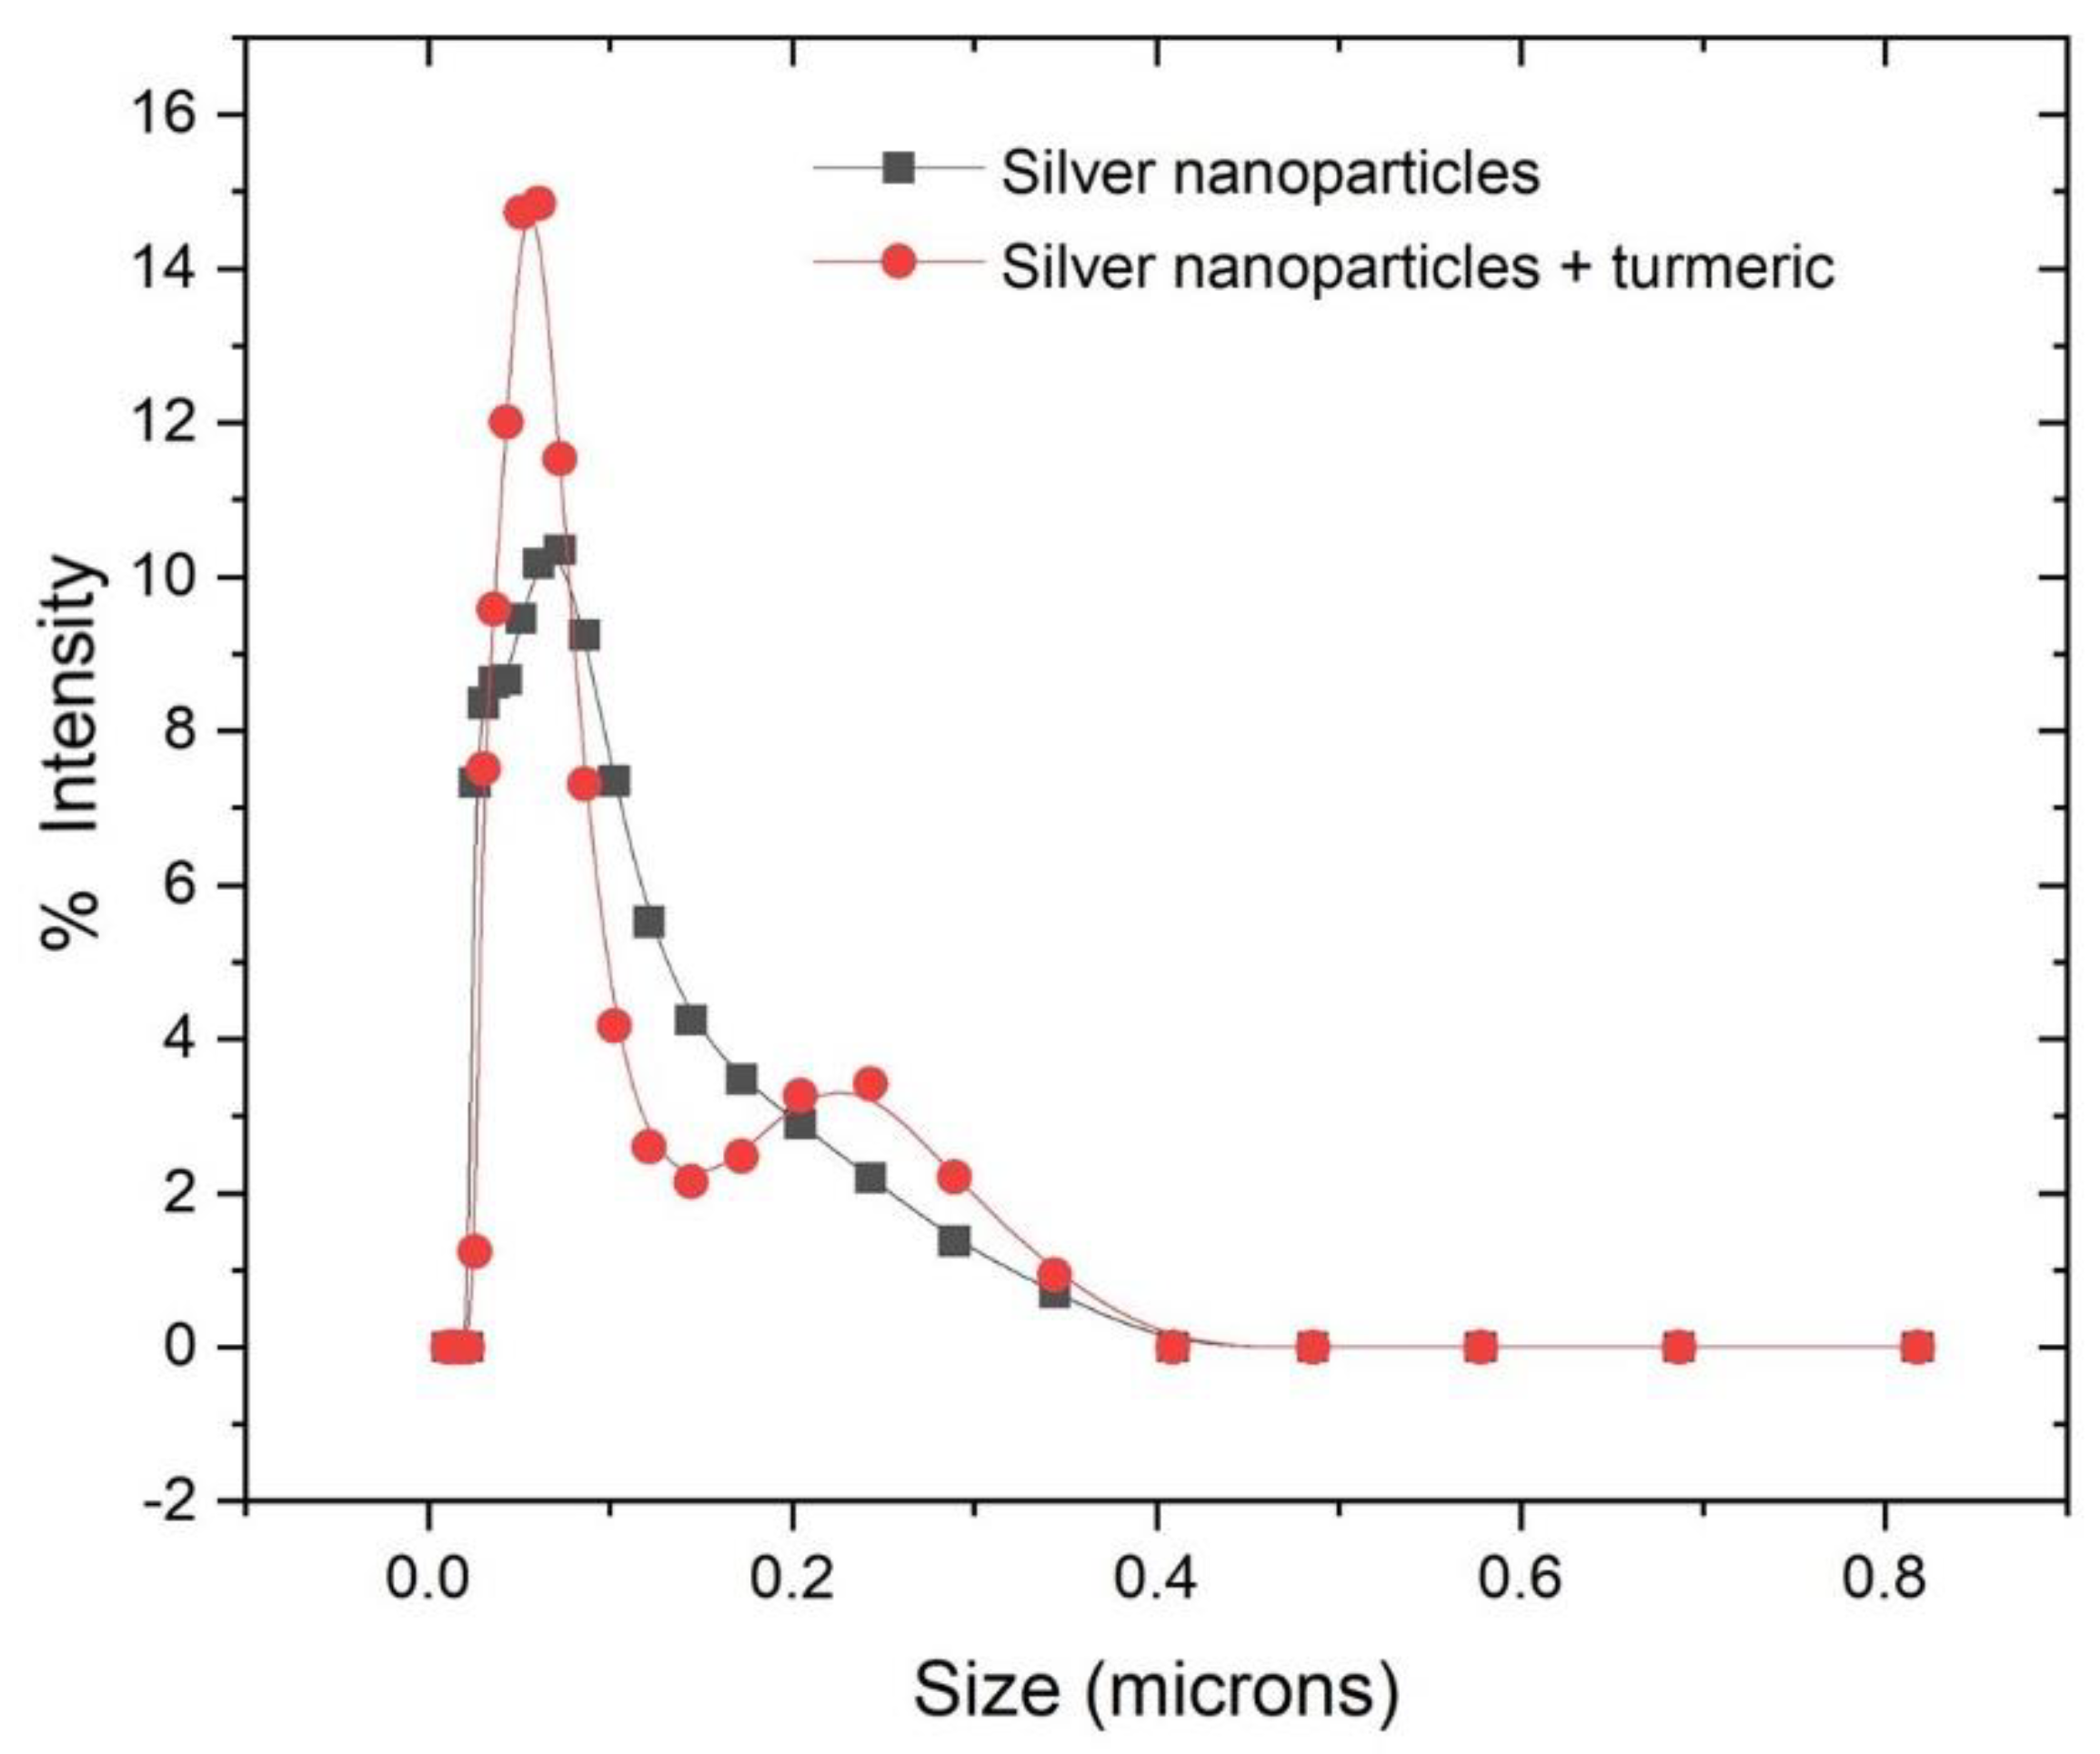
3.8. Dynamic Light Scattering (DLS)
3.9. UHR-TEM
3.10. Zeta Potential
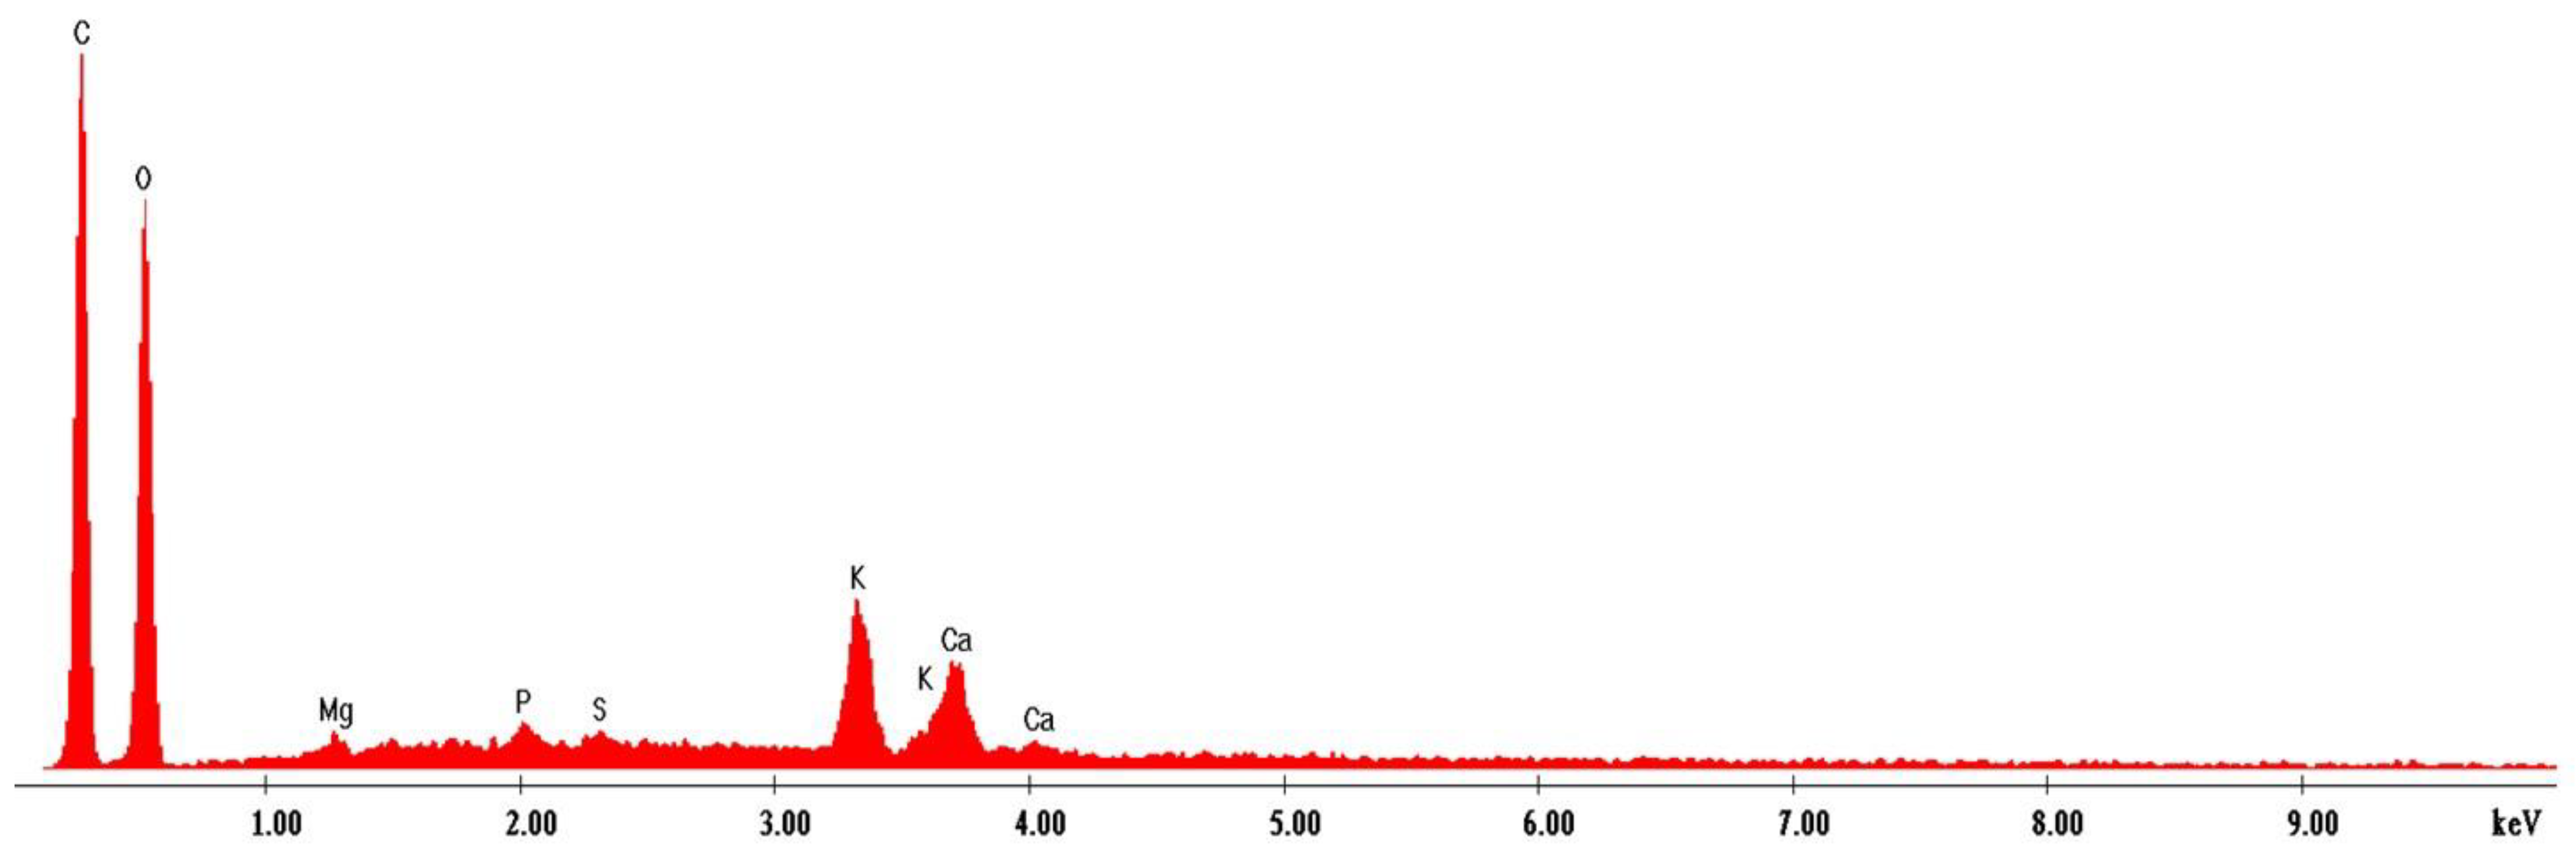
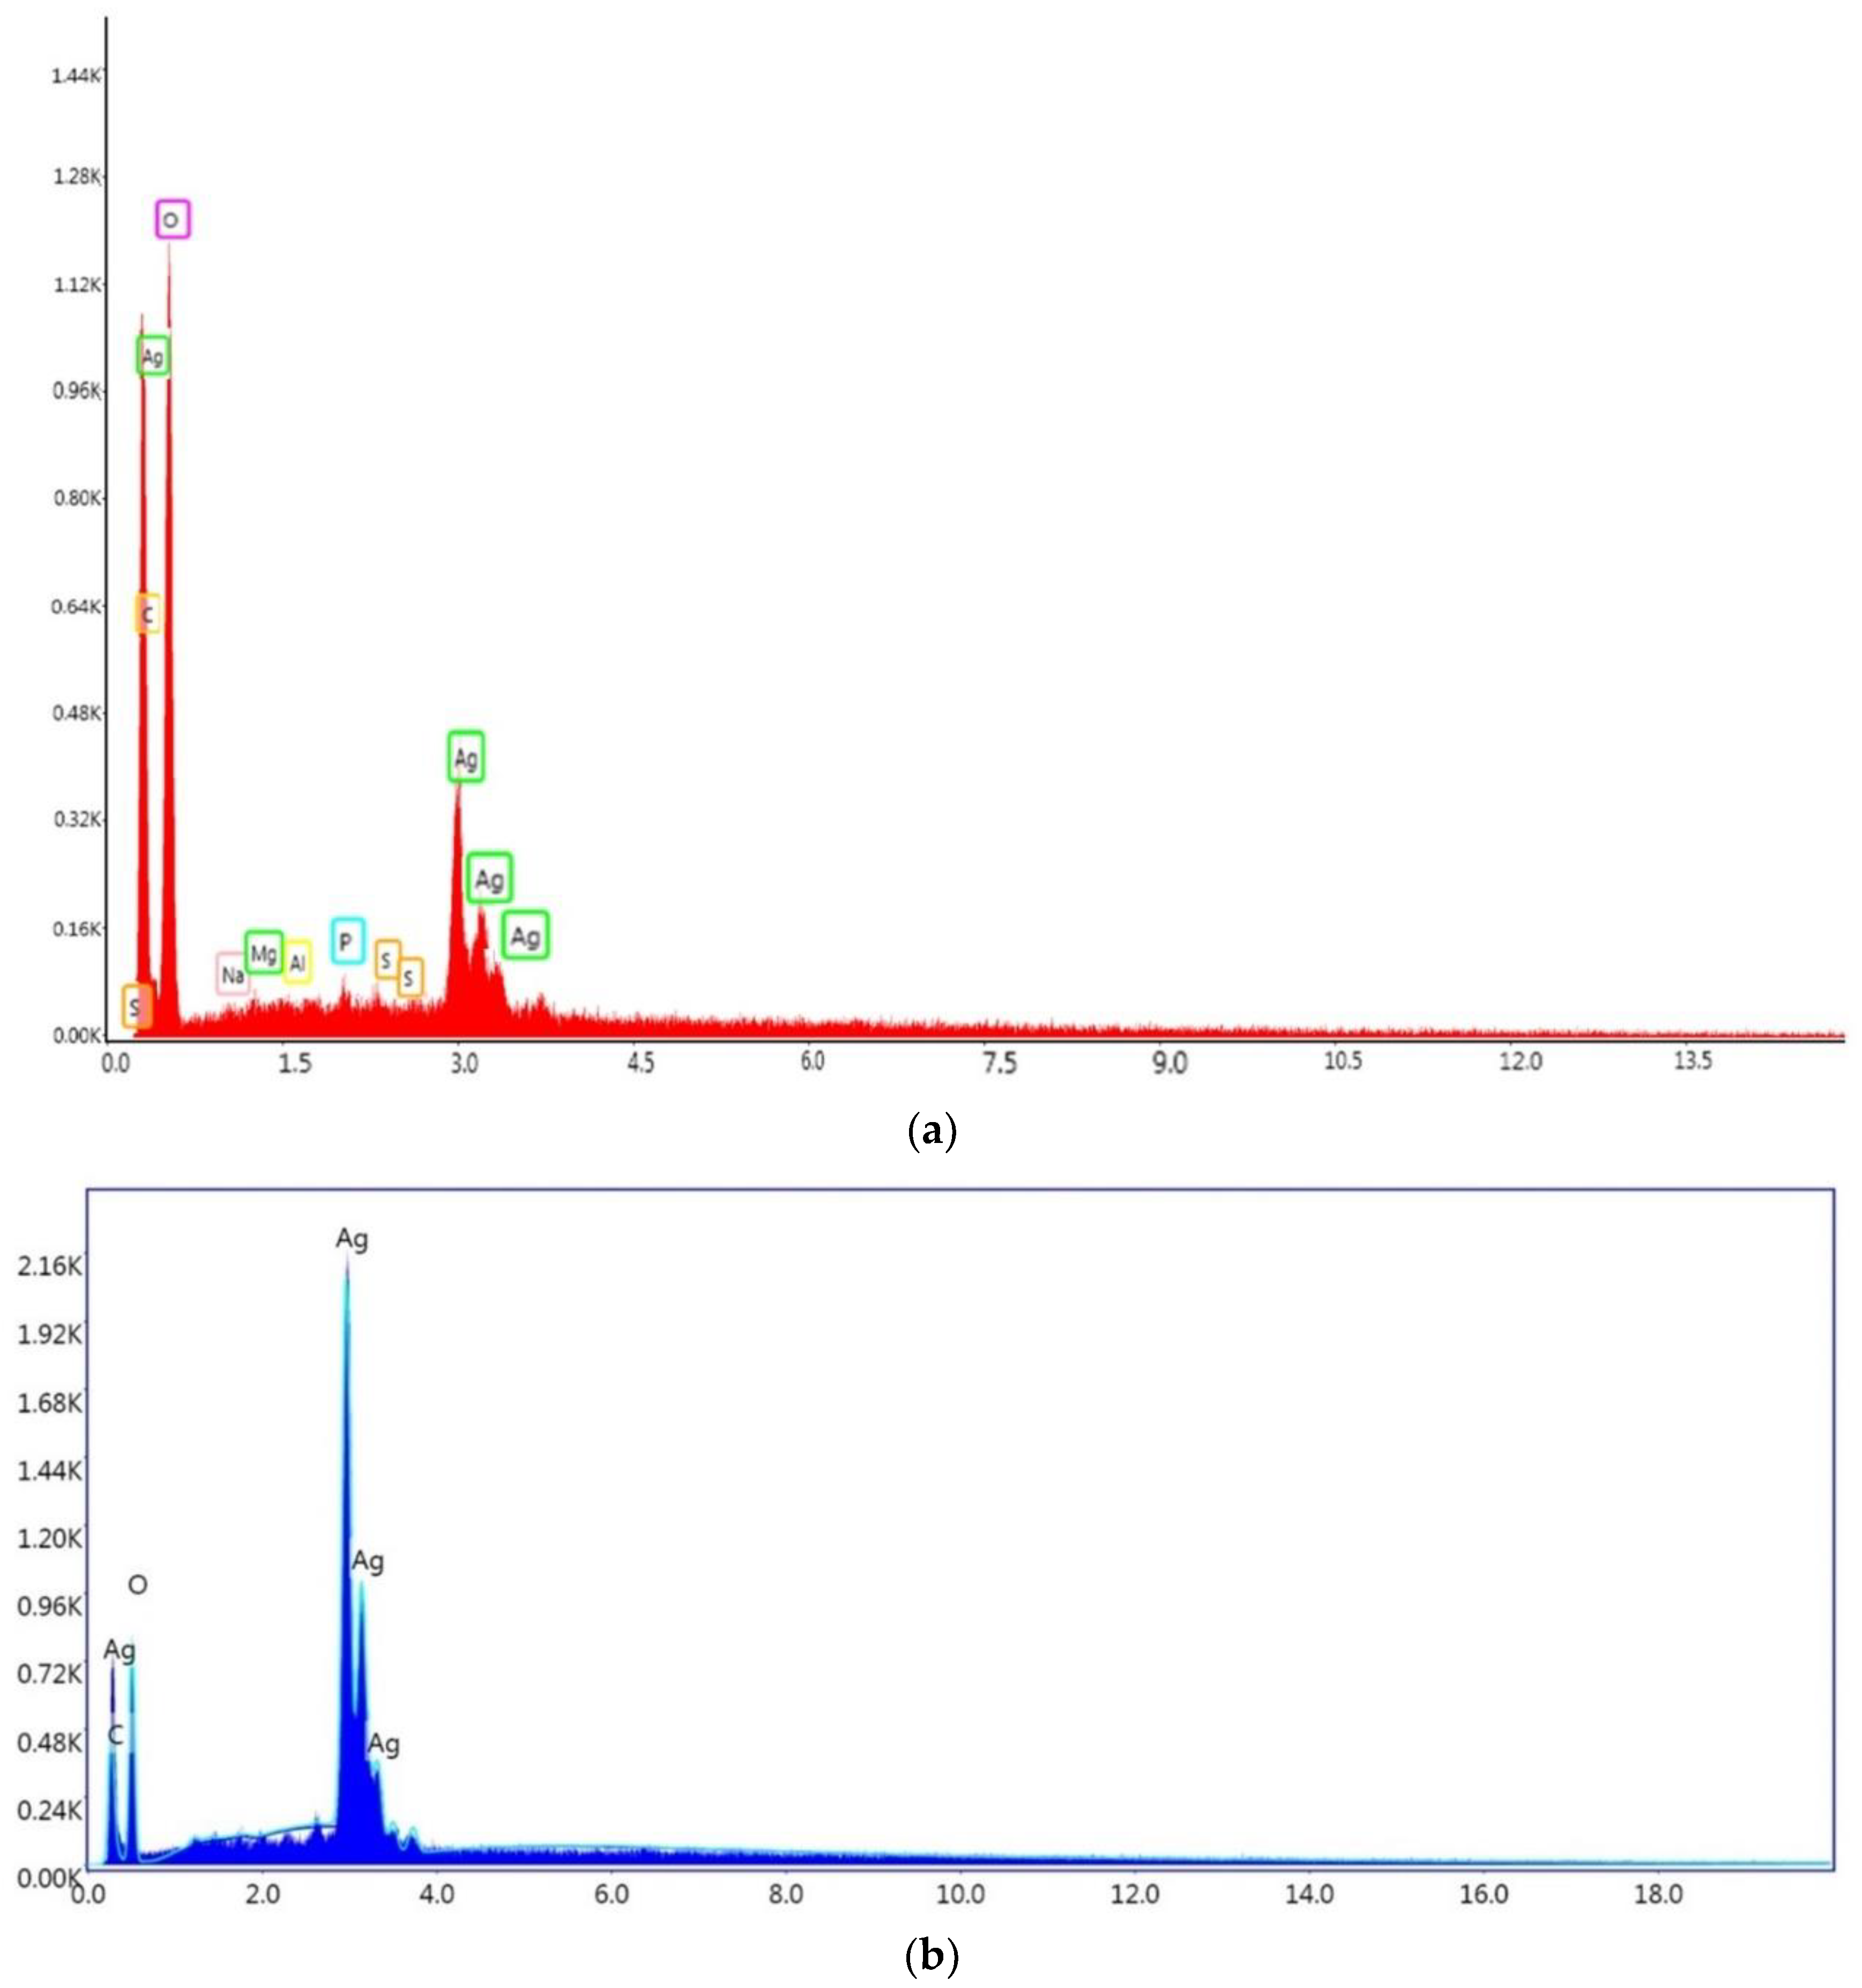
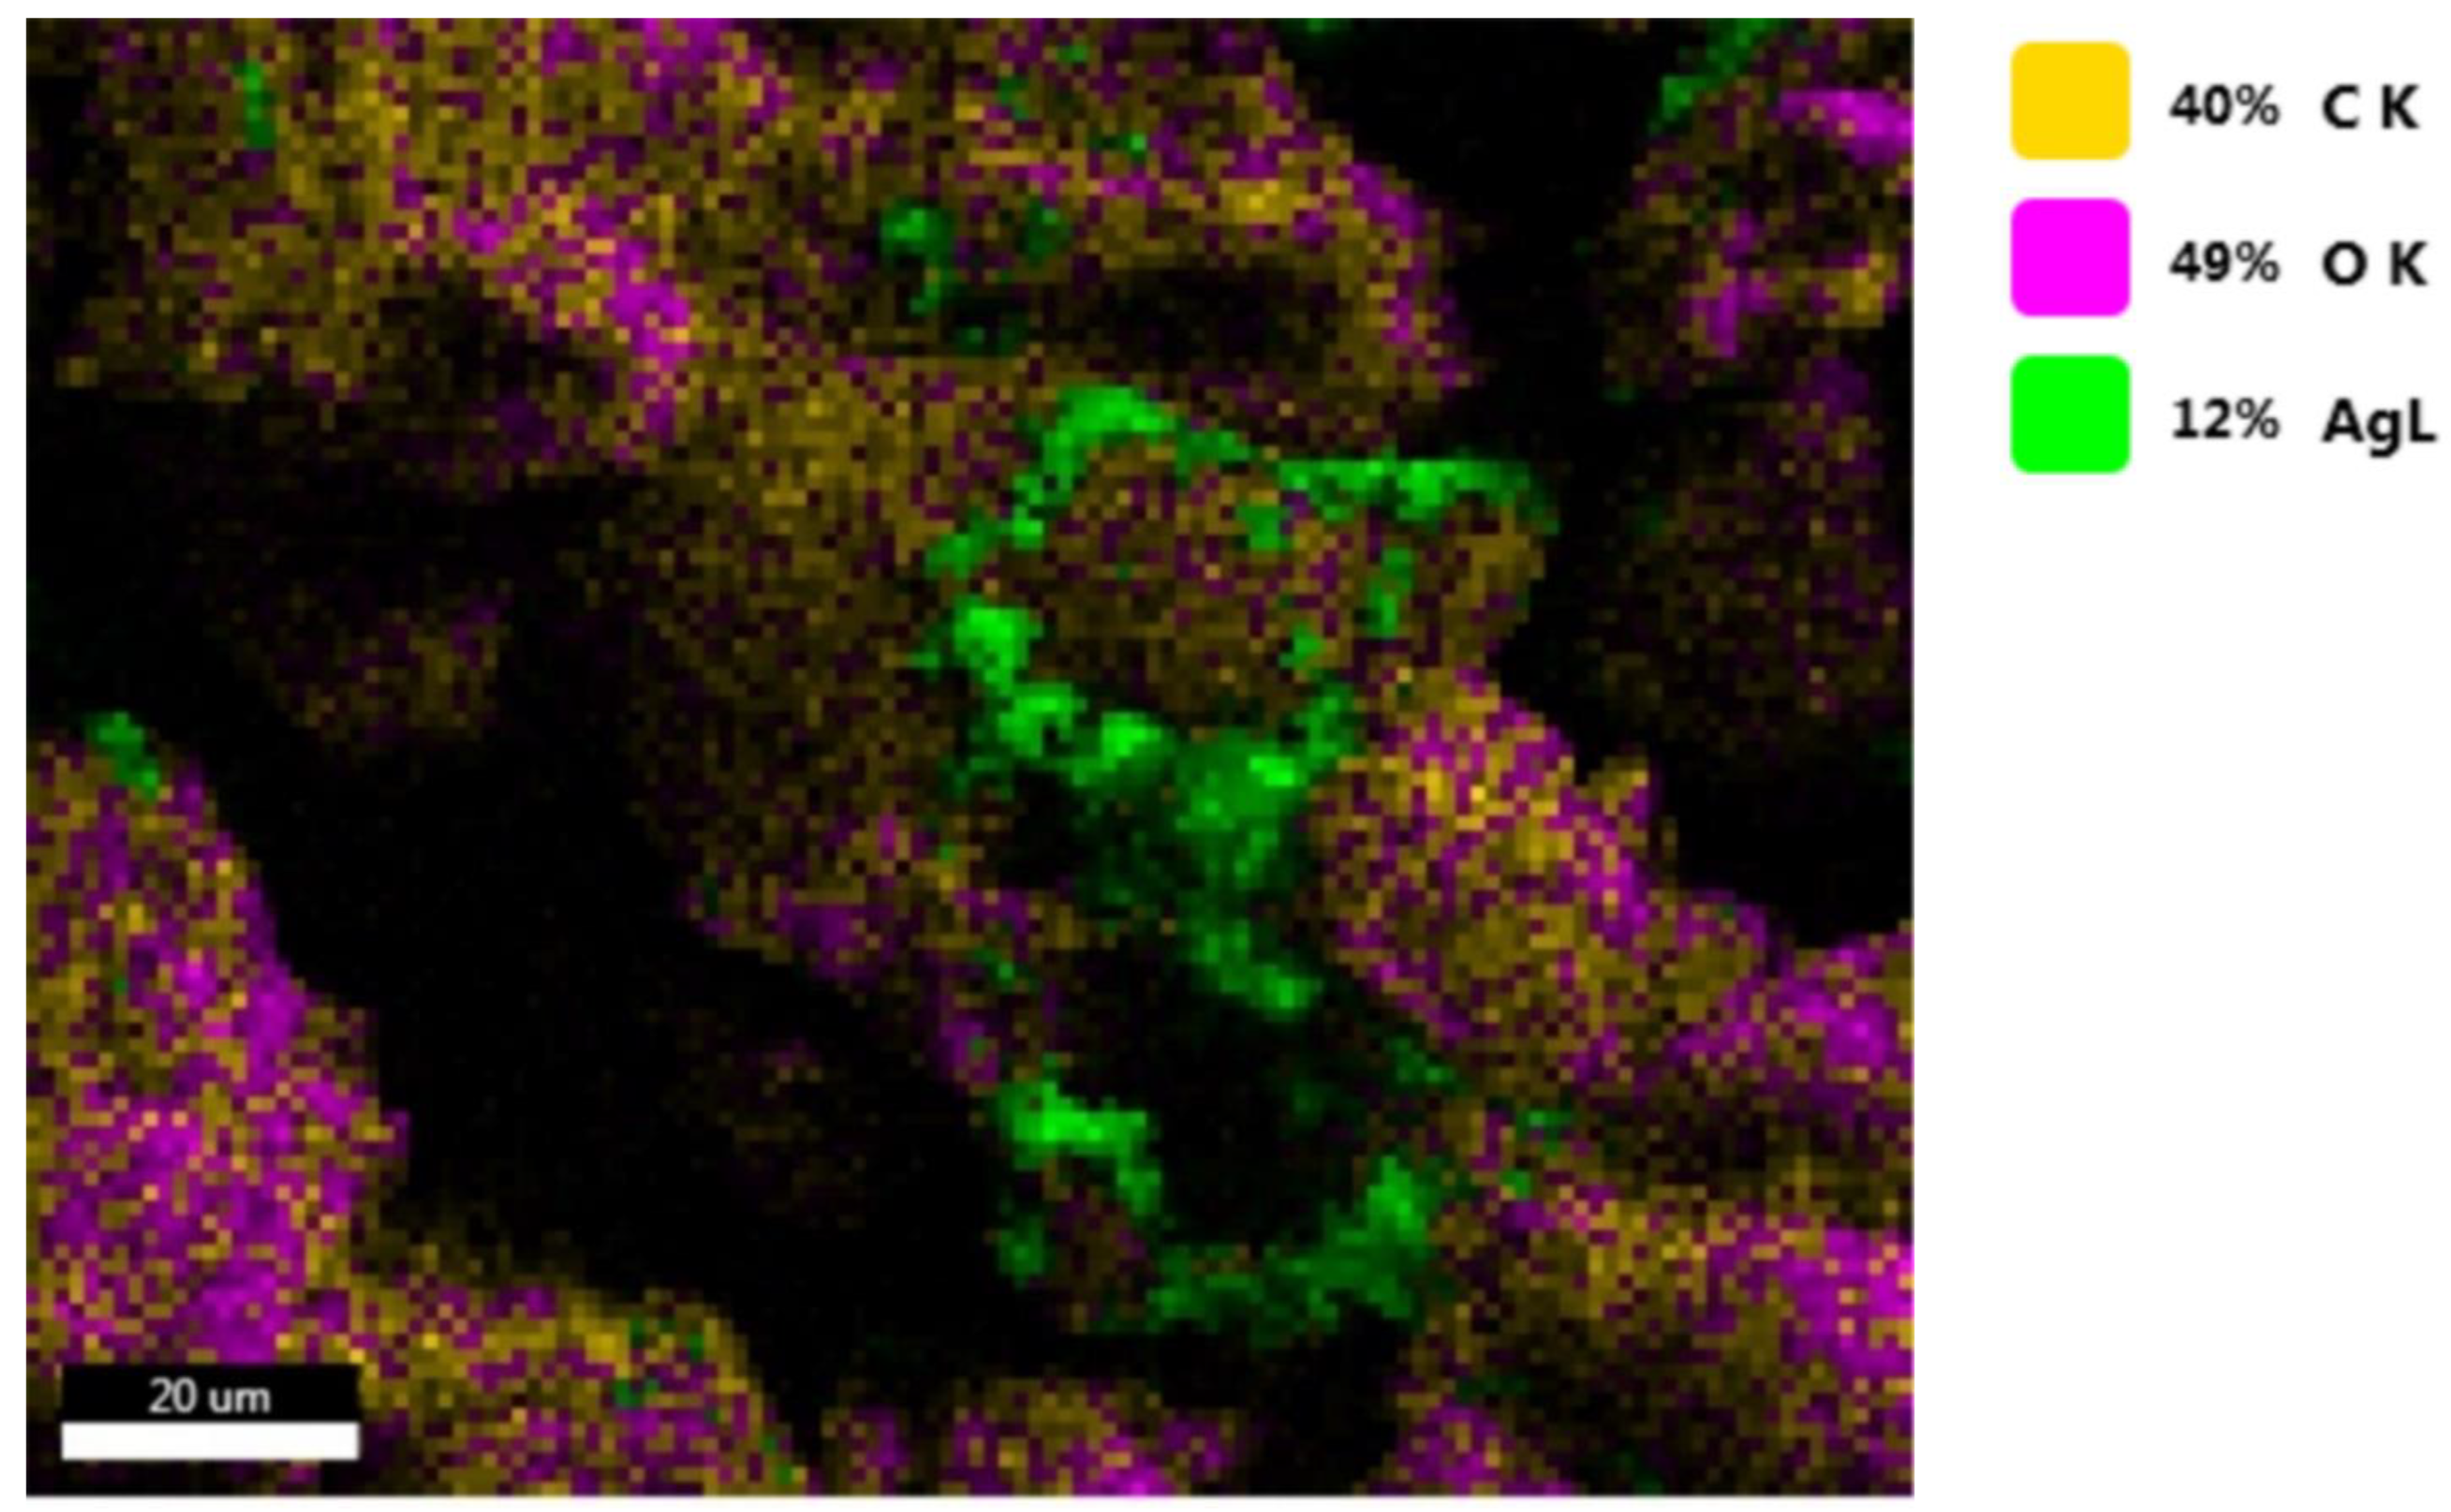
3.11. EDS Spectroscopy
3.12. Screening of Antioxidant Activity
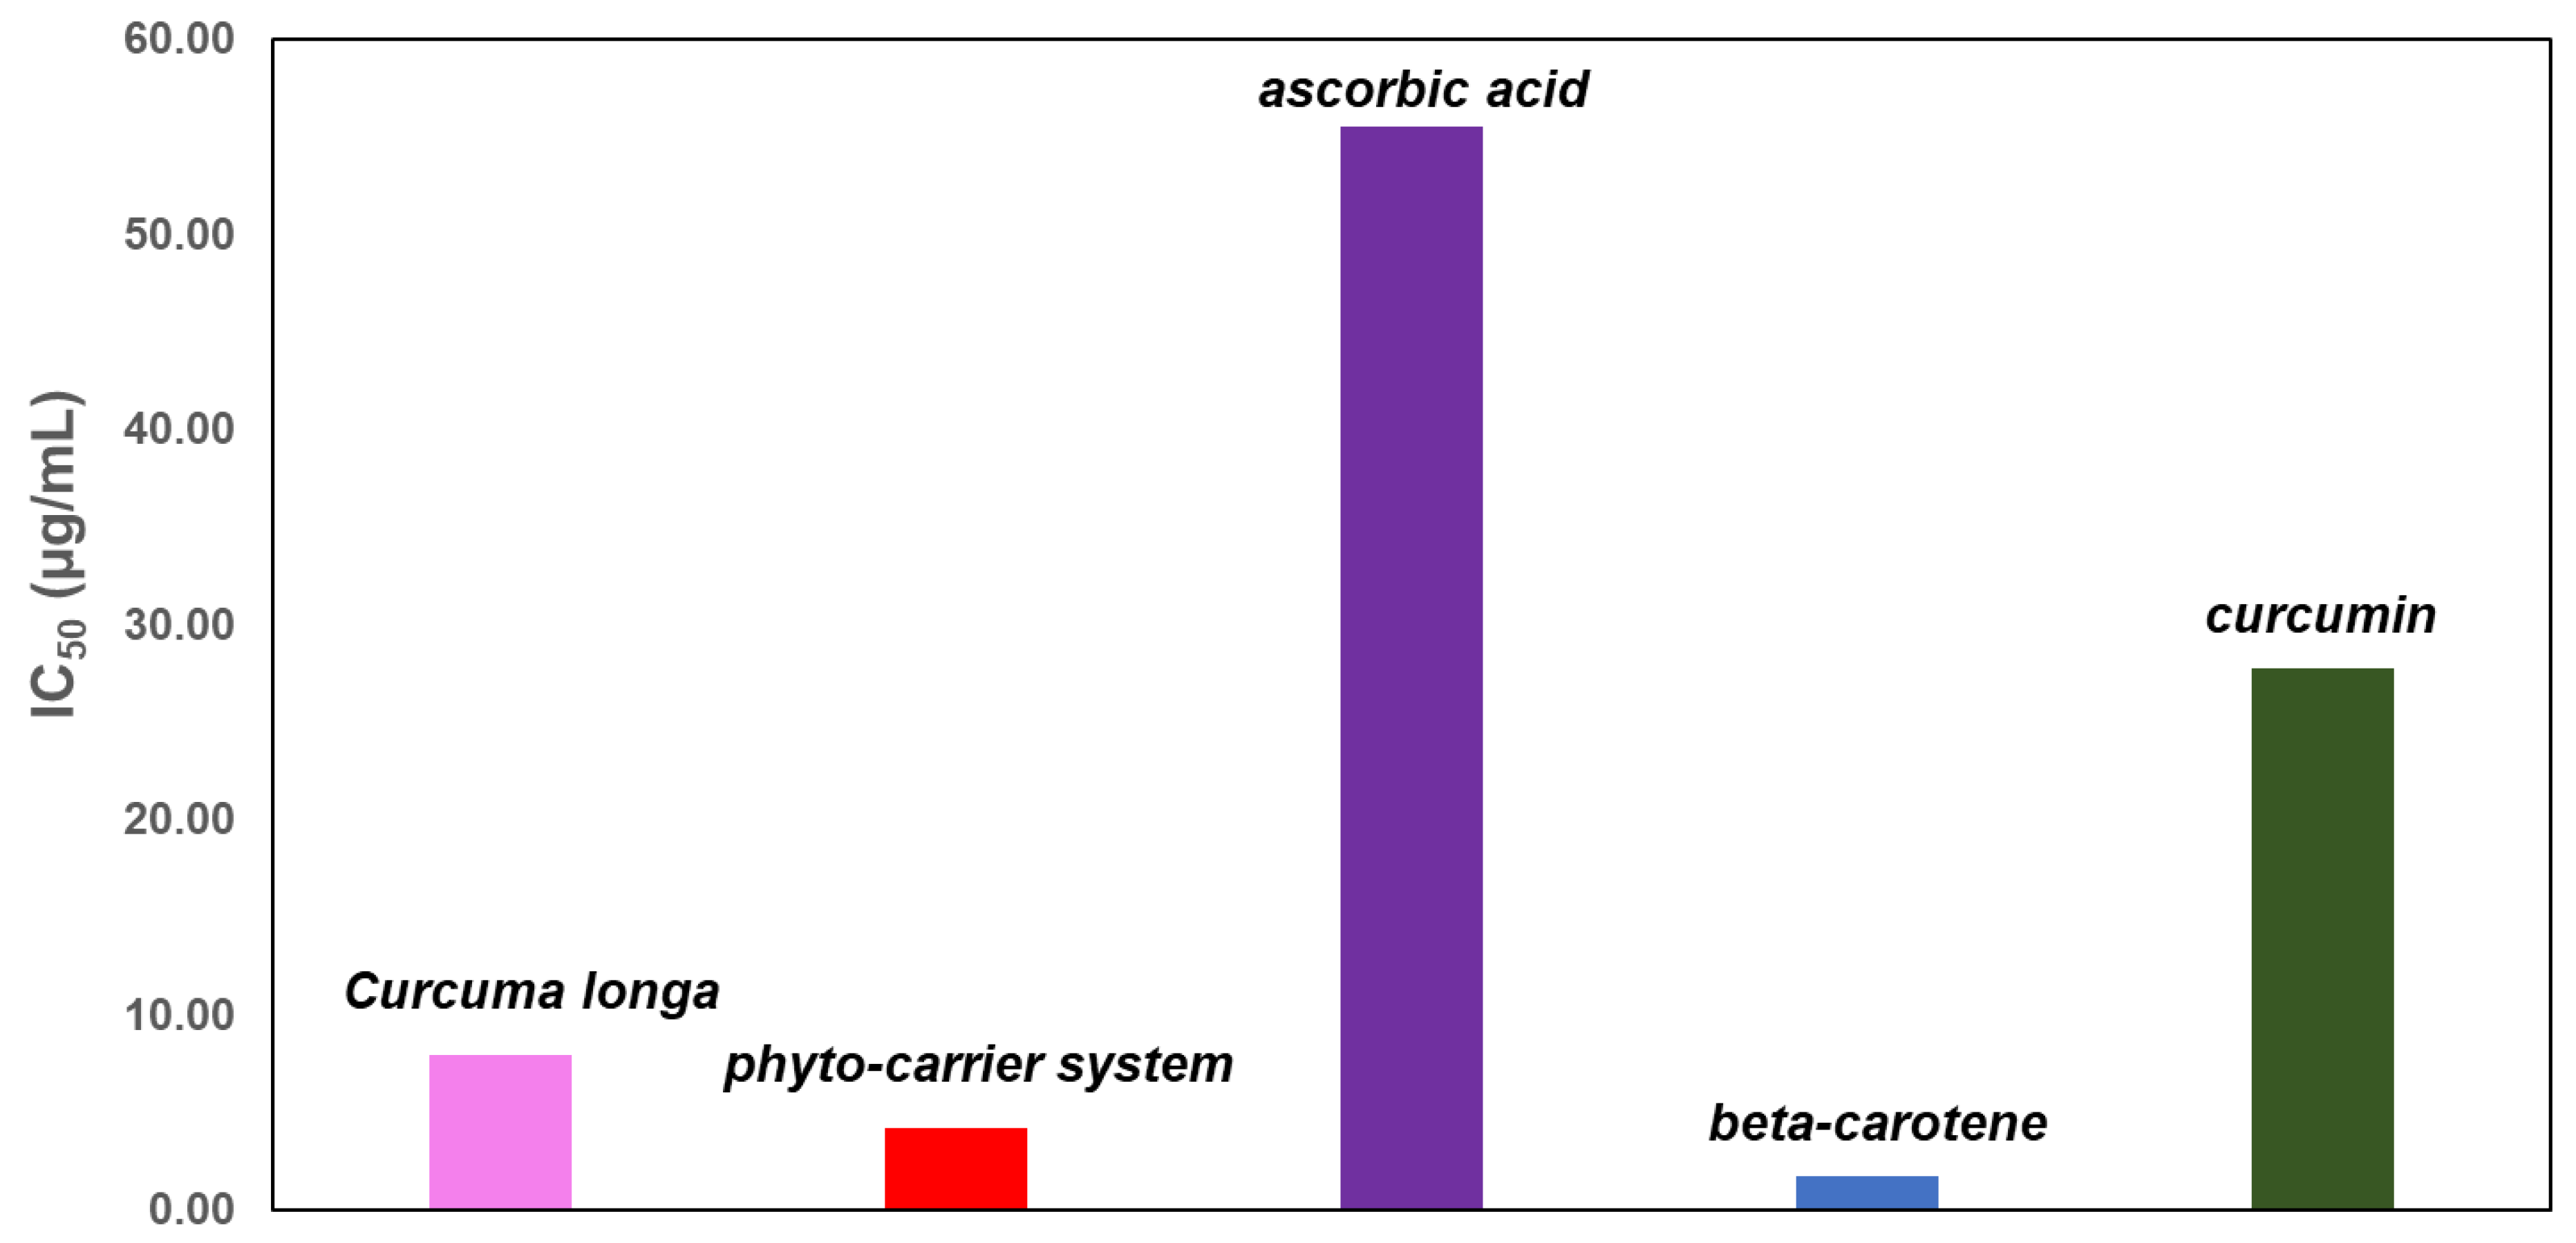
3.13. DPPH (1,1-Diphenyl-2-Picrylhydrazyl) Free Radical Scavenging Assay
| Sample | Curcuma | Phytocarrier System | β-Carotene | Curcumin | Ascorbic Acid |
|---|---|---|---|---|---|
| IC50 (µg/mL) | 7.98 ± 0.12 | 4.19 ± 0.06 | 2.16 ± 0.13 | 45.46 ± 0.11 | 55.57 ± 0.18 |
3.14. Folin–Ciocalteu Assay
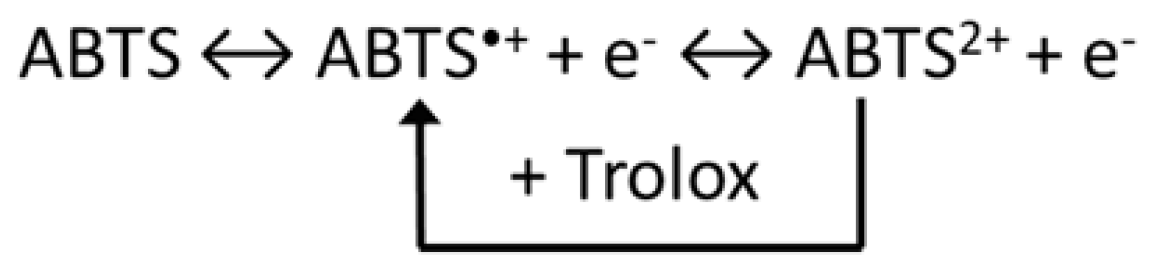
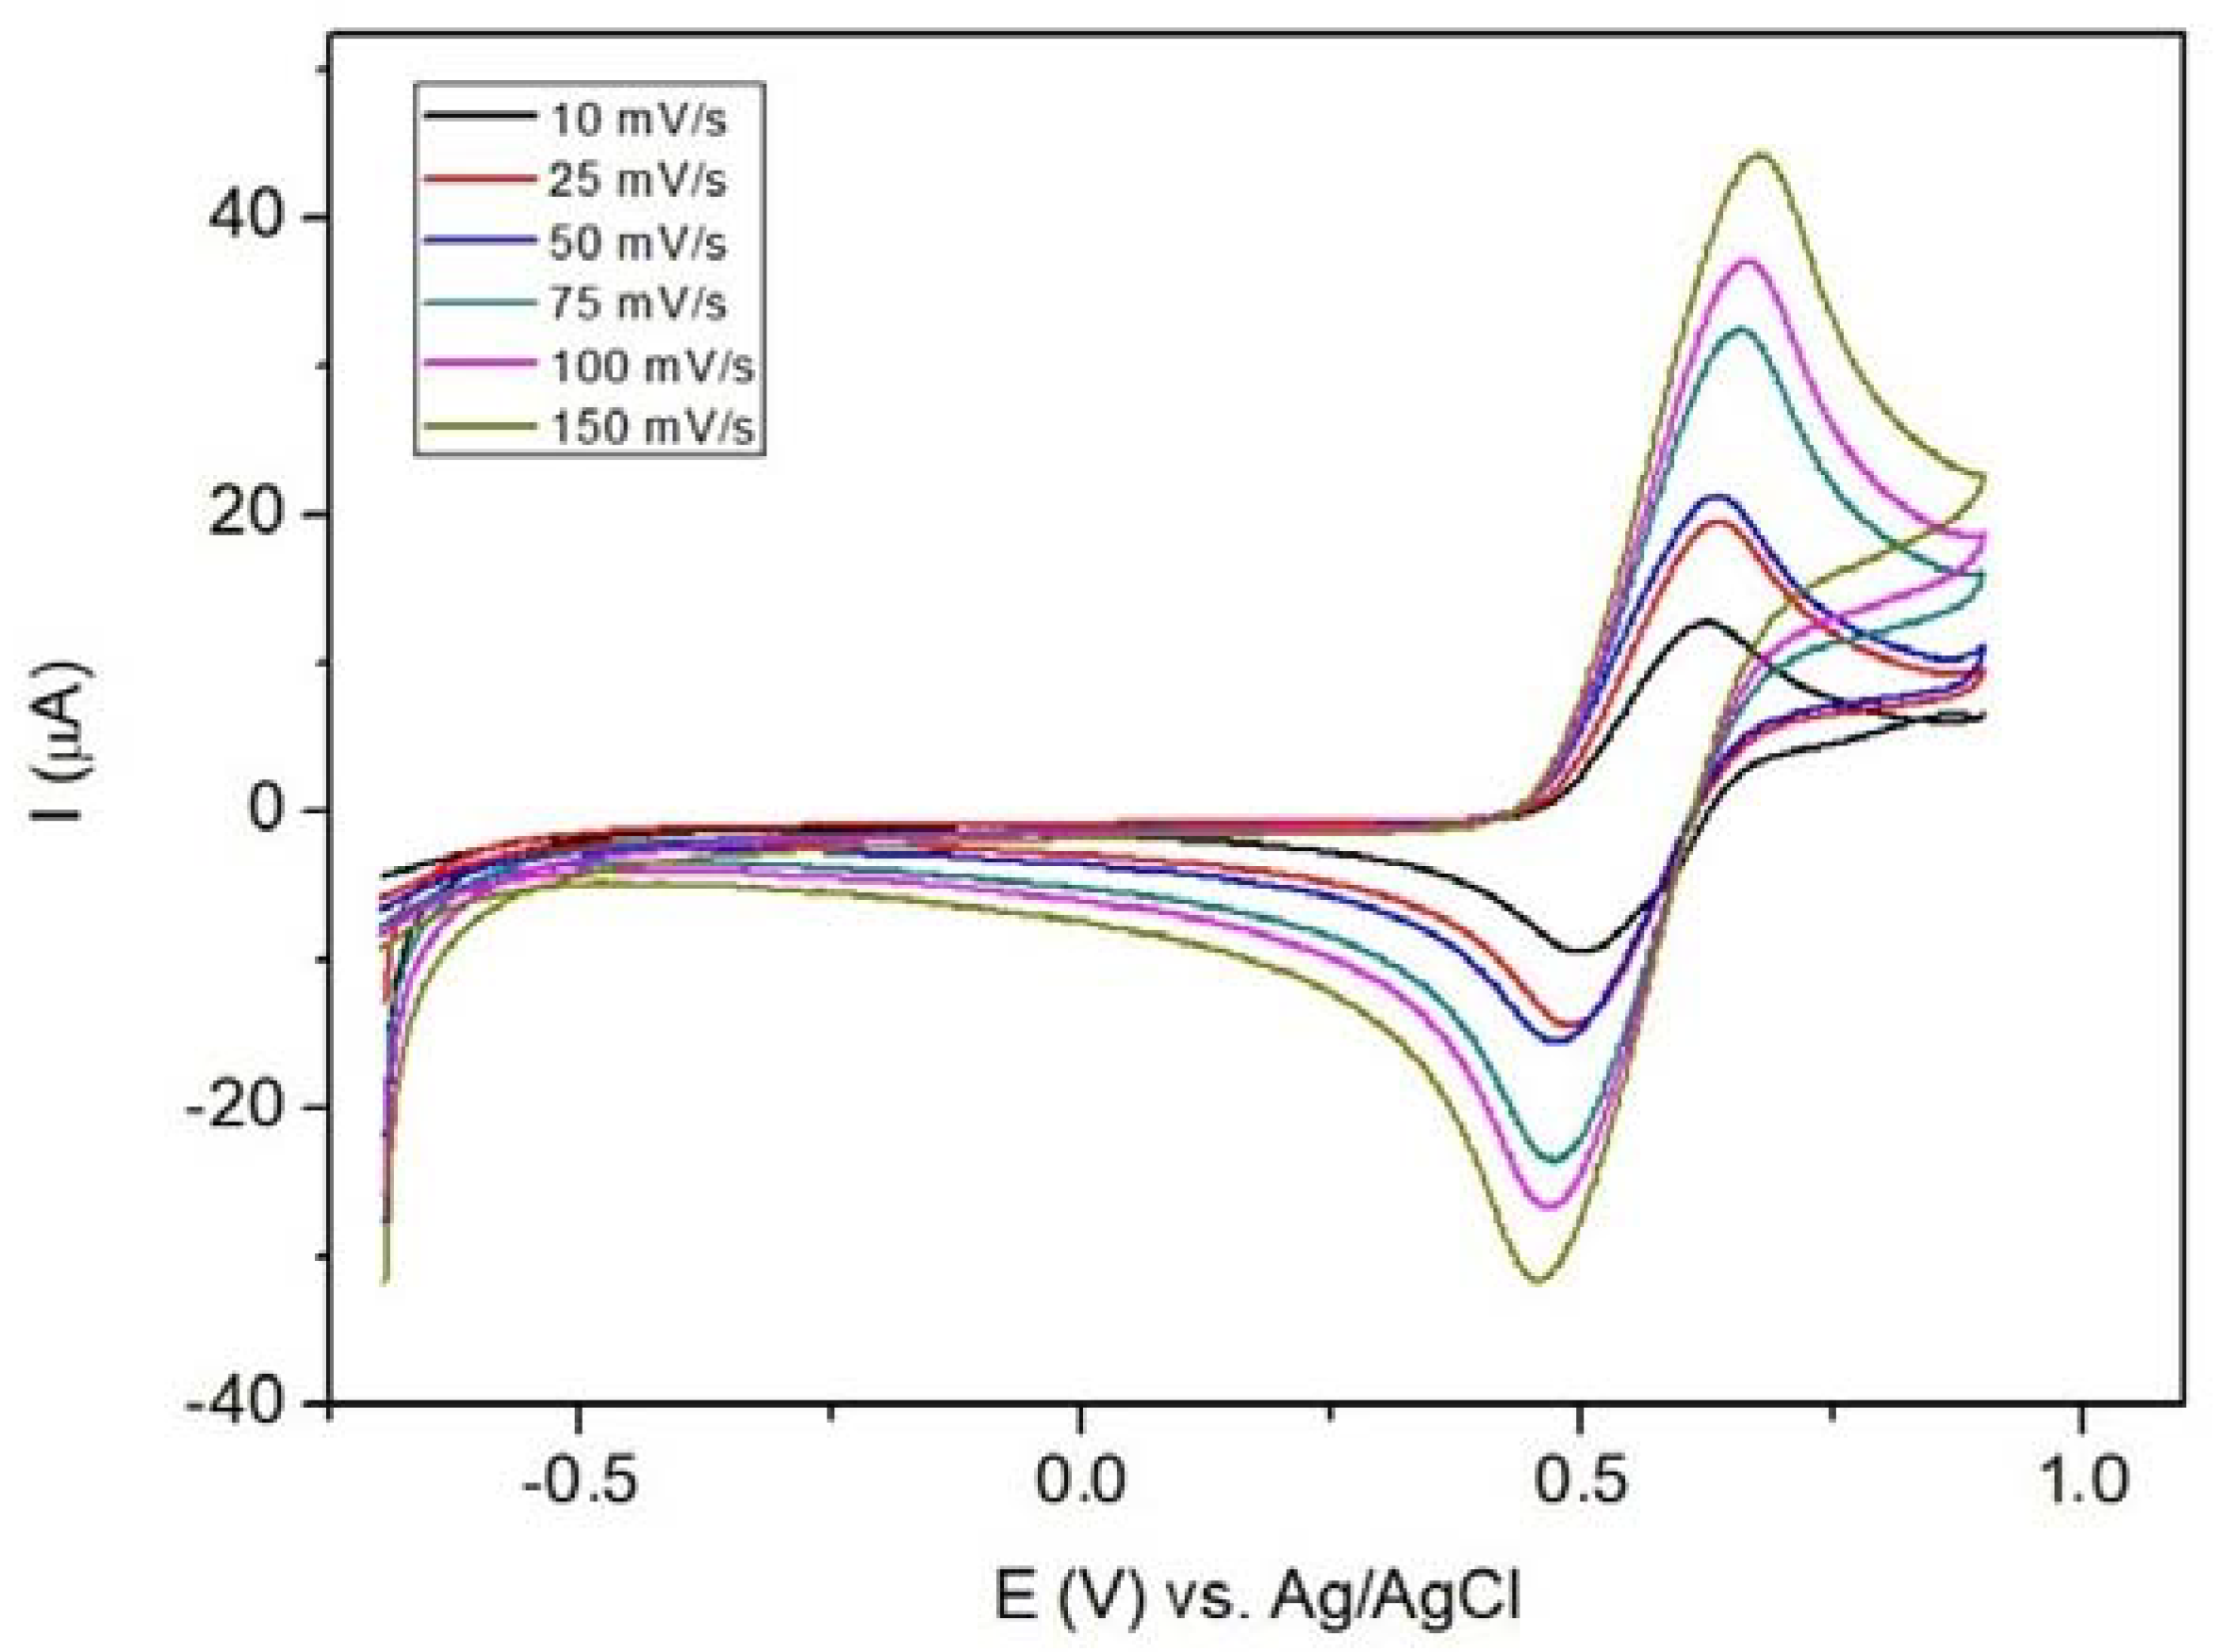
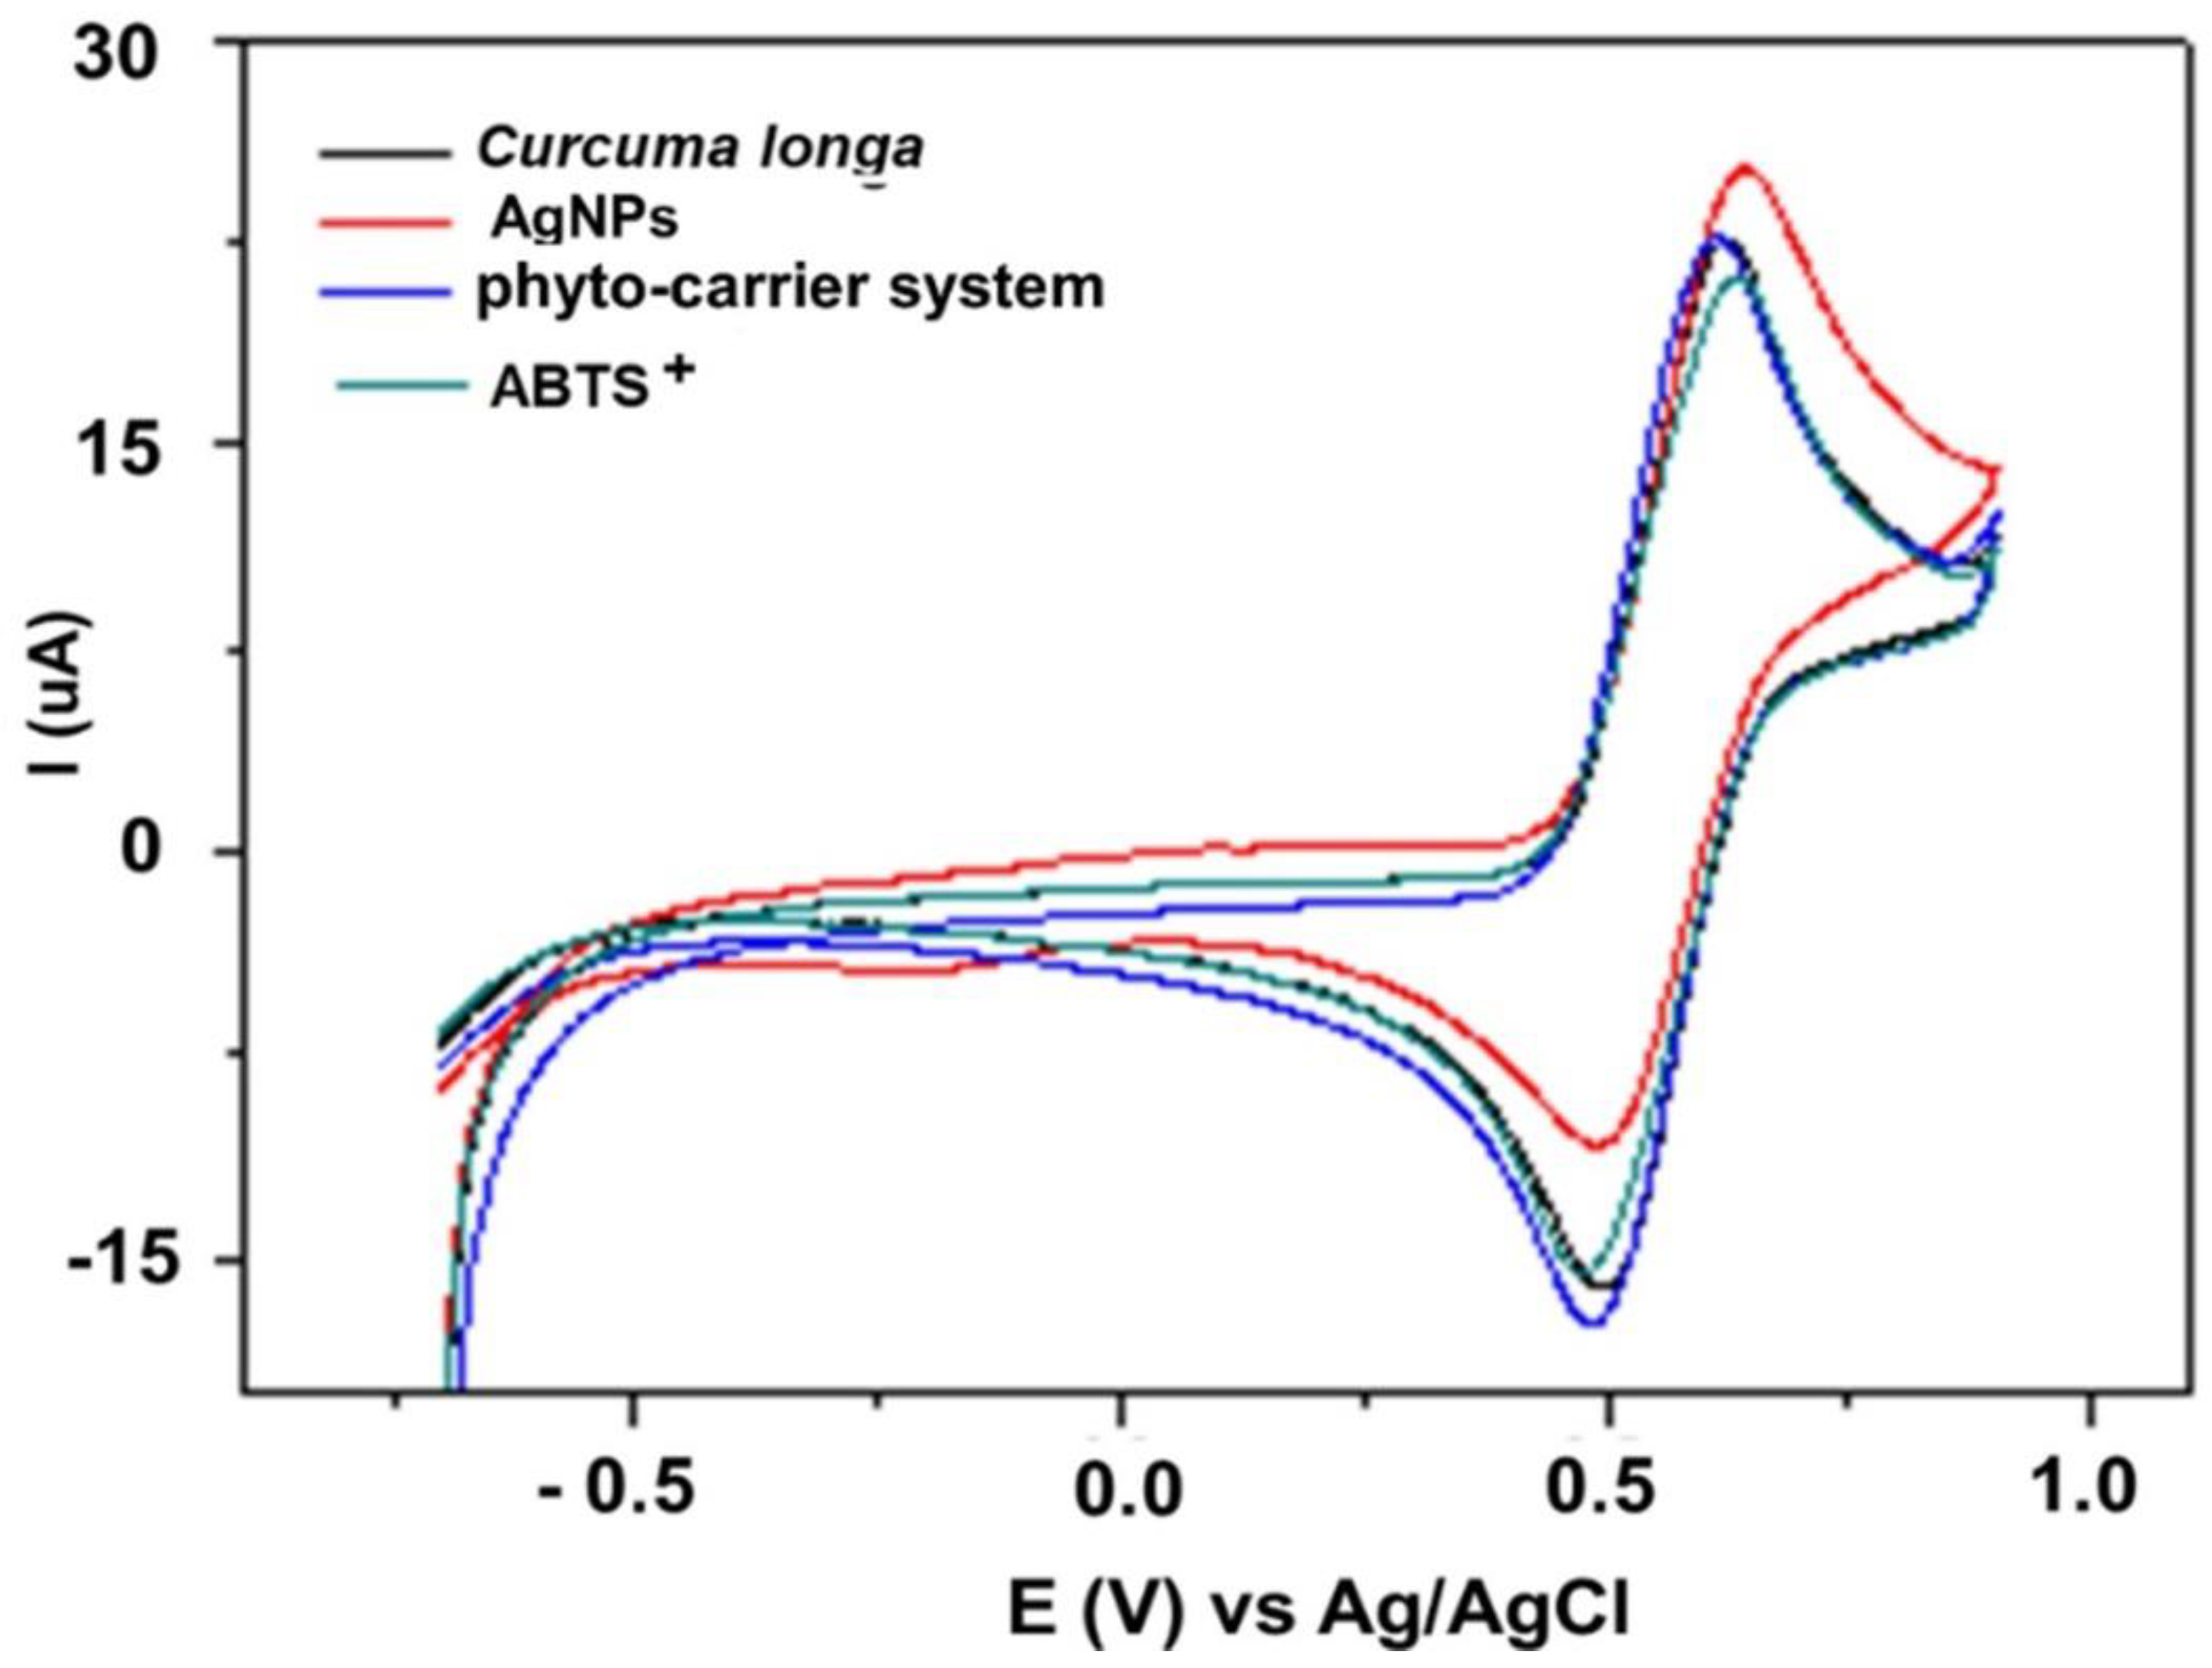
3.15. Cyclic Voltammetry
4. Conclusions
Author Contributions
Funding
Institutional Review Board Statement
Informed Consent Statement
Data Availability Statement
Acknowledgments
Conflicts of Interest
References
- Prasad, S.; Aggarwal, B.B. Turmeric, the Golden Spice: From traditional medicine to modern medicine. In Herbal Medicine: Biomolecular and Clinical Aspects, 2nd ed.; Benzie, I.F.F., Wachtel-Galor, S., Eds.; CRC Press/Taylor & Francis: Boca Raton, FL, USA, 2011; Chapter 13. [Google Scholar]
- Ansari, S.; Jilani, S.; Abbasi, H.; Binth Siraj, M.; Hashimi, A.; Ahmed, Y.; Khatoon, R.; Rifas, A.L.M. Curcuma longa: A treasure of medicinal properties. CellMed 2020, 10, e9. [Google Scholar]
- Kocaadam, B.; Şanlier, N. Curcumin, an active component of turmeric (Curcuma longa), and its effects on health. Crit. Rev. Food Sci. Nutr. 2017, 57, 2889–2895. [Google Scholar] [CrossRef] [PubMed]
- van Ruth, S.M.; de Vries, G.; Geary, M.; Giannouli, P. Influence of composition and structure of oil-in-water emulsions on retention of aroma compounds. J. Sci. Food Agric. 2002, 82, 1028–1035. [Google Scholar] [CrossRef]
- Zhang, H.A.; Kitts, D.D. Turmeric and its bioactive constituents trigger cell signaling mechanisms that protect against diabetes and cardiovascular diseases. Mol. Cell. Biochem. 2021, 476, 3785–3814. [Google Scholar] [CrossRef]
- Zhao, Q.; Luan, X.; Zheng, M.; Tian, X.-H.; Zhao, J.; Zhang, W.-D.; Ma, B.-L. Synergistic mechanisms of constituents in herbal extracts during intestinal absorption: Focus on natural occurring nanoparticles. Pharmaceutics 2020, 12, 128. [Google Scholar] [CrossRef] [PubMed] [Green Version]
- Hussein, R.A.; El-anssary, A.A. Plants Secondary Metabolites: The Key drivers of the pharmacological actions of medicinal plants. In Herbal Medicine; Builders, P.F., Ed.; IntechOpen: London, UK, 2019. [Google Scholar]
- Priyadarsini, K.I. The Chemistry of curcumin: From extraction to therapeutic agent. Molecules 2014, 19, 20091–20112. [Google Scholar] [CrossRef] [Green Version]
- Kharat, M.; Du, Z.; Zhang, G.; McClements, D.J. Physical and chemical stability of curcumin in aqueous solutions and emulsions: Impact of pH, temperature, and molecular environment. J. Agric. Food Chem. 2017, 65, 1525–1532. [Google Scholar] [CrossRef]
- Nelson, K.M.; Dahlin, J.L.; Bisson, J.; Graham, J.; Pauli, G.F.; Walters, M.A. The essential medicinal chemistry of curcumin. J. Med. Chem. 2017, 60, 1620–1637. [Google Scholar] [CrossRef]
- Nath, R.; Roy, R.; Barai, G.; Bairagi, S.; Manna, S.; Chakraborty, R. Modern developments of nano based grug delivery system by combined with phytochemicals-presenting new aspects. Int. J. Sci. Res. Sci. Technol. 2021, 8, 107–129. [Google Scholar]
- Patra, J.K.; Das, G.; Fraceto, L.F.; Campos, E.V.R.; del Pilar Rodriguez-Torres, M.; Acosta-Torres, L.S.; Diaz-Torres, L.A.; Grillo, R.; Swamy, M.K.; Sharma, S.; et al. Nano based drug delivery systems: Recent developments and future prospects. J. Nanobiotechnol. 2018, 16, 71. [Google Scholar] [CrossRef] [Green Version]
- Abduladheem Jabbar, R.; Neima Hussien, N. Investigation of antioxidant and cytotoxicity effects of silver nanoparticles produced by biosynthesis using Lactobacillus gasseri. Arch. Razi Inst. 2021, 76, 781–793. [Google Scholar] [PubMed]
- Sim, W.; Barnard, R.T.; Blaskovich, M.A.T.; Ziora, Z.M. Antimicrobial silver in medicinal and consumer applications: A patent review of the past decade (2007–2017). Antibiotics 2018, 7, 93. [Google Scholar] [CrossRef] [PubMed]
- Antsiferova, A.A.; Kashkarov, P.K.; Koval’Chuk, M.V. Effect of different forms of silver on biological objects. Nanobiotechnology Rep. 2022, 17, 155–164. [Google Scholar] [CrossRef]
- Skomorokhova, E.A.; Sankova, T.P.; Orlov, I.A.; Savelev, A.N.; Magazenkova, D.N.; Pliss, M.G.; Skvortsov, A.N.; Sosnin, I.M.; Kirilenko, D.A.; Grishchuk, I.V.; et al. Size-dependent bioactivity of silver nanoparticles: Antibacterial properties, influence on copper status in mice, and whole-body turnover. Nanotechnol. Sci. Appl. 2020, 13, 137–157. [Google Scholar] [CrossRef]
- Zhang, Q.; Hu, Y.; Masterson, C.M.; Jang, W.; Xiao, Z.; Bohloul, A.; Garcia-Rojas, D.; Puppala, H.L.; Bennett, G.; Colvin, V.L. When function is biological: Discerning how silver nanoparticle structure dictates antimicrobial activity. iScience 2022, 25, 104475. [Google Scholar] [CrossRef] [PubMed]
- Davies, J.; Davies, D. Origins and evolution of antibiotic resistance. Microbiol. Mol. Biol. Rev. 2010, 74, 417–433. [Google Scholar] [CrossRef] [Green Version]
- Stati, G.; Rossi, F.; Trakoolwilaiwan, T.; Tung, L.D.; Mourdikoudis, S.; Thanh, N.T.K.; Di Pietro, R. Development and characterization of curcumin-silver nanoparticles as a promising formulation to test on human pterygium-derived keratinocytes. Molecules 2022, 27, 282. [Google Scholar] [CrossRef]
- Aw Yong, P.Y.; Gan, H.P.; Sasmita, A.O.; Mak, S.T.; Ling, A. Nanoparticles as carriers of phytochemicals: Recent applications against lung cancer. Int. J. Res. Biomed. Biotechnol. 2018, 7, 1–11. [Google Scholar]
- Li, L.; Zhang, X.; Pi, C.; Yang, H.; Zheng, X.; Zhao, L.; Wei, Y. Review of curcumin physicochemical targeting delivery system. Int. J. Nanomed. 2020, 15, 9799–9821. [Google Scholar] [CrossRef]
- Jaiswal, S.; Mishra, P. Antimicrobial and antibiofilm activity of curcumin-silver nanoparticles with improved stability and selective toxicity to bacteria over mammalian cells. Med. Microbiol. Immunol. 2017, 207, 39–53. [Google Scholar] [CrossRef]
- Alves, T.; Chaud, M.; Grotto, D.; Jozala, A.F.; Pandit, R.; Rai, M.; Dos Santos, C.A. Association of silver nanoparticles and curcumin solid dispersion: Antimicrobial and antioxidant properties. AAPS PharmSciTech 2018, 19, 225–231. [Google Scholar] [CrossRef] [PubMed]
- Bhubhanil, S.; Talodthaisong, C.; Khongkow, M.; Namdee, K.; Wongchitrat, P.; Yingmema, W.; Hutchison, J.A.; Lapmanee, S.; Kulchat, S. Enhanced wound healing properties of guar gum/curcumin-stabilized silver nanoparticle hydrogels. Sci. Rep. 2021, 11, 1–14. [Google Scholar] [CrossRef] [PubMed]
- Paul, S.; Mohanram, K.; Kannan, I. Antifungal activity of curcumin-silver nanoparticles against fluconazole-resistant clinical isolates of Candida species. Ayu 2018, 39, 182–186. [Google Scholar] [CrossRef]
- Mohammadi, E.; Amini, S.M.; Mostafavi, S.H.; Amini, S.M. An overview of antimicrobial efficacy of curcumin-silver nanoparticles. Nanomed. Res. J. 2021, 6, 105–111. [Google Scholar]
- Xu, L.; Wang, Y.-Y.; Huang, J.; Chen, C.-Y.; Wang, Z.-X.; Xie, H. Silver nanoparticles: Synthesis, medical applications and biosafety. Theranostics 2020, 10, 8996–9031. [Google Scholar] [CrossRef] [PubMed]
- Agrawal, S.; Bhatt, M.; Rai, S.; Bhatt, A.; Dangwal, P.; Agrawal, P.K. Silver nanoparticles and its potential applications: A review. Int. Res. J. Pharm. 2018, 7, 930–937. [Google Scholar]
- Nurani, S.J.; Saha, C.K.; Khan, M.d.A. Silver nanoparticles synthesis, properties, applications and future perspectives: A short review. IOSR J. Electr. Electron. Eng. (IOSR-JEEE) 2015, 10, 117–126. [Google Scholar]
- Docea, A.O.; Calina, D.; Buga, A.M.; Zlatian, O.; Paoliello, M.; Mogosanu, G.D.; Streba, C.T.; Popescu, E.L.; Stoica, A.E.; Bîrcă, A.C.; et al. The Effect of Silver nanoparticles on antioxidant/pro-oxidant balance in a Murine Model. Int. J. Mol. Sci. 2020, 21, 1233. [Google Scholar] [CrossRef] [Green Version]
- Kwok, K.W.H.; Dong, W.; Marinakos, S.M.; Liu, J.; Chilkoti, A.; Wiesner, M.R.; Chernick, M.; Hinton, D.E. Silver nanoparticle toxicity is related to coating materials and disruption of sodium concentration regulation. Nanotoxicology 2016, 10, 1306–1317. [Google Scholar] [CrossRef]
- Nguyen, K.C.; Seligy, V.L.; Massarsky, A.; Moon, T.W.; Rippstein, P.; Tan, J.; Tayabali, A.F. Comparison of toxicity of uncoated and coated silver nanoparticles. J. Phys. Conf. Ser. 2013, 429, 012025. [Google Scholar] [CrossRef] [Green Version]
- Panahi, Y.; Rajaee, S.M.; Johnston, T.P.; Sahebkar, A. Neuroprotective effects of antioxidants in the management of neurodegenerative disorders: A literature review. J. Cell. Biochem. 2017, 120, 2742–2748. [Google Scholar] [CrossRef] [PubMed]
- Pearson-Smith, J.N.; Patel, M. Antioxidant drug therapy as a neuroprotective countermeasure of nerve agent toxicity. Neurobiol. Dis. 2019, 133, 104457. [Google Scholar] [CrossRef] [PubMed]
- Lee, K.H.; Cha, M.; Lee, B.H. Neuroprotective effect of antioxidants in the brain. Int. J. Mol. Sci. 2020, 21, 7152. [Google Scholar] [CrossRef] [PubMed]
- Hannan, M.A.; Dash, R.; Sohag, A.A.M.; Haque, M.N.; Moon, I.S. Neuroprotection against oxidative stress: Phytochemicals targeting TrkB signaling and the Nrf2-ARE antioxidant system. Front. Mol. Neurosci. 2020, 13, 116. [Google Scholar] [CrossRef] [PubMed]
- Teleanu, R.I.; Chircov, C.; Grumezescu, A.M.; Volceanov, A.; Teleanu, D.M. Antioxidant therapies for neuroprotection—A Review. J. Clin. Med. 2019, 8, 1659. [Google Scholar] [CrossRef] [Green Version]
- Shao, Y.; Yu, H.; Yang, Y.; Li, M.; Hang, L.; Xu, X. A Solid Dispersion of Quercetin Shows Enhanced Nrf2 Activation and Protective Effects against Oxidative Injury in a Mouse Model of Dry Age-Related Macular Degeneration. Oxidative Med. Cell. Longev. 2019, 2019, 1479571. [Google Scholar] [CrossRef]
- Coyoy-Salgado, A.; Segura-Uribe, J.J.; Guerra-Araiza, C.; Orozco-Suárez, S.; Salgado-Ceballos, H.; Feria-Romero, I.A.; Gallardo, J.M.; Orozco-Barrios, C.E. The Importance of Natural Antioxidants in the Treatment of Spinal Cord Injury in Animal Models: An Overview. Oxidative Med. Cell. Longev. 2019, 2019, 3642491. [Google Scholar] [CrossRef] [Green Version]
- Lalkovičová, M.; Danielisová, V. Neuroprotection and antioxidants. Neural Regen Res. 2016, 11, 865–874. [Google Scholar] [CrossRef]
- Franzoni, F.; Scarfò, G.; Guidotti, S.; Fusi, J.; Asomov, M.; Pruneti, C. Oxidative stress and cognitive decline: The neuroprotective role of natural antioxidants. Front. Neurosci. 2021, 15, 1294. [Google Scholar] [CrossRef]
- Naoi, M.; Shamoto-Nagai, M.; Maruyama, W. Neuroprotection of multifunctional phytochemicals as novel therapeutic strategy for neurodegenerative disorders: Antiapoptotic and antiamyloidogenic activities by modulation of cellular signal pathways. Futur. Neurol. 2019, 14, FNL9. [Google Scholar] [CrossRef] [Green Version]
- Wang, J.-Y.; Wen, L.L.; Huang, Y.-N.; Chen, Y.-T.; Ku, M.-C. Dual Effects of antioxidants in neurodegeneration: Direct neuroprotection against oxidative stress and indirect protection via suppression of gliamediated inflammation. Curr. Pharm. Des. 2006, 12, 3521–3533. [Google Scholar] [CrossRef] [PubMed]
- Khan, M.S.; Muhammad, T.; Ikram, M.; Ok Kim, M. Dietary supplementation of the antioxidant curcumin halts systemic LPS-Induced neuroinflammation-associated neurodegeneration and memory/synaptic impairment via the JNK/NF-κB/Akt signaling pathway in adult rats. Oxidative Med. Cell. Longev. 2019, 2019, 7860650. [Google Scholar] [CrossRef] [PubMed] [Green Version]
- Amorati, R.; Valgimigli, L. Methods to Measure the Antioxidant activity of phytochemicals and plant extracts. J. Agric. Food Chem. 2018, 66, 3324–3329. [Google Scholar] [CrossRef] [PubMed]
- Dontha, S. A review on antioxidant methods. Asian J. Pharm. Clin. Res. 2016, 9, 14–32. [Google Scholar]
- Gulcin, İ. Antioxidants and antioxidant methods: An updated overview. Arch. Toxicol. 2020, 94, 651–715. [Google Scholar] [CrossRef] [Green Version]
- Nimse, S.B.; Pal, D. Free radicals, natural antioxidants, and their reaction mechanisms. RSC Adv. 2015, 5, 27986–28006. [Google Scholar] [CrossRef] [Green Version]
- Foti, M.C.; Amorati, R. Non-phenolic radical-trapping antioxidants. J. Pharm. Pharmacol. 2009, 61, 1435–1448. [Google Scholar] [CrossRef]
- Baschieri, A.; Ajvazi, M.D.; Tonfack, J.L.F.; Valgimigli, L.; Amorati, R. Explaining the antioxidant activity of some common non-phenolic components of essential oils. Food Chem. 2017, 232, 656–663. [Google Scholar] [CrossRef]
- Ajdary, M.; Negahdary, M.; Chelongar, R.; Zadeh, S.K. The antioxidant effects of silver, gold, and zinc oxide nanoparticles on male mice in in vivo condition. Adv. Biomed. Res. 2015, 4, 69. [Google Scholar] [CrossRef]
- Flieger, J.; Flieger, W.; Baj, J.; Maciejewski, R. Antioxidants: Classification, natural sources, activity/capacity measurements, and usefulness for the synthesis of nanoparticles. Materials 2021, 14, 4135. [Google Scholar] [CrossRef]
- Dinkova-Kostova, A.T.; Talalay, P. Direct and indirect antioxidant properties of inducers of cytoprotective proteins. Mol. Nutr. Food Res. 2008, 52, S128–S138. [Google Scholar] [CrossRef]
- Shahidi, F.; Zhong, Y. Measurement of antioxidant activity. J. Funct. Foods 2015, 18, 757–781. [Google Scholar] [CrossRef]
- Adams, R.P. Identification of Essential Oil components by Gas Chromatography/Mass Spectrometry; Allured Publishing Corporation: Carol Stream, IL, USA, 2007; Volume 456. [Google Scholar]
- Swain, T.; Hillis, W.E. The phenolic constituents of Prunus domestica. I.–The quantitative analysis of phenolic constituents. J. Sci. Food Agric. 1959, 10, 63–68. [Google Scholar] [CrossRef]
- Thaipong, K.; Boonprakob, U.; Crosby, K.; Cisneros-Zevallos, L.; Hawkins Byrne, D. Comparison of ABTS, DPPH, FRAP, and ORAC assays for estimating antioxidant activity from guava fruit extracts. J. Food Compos. Anal. 2006, 19, 669–675. [Google Scholar] [CrossRef]
- Gulaboski, R.; Mirčeski, V.; Mitrev, S. Development of a rapid and simple voltammetric method to determine total antioxidative capacity of edible oils. Food Chem. 2013, 138, 116–121. [Google Scholar] [CrossRef] [Green Version]
- Teoh, E.S. Secondary metabolites of plants. Med. Orchid. Asia 2015, 5, 59–73. [Google Scholar]
- Twaij, B.M.; Hasan, M.N. Bioactive secondary metabolites from plant sources: Types, synthesis, and their therapeutic uses. Int. J. Plant Biol. 2022, 13, 4–14. [Google Scholar] [CrossRef]
- Wawrosch, C.; Zotchev, S.B. Production of bioactive plant secondary metabolites through in vitro technologies—Status and outlook. Appl. Microbiol. Biotechnol. 2021, 105, 6649–6668. [Google Scholar] [CrossRef]
- Ashraf, M.A.; Iqbal, M.; Rasheed, R.; Hussain, I.; Riaz, M.; Arif, M.S. Environmental stress and secondary metabolites in plants. In Plant Metabolites and Regulation under Environmental Stress; Academic Press: Cambridge, MA, USA, 2018; pp. 153–167. [Google Scholar]
- Setzer, W.; Duong, L.; Poudel, A.; Mentreddy, S. Variation in the chemical composition of five varieties of Curcuma longa Rhizome essential oils Cultivated in North Alabama. Foods 2021, 10, 212. [Google Scholar] [CrossRef]
- Dosoky, N.S.; Satyal, P.; Setzer, W.N. Variations in the Volatile Compositions of Curcuma Species. Foods 2019, 8, 53. [Google Scholar] [CrossRef] [Green Version]
- Aarthi, S.; Suresh, J.; Leela, N.K.; Prasath, D. Multi environment testing reveals genotype-environment interaction for curcuminoids in turmeric (Curcuma longa L.). Ind. Crop. Prod. 2020, 145, 112090. [Google Scholar] [CrossRef]
- Pino, J.A.; Fon-Fay, F.M.; Pérez, J.C.; Falco, A.S.; Hernández, I.; Rodeiro, I.; Fernández, M.D. Chemical composition and biological activities of essential oil from turmeric (Curcuma longa L.) rhizomes grown in Amazonian Ecuador, Revista CENIC. Cienc. Químicas 2018, 49, 1–8. [Google Scholar]
- Li, S.; Yuan, W.; Deng, G.; Wang, P.; Yang Paggarwal, B.B. Chemical composition and product quality control of turmeric (Curcuma longa L.). Pharm. Crops 2011, 2, 28–54. [Google Scholar] [CrossRef]
- Isah, T. Stress and defense responses in plant secondary metabolites production. Biol. Res. 2019, 52, 39. [Google Scholar] [CrossRef] [PubMed] [Green Version]
- Yang, L.; Wen, K.-S.; Ruan, X.; Zhao, Y.-X.; Wei, F.; Wang, Q. Response of Plant Secondary Metabolites to Environmental Factors. Molecules 2018, 23, 762. [Google Scholar] [CrossRef] [PubMed] [Green Version]
- Pantharos, P.; Sukcharoen, P.; Phadungrakwittaya, R.; Akarasereenont, P.; Booranasubkajorn, S.; Lumlerdkij, N. Utilization of UPLC-PDA and GC–MS/MS coupled with metabolomics analysis to identify bioactive metabolites in medicinal turmeric at different ages for the quality assurance. Phytomedicine 2022, 102, 154157. [Google Scholar] [CrossRef]
- Singh, S.; Sankar, B.; Rajesh, S.; Sahoo, K.; Subudhi, E.; Nayak, S. Chemical Composition of Turmeric Oil (Curcuma longa L.cv. Roma) and its antimicrobial activity against eye infecting pathogens. J. Essent. Oil Res. 2011, 23, 11–18. [Google Scholar] [CrossRef]
- Salem, M.A.; El-Shiekh, R.A.; Fernie, A.R.; Alseekh, S.; Zayed, A. Metabolomics-based profiling for quality assessment and revealing the impact of drying of Turmeric (Curcuma longa L.). Sci. Rep. 2022, 12, 10288. [Google Scholar] [CrossRef]
- Zhang, L.; Yang, Z.; Chen, F.; Su, P.; Chen, D.; Pan, W.; Fang, Y.; Dong, C.; Zheng, X.; Du, Z. Composition and bioactivity assessment of essential oils of Curcuma longa L. collected in China. Ind. Crop. Prod. 2017, 109, 60–73. [Google Scholar] [CrossRef]
- Kasai, H.; Yamane, Y.; Ikegami-Kawai, M.; Sudo, H. Analysis of compounds of curcuma rhizome using mass spectrometry and investigation of the antioxidant activity of rhizome extracts. Med. Aromat. Plants 2019, 8, 336. [Google Scholar]
- Tang, G.M.; Shi, Y.T.; Gao, W.; Li, M.N.; Li, P.; Yang, H. Comparative analysis of volatile constituents in root tuber and rhizome of Curcuma longa L. using fingerprints and chemometrics approaches on gas chromatography–mass spectrometry. Molecules 2022, 27, 3196. [Google Scholar] [CrossRef] [PubMed]
- Matsumura, S.; Murata, K.; Zaima, N.; Yoshioka, Y.; Morimoto, M.; Kugo, H.; Yamamoto, A.; Moriyama, T.; Matsuda, H. Inhibitory Activities of Essential Oil Obtained from Turmeric and Its Constituents against β-Secretase. Nat. Prod. Commun. 2016, 11, 1785–1788. [Google Scholar] [CrossRef] [PubMed] [Green Version]
- Arivoli, S.; Tennyson, S.; Divya, S.; Rani, S.; Marin, G. GC-MS analysis of bioactive compounds of Curcuma longa Linnaeus (Zingiberaceae) rhizome extract. J. Pharmacogn. Phytochem. 2019, 8, 49–52. [Google Scholar]
- Quemel, F.D.S.; Dantas, A.P.; Sanches, L.; Viana, A.C.G.A.; Silva, E.S.; Monteiro, E.R.; Gazim, Z.C.; Gonçalves, J.E.; Lopes, A.D. Chemotypes of turmeric (Curcuma longa L.) essential oil from four different states of Brazil. Aust. J. Crop Sci. 2021, 15, 1035–1042. [Google Scholar] [CrossRef]
- Fuloria, S.; Mehta, J.; Chandel, A.; Sekar, M.; Rani, N.N.I.M.; Begum, M.Y.; Subramaniyan, V.; Chidambaram, K.; Thangavelu, L.; Nordin, R.; et al. A Comprehensive Review on the Therapeutic Potential of Curcuma longa Linn. in Relation to its Major Active Constituent Curcumin. Front. Pharmacol. 2022, 13, 820806. [Google Scholar] [CrossRef] [PubMed]
- Sun, W.; Wang, S.; Zhao, W.; Wu, C.; Guo, S.; Gao, H.; Tao, H.; Lu, J.; Wang, Y.; Chen, X. Chemical constituents and biological research on plants in the genus Curcuma. Crit. Rev. Food Sci. Nutr. 2016, 57, 1451–1523. [Google Scholar] [CrossRef]
- Nisar, T.; Iqbal, M.; Raza, A.; Safdar, M.; Iftikhar, F.; Waheed, M. Estimation of total phenolics and free radical scavenging of turmeric (Curcuma longa). Environ. Sci. 2015, 15, 1272–1277. [Google Scholar]
- Yang, Q.-Q.; Cheng, L.-Z.; Zhang, T.; Yaron, S.; Jiang, H.-X.; Sui, Z.-Q.; Corke, H. Phenolic profiles, antioxidant, and antiproliferative activities of turmeric (Curcuma longa). Ind. Crop. Prod. 2020, 152, 112561. [Google Scholar] [CrossRef]
- Niranjan, A.; Prakash, D. Chemical constituents and biological activities of turmeric (Curcuma longa L.)—A review. J. Food Sci. Technol. 2008, 45, 109–116. [Google Scholar]
- Lu, C.; Hu, G.; Gao, S.; Mou, D. Apoptotic and anti-proliferative effect of essential oil from turmeric (Curcuma longa L.) on HepG2 and H1299 cells. Food Sci. Technol. Res. 2021, 27, 473–481. [Google Scholar] [CrossRef]
- Avanço, G.B.; Ferreira, F.D.; Bomfim, N.S.; de Santos, P.A.S.R.; dos Peralta, R.M.; Brugnari, T.; Machinski, M., Jr. Curcuma longa L. essential oil composition, antioxidant effect, and effect on Fusarium verticillioides and fumonisin production. Food Control. 2017, 73, 806–813. [Google Scholar] [CrossRef]
- Niranjan, A.; Singh, S.; Dhiman, M.; Tewari, S.K. Biochemical composition of Curcuma longa L. accessions. Anal. Lett. 2013, 46, 1069–1083. [Google Scholar] [CrossRef]
- Chanda, S.; Ramachandra, T.V. Phytochemical and pharmacological importance of turmeric (Curcuma longa): A review. Res. Rev. A J. Pharmacol. 2019, 9, 16–23. [Google Scholar]
- Abdel-Lateef, E.; Mahmoud, F.; Hammam, O.; El-Ahwany, E.; El-Wakil, E.; Kandil, S.; Abu Taleb, H.; El-Sayed, M.; Hassenein, H. Bioactive chemical constituents of Curcuma longa L. rhizomes extract inhibit the growth of human hepatoma cell line (HepG2). Acta Pharm. 2016, 66, 387–398. [Google Scholar] [CrossRef] [PubMed]
- Afzal, A.; Oriqat, G.; Khan, M.A.; Jose, J.; Afzal, M. Chemistry and biochemistry of terpenoids from Curcuma and related species. J. Biol. Act. Prod. Nat. 2013, 3, 1–55. [Google Scholar]
- Rmili, R.; Loukili, E.H.; Merimi, I.; Saidi, N.; Touzani, R.; Ramdani, M. Curcuma species: Phytochemical composition, nutritional value and pharmacological activities: A review. Arab. J. Chem. Environ. Res. 2018, 05, 68–81. [Google Scholar]
- Sharma, B.K.; Ramashanker Ghosh, S.; Rahaman, L.; Nath, N.; Lalvohbika Kaipeng, D. Plant based folk treatments from North East India for jaundice. (An overview). J. Med. Plants Stud. 2016, 4, 234–247. [Google Scholar]
- Yuan, T.; Zhang, C.; Qiu, C.; Xia, G.; Wang, F.; Lin, B.; Li, H.; Chen, L. Chemical constituents from Curcuma longa L. and their inhibitory effects of nitric oxide production. Nat. Prod. Res. 2017, 32, 1887–1892. [Google Scholar] [CrossRef]
- Kulyal, P.; Acharya, S.; Ankari, A.B.; Kokkiripati, P.K.; Tetali, S.D.; Raghavendra, A.S. Variable Secondary Metabolite Profiles Across Cultivars of Curcuma longa L. and C. aromatica Salisb. Front. Pharmacol. 2021, 12, 659546. [Google Scholar] [CrossRef]
- Rajagopal, K.; Varakumar, P.; Baliwada, A.; Byran, G. Activity of phytochemical constituents of Curcuma longa (turmeric) and Andrographis paniculata against coronavirus (COVID-19): An in silico approach. Futur. J. Pharm. Sci. 2020, 6, 104. [Google Scholar] [CrossRef]
- Lin, X.; Ji, S.; Li, R.; Dong, Y.; Qiao, X.; Hu, H.; Yang, W.; Guo, D.; Tu, P.; Ye, M. Terpecurcumins A–I from the Rhizomes of Curcuma longa: Absolute Configuration and Cytotoxic Activity. J. Nat. Prod. 2012, 75, 2121–2131. [Google Scholar] [CrossRef] [PubMed]
- Das, K.; Gezici, S. Review article Plant secondary metabolites, their separation, identification and role in human disease prevention. Ann. Phytomedicine Int. J. 2018, 7, 13–24. [Google Scholar] [CrossRef]
- Kim, S.-H.; Roszik, J.; Grimm, E.A.; Ekmekcioglu, S. Impact of l-Arginine Metabolism on Immune Response and Anticancer Immunotherapy. Front. Oncol. 2018, 8, 67. [Google Scholar] [CrossRef] [PubMed] [Green Version]
- Chiangjong, W.; Chutipongtanate, S.; Hongeng, S. Anticancer peptide: Physicochemical property, functional aspect and trend in clinical application (Review). Int. J. Oncol. 2020, 57, 678–696. [Google Scholar] [CrossRef]
- Lieu, E.L.; Nguyen, T.; Rhyne, S.; Kim, J. Amino acids in cancer. Exp. Mol. Med. 2020, 52, 15–30. [Google Scholar] [CrossRef]
- Albaugh, V.L.; Pinzon-Guzman, C.; Barbul, A. Arginine metabolism and cancer. Surg. Oncol. March 2017, 115, 273–280. [Google Scholar] [CrossRef]
- Dhama, K.; Karthik, K.; Khandia, R.; Munjal, A.; Tiwari, R.; Rana, R.; Khurana, S.K.; Ullah, S.; Khan, R.U.; Alagawany, M.; et al. Medicinal and therapeutic potential of herbs and plant metabolites/extracts countering viral pathogens-current knowledge and future prospects. Curr. Drug Metab. 2018, 19, 236–263. [Google Scholar] [CrossRef]
- Cox-Georgian, D.; Ramadoss, N.; Dona, C.; Basu, C. Therapeutic and medicinal uses of terpenes. In Medicinal Plants; Joshee, N., Dhekney, S., Parajuli, P., Eds.; Springer: Cham, Switzerland, 2019; pp. 333–359. [Google Scholar]
- Fongang Fotsing, Y.S.; Bankeu Kezetas, J.J. Terpenoids as important bioactive constituents of essential oils. In Essential oils—Bioactive Compounds, New Perspectives and Application; Santana de Oliveira, M., Almeida da Costa, W., Gomes Silva, S., Eds.; Intechopen: Rijeka, Croatia, 2020; ISBN 978–1-83962–698–2. [Google Scholar]
- Jahangeer, M.; Fatima, R.; Ashiq, M.; Basharat, A.; Qamar, S.A.; Bilal, M.; Iqbal, H.M. Therapeutic and Biomedical Potentialities of Terpenoids—A Review. J. Pure Appl. Microbiol. 2021, 15, 471–483. [Google Scholar] [CrossRef]
- Amalraj, A.; Pius, A.; Gopi, S.; Gopi, S. Biological activities of curcuminoids, other biomolecules from turmeric and their derivatives—A review. J. Tradit. Complement. Med. 2016, 7, 205–233. [Google Scholar] [CrossRef] [Green Version]
- Ganapathy, G.; Preethi, R.; Moses, J.; Anandharamakrishnan, C. Diarylheptanoids as nutraceutical: A review. Biocatal. Agric. Biotechnol. 2019, 19, 101109. [Google Scholar] [CrossRef]
- Abas, F.; Hui, L.S.; Ahmad, S.; Stanslas, J.; Israf, D.A.; Shaari, K.; Lajis, N.H. Biological Evaluation of Curcumin and Related Diarylheptanoids. Z. Für Nat. C 2006, 61, 625–631. [Google Scholar] [CrossRef] [PubMed] [Green Version]
- Kozłowska, A.; Szostak-Wegierek, D. Flavonoids–food sources, health benefits, and mechanisms involved. In Bioactive Molecules in Food, Reference Series in Phytochemistry; Mérillon, J.M., Ramawat, K., Eds.; Springer: Cham, Switzerland, 2018. [Google Scholar]
- Kozłowska, A.; Szostak-Wegierek, D. Flavonoids—Food sources and health benefits. Rocz. Państwowego Zakładu Hig. 2014, 65, 79–85. [Google Scholar]
- Panche, A.N.; Diwan, A.D.; Chandra, S.R. Flavonoids: An overview. J. Nutr. Sci. 2016, 5, e47. [Google Scholar] [CrossRef] [PubMed] [Green Version]
- Akter, J.; Hossain, M.A.; Takara, K.; Islam, M.Z.; Hou, D.-X. Antioxidant activity of different species and varieties of turmeric (Curcuma spp): Isolation of active compounds. Comp. Biochem. Physiol. Part C Toxicol. Pharmacol. 2018, 215, 9–17. [Google Scholar] [CrossRef] [PubMed]
- Li, X.; Xin, Y.; Mo, Y.; Marozik, P.; He, T.; Guo, H. The Bioavailability and Biological Activities of Phytosterols as Modulators of Cholesterol Metabolism. Molecules 2022, 27, 523. [Google Scholar] [CrossRef] [PubMed]
- Nagy, K.; Tiuca, I.D. Importance of fatty acids in physiopathology of human body. In Fatty Acids; Catala, A., Ed.; IntechOpen: Rijeka, Croatia, 2017. [Google Scholar]
- Jain, P.K.; Josh, H. Coumarin: Chemical and pharmacological profile. J. Appl. Pharm. Sci. 2012, 2, 236–240. [Google Scholar]
- Akkol, E.K.; Genç, Y.; Karpuz, B.; Sobarzo-Sánchez, E.; Capasso, R. Coumarins and Coumarin-Related Compounds in Pharmacotherapy of Cancer. Cancers 2020, 12, 1959. [Google Scholar] [CrossRef]
- Yoon, C.; Kim, D.; Lee, D.; Kim, K.; Ko, W.; Sohn, J.H.; Yim, J.H.; Kim, Y.; Oh, H. Anti-neuroinflammatory effect of aurantiamide acetate from the marine fungus Aspergillus sp. SF-5921: Inhibition of NF-κB and MAPK pathways in lipopolysaccharide-induced mouse BV2 microglial cells. Int. Immunopharmacol. 2014, 23, 568–574. [Google Scholar] [CrossRef]
- Suhas, R.; Gowda, D.C. Structure-Based Rationale Design and Synthesis of Aurantiamide Acetate Analogues—Towards a New Class of Potent Analgesic and Anti-inflammatory Agents. Chem. Biol. Drug Des. 2012, 79, 850–862. [Google Scholar] [CrossRef]
- Wang, D.; Wang, X.-H.; Yu, X.; Cao, F.; Cai, X.; Chen, P.; Li, M.; Feng, Y.; Li, H.; Wang, X. Pharmacokinetics of Anthraquinones from Medicinal Plants. Front. Pharmacol. 2021, 12, 638993. [Google Scholar] [CrossRef]
- Elvira-Torales, L.I.; García-Alonso, J.; Periago-Castón, M.J. Nutritional Importance of Carotenoids and Their Effect on Liver Health: A Review. Antioxidants 2019, 8, 229. [Google Scholar] [CrossRef] [PubMed] [Green Version]
- Mei, H.; Cai, S.; Huang, D.; Gao, H.; Cao, J.; He, B. Carrier-free nanodrugs with efficient drug delivery and release for cancer therapy: From intrinsic physicochemical properties to external modification. Bioact. Mater. 2022, 8, 220–240. [Google Scholar] [CrossRef] [PubMed]
- Fu, S.; Li, G.; Zang, W.; Zhou, X.; Shi, K.; Zhai, Y. Pure drug nano-assemblies: A facile carrier-free nanoplatform for efficient cancer therapy. Acta Pharm. Sin. B 2021, 12, 92–106. [Google Scholar] [CrossRef] [PubMed]
- Zhang, X.; Li, N.; Zhang, S.; Sun, B.; Chen, Q.; He, Z.; Luo, C.; Sun, J. Emerging carrier-free nanosystems based on molecular self-assembly of pure drugs for cancer therapy. Med. Res. Rev. 2020, 40, 1754–1775. [Google Scholar] [CrossRef]
- Senapati, S.; Mahanta, A.K.; Kumar, S.; Maiti, P. Controlled drug delivery vehicles for cancer treatment and their performance. Signal Transduct. Target. Ther. 2018, 3, 7. [Google Scholar] [CrossRef] [Green Version]
- Segneanu, A.; Velciov, S.M.; Olariu, S.; Cziple, F.; Damian, D.; Grozescu, I. Bioactive molecules profile from natural compounds. In Amino Acid—New Insights and Roles in Plant and Animal; Asao, T., Asaduzzaman, M., Eds.; IntechOpen: Rijeka, Croatia, 2017. [Google Scholar]
- Noh, C.H.C.; Azmin, N.F.M.; Amid, A. Principal Component Analysis Application on Flavonoids Characterization. Adv. Sci. Technol. Eng. Syst. J. 2017, 2, 435–440. [Google Scholar] [CrossRef] [Green Version]
- Heneczkowski, M.; Kopacz, M.; Nowak, D.; Kuźniar, A. Infrared spectrum analysis of some flavonoids. Acta Pol. Pharm. Drug Res. 2001, 58, 415–420. [Google Scholar]
- Segneanu, A.-E.; Marin, C.N.; Herea, D.D.; Stanusoiu, I.; Muntean, C.; Grozescu, I. Romanian Viscum album L.—Untargeted low-molecular metabolomic approach to engineered Viscum–AuNPs carrier assembly. Plants 2022, 11, 1820. [Google Scholar] [CrossRef]
- Scarsini, M.; Thurotte, A.; Veidl, B.; Amiard, F.; Niepceron, F.; Badawi, M.; Lagarde, F.; Schoefs, B.; Marchand, J. Metabolite Quantification by Fourier Transform Infrared Spectroscopy in Diatoms: Proof of Concept on Phaeodactylum tricornutum. Front. Plant Sci. 2021, 12, 756421. [Google Scholar] [CrossRef]
- Topală, C.M.; Tătarua, L.D.; Ducu, C. ATR-FTIR spectra fingerprinting of medicinal herbs extracts prepared using microwave extraction. Arab. J. Med. Aromat. Plants AJMAP 2017, 3, 1–9. [Google Scholar]
- Alberti, Á.; Riethmüller, E.; Béni, S. Characterization of diarylheptanoids: An emerging class of bioactive natural products. J. Pharm. Biomed. Anal. 2018, 147, 13–34. [Google Scholar] [CrossRef] [PubMed]
- Umashankar, T.; Govindappa, M.; Ramachandra, Y.L.; Padmalatha, R.; Channabasava, S. Isolation and characterization of coumarin isolated from endophyte, Alternaria Species -1 of Crotalaria pallida and its apoptotic action on HeLa cancer cell Line. Metabolomics 2015, 5, 158. [Google Scholar]
- Saha, N.; Samanta, A.K.; Chaudhuri, S.; Dutta, D. Characterization and antioxidant potential of a carotenoid from a newly isolated yeast. Food Sci. Biotechnol. 2015, 24, 117–124. [Google Scholar] [CrossRef]
- Olutola Dosumu, O.; Onocha, P.; Ekundayo, O.; Ali, M. Isolation of aurantiamides from gomphrena celosioides C. Mart. Iran J. Pharm. Res. 2014, 13, 143–147. [Google Scholar] [PubMed]
- Pang, M.; Jiang, S.; Cao, L.; Pan, L. Novel Synthesis of Steryl Esters from Phytosterols and Amino Acid. J. Agric. Food Chem. 2011, 59, 10732–10736. [Google Scholar] [CrossRef]
- Fernández-Marín, R.; Fernandes, S.; Andrés, M.; Labidi, J. Microwave-Assisted Extraction of Curcuma longa L. Oil: Optimization, Chemical Structure and Composition, Antioxidant Activity and Comparison with Conventional Soxhlet Extraction. Molecules 2021, 26, 1516. [Google Scholar] [CrossRef]
- Vega-Vásquez, P.; Mosier, N.S.; Irudayaraj, J. Nanoscale Drug Delivery Systems: From Medicine to Agriculture. Front. Bioeng. Biotechnol. 2020, 8, 79. [Google Scholar] [CrossRef] [Green Version]
- Manimaran, S.; SambathKumar, K.; Gayathri, R.; Raja, K.; Rajkamal, N.; Venkatachalapathy, M.; Ravichandran, G.; EdisonRaj, C.L. Medicinal Plant Using Ground State Stabilization of Natural Antioxidant Curcumin by Keto-Enol Tautomerisation. Nat. Prod. Bioprospecting 2018, 8, 369–390. [Google Scholar] [CrossRef] [Green Version]
- Alsammarraie, F.K.; Wang, W.; Zhou, P.; Mustapha, A.; Lin, M. Green synthesis of silver nanoparticles using turmeric extracts and investigation of their antibacterial activities. Colloids Surfaces B Biointerfaces 2018, 171, 398–405. [Google Scholar] [CrossRef]
- Mahmoudi, R.; Aghaei, S.; Salehpour, Z.; Mousavizadeh, A.; Khoramrooz, S.S.; Sisakht, M.T.; Christiansen, G.; Baneshi, M.; Karimi, B.; Bardania, H. Antibacterial and antioxidant properties of phyto-synthesized silver nanoparticles using Lavandula stoechas extract. Appl. Organomet. Chem. 2019, 34, e5394. [Google Scholar] [CrossRef]
- Rama, P.; Baldelli, A.; Vignesh, A.; Altemimi, A.B.; Lakshmanan, G.; Selvam, R.; Arunagirinathan, N.; Murugesan, K.; Pratap-Singh, A. Antimicrobial, antioxidant, and angiogenic bioactive silver nanoparticles produced using Murraya paniculata (L.) jack leaves. Nanomater. Nanotechnol. 2022, 12, 18479804211056167. [Google Scholar] [CrossRef]
- Maduraiveeran, G.; Ramaraj, R. Potential Sensing Platform of Silver Nanoparticles Embedded in Functionalized Silicate Shell for Nitroaromatic Compounds. Anal. Chem. 2009, 81, 7552–7560. [Google Scholar] [CrossRef] [PubMed]
- Abdellatif, A.A.H.; Alhathloul, S.S.; Aljohani, A.S.M.; Maswadeh, H.; Abdallah, E.M.; Musa, K.H.; El Hamd, M.A. Green Synthesis of Silver Nanoparticles Incorporated Aromatherapies Utilized for Their Antioxidant and Antimicrobial Activities against Some Clinical Bacterial Isolates. Bioinorg. Chem. Appl. 2022, 2022, 2432758. [Google Scholar] [CrossRef]
- Boughbina-Portolés, A.; Sanjuan-Navarro, L.; Moliner-Martínez, Y.; Campíns-Falcó, P. Study of the Stability of Citrate Capped AgNPs in Several Environmental Water Matrices by Asymmetrical Flow Field Flow Fractionation. Nanomaterials 2021, 11, 926. [Google Scholar] [CrossRef] [PubMed]
- Tian, X.-L.; Wang, W.-H.; Chen, K.; Cao, G.-Y. Growth and Stabilization of Silver Nanoplates in Aqueous Solvent Monitored Through UV-Vis Spectra. Chin. J. Chem. Phys. 2006, 19, 362–366. [Google Scholar] [CrossRef] [Green Version]
- Al Razy, A.; Bayazid, G.M.A.; Rahman, R.U.; Bosu, R.; Shamma, S.S. Silver nanoparticle synthesis, UV-Vis spectroscopy to find particle size and measure resistance of colloidal solution. J. Phys. Conf. Ser. 2020, 1706, 012020. [Google Scholar] [CrossRef]
- Subhan, M.A.; Alam, K.; Rahaman, M.S.; Rahman, M.A.; Awal, R. Synthesis and Characterization of Metal Complexes Containing Curcumin (C21H20O6) and Study of their Anti-microbial Activities and DNA-binding Properties. J. Sci. Res. 2013, 6, 97–109. [Google Scholar] [CrossRef] [Green Version]
- Rafi, M.; Jannah, R.; Heryanto, R.; Kautsar, A.; Septaningsih, D.A. UV-Vis spectroscopy and chemometrics as a tool for identification and discrimination of four Curcuma species. Int. Food Res. J. 2018, 25, 643–648. [Google Scholar]
- Echavarri-Erasun, C.; Johnson, E.A. Fungal carotenoids. Appl. Mycol. Biotechnol. 2002, 2, 45–85. [Google Scholar]
- Blinov, A.V.; Blinova, A.A.; Kravtsov, A.A.; Gvozdenko, A.A.; Kobina, A.V.; Momot, E.V. Synthesis of multicomponent system s based on silicon dioxide and noble metal nanoparticles. In Second International Conference on Material Science, Smart Structures and Applications: ICMSS-2019, AIP Conference Proceedings; AIP Publishing LLC: Melville, NY, USA, 2019; Volume 2188, p. 040011. [Google Scholar]
- Dalir, S.J.B.; Djahaniani, H.; Nabati, F.; Hekmati, M. Characterization and the evaluation of antimicrobial activities of silver nanoparticles biosynthesized from Carya illinoinensis leaf extract. Heliyon 2020, 6, e03624. [Google Scholar] [CrossRef]
- Raj, S.; Trivedi, R.; Soni, V. Biogenic synthesis of silver nanoparticles, characterization and their applications—A review. Surfaces 2022, 5, 67–90. [Google Scholar] [CrossRef]
- Wang, Y.; Zhang, X.; Bai, Y.; Li, W.; Li, X.; Xing, X.; Wang, C.; Gao, L.; Yogi, M.; Swamy, M.K.; et al. Anticancer and Antibacterial Activities of Silver Nanoparticles (AgNPs) Synthesized from Cucumis melo L. J. Nanosci. Nanotechnol. 2020, 20, 4143–4151. [Google Scholar] [CrossRef] [PubMed]
- Varaprasad, K.; Mohan, Y.M.; Vimala, K.; Raju, K.M. Synthesis and characterization of hydrogel-silver nanoparticle-curcumin composites for wound dressing and antibacterial application. J. Appl. Polym. Sci. 2011, 121, 784–796. [Google Scholar] [CrossRef]
- Loo, C.-Y.; Rohanizadeh, R.; Young, P.M.; Traini, D.; Cavaliere, R.; Whitchurch, C.B.; Lee, W.-H. Combination of Silver Nanoparticles and Curcumin Nanoparticles for Enhanced Anti-biofilm Activities. J. Agric. Food Chem. 2015, 64, 2513–2522. [Google Scholar] [CrossRef]
- Ghobashy, M.M.; Elkodous, M.A.; Shabaka, S.H.; Younis, S.A.; Alshangiti, D.M.; Madani, M.; Al-Gahtany, S.A.; Elkhatib, W.F.; Noreddin, A.M.; Nady, N.; et al. An overview of methods for production and detection of silver nanoparticles, with emphasis on their fate and toxicological effects on human, soil, and aquatic environment. Nanotechnol. Rev. 2021, 10, 954–977. [Google Scholar] [CrossRef]
- Gutierrez, L.; Aubry, C.; Cornejo, M.; Croue, J.-P. Citrate-Coated Silver Nanoparticles Interactions with Effluent Organic Matter: Influence of Capping Agent and Solution Conditions. Langmuir 2015, 31, 8865–8872. [Google Scholar] [CrossRef] [Green Version]
- Hongsub, B.; Tanveer, A.; Ilsu, R.; Yongmin, C.; Seong-Uk, J.; Sungwook, H. Carbon-coated iron oxide nanoparticles as contrast agents in magnetic resonance imaging. Nanoscale Res. Lett. 2011, 7, 44. [Google Scholar]
- Rajasekhar Reddy, G.; Bertie Morais, A.; Nagendra Gandhi, N. 2,2-Diphenyl-1-Picrylhydrazyl free radical scavenging assay and bacterial toxicity of protein capped silver nanoparticles for antioxidant and antibacterial applications. Asian J. Chem. 2013, 25, 9249–9254. [Google Scholar] [CrossRef]
- Erdogan, O.; Abbak, M.; Demirbolat, G.M.; Birtekocak, F.; Aksel, M.; Pasa, S.; Cevik, O. Green synthesis of silver nanoparticles via Cynara scolymus leaf extracts: The characterization, anticancer potential with photodynamic therapy in MCF7 cells. PLoS ONE 2019, 14, e0216496. [Google Scholar] [CrossRef] [Green Version]
- Sharifi-Rad, M.; Pohl, P.; Epifano, F. Phytofabrication of silver nanoparticles (AgNPs) with pharmaceutical capabilities using Otostegia persica (Burm.) Boiss. leaf extract. Nanomaterials 2021, 11, 1045. [Google Scholar] [CrossRef]
- Tanvir, E.M.; Hossen, S.; Hossain, F.; Afroz, R.; Gan, S.H.; Khalil, I.; Karim, N. Antioxidant Properties of Popular Turmeric (Curcuma longa) Varieties from Bangladesh. J. Food Qual. 2017, 2017, 8471785. [Google Scholar] [CrossRef] [Green Version]
- Lamuela-Raventós, R.M. Folin-Ciocalteu Method for the Measurement of Total Phenolic Content and Antioxidant Capacity. In Measurement of Antioxidant Activity & Capacity; Wiley Online Library: New York, NY, USA, 2017; pp. 107–115. [Google Scholar] [CrossRef]
- Carmona-Hernandez, J.C.; Taborda-Ocampo, G.; González-Correa, C.H. Folin-Ciocalteu Reaction Alternatives for Higher Polyphenol Quantitation in Colombian Passion Fruits. Int. J. Food Sci. 2021, 2021, 8871301. [Google Scholar] [CrossRef] [PubMed]
- Zhao, X.; Zhou, L.; Riaz Rajoka, M.S.; Yan, L.; Jiang, C.; Shao, D.; Zhu, J.; Shi, J.; Huang, Q.; Yang, H.; et al. Fungal silver nanoparticles: Synthesis, application and challenges. Crit. Rev. Biotechnol. 2017, 38, 1–19. [Google Scholar] [CrossRef] [PubMed]
- Bedlovičová, Z.; Strapáč, I.; Baláž, M.; Salayová, A. A brief overview on antioxidant activity determination of silver nanoparticles. Molecules 2020, 25, 3191. [Google Scholar] [CrossRef]
- Alam, M.W.; Najeeb, J.; Naeem, S.; Usman, S.M.; Nahvi, I.; Alismail, F.; Abuzir, A.; Farhan, M.; Nawaz, A. Electrochemical Methodologies for Investigating the Antioxidant Potential of Plant and Fruit Extracts: A Review. Antioxidants 2022, 11, 1205. [Google Scholar] [CrossRef]
- Zielinska, D.; Wiczkowski, W.; Piskula, M.K. Determination of the Relative Contribution of Quercetin and Its Glucosides to the Antioxidant Capacity of Onion by Cyclic Voltammetry and Spectrophotometric Methods. J. Agric. Food Chem. 2008, 56, 3524–3531. [Google Scholar] [CrossRef]
- Pękal, A.; Dróżdż, P.; Pyrzynska, K. Comparison of the Antioxidant Properties of Commonly Consumed Commercial Teas. Int. J. Food Prop. 2012, 15, 1101–1109. [Google Scholar] [CrossRef]
- Pisoschi, A.M.; Cimpeanu, C.; Predoi, G. Electrochemical Methods for Total Antioxidant Capacity and its Main Contributors Determination: A review. Open Chem. 2015, 13, 824–856. [Google Scholar] [CrossRef] [Green Version]
- Re, R.; Pellegrini, N.; Proteggente, A.; Pannala, A.; Yang, M.; Rice-Evans, C. Antioxidant activity applying an improved ABTS radical cation decolorization assay. Free. Radic. Biol. Med. 1999, 26, 1231–1237. [Google Scholar] [CrossRef]
- Frangu, A.; Ashrafi, A.M.; Sýs, M.; Arbneshi, T.; Metelka, R.; Adam, V.; Vlček, M.; Richtera, L. Determination of Trolox Equivalent Antioxidant Capacity in Berries Using Amperometric Tyrosinase Biosensor Based on Multi-Walled Carbon Nanotubes. Appl. Sci. 2020, 10, 2497. [Google Scholar] [CrossRef] [Green Version]
- Litescu, S.C.; Eremia, S.; Radu, G.L. Methods for the determination of antioxidant capacity in food and raw materials. In Bio-Farms for Nutraceuticals: Functional Food and Safety Control By Biosensors; Giardi, M.T., Rea, G., Berra, B., Eds.; Springer: Boston, MA, USA, 2010; pp. 241–249. [Google Scholar]
- Betancor-Fernández, A.; Pérez-Gálvez, A.; Sies, H.; Stahl, W. Screening pharmaceutical preparations containing extracts of turmeric rhizome, artichoke leaf, devil’s claw root and garlic or salmon oil for antioxidant capacity. J. Pharm. Pharmacol. 2003, 55, 981–986. [Google Scholar] [CrossRef] [PubMed]
- Elemike, E.E.; Fayemi, O.E.; Ekennia, A.C.; Onwudiwe, D.C.; Ebenso, E.E. Silver nanoparticles mediated by Costus afer leaf electrochemical properties. Molecules 2017, 22, 701. [Google Scholar] [CrossRef] [PubMed] [Green Version]
- Miranda, R.R.; Sampaio, I.; Zucolotto, V. Exploring silver nanoparticles for cancer therapy and diagnosis. Colloids Surfaces B Biointerfaces 2021, 210, 112254. [Google Scholar] [CrossRef]
- Lamptey, R.N.L.; Chaulagain, B.; Trivedi, R.; Gothwal, A.; Layek, B.; Singh, J. A Review of the Common Neurodegenerative Disorders: Current Therapeutic Approaches and the Potential Role of Nanotherapeutics. Int. J. Mol. Sci. 2022, 23, 1851. [Google Scholar] [CrossRef]
- Huang, M.; Keller, A.A.; Wang, X.; Tian, L.; Wu, B.; Ji, R.; Zhao, L. Low Concentrations of Silver Nanoparticles and Silver Ions Perturb the Antioxidant Defense System and Nitrogen Metabolism in N2-Fixing Cyanobacteria. Environ. Sci. Technol. 2020, 54, 15996–16005. [Google Scholar] [CrossRef] [PubMed]
- Wu, X.; Dai, H.; Xu, C.; Liu, L.; Li, S. Citric acid modification of a polymer exhibits antioxidant and anti-inflammatory properties in stem cells and tissues. J. Biomed. Mater. Res. Part A 2019, 107, 2414–2424. [Google Scholar] [CrossRef]
- Sallam, K.I. Antimicrobial and antioxidant effects of sodium acetate, sodium lactate, and sodium citrate in refrigerated sliced salmon. Food Control 2007, 18, 566–575. [Google Scholar] [CrossRef] [Green Version]
- Padayatty, S.J.; Katz, A.; Wang, Y.; Eck, P.; Kwon, O.; Lee, J.-H.; Chen, S.; Corpe, C.; Dutta, A.; Dutta, S.K.; et al. Vitamin C as an Antioxidant: Evaluation of Its Role in Disease Prevention. J. Am. Coll. Nutr. 2003, 22, 18–35. [Google Scholar] [CrossRef]


| Chemical Class | Metabolite Name |
|---|---|
| Flavonoids | dehydrozingerone |
| apigenin | |
| naringenin | |
| epicatechin | |
| quercetin | |
| myricetin | |
| kaempferol-3-rutinoside | |
| rutin | |
| Terpenoids | cymene |
| limonene | |
| terpinene | |
| tymol | |
| thujone | |
| terpineol | |
| eugenol | |
| zingiberone | |
| β-curcumene | |
| zingiberene | |
| turmerone | |
| germacrone | |
| turmerol | |
| zingibrene | |
| curzerene | |
| α-costal | |
| santanol | |
| α-copaen-11-ol | |
| α-bisabolol | |
| curzerenone | |
| glechomanolide | |
| curcumenol | |
| curdione | |
| zederone | |
| procurcumadiol | |
| bisacurone | |
| turmerol | |
| terpecurcumin A | |
| terpecurcumin D | |
| Diarylheptanoids | bisdemethoxycurcumin |
| 1,7-bis(4-hydroxyphenyl)-3,5-heptanediol | |
| 1,5-bis(4-hydroxy-3-methoxyphenyl)-1,4-pentadien-3-one | |
| curcumin | |
| cyclocurcumin | |
| 1,2-dihydrocurcumin | |
| dimethoxycurcumin | |
| tetramethylcurcumin | |
| tetrahydroxycurcumin | |
| Amino acids | glycine |
| alanine | |
| serine | |
| proline | |
| valine | |
| leucine | |
| aspartic acid | |
| glutamic acid | |
| methionine | |
| phenylalanine | |
| arginine | |
| Phenolic acids | cinnamic acid |
| protocatechuic acid | |
| p-coumaric acid | |
| gallic acid | |
| caffeic acid | |
| ferulic acid | |
| chlorogenic acid | |
| Sterols | gitoxigenin |
| cholesterol | |
| campesterol | |
| beta-stigmasterol | |
| sitosterol | |
| Fatty acids | palmitic acid |
| linoleic acid | |
| oleic acid | |
| stearic acid | |
| methyl stearidonate | |
| Coumarins | coumarin |
| Alkaloids | aurantiamide |
| Miscellaneous | trimethylbenzene |
| undecan-2-one | |
| dodec-11-en-2-one | |
| 2-hydroxy-3-(hydroxymethyl)anthraquinone | |
| beta-carotene |
| Metabolites | Wavenumber (cm−1) | Ref. |
|---|---|---|
| Amino acids | 3400; 3330–3130; 2530–2760; 2130; 1724–1754 1687, 1675, 1663, 1652, 1644, 1632, 1621, 1611, 1610–1660, 1500–1600 | [124] |
| Flavonoids | 4000–3125, 3140–3000, 1670–1620, 1650–1600, 1600–1500, 1450–1490 | [125,126] |
| Terpenoids | 2939, 1740, 1651, 810 | [127] |
| Phenolic acids | 1800–1650, 1734, 1720, 1627, 1522, 1440, 1410, 1420–1300, 1367, 1315, 1255, 1170–1100 | [127] |
| Fatty acids | 3020–3010, 2924–2915, 2855–2847, 2800-2900, 1746, 1710, 1250, 720 | [128,129] |
| Dyarylheptanoids | 2100-2550, 1620-1740 | [130] |
| Coumarin | 600–900, 1028, 1254, 1450, 1489, 1608, 1715, 2963, 3061, 3381 | [131] |
| Beta-carotene | 965, 1385, 1635, 2920 | [132] |
| Alkaloid | 720, 755, 1570, 1639, 1650, 3400 | [133] |
| Sterols | 740.5, 1063, 1192, 1383, 1466, 2937, 3427 | [134] |
| Sample | Total Phenolic Content (µg/mL) |
|---|---|
| phytocarrier system | 127.47 ± 0.03 |
| Curcuma longa | 76.02 ± 0.06 |
Publisher’s Note: MDPI stays neutral with regard to jurisdictional claims in published maps and institutional affiliations. |
© 2022 by the authors. Licensee MDPI, Basel, Switzerland. This article is an open access article distributed under the terms and conditions of the Creative Commons Attribution (CC BY) license (https://creativecommons.org/licenses/by/4.0/).
Share and Cite
Segneanu, A.-E.; Vlase, G.; Lukinich-Gruia, A.T.; Herea, D.-D.; Grozescu, I. Untargeted Metabolomic Approach of Curcuma longa to Neurodegenerative Phytocarrier System Based on Silver Nanoparticles. Antioxidants 2022, 11, 2261. https://doi.org/10.3390/antiox11112261
Segneanu A-E, Vlase G, Lukinich-Gruia AT, Herea D-D, Grozescu I. Untargeted Metabolomic Approach of Curcuma longa to Neurodegenerative Phytocarrier System Based on Silver Nanoparticles. Antioxidants. 2022; 11(11):2261. https://doi.org/10.3390/antiox11112261
Chicago/Turabian StyleSegneanu, Adina-Elena, Gabriela Vlase, Alexandra Teodora Lukinich-Gruia, Dumitru-Daniel Herea, and Ioan Grozescu. 2022. "Untargeted Metabolomic Approach of Curcuma longa to Neurodegenerative Phytocarrier System Based on Silver Nanoparticles" Antioxidants 11, no. 11: 2261. https://doi.org/10.3390/antiox11112261
APA StyleSegneanu, A.-E., Vlase, G., Lukinich-Gruia, A. T., Herea, D.-D., & Grozescu, I. (2022). Untargeted Metabolomic Approach of Curcuma longa to Neurodegenerative Phytocarrier System Based on Silver Nanoparticles. Antioxidants, 11(11), 2261. https://doi.org/10.3390/antiox11112261