
Adipocyte-Specific Expression of PGC1α Promotes Adipocyte Browning and Alleviates Obesity-Induced Metabolic Dysfunction in an HO-1-Dependent Fashion

 ,
,  ,
, 
Abstract
:1. Introduction
2. Materials and Methods
2.1. Animal Experimentation and Generation of Transgenic Mice with Adipocyte-Specific Expression of PGC1α
2.2. Generation of Lentiviral-Mediated PGC1-α Overexpression or Silencing in Adipocytes
2.3. Measurement of Fasting Blood Glucose
2.4. Western Blot
2.5. RT-PCR and R.N.A. Arrays Analysis
2.6. Hematoxylin–Eosin and Masson Trichrome Stain in Liver
2.7. Histology, Masson Trichrome Staining, and Immunofluorescence in Adipose Tissues
2.8. Measurement of Mitochondrial Oxygen Consumption Rate in Adipocytes
2.9. Detection of Nuclear PGC-1α by Immunogold Staining
2.10. Statistics
3. Results
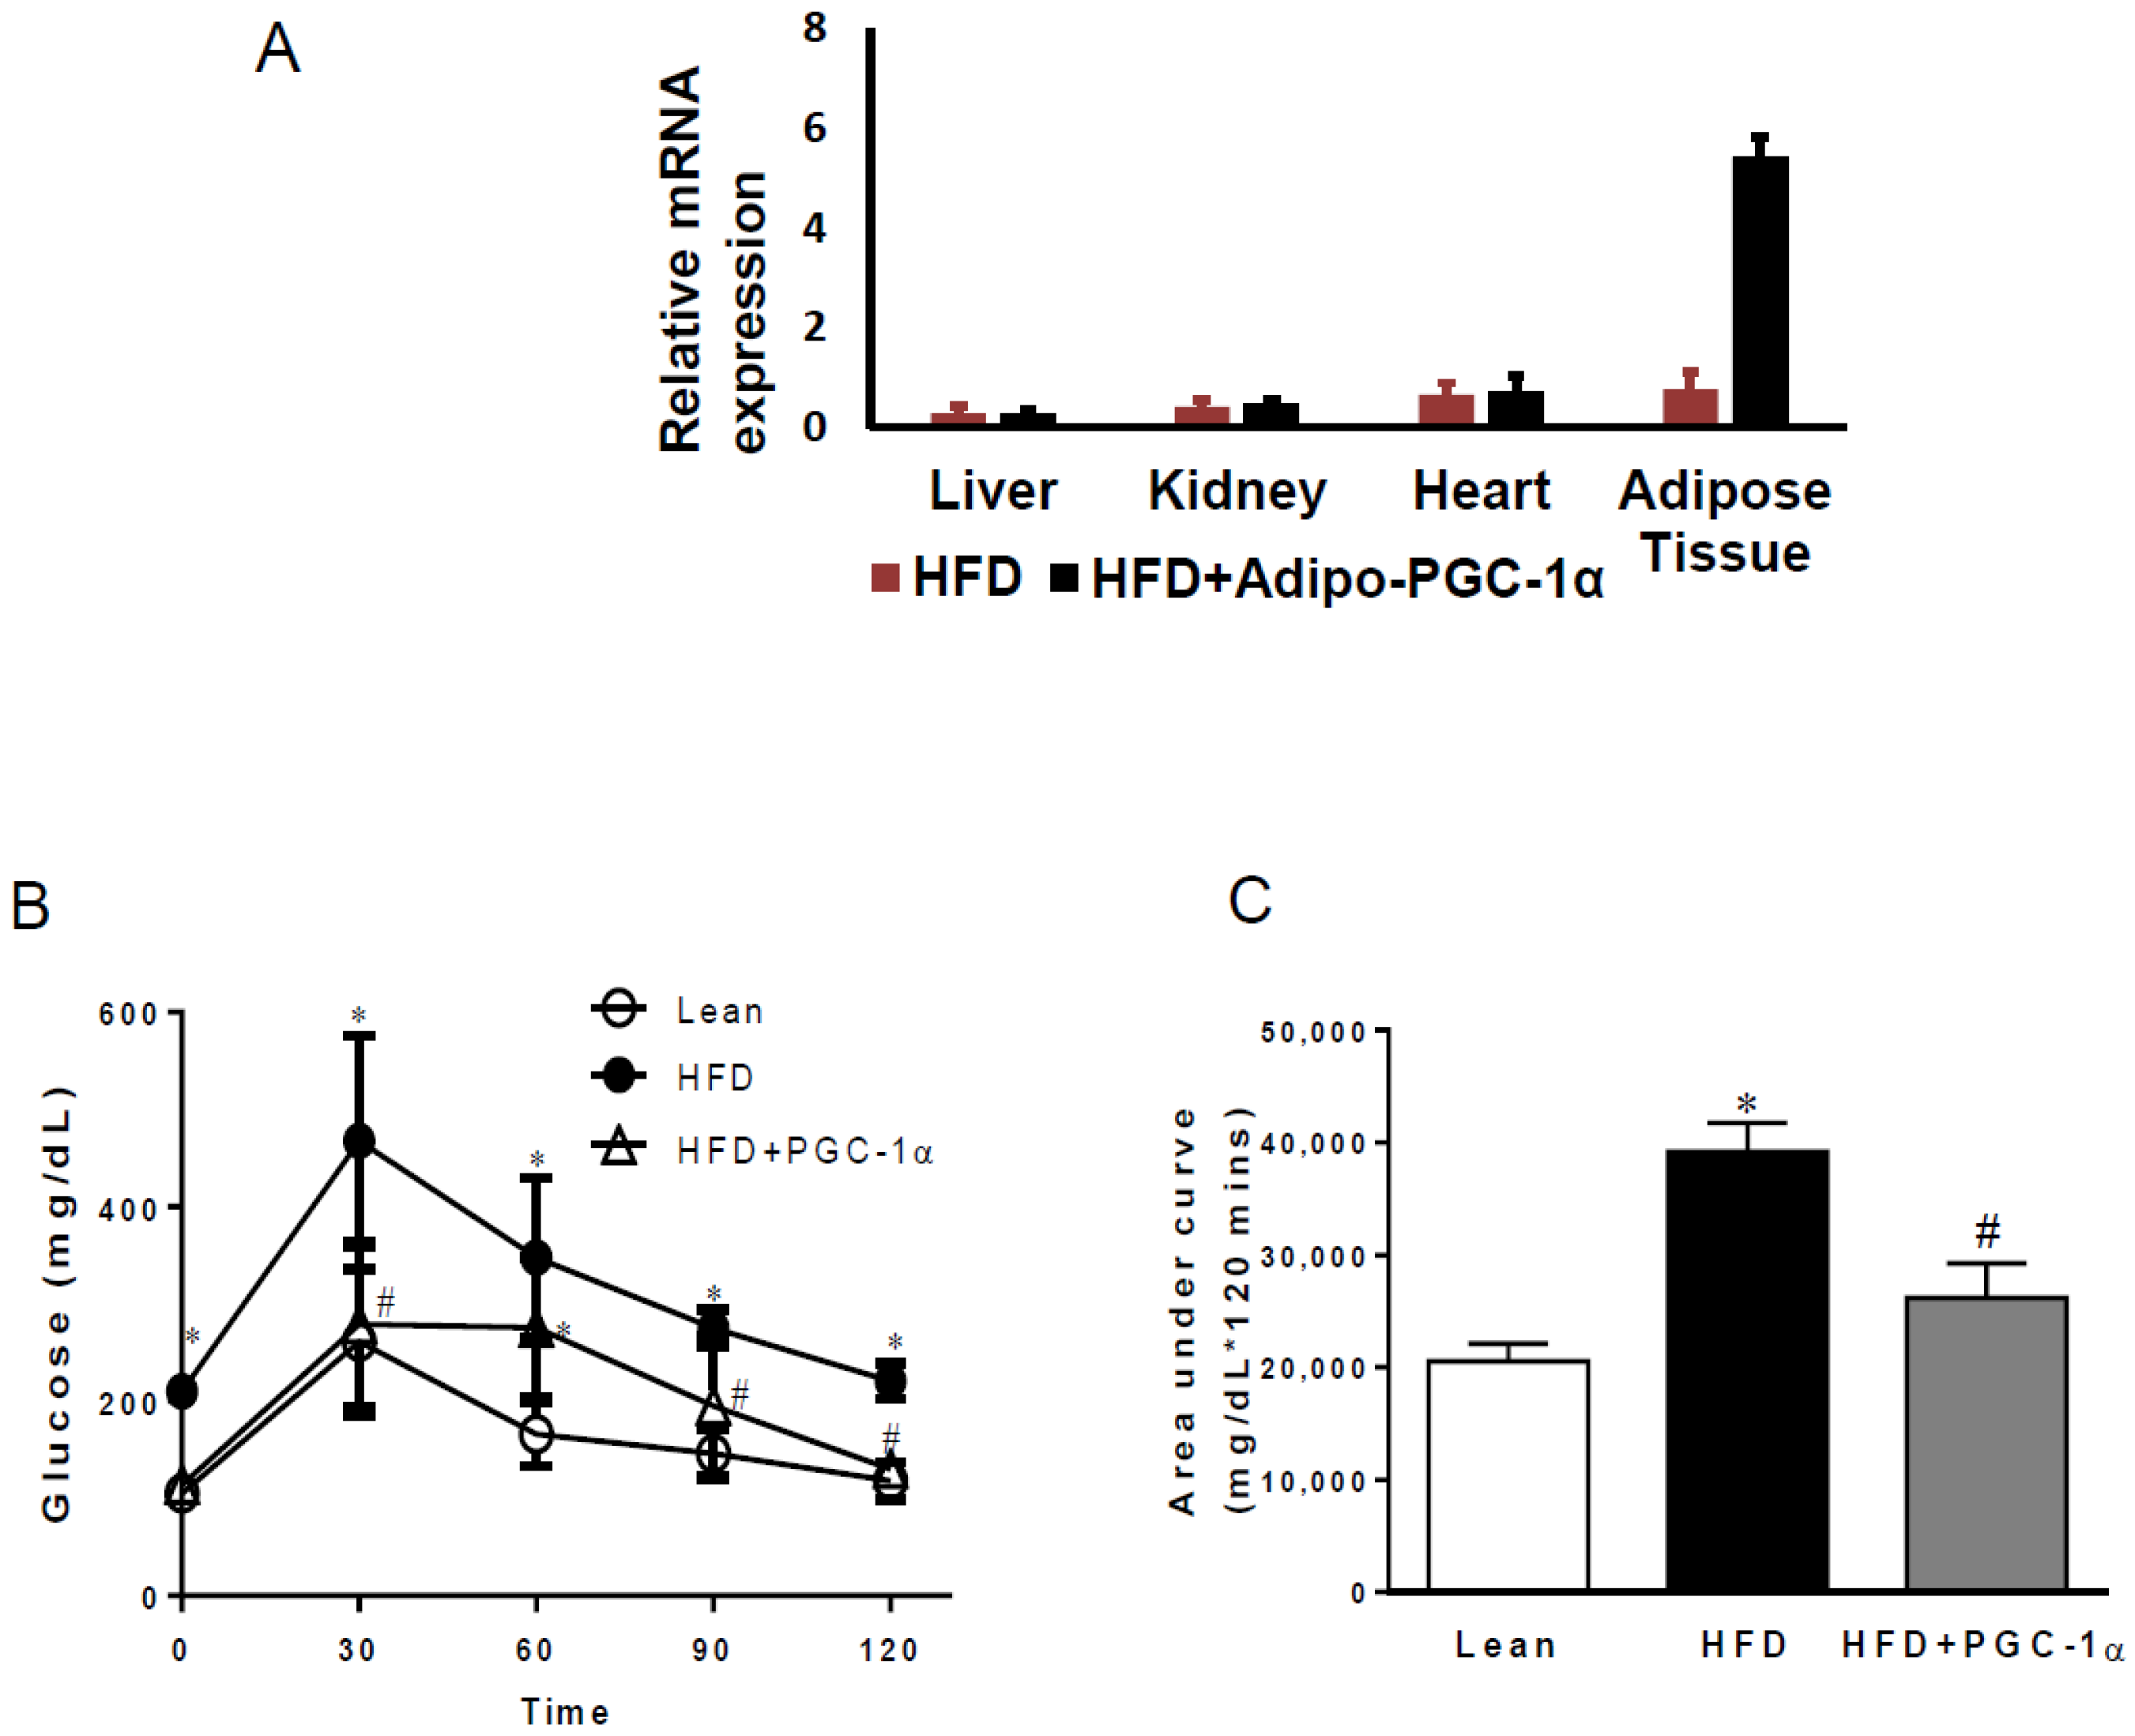
3.1. Transgenic-Adipo-PGC-1α Mice Exhibit Glucose Intolerance
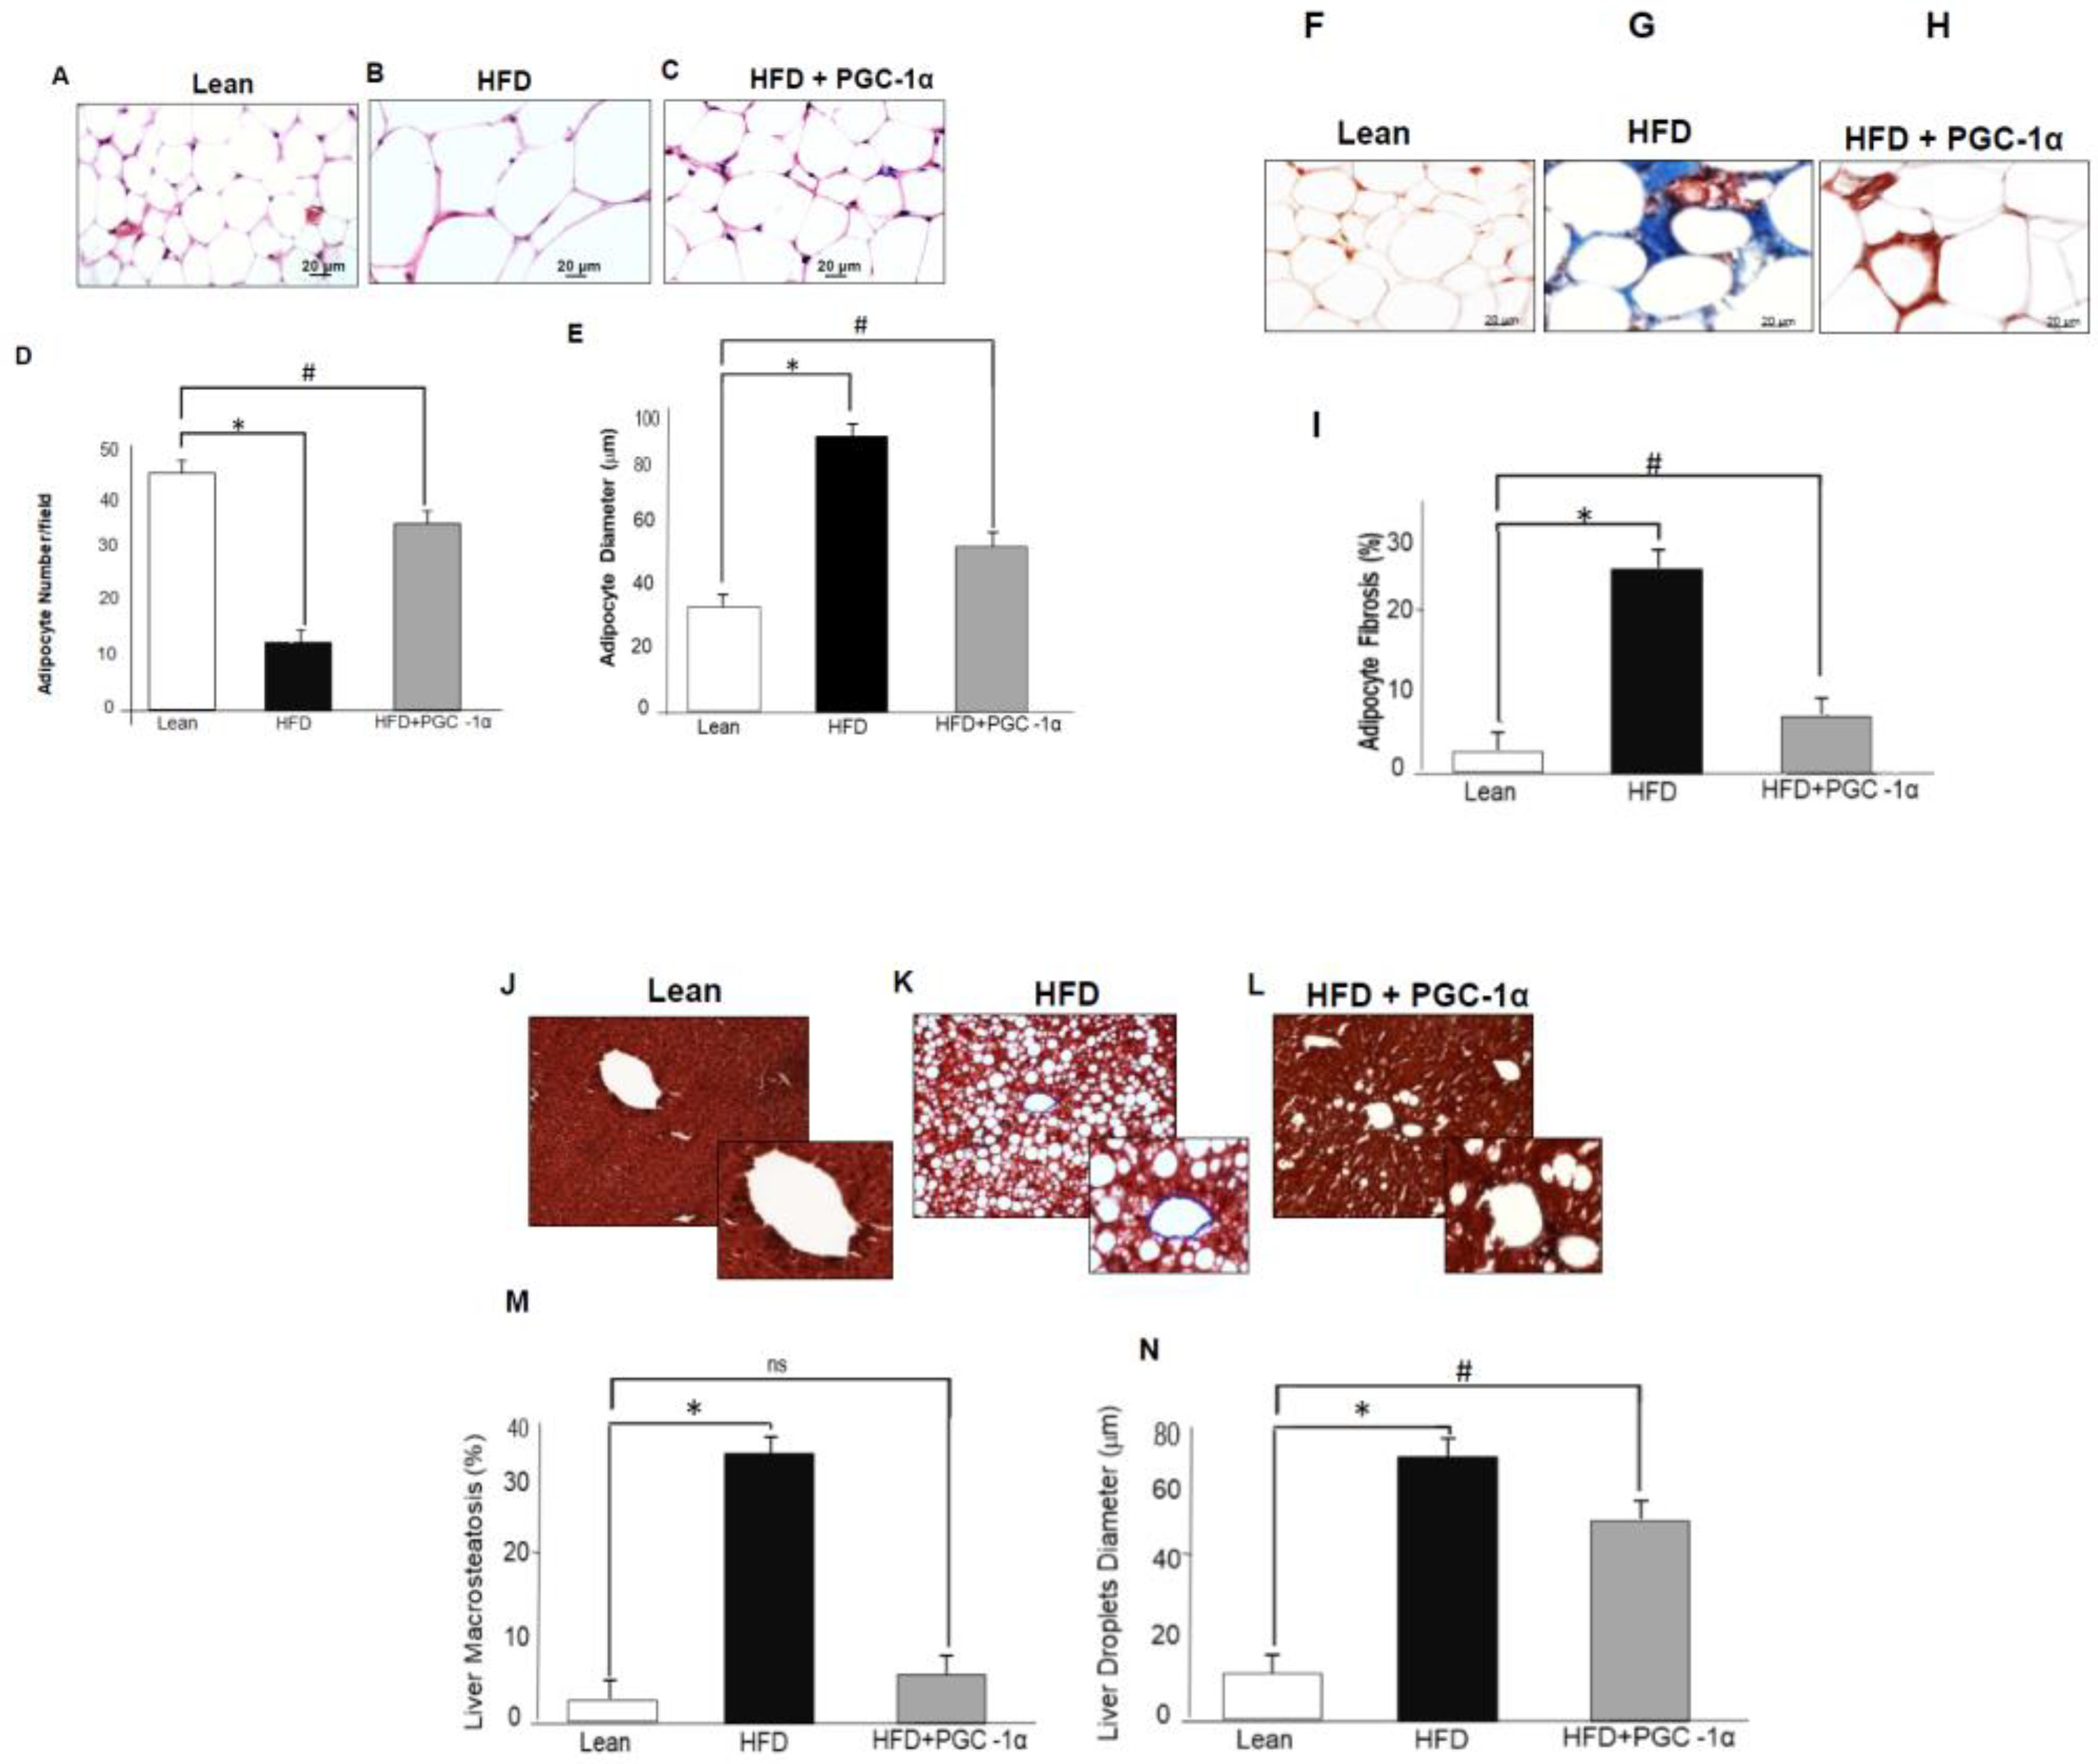
3.2. Adipose-Specific Expression of PGC-1α Rescues Mice from HFD.-Induced Adipocyte Hypertrophy, Fibrosis, Liver Steatosis, and Lipid Droplet Size
3.3. Nuclear Localization of PGC-1α in Adipocytes
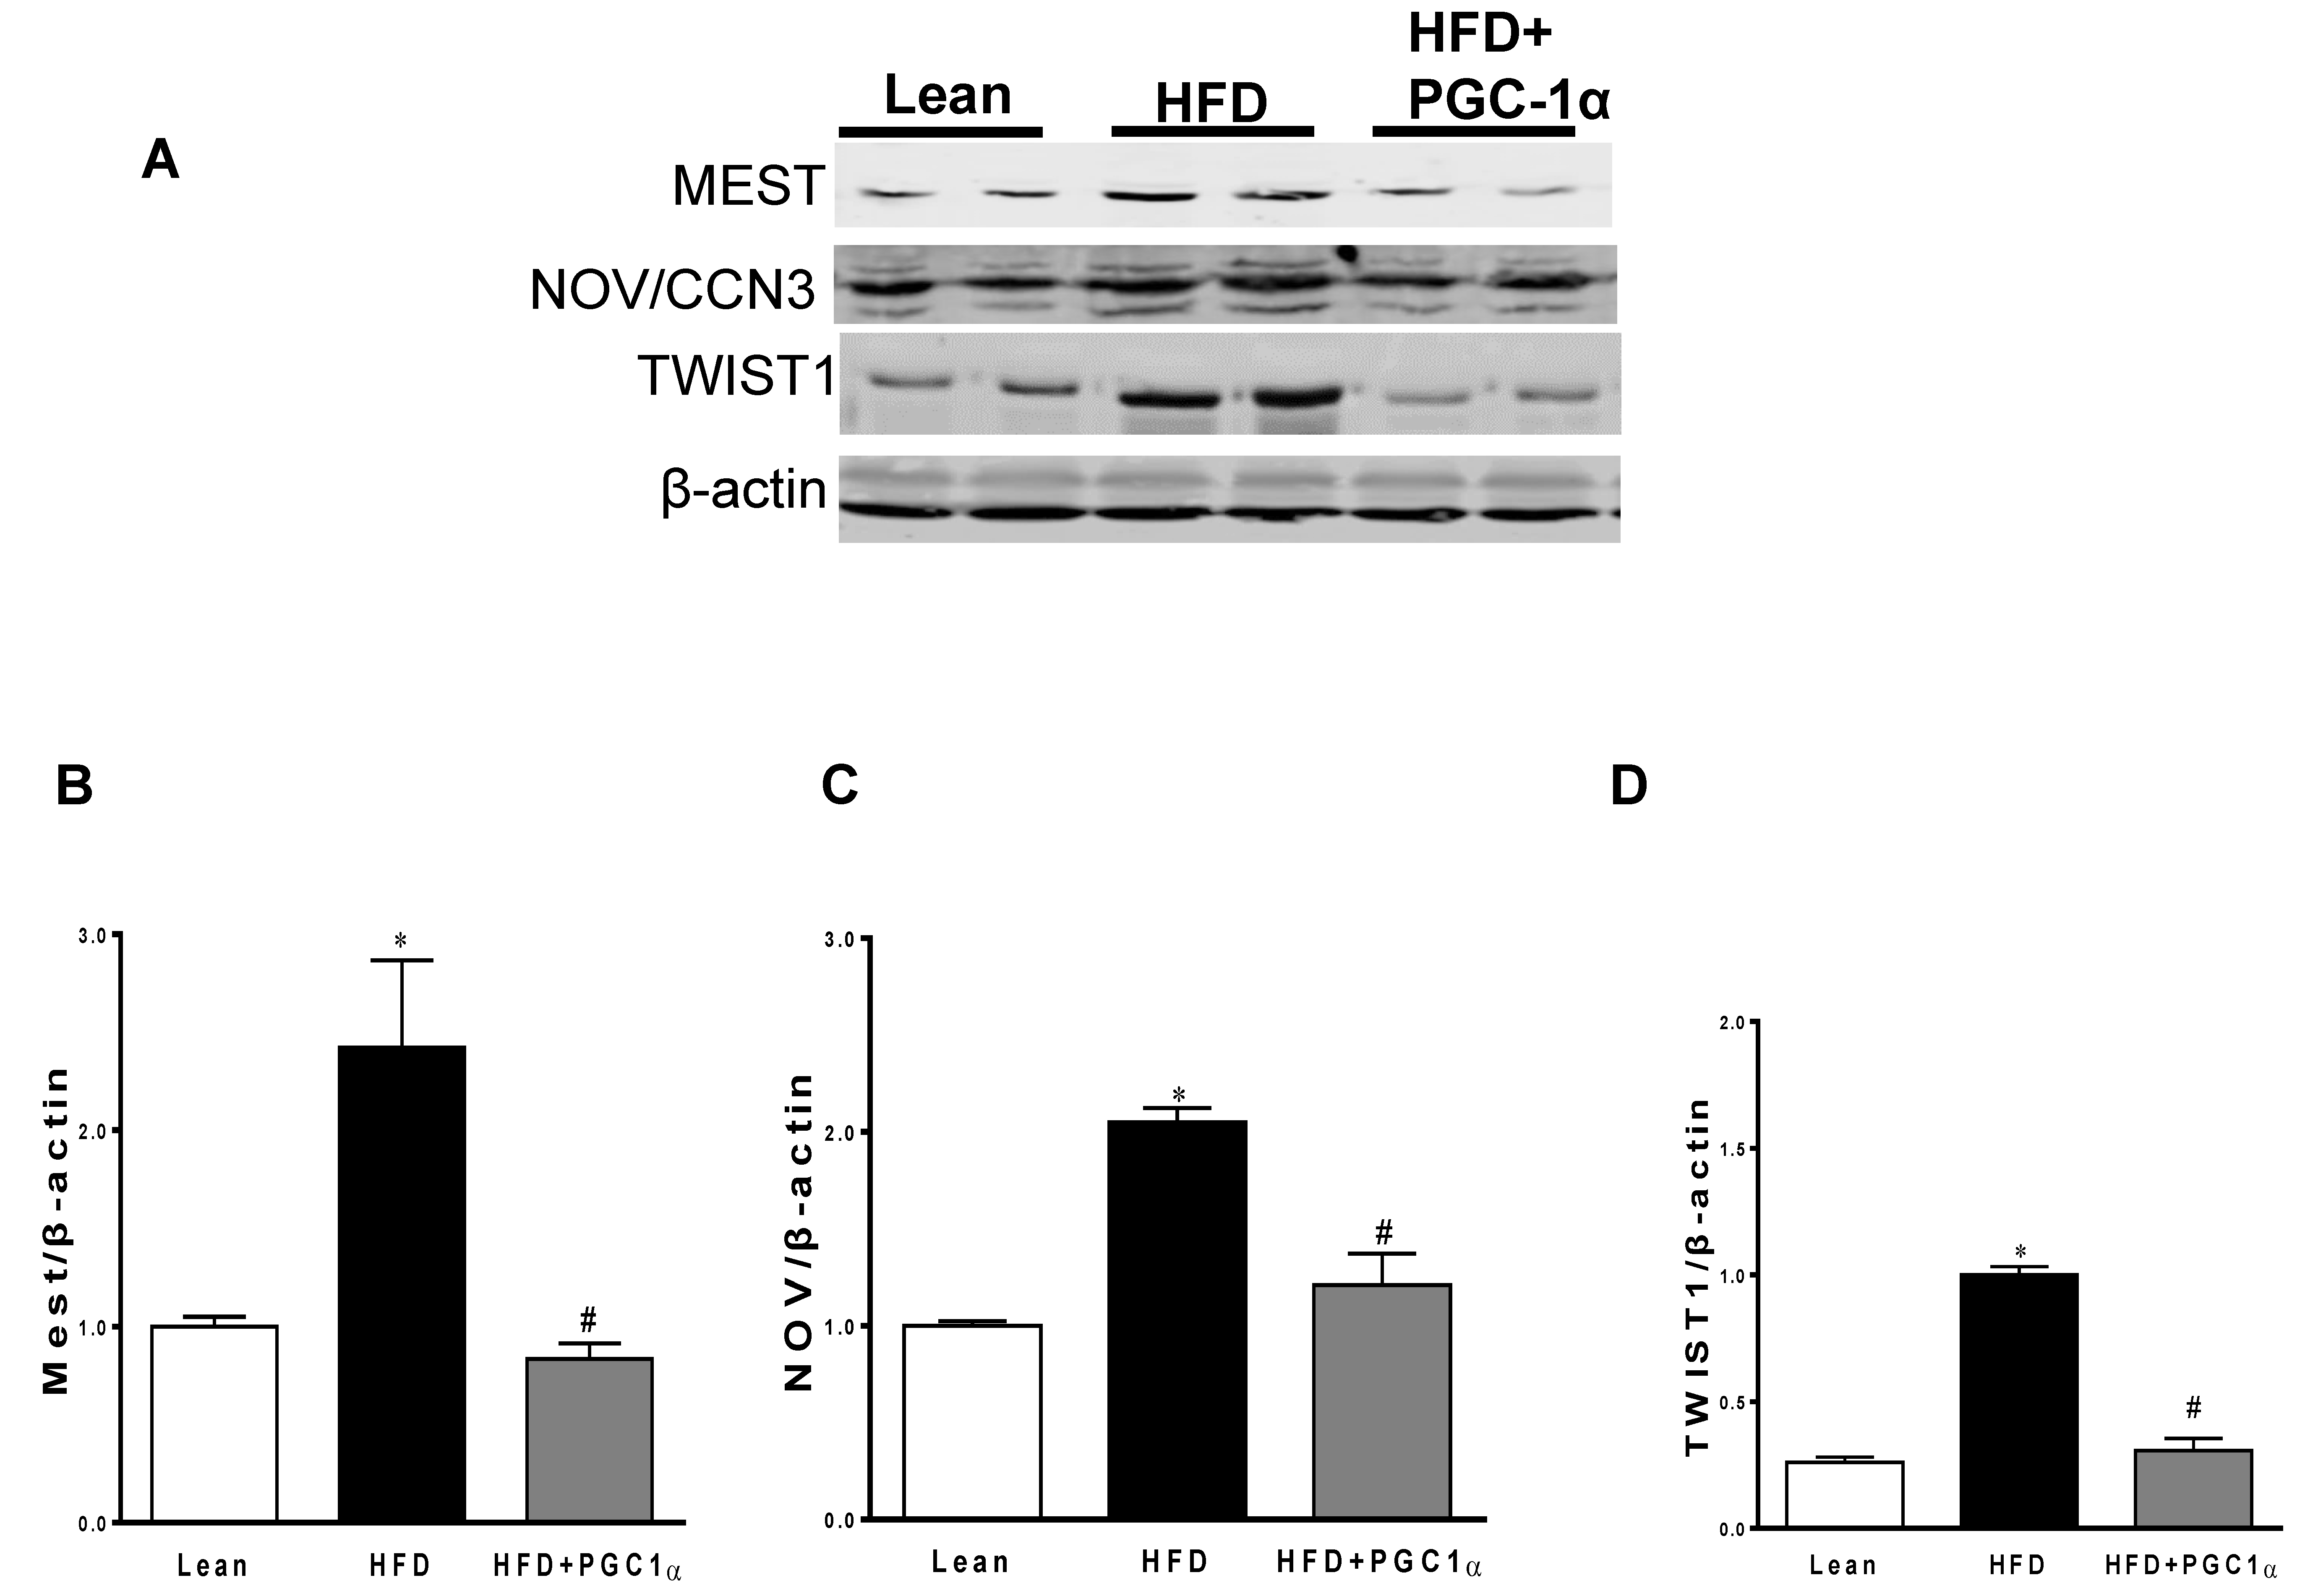
3.4. mRNA Levels of PGC-1α, HO-1, Mitochondrial Genes, and NOV/CCN3 in the Adipose Tissue of Transgenic-Adipo-PGC-1α Mice
3.5. PGC-1α Mediated Regulation of Mitochondrial Function in Cultured Adipocytes
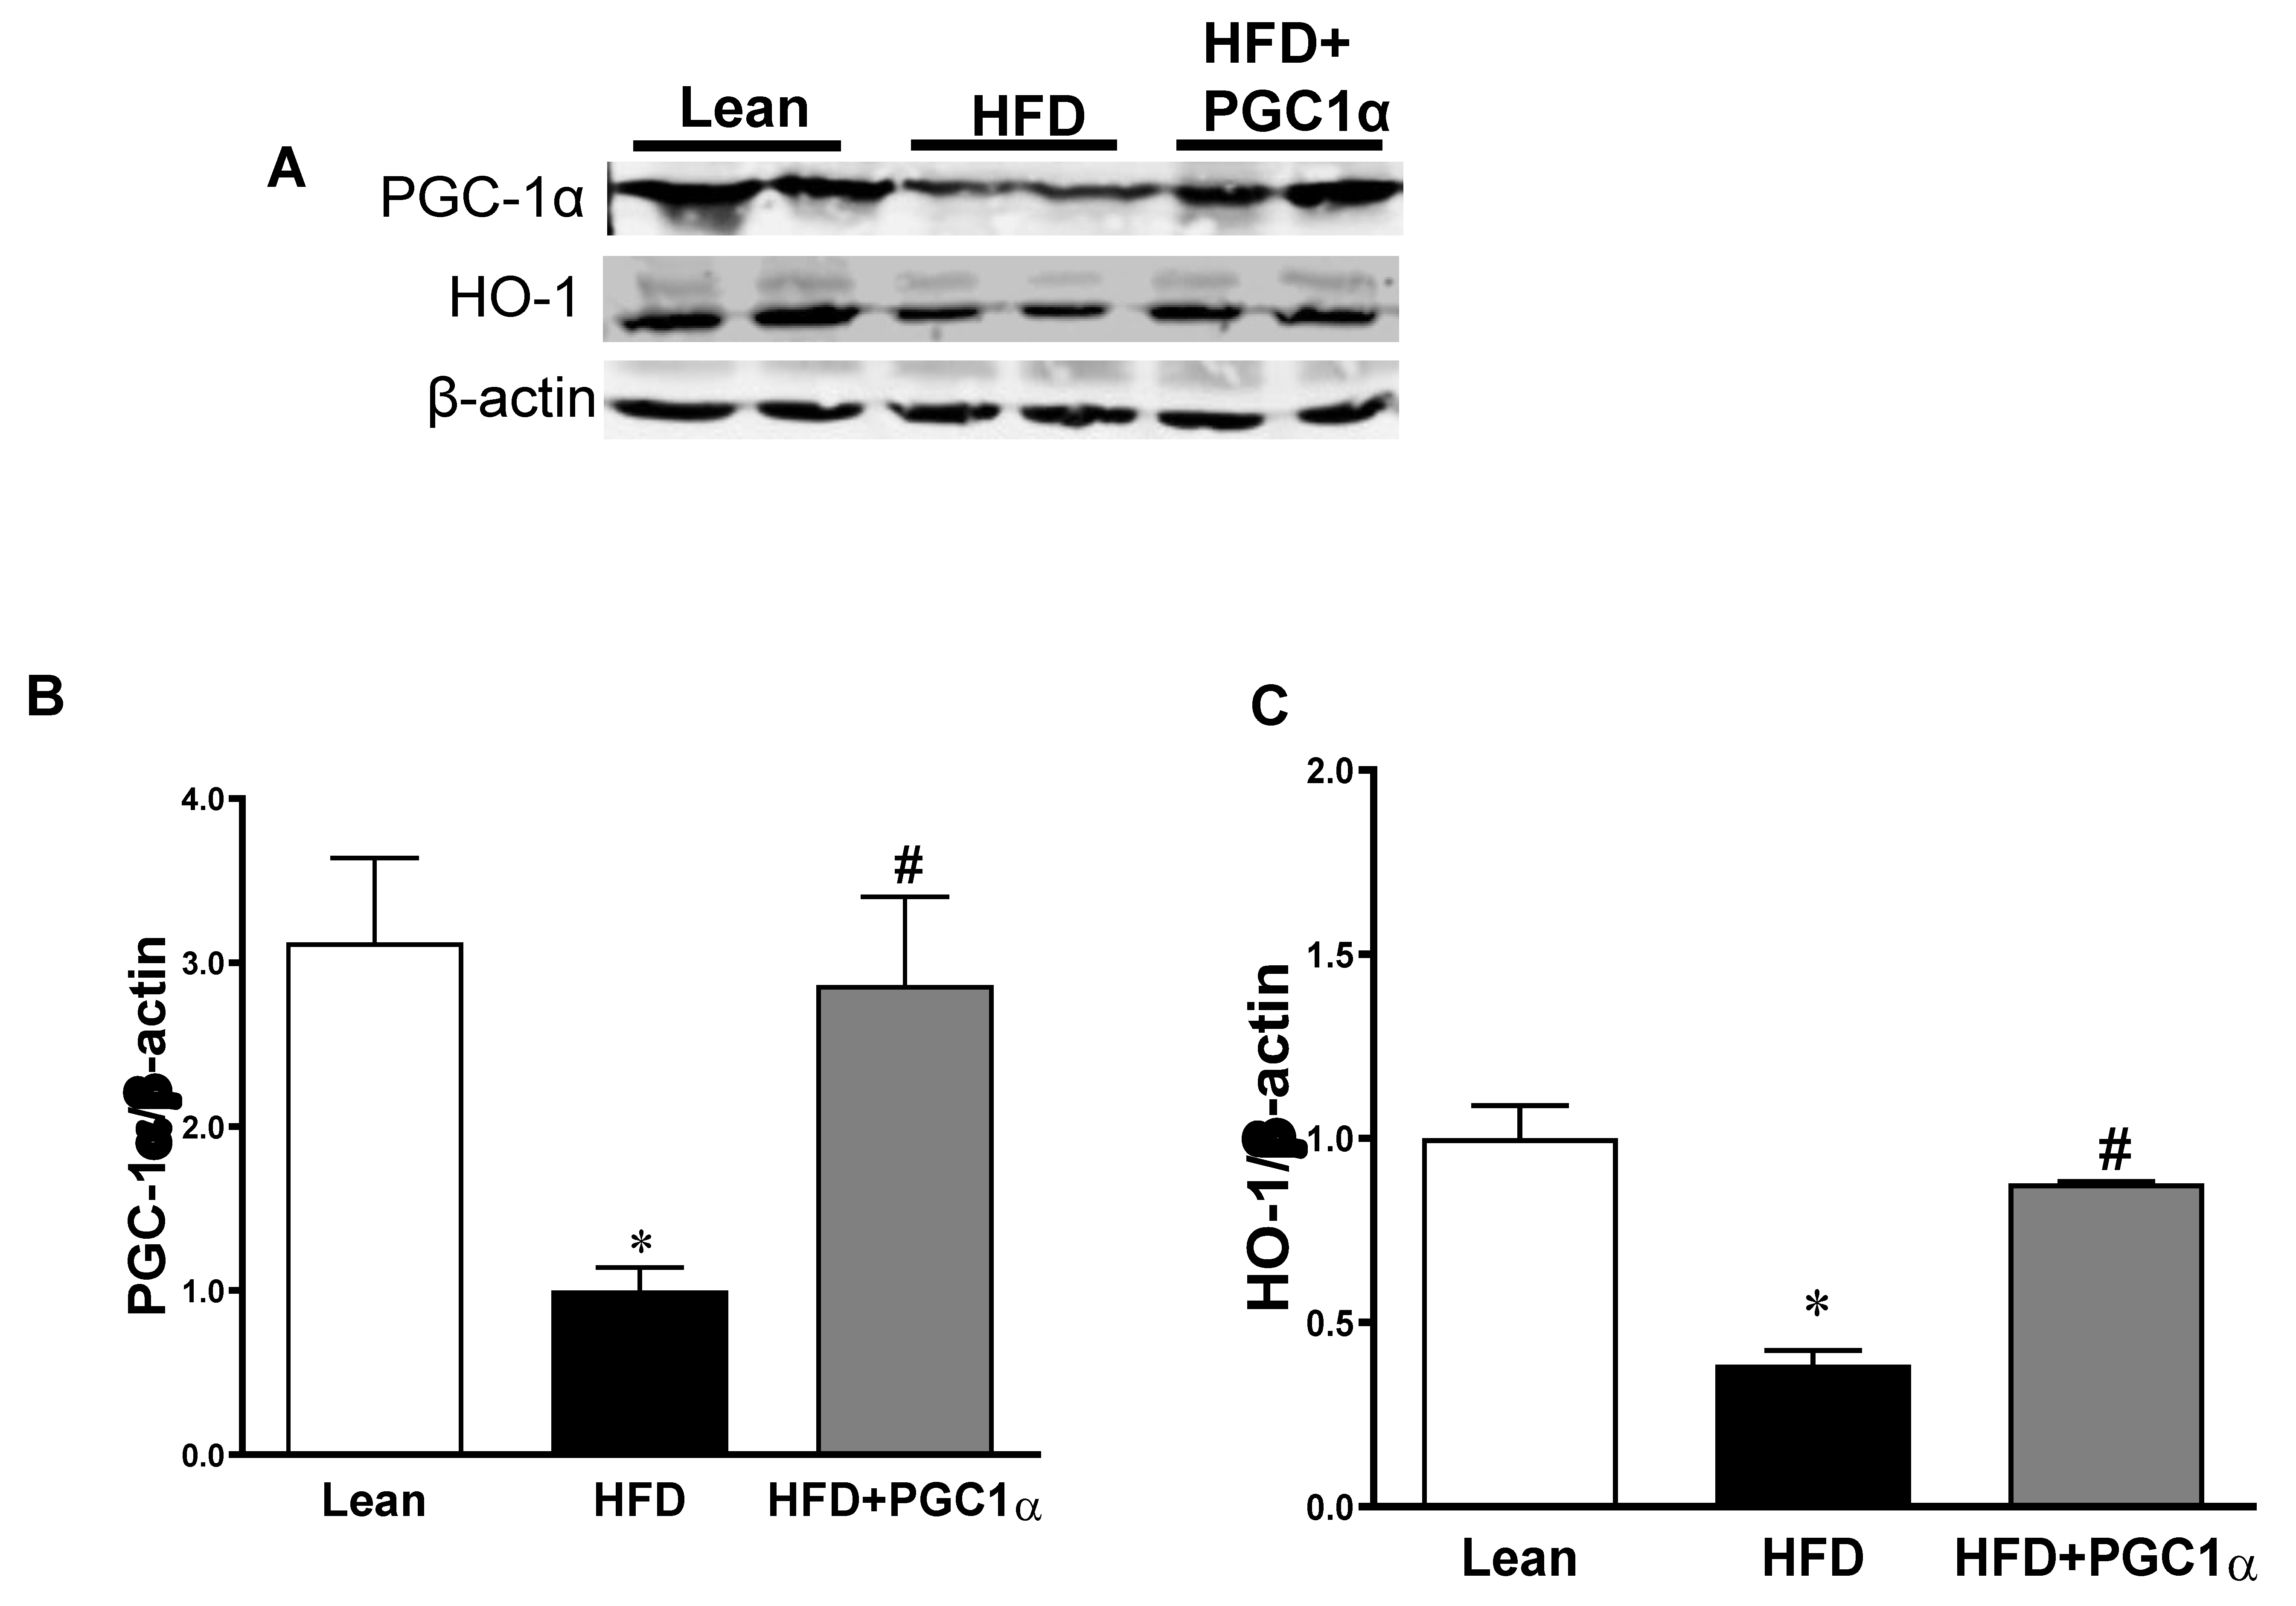
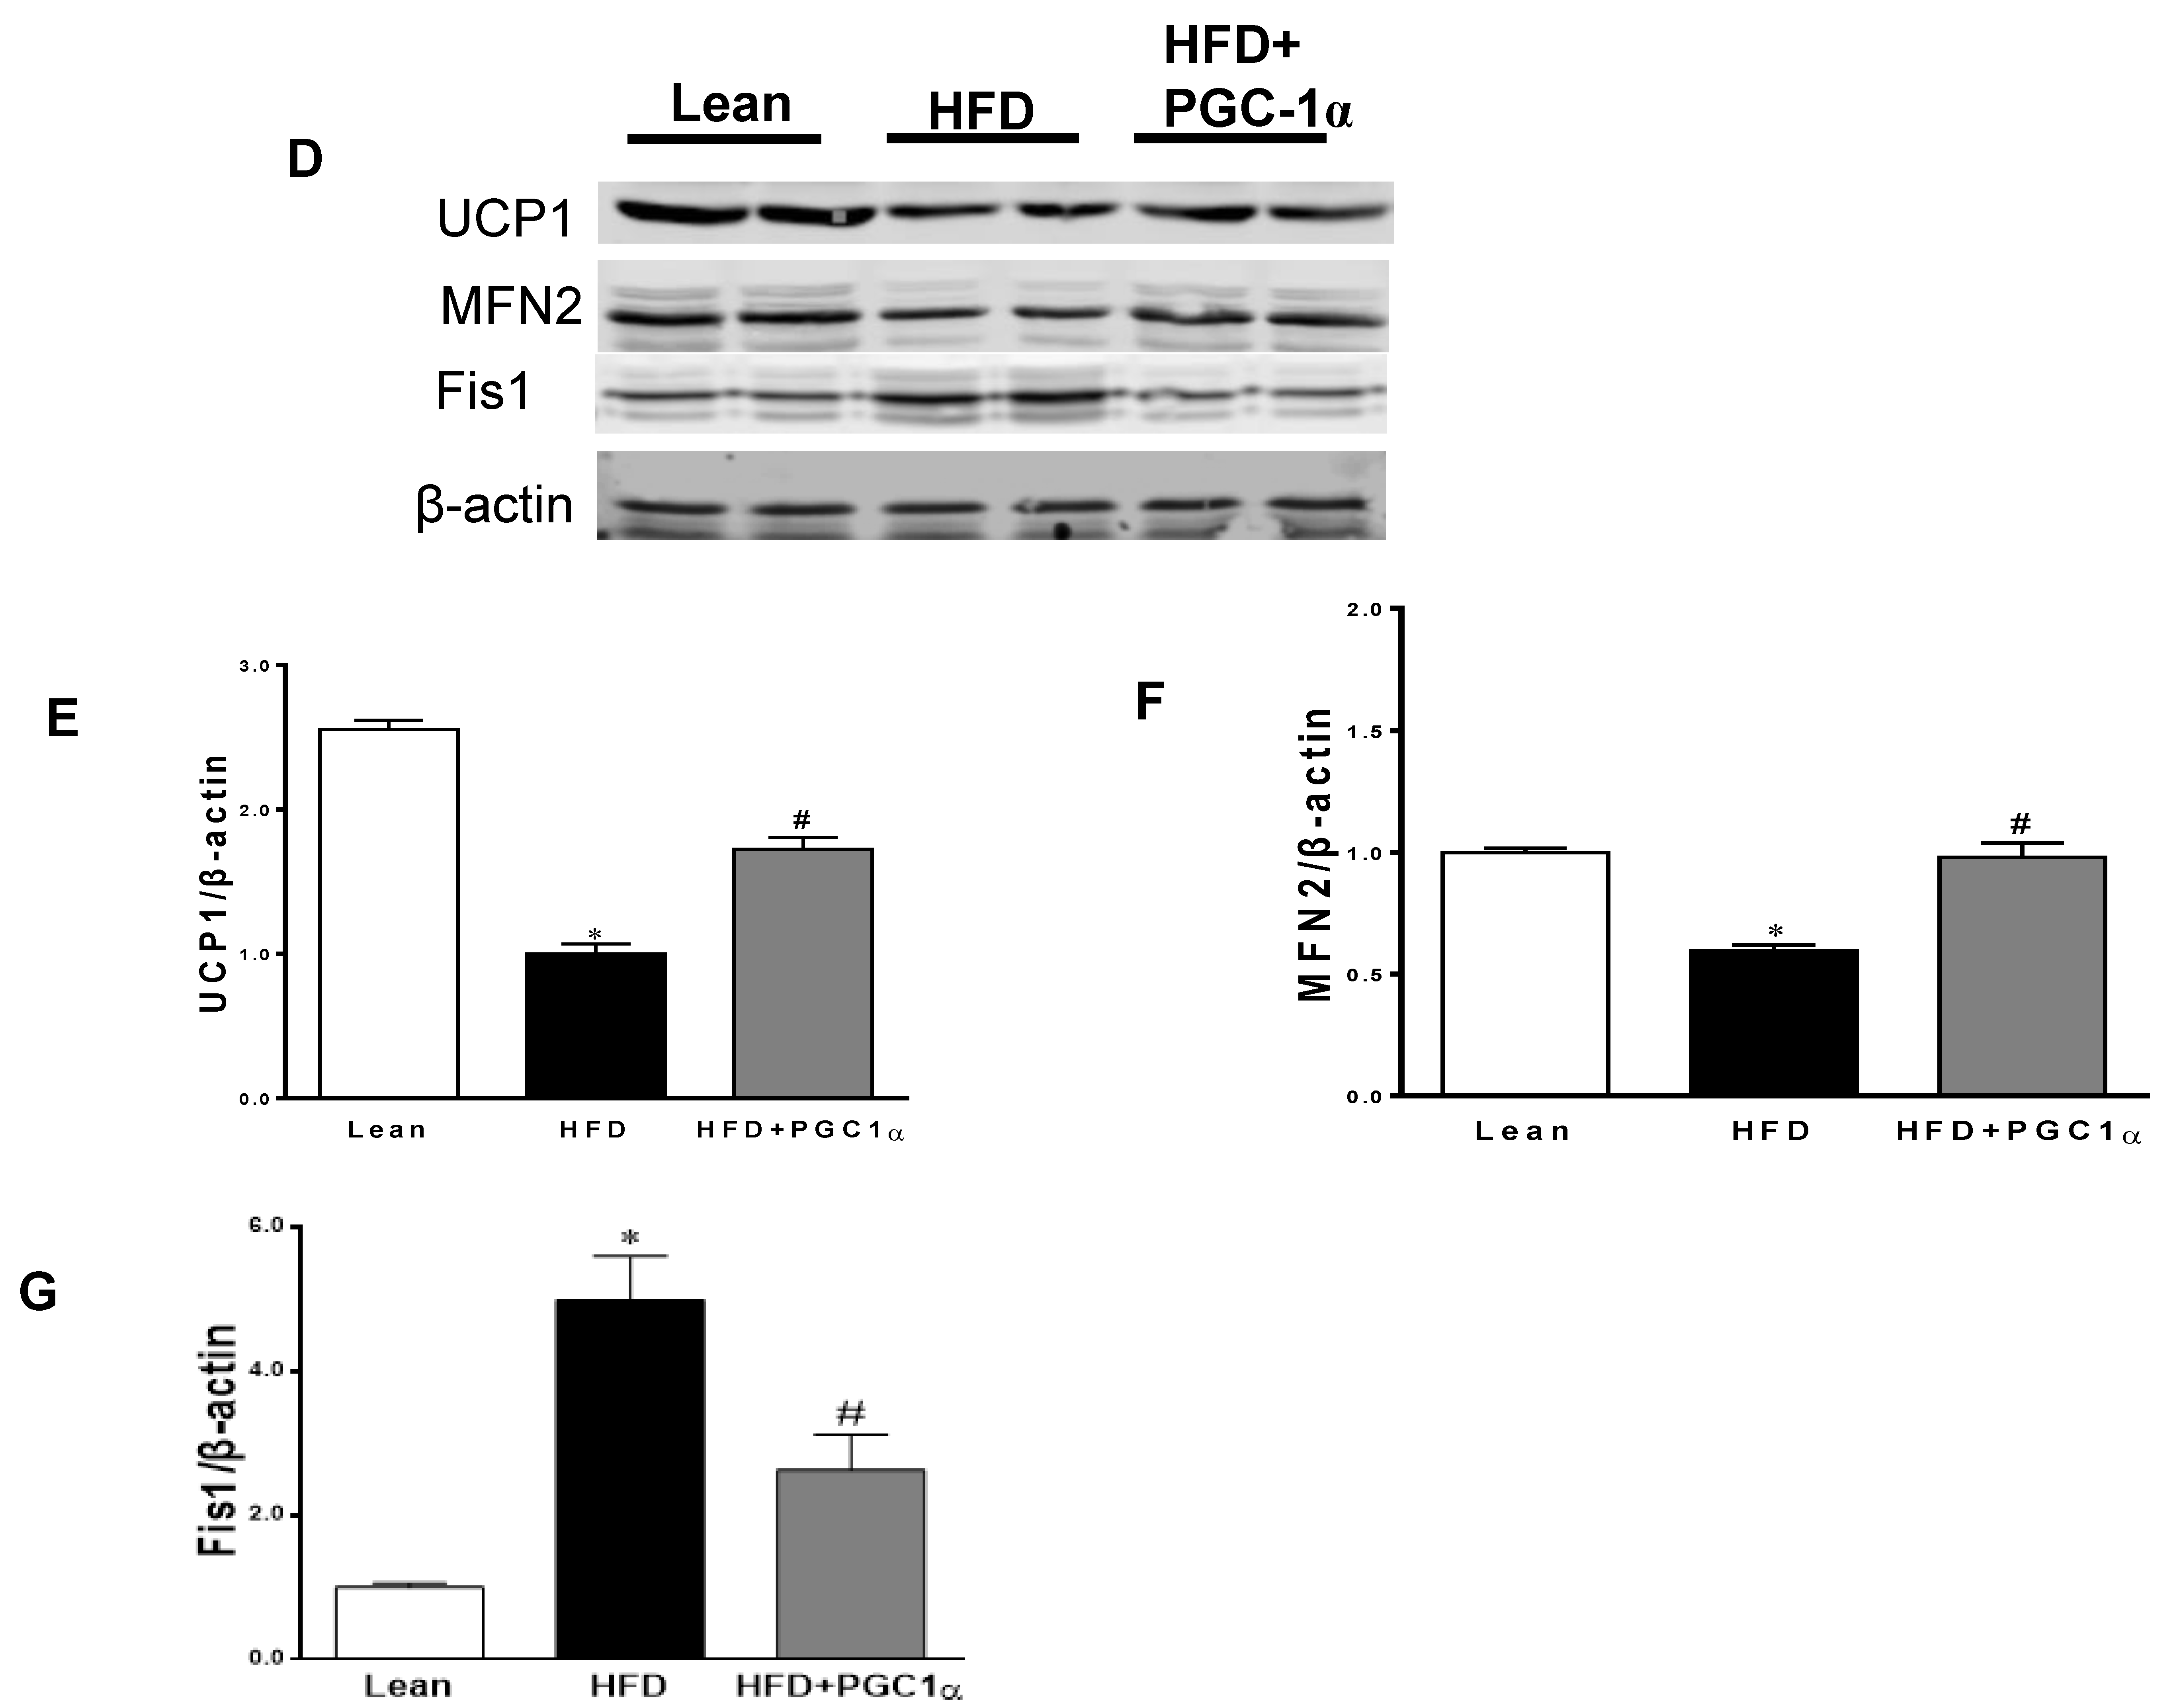
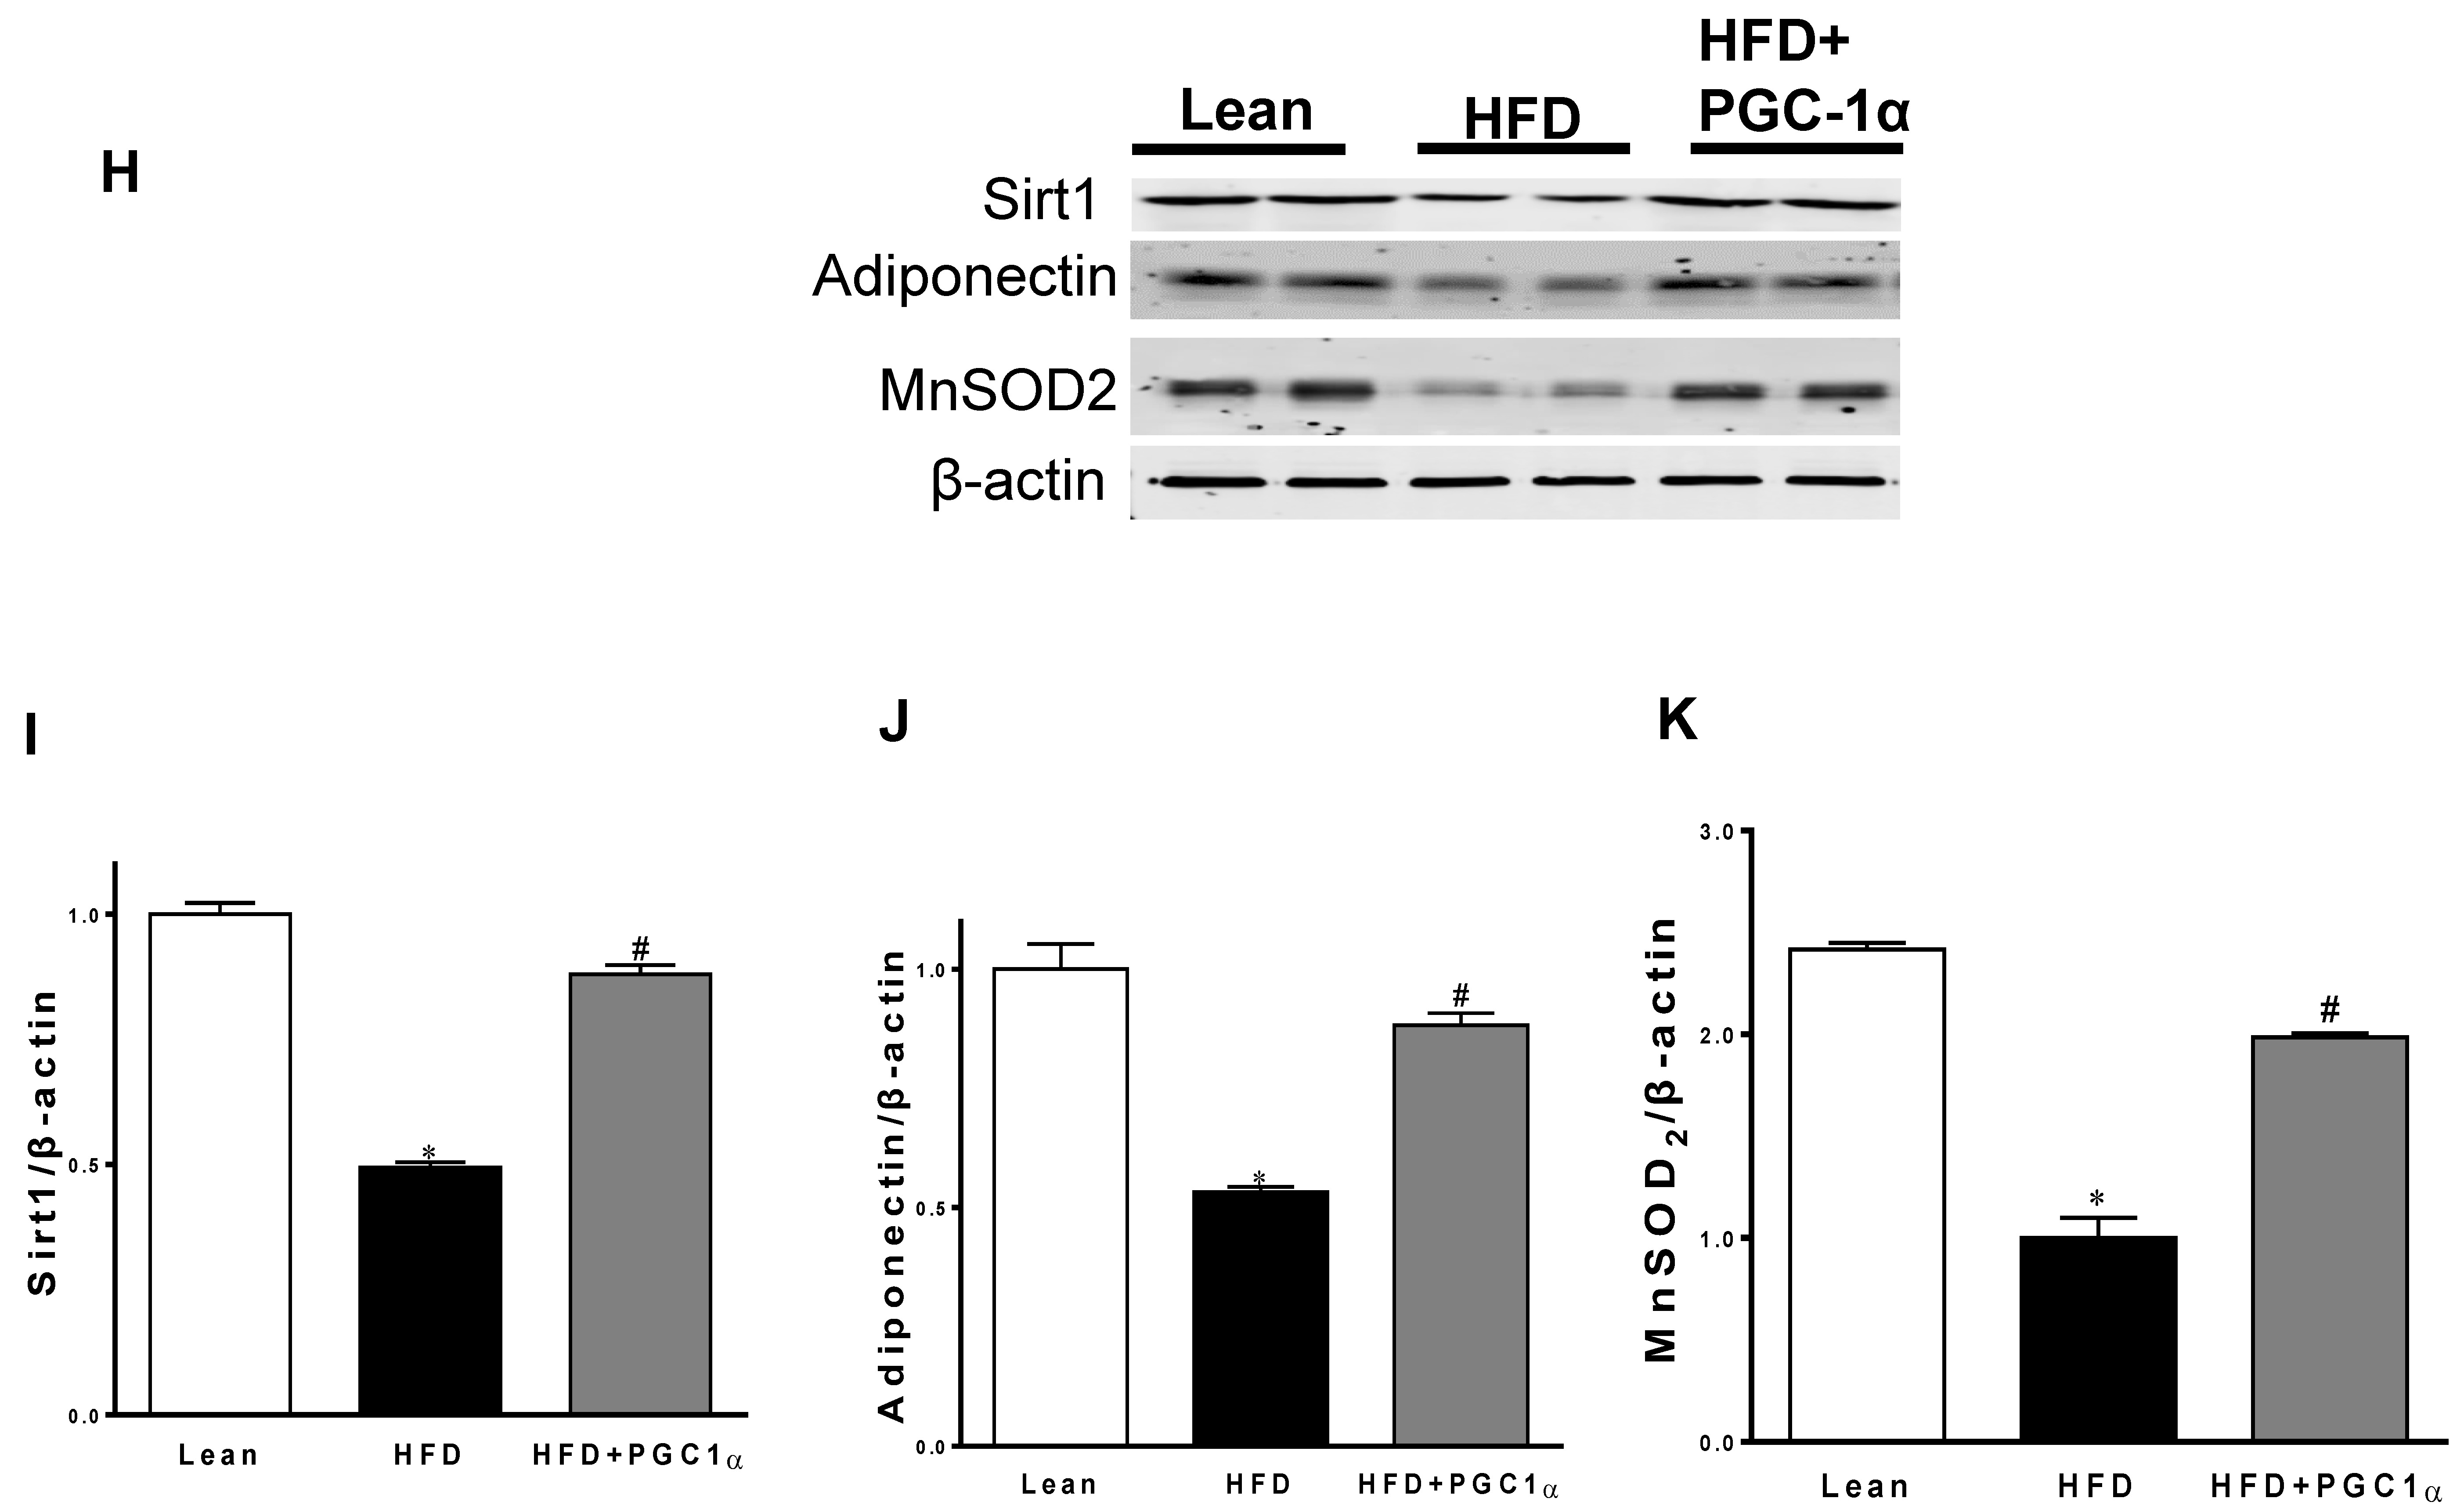
3.6. Expression Levels of Mitochondrial Biogenesis and Fusion Genes, UCP1, and Antioxidant-Associated Proteins in Transgenic-Adipo-PGC-1α Mice
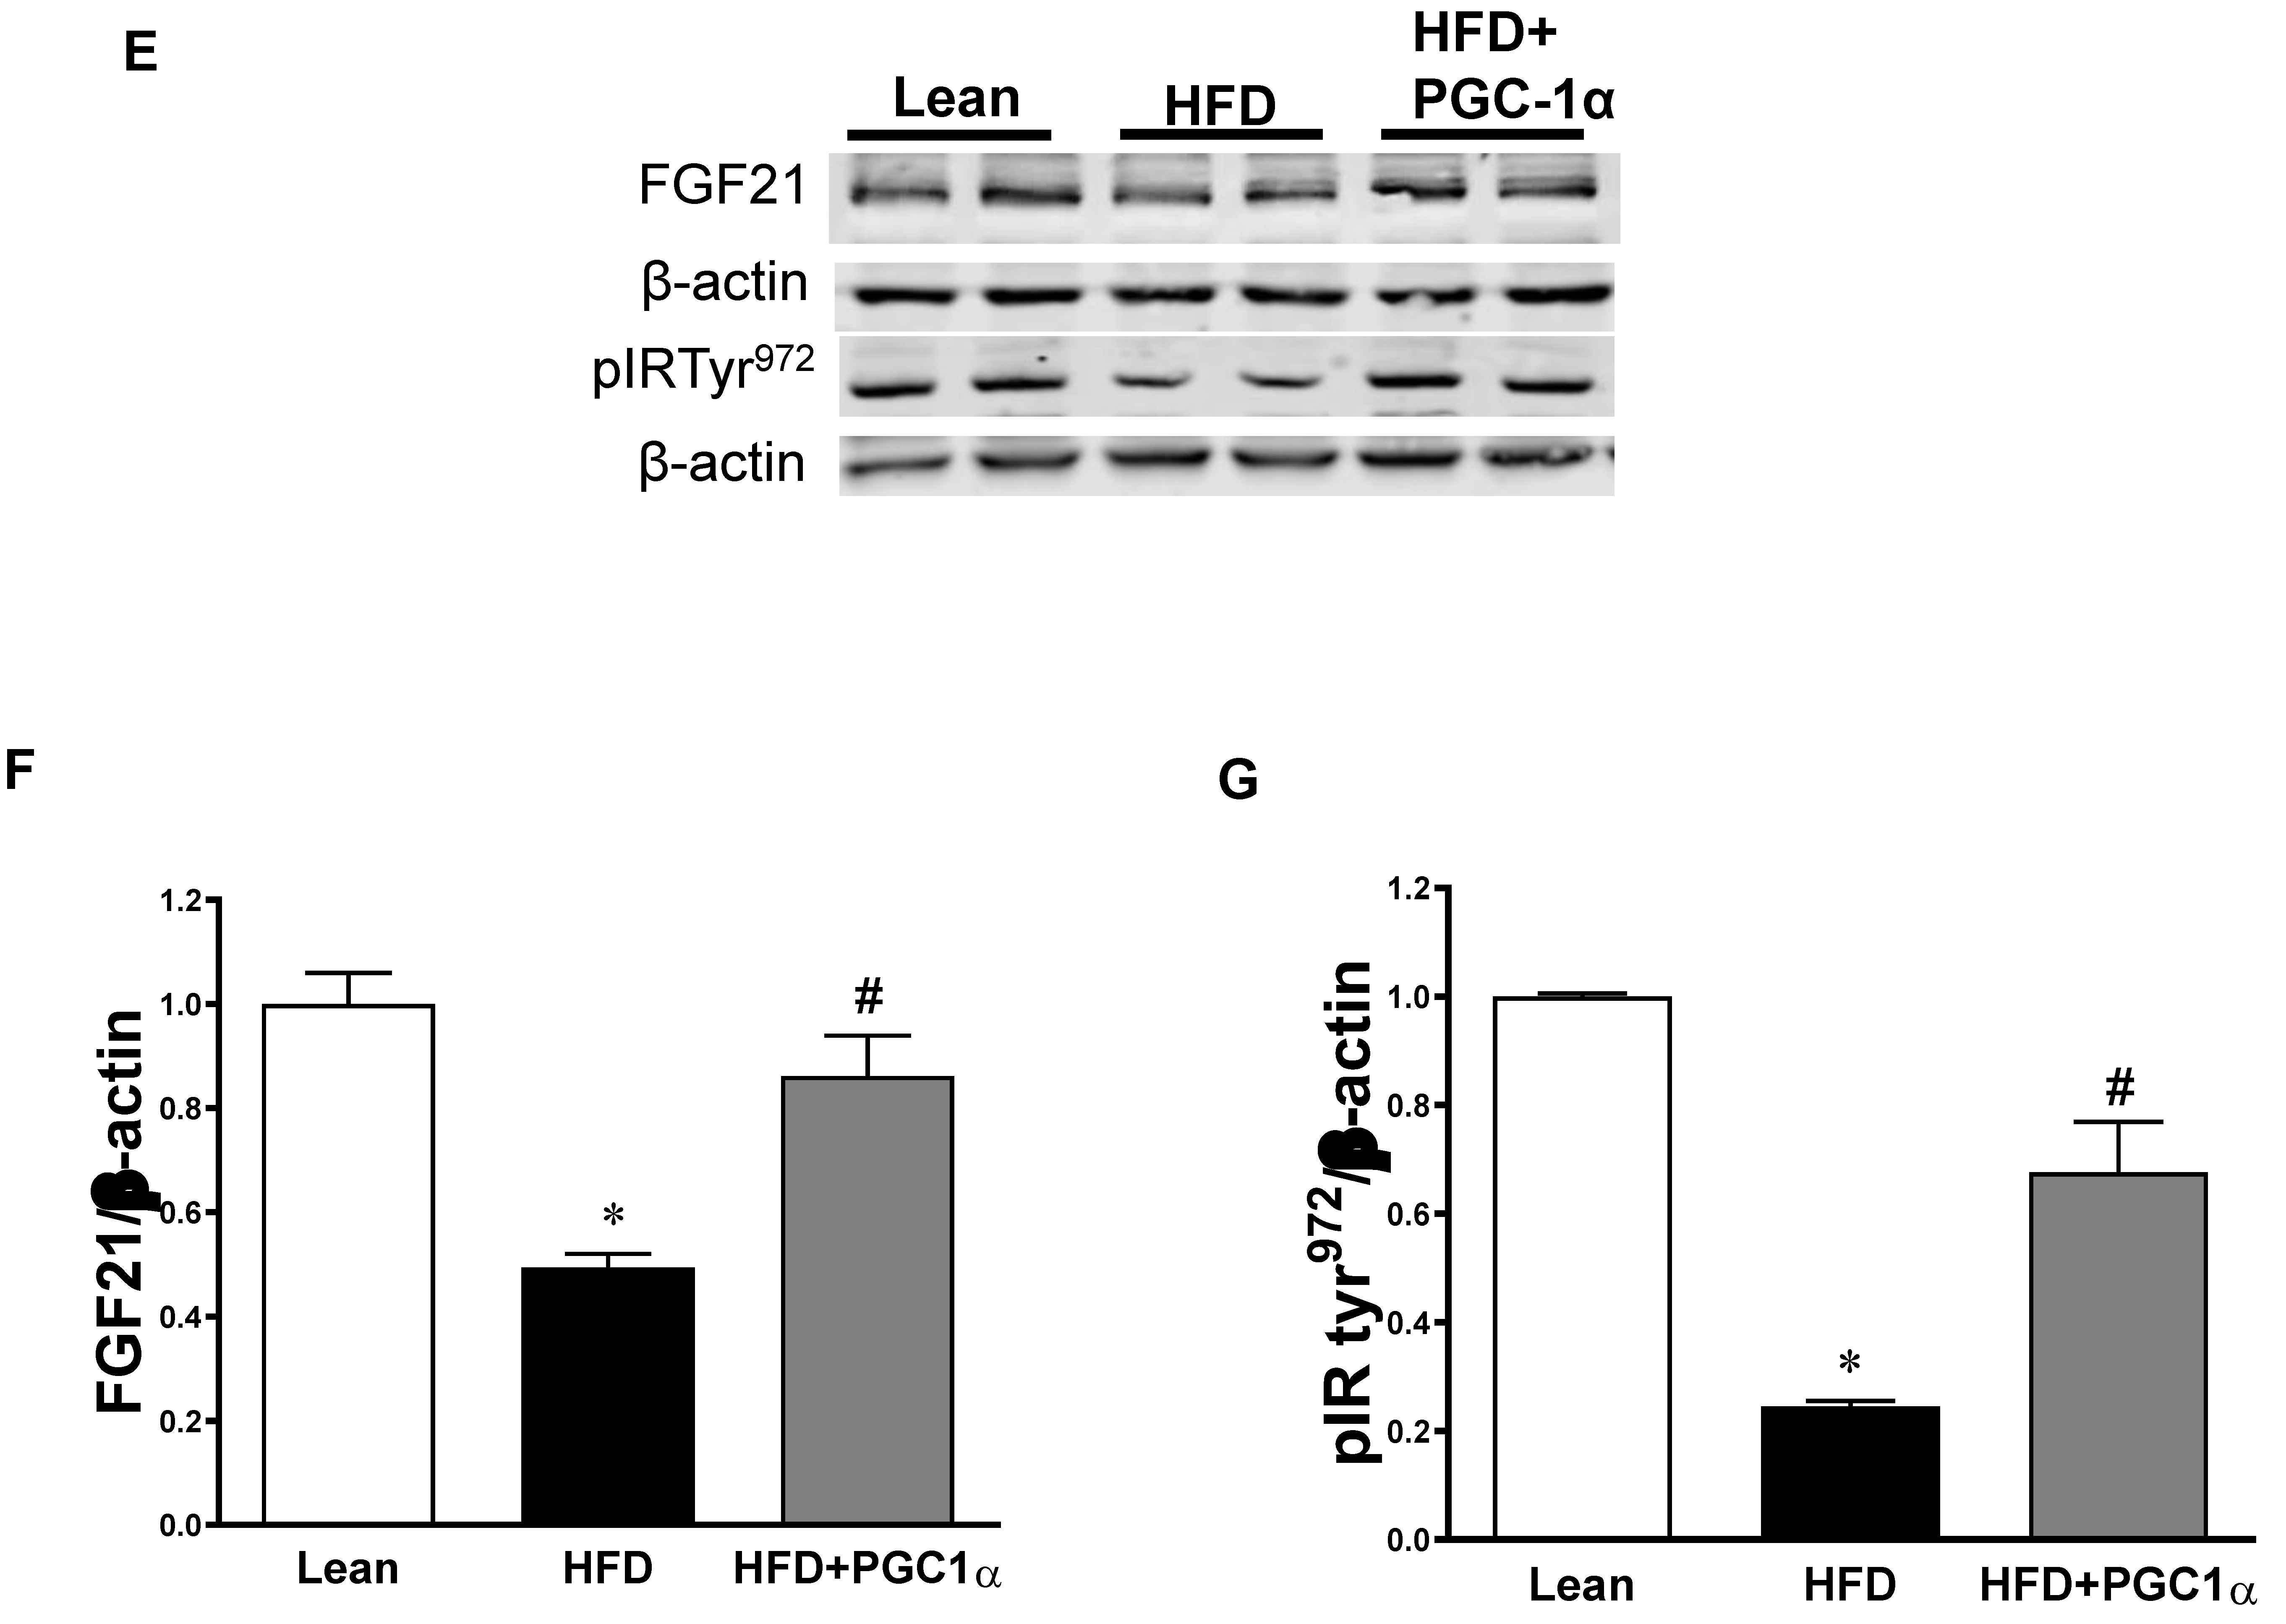
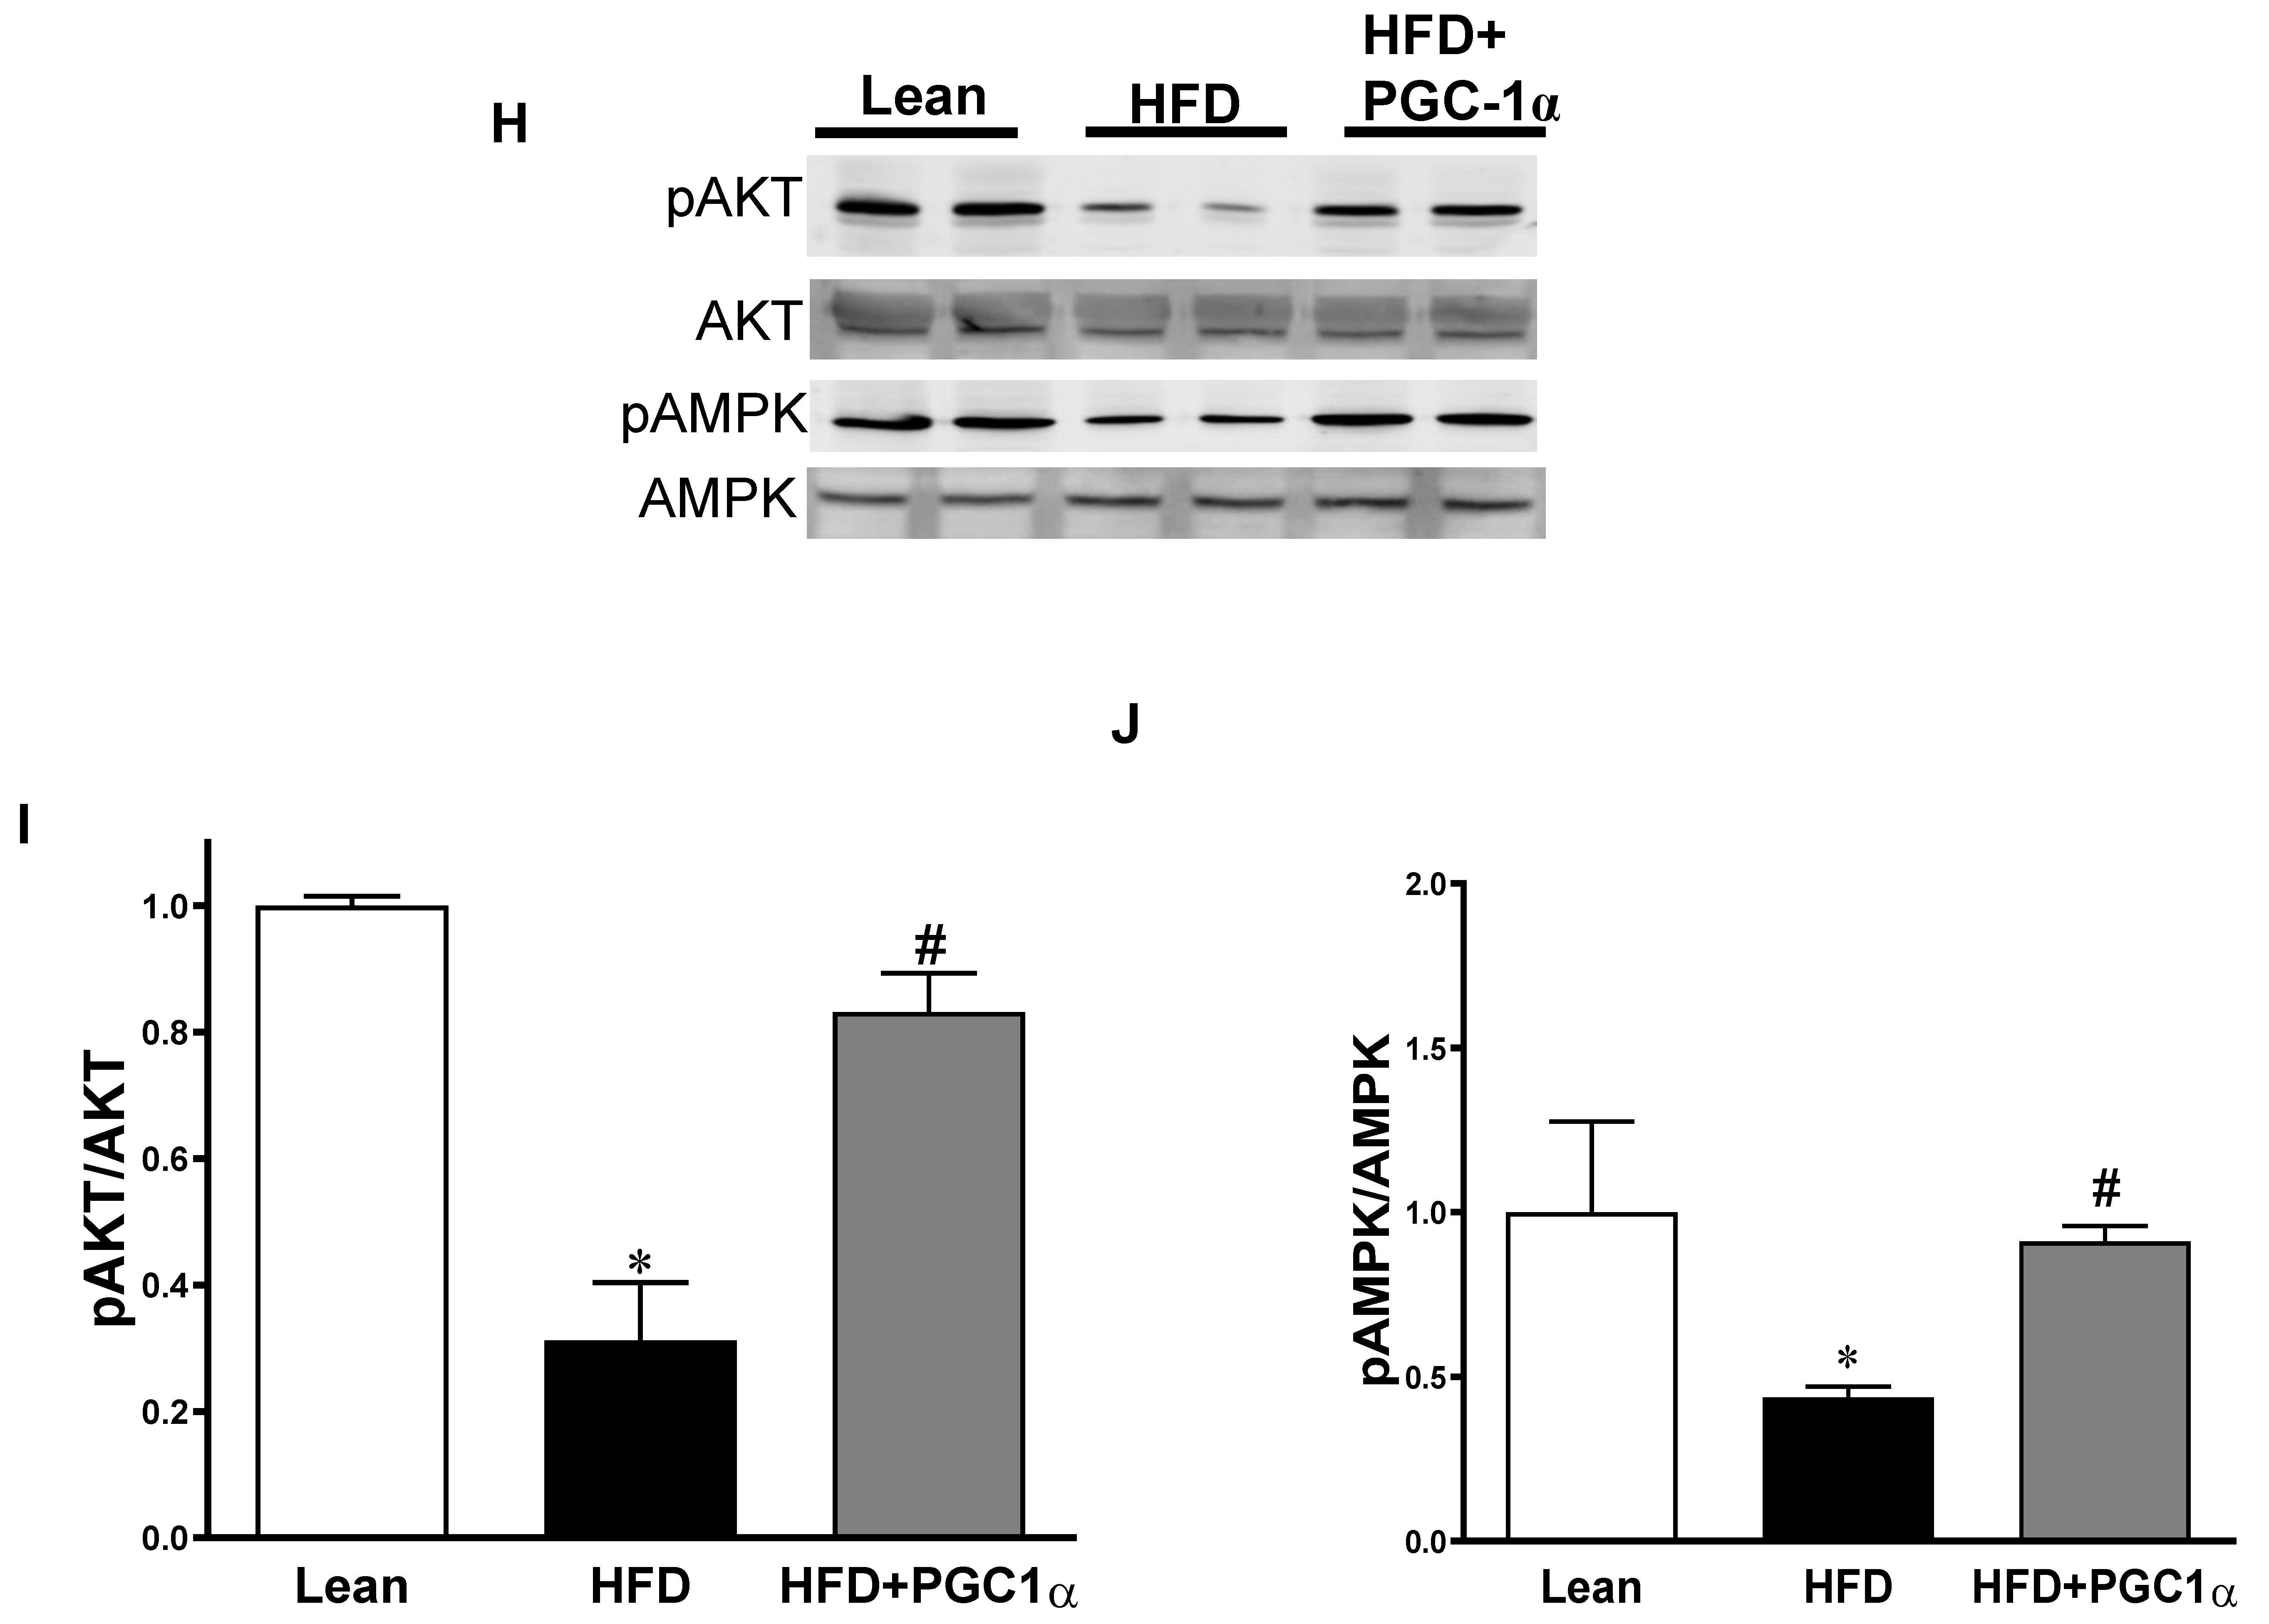
3.7. Expression Levels of Inflammatory Mediators, Insulin Signaling Components, and AMPK in the Adipose Tissue of Transgenic-Adipo-PGC-1α Mice
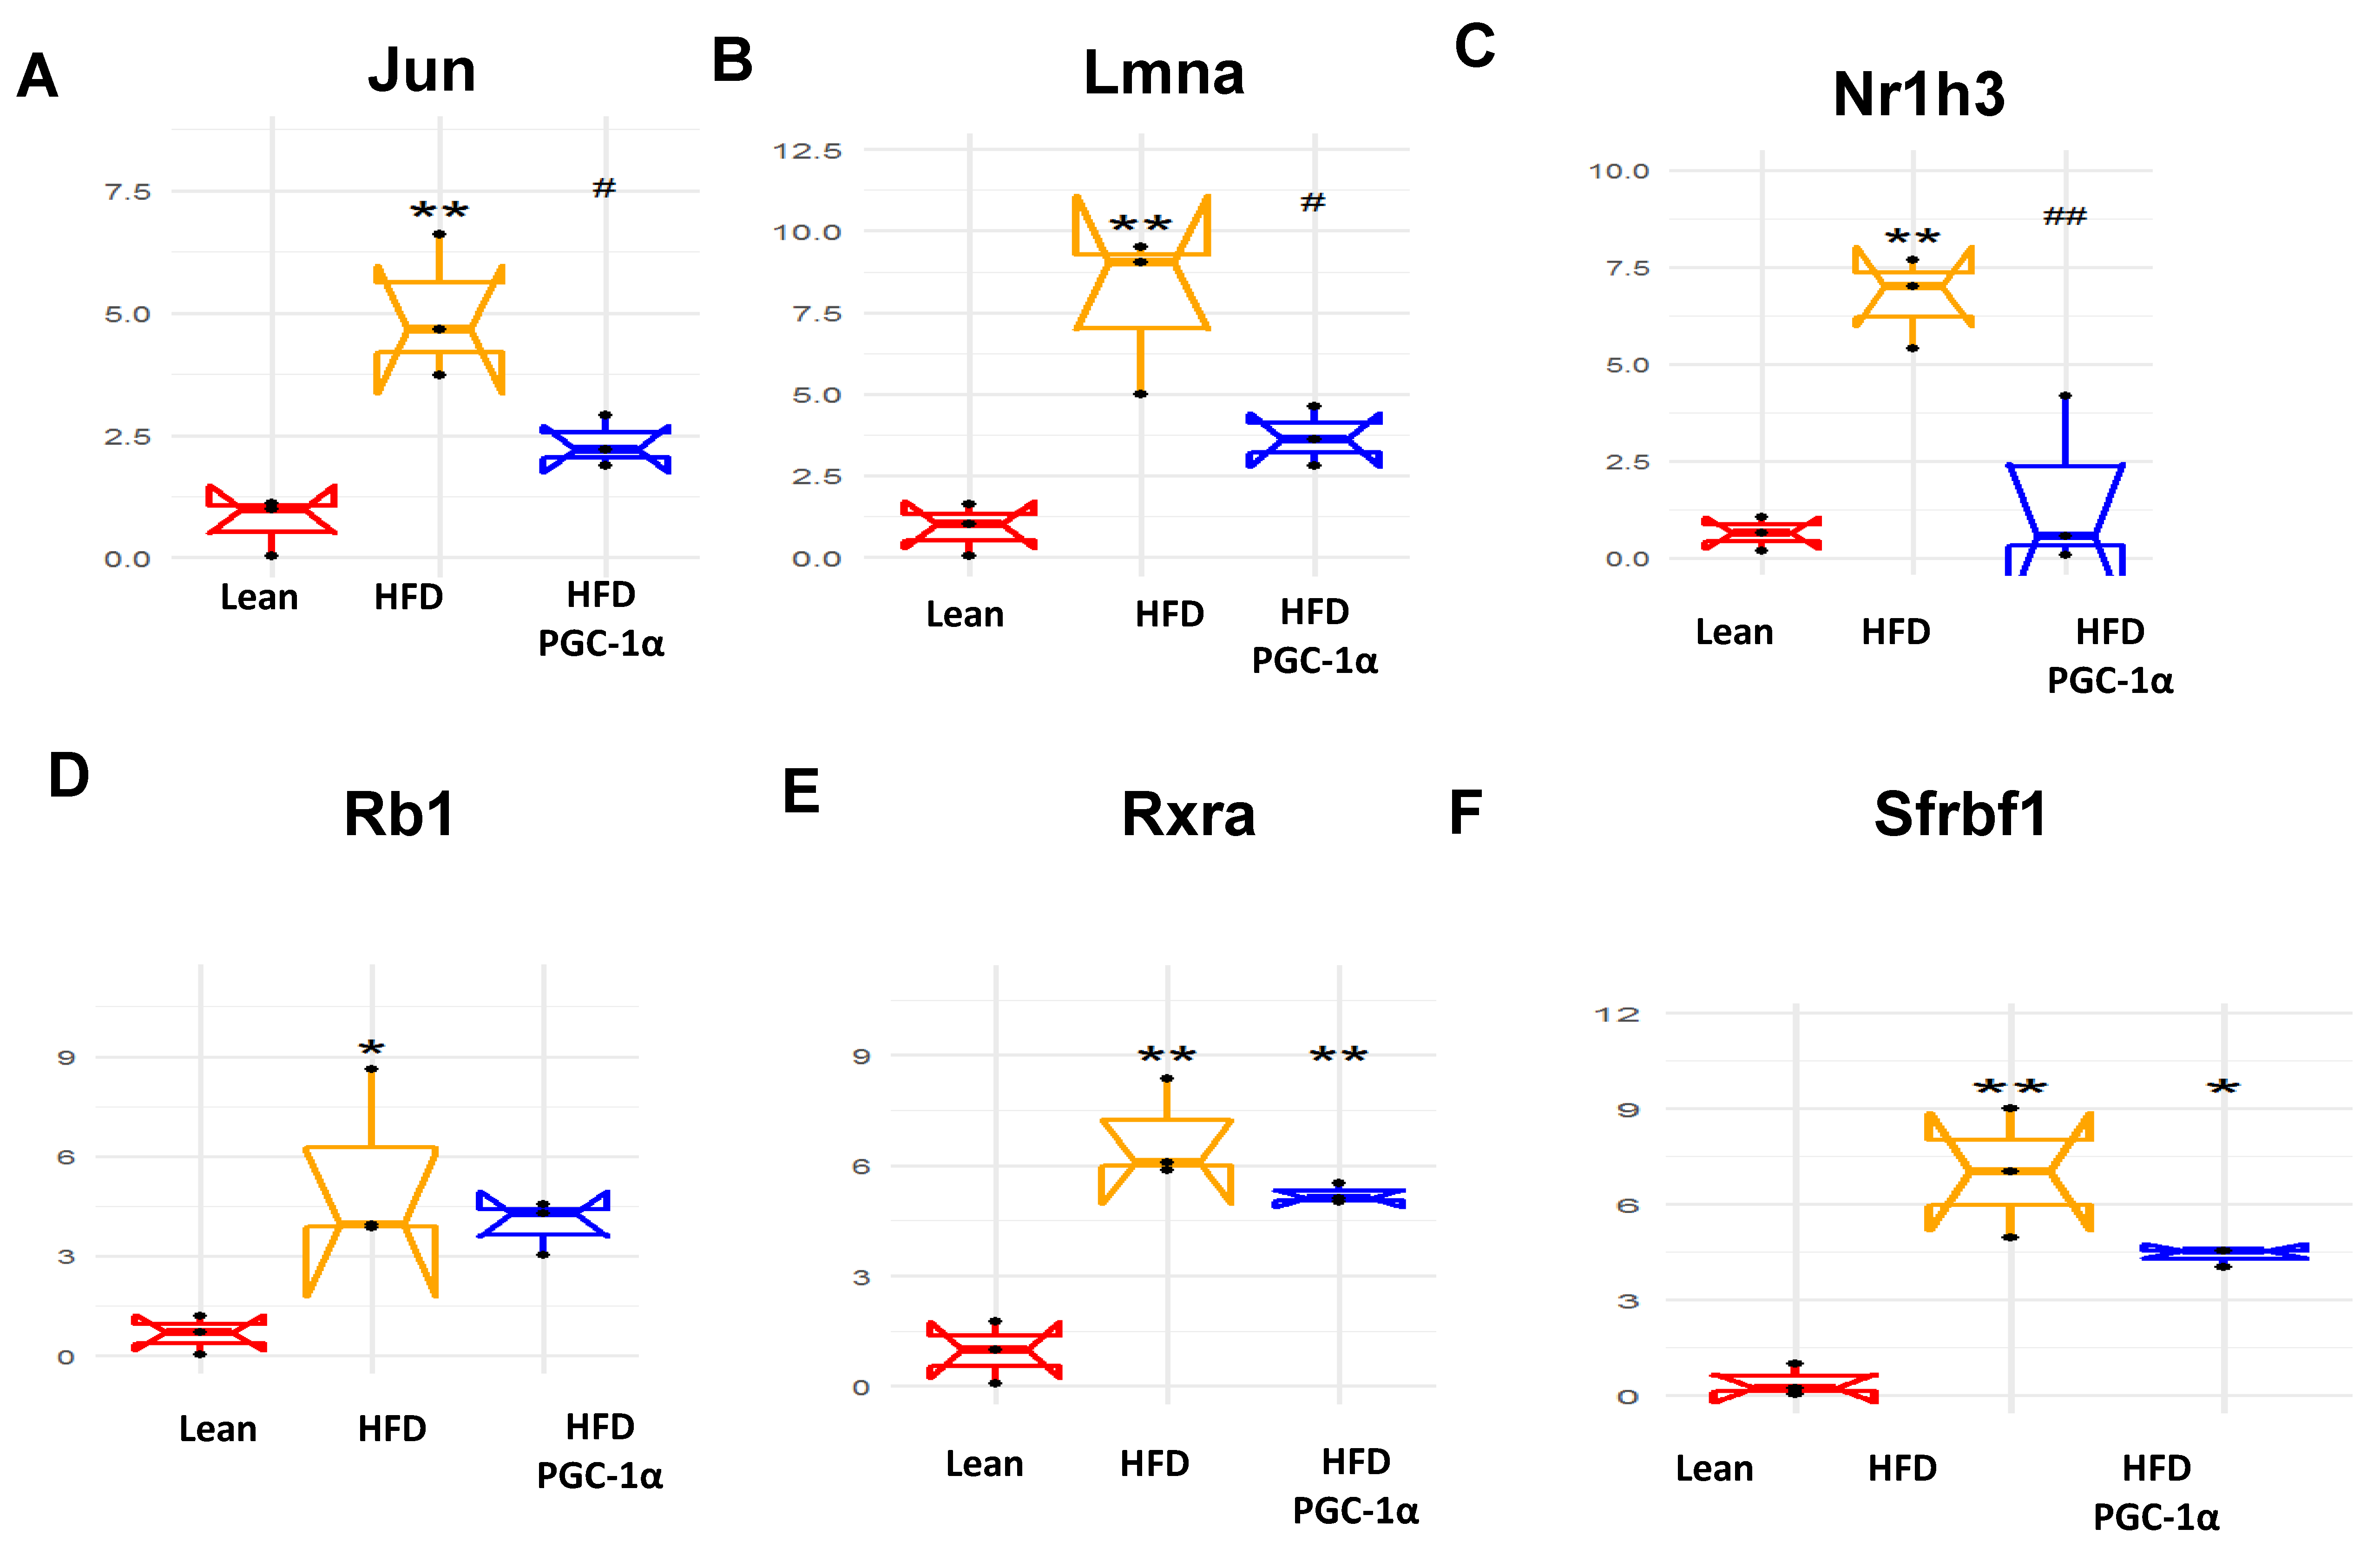
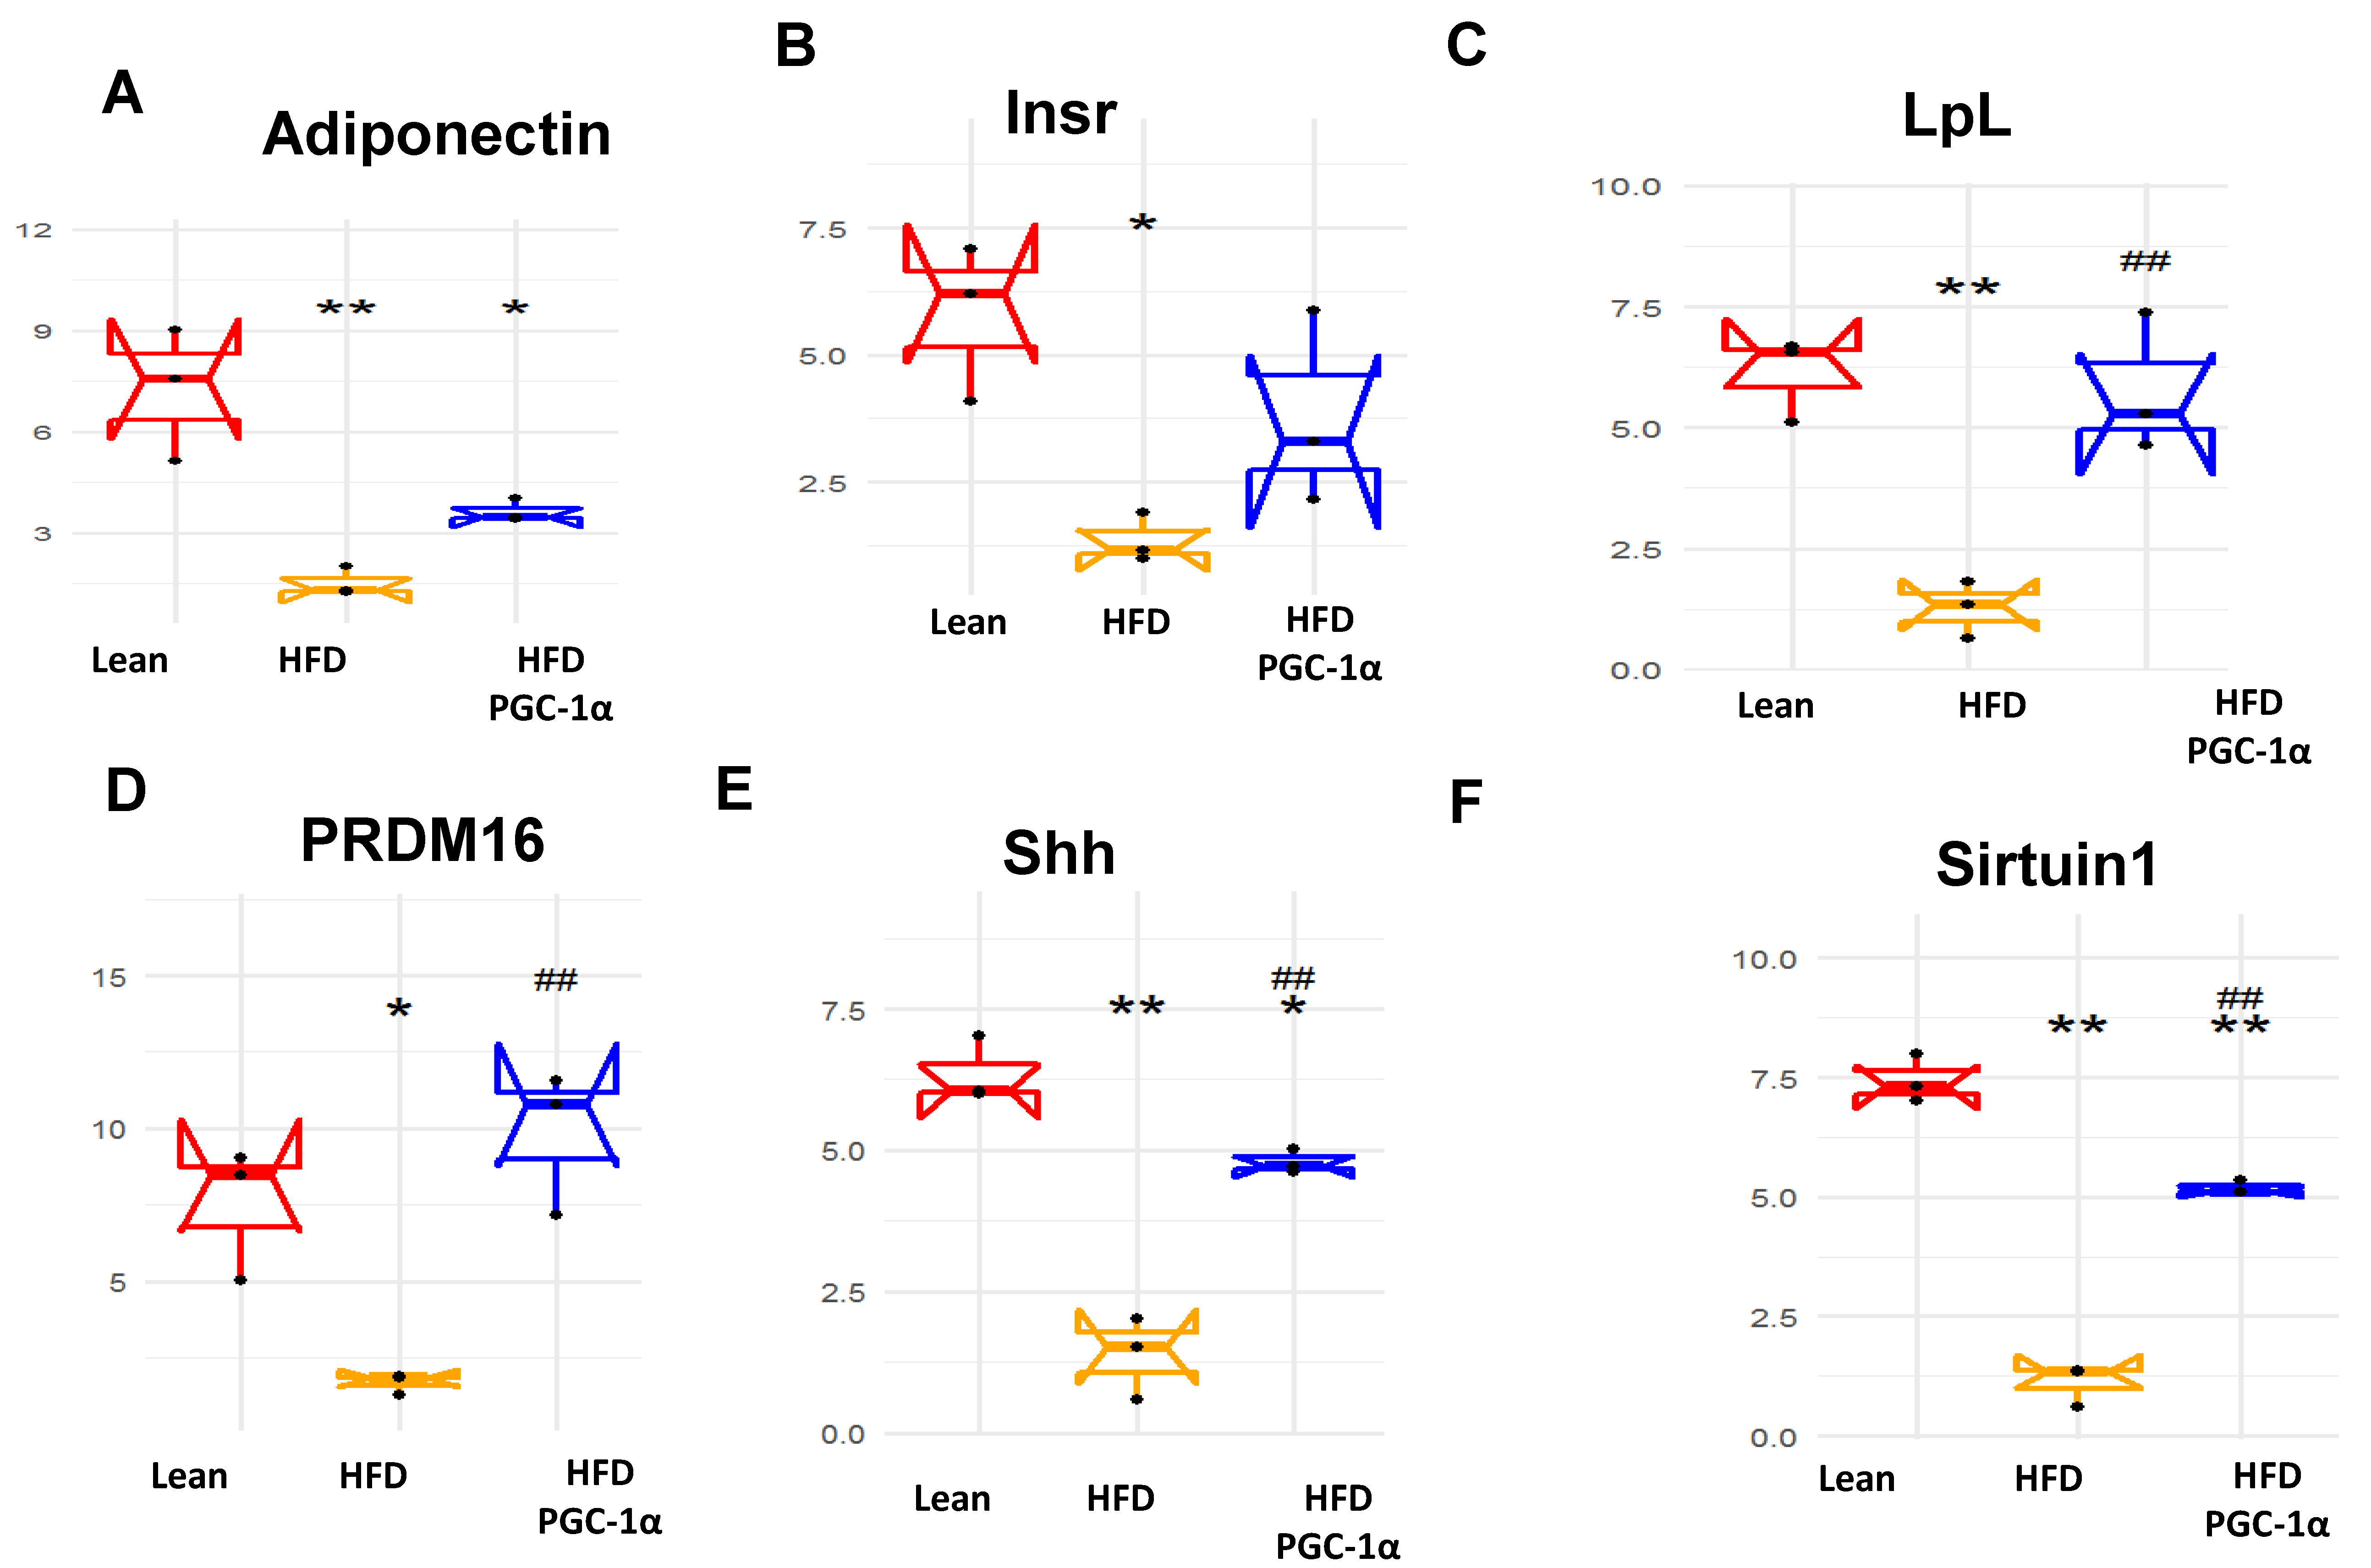
3.8. Identification of Changes in the Correlation Coefficients of Gene Expression by RNA Array Analyses
3.9. Upregulated Genes in the Adipose Tissues of Transgenic-Adipo-PGC1 Mice
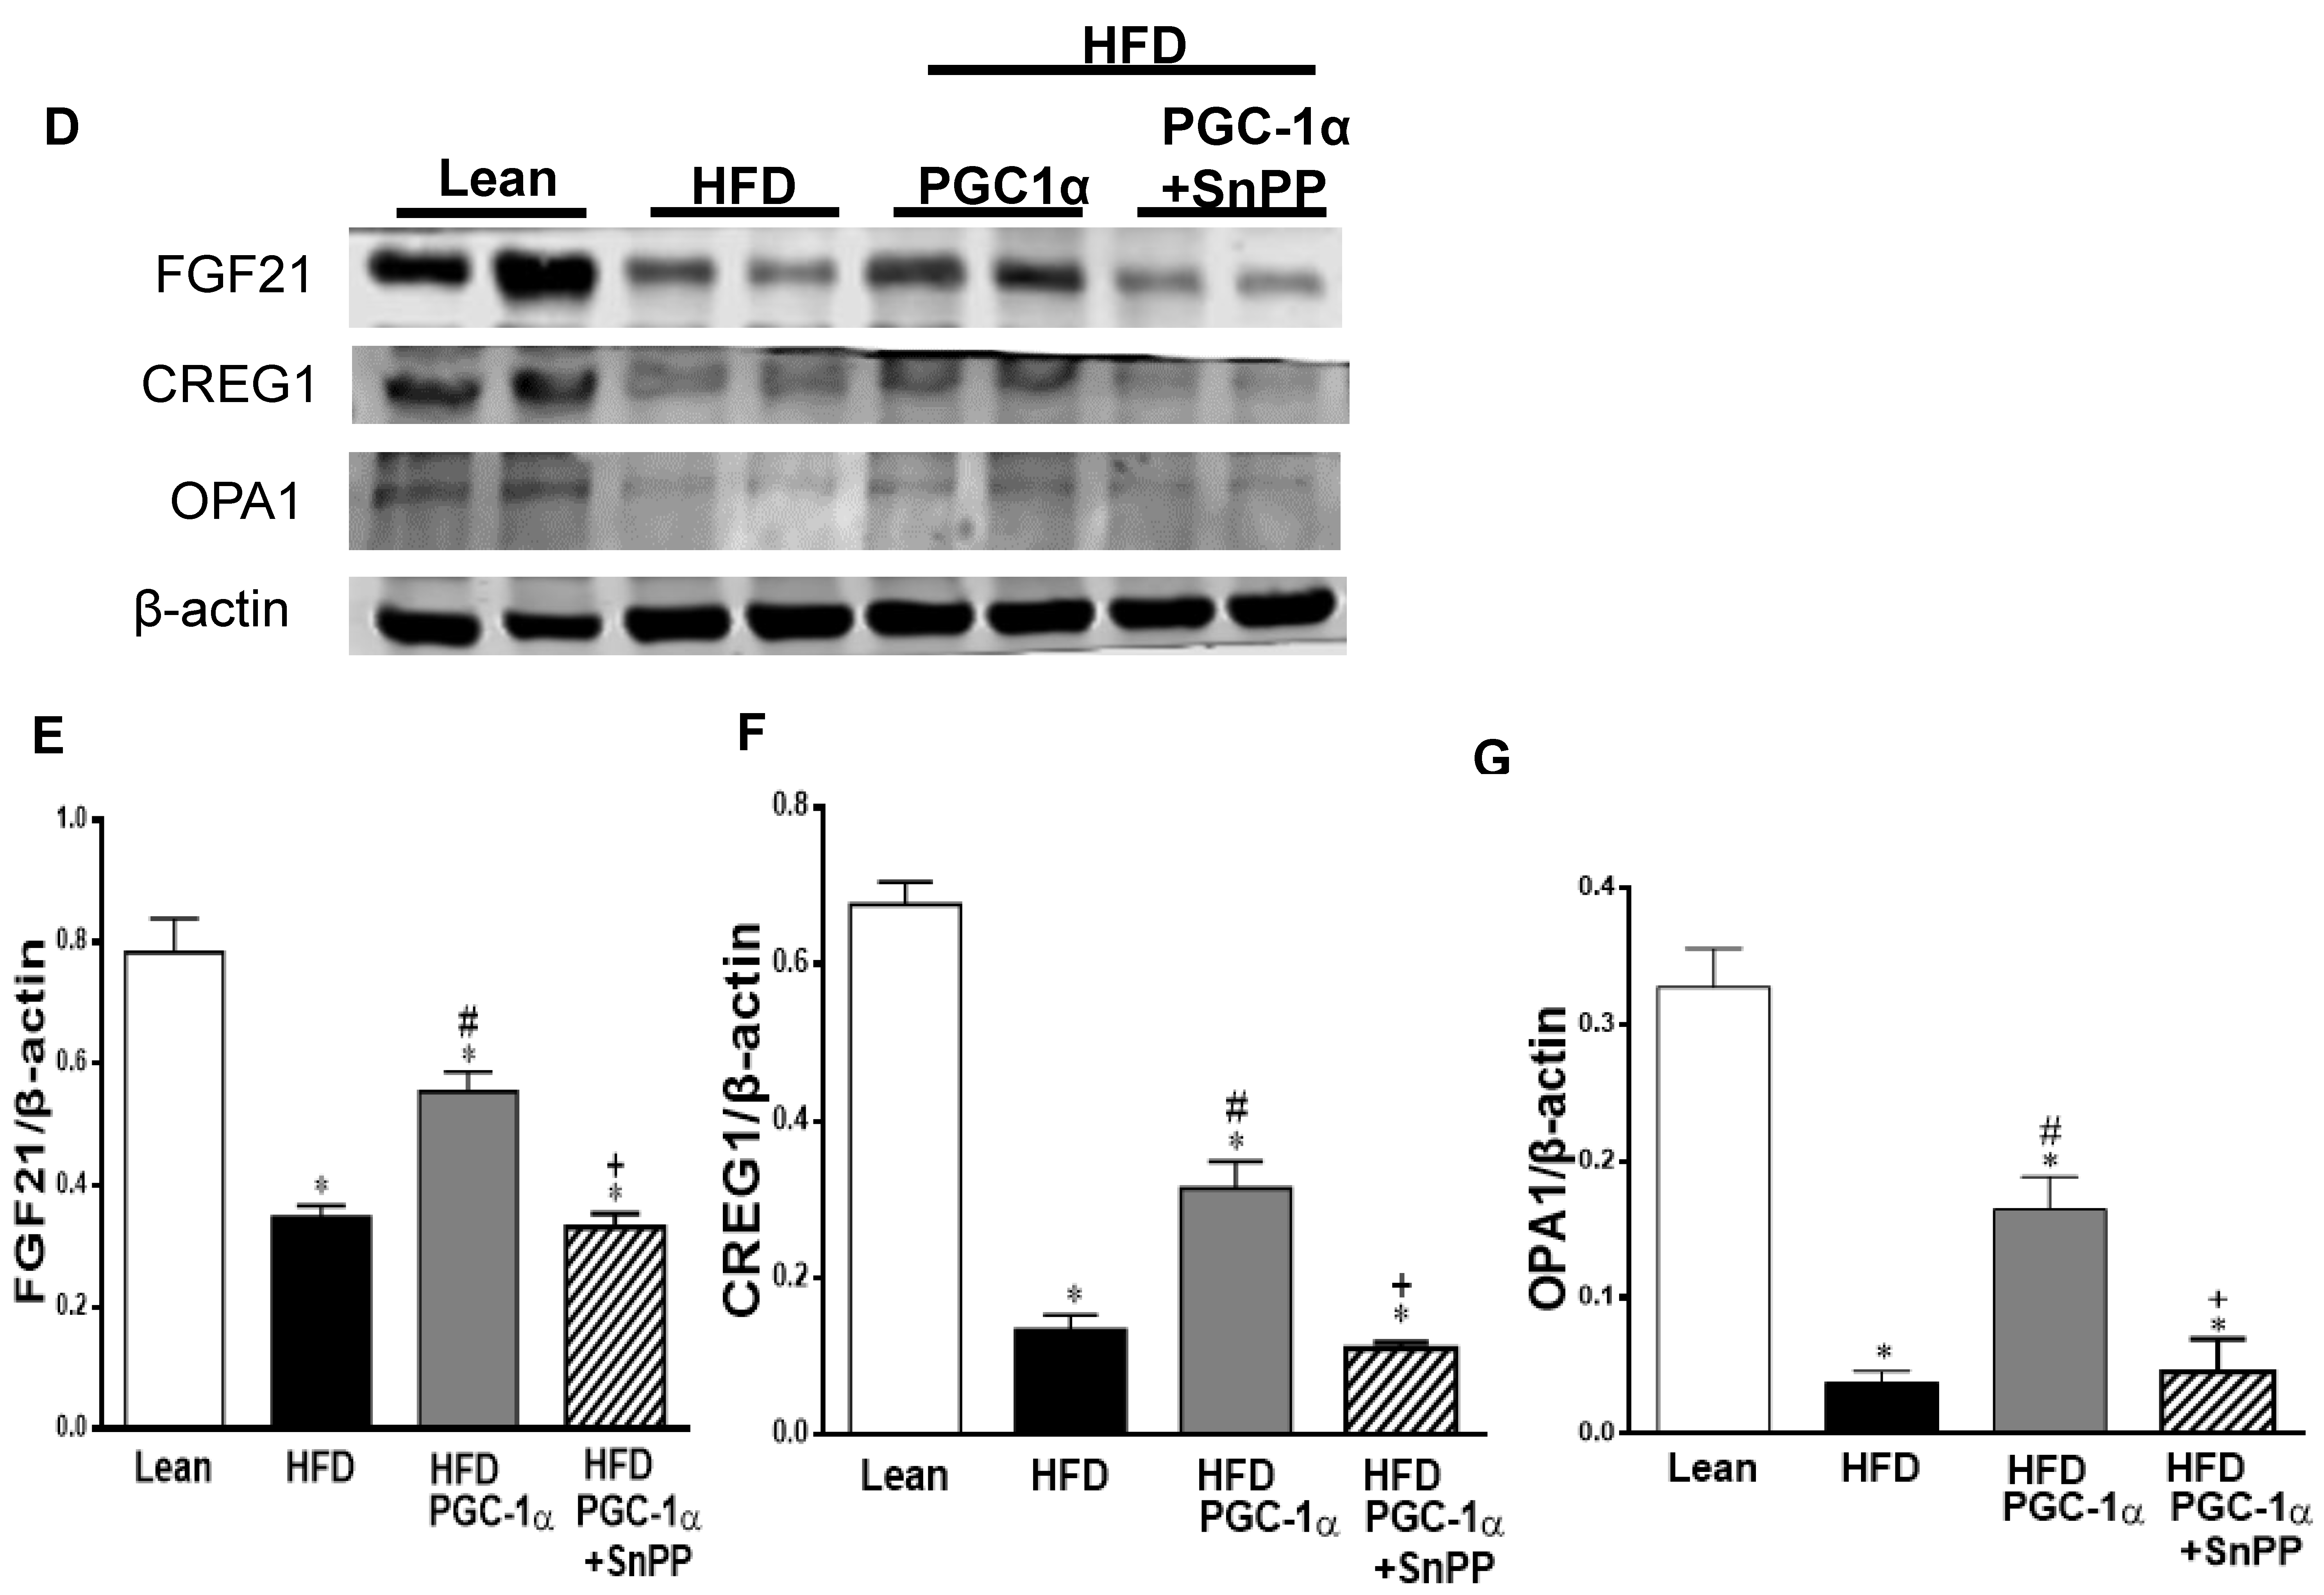
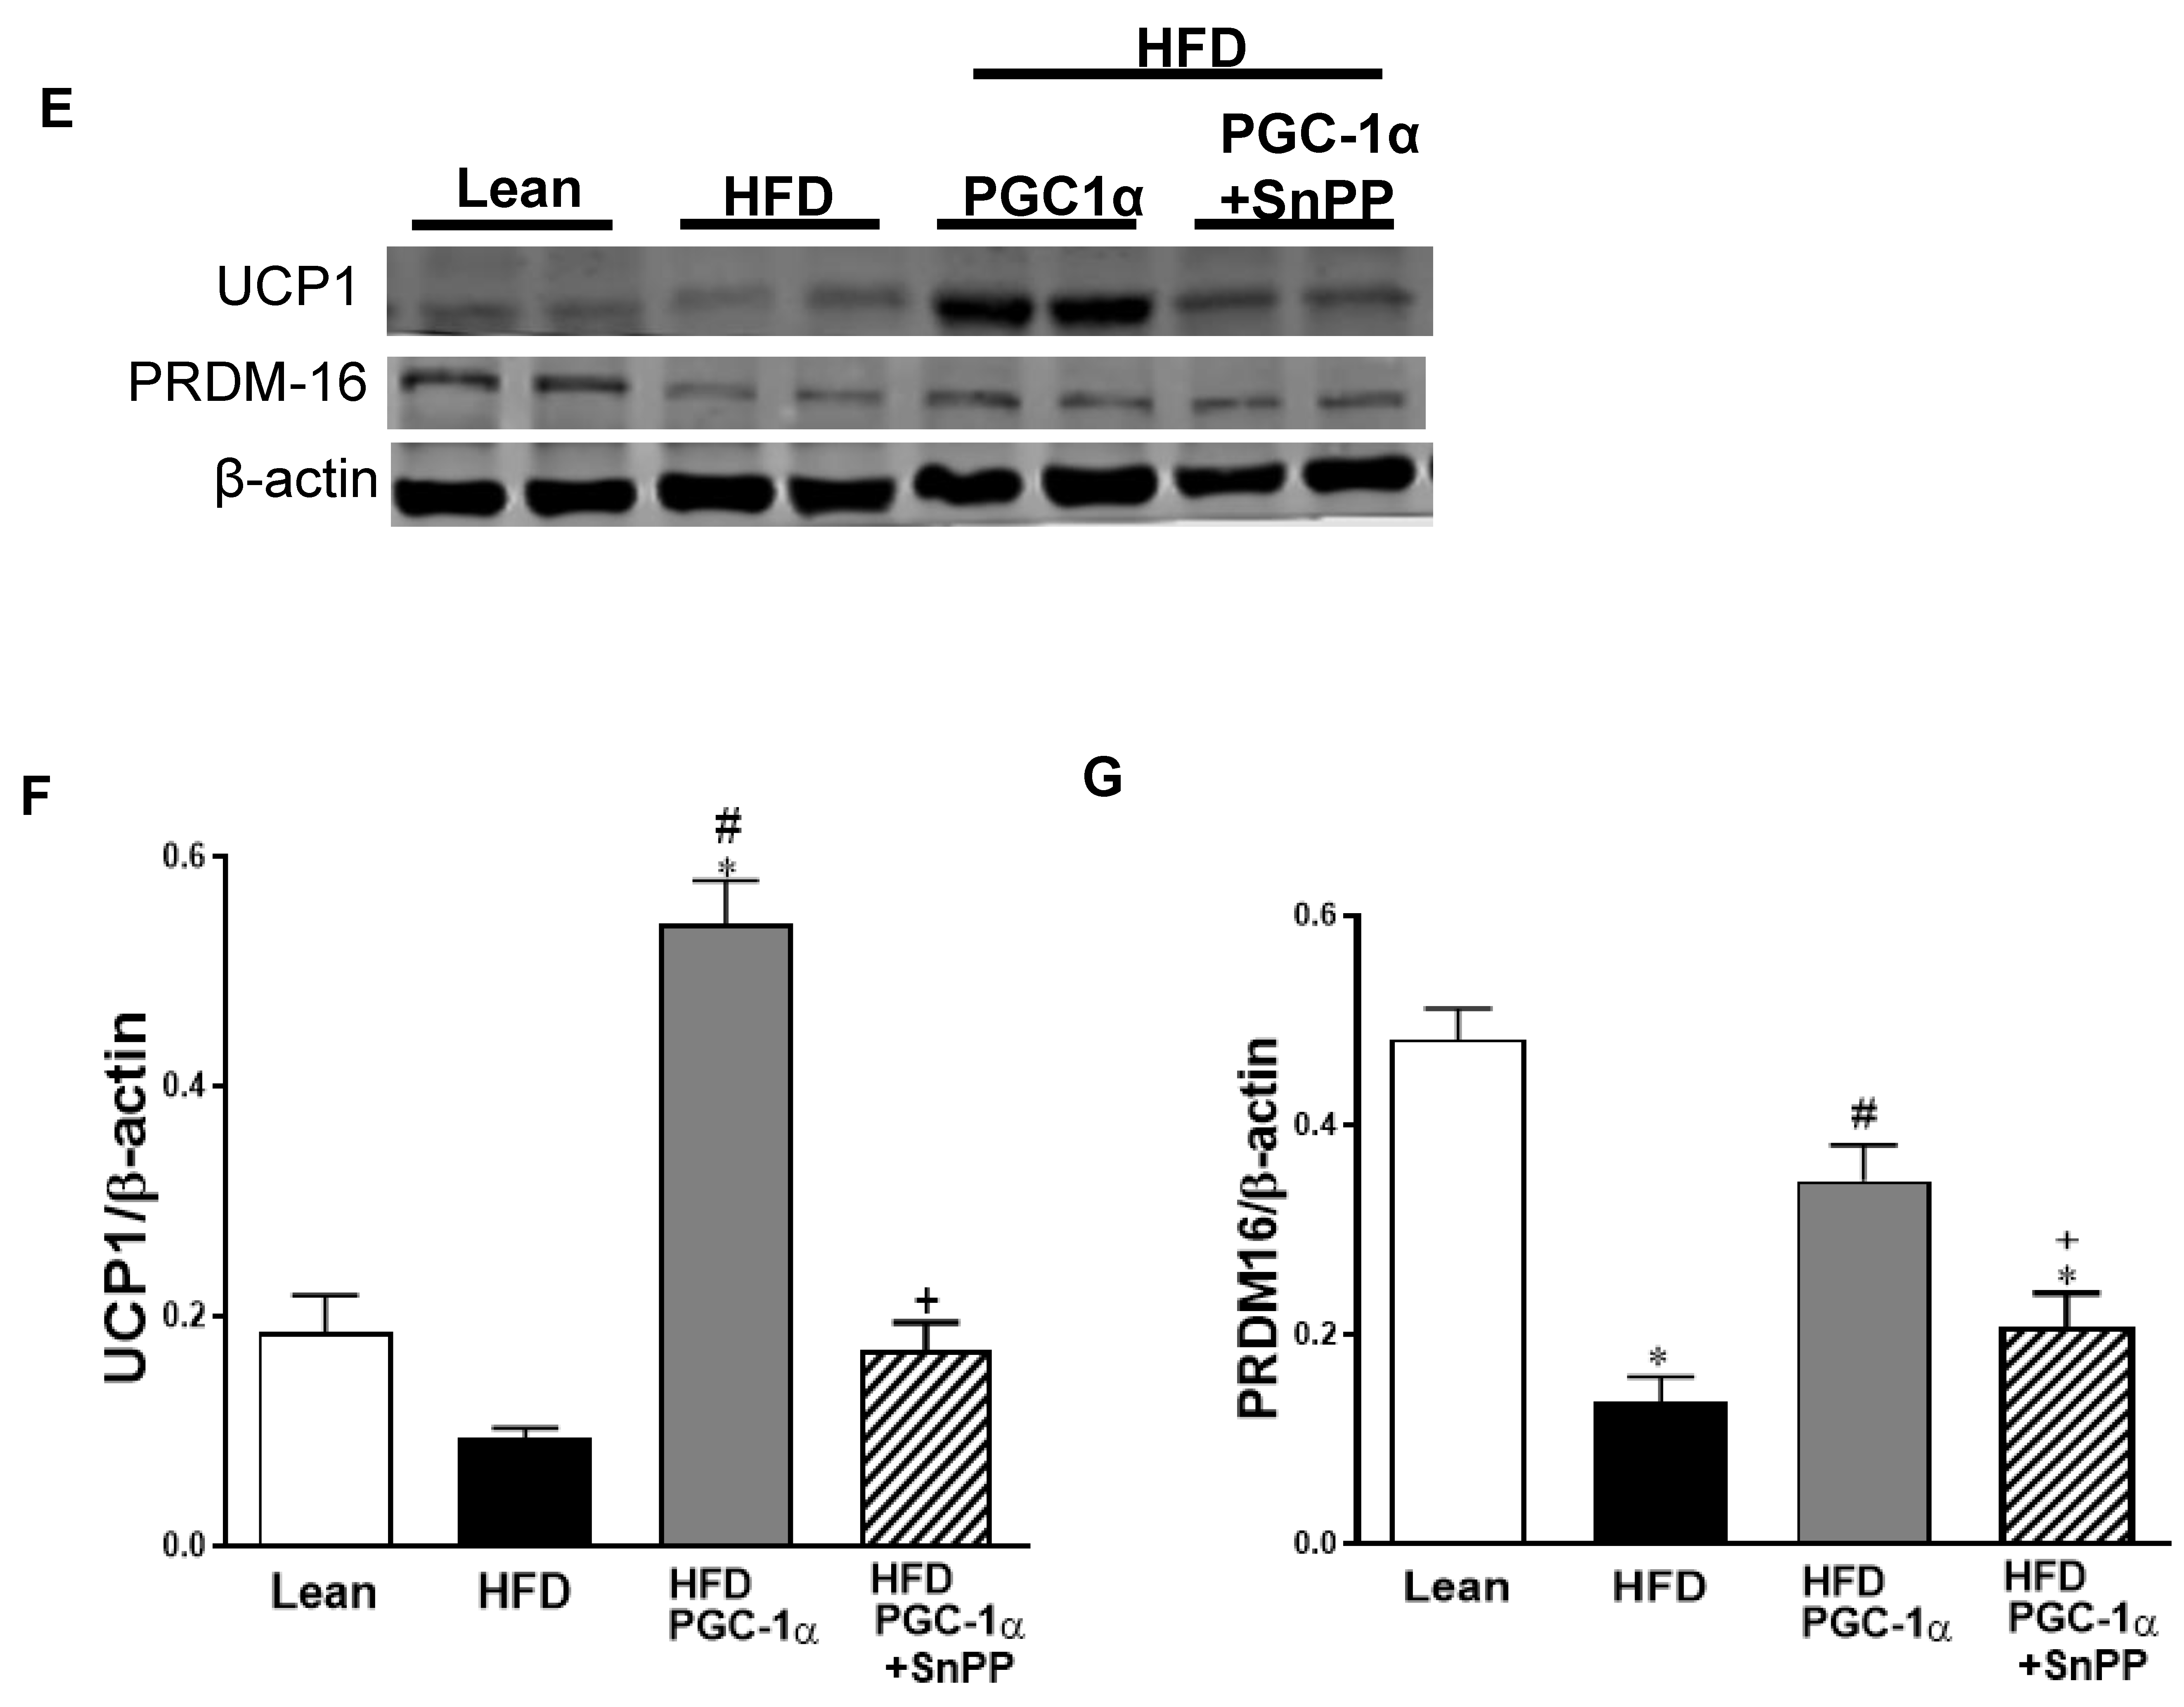
3.10. Effect of HO-1 Inhibition on the Phosphorylation of Insulin Receptor and Markers of Brown-like Fat in Transgenic-Adipo-PGC-1α Mice
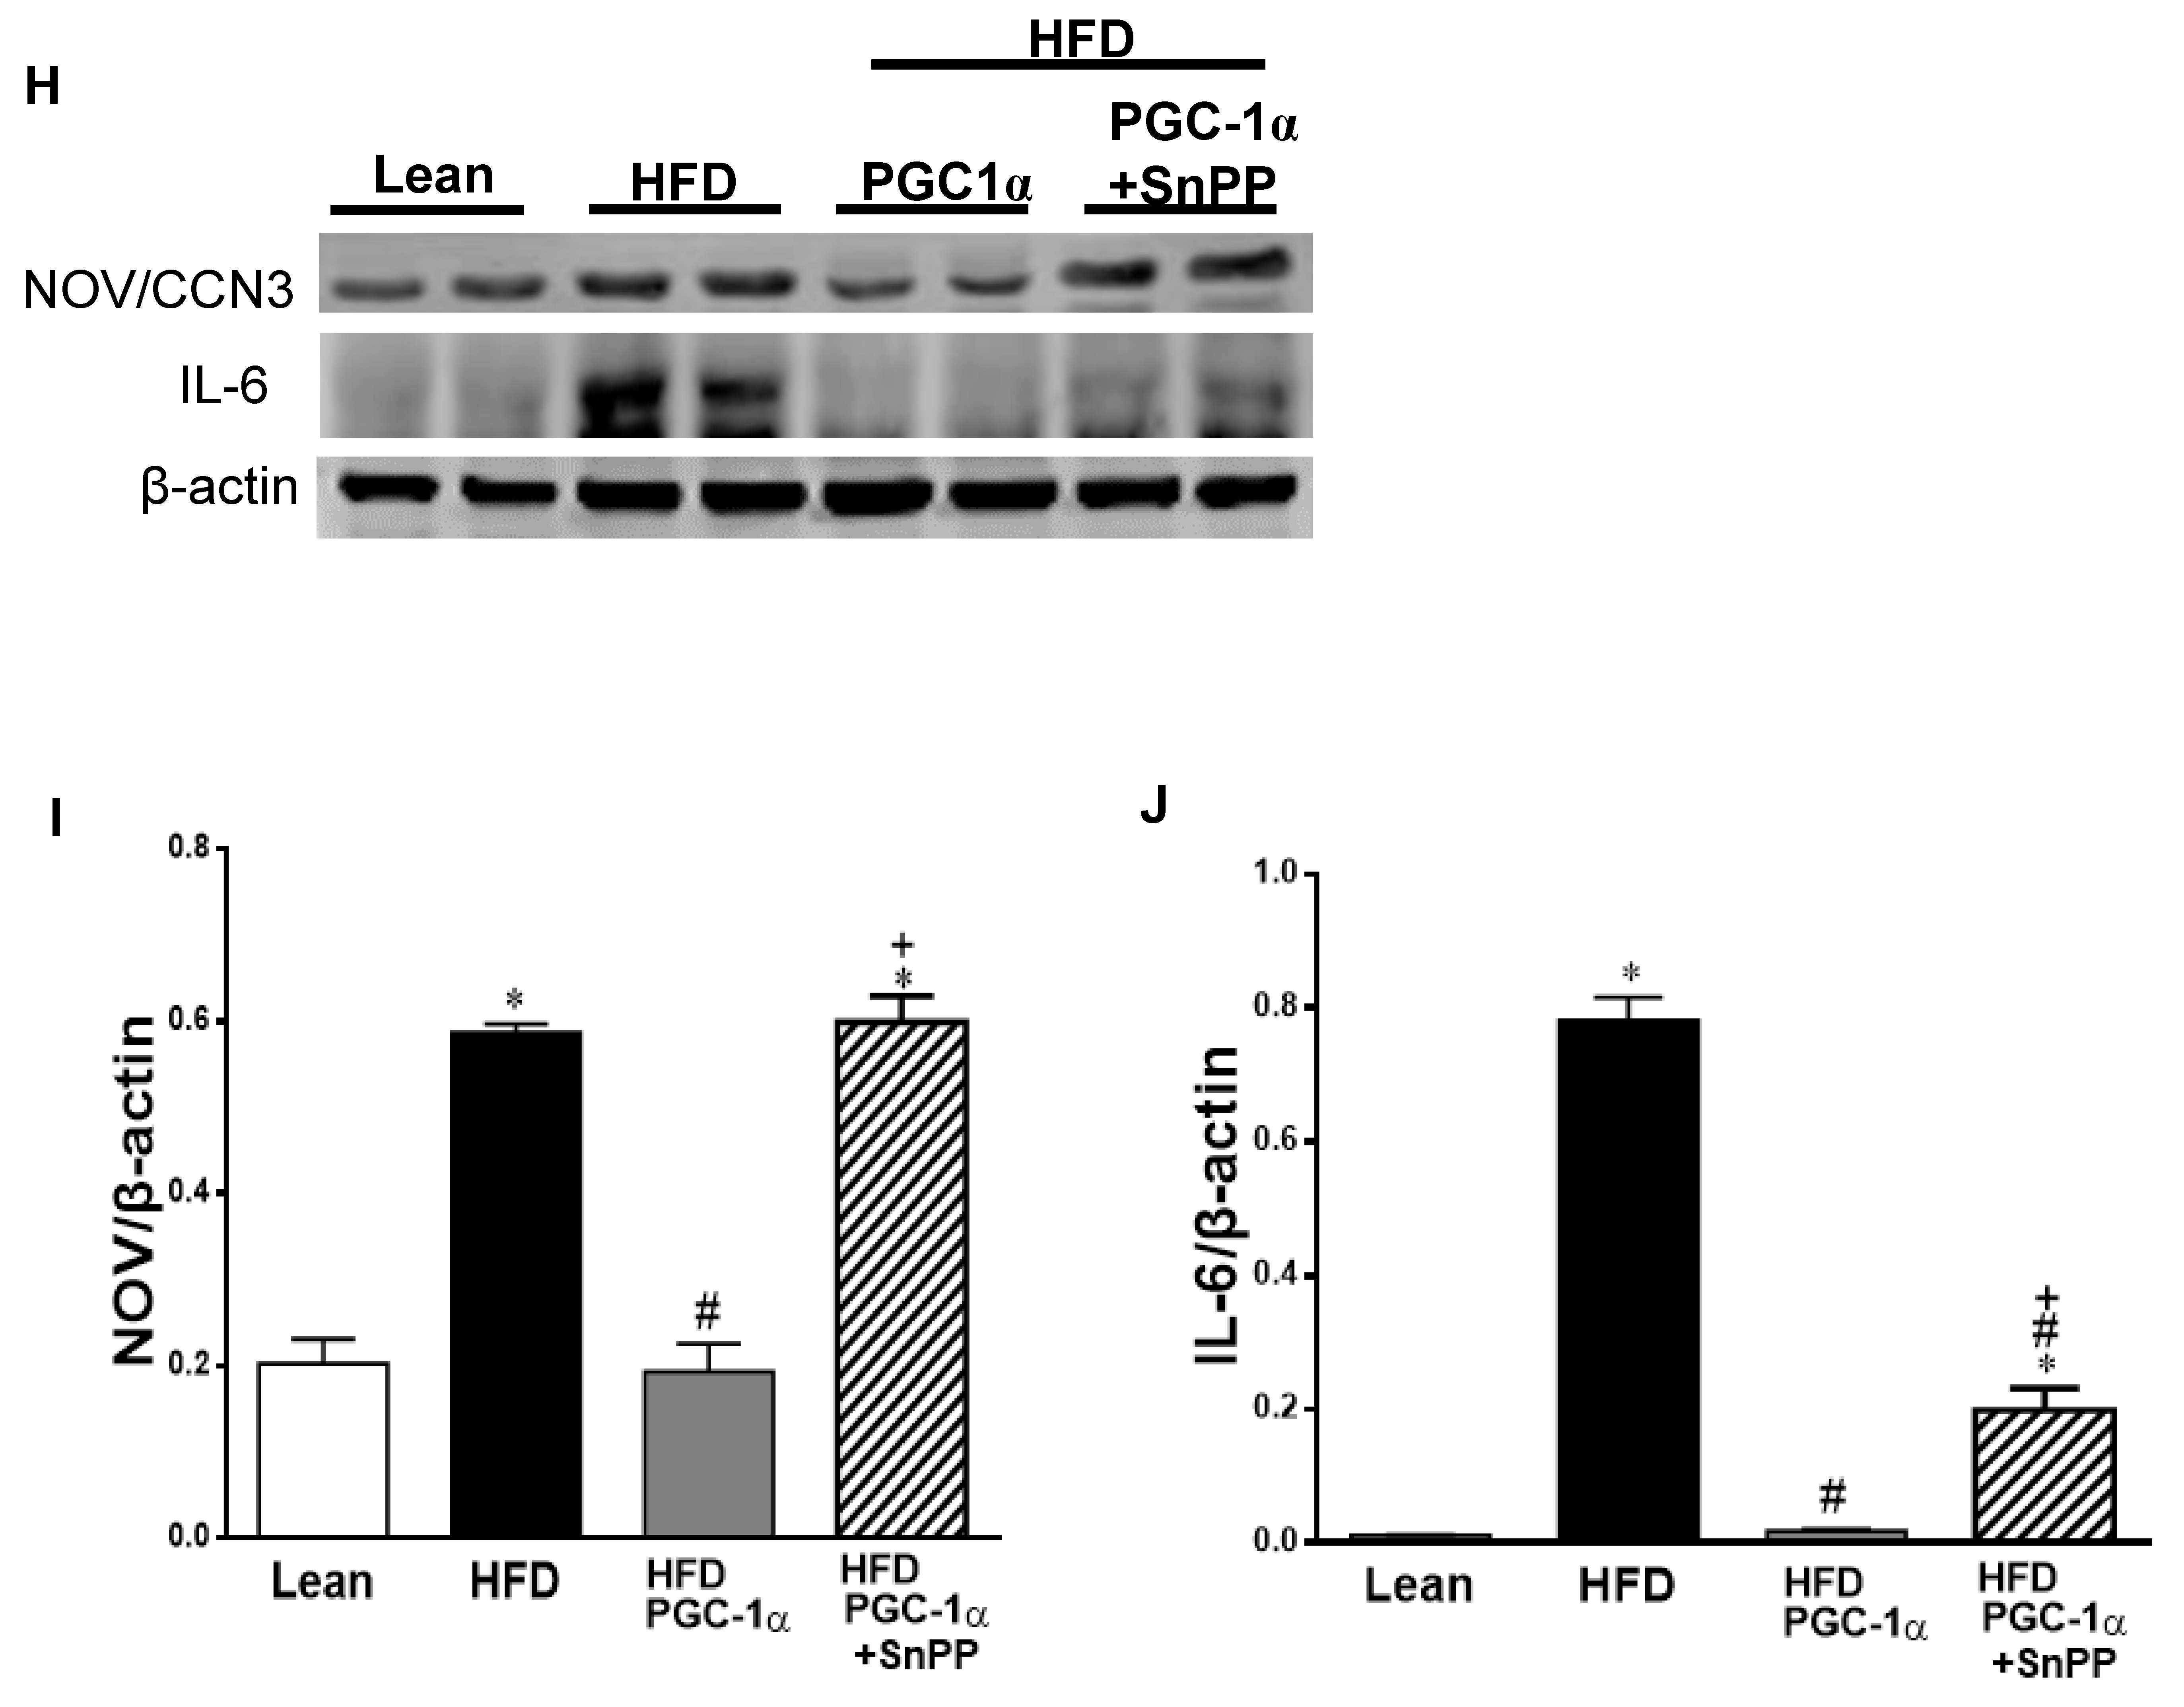
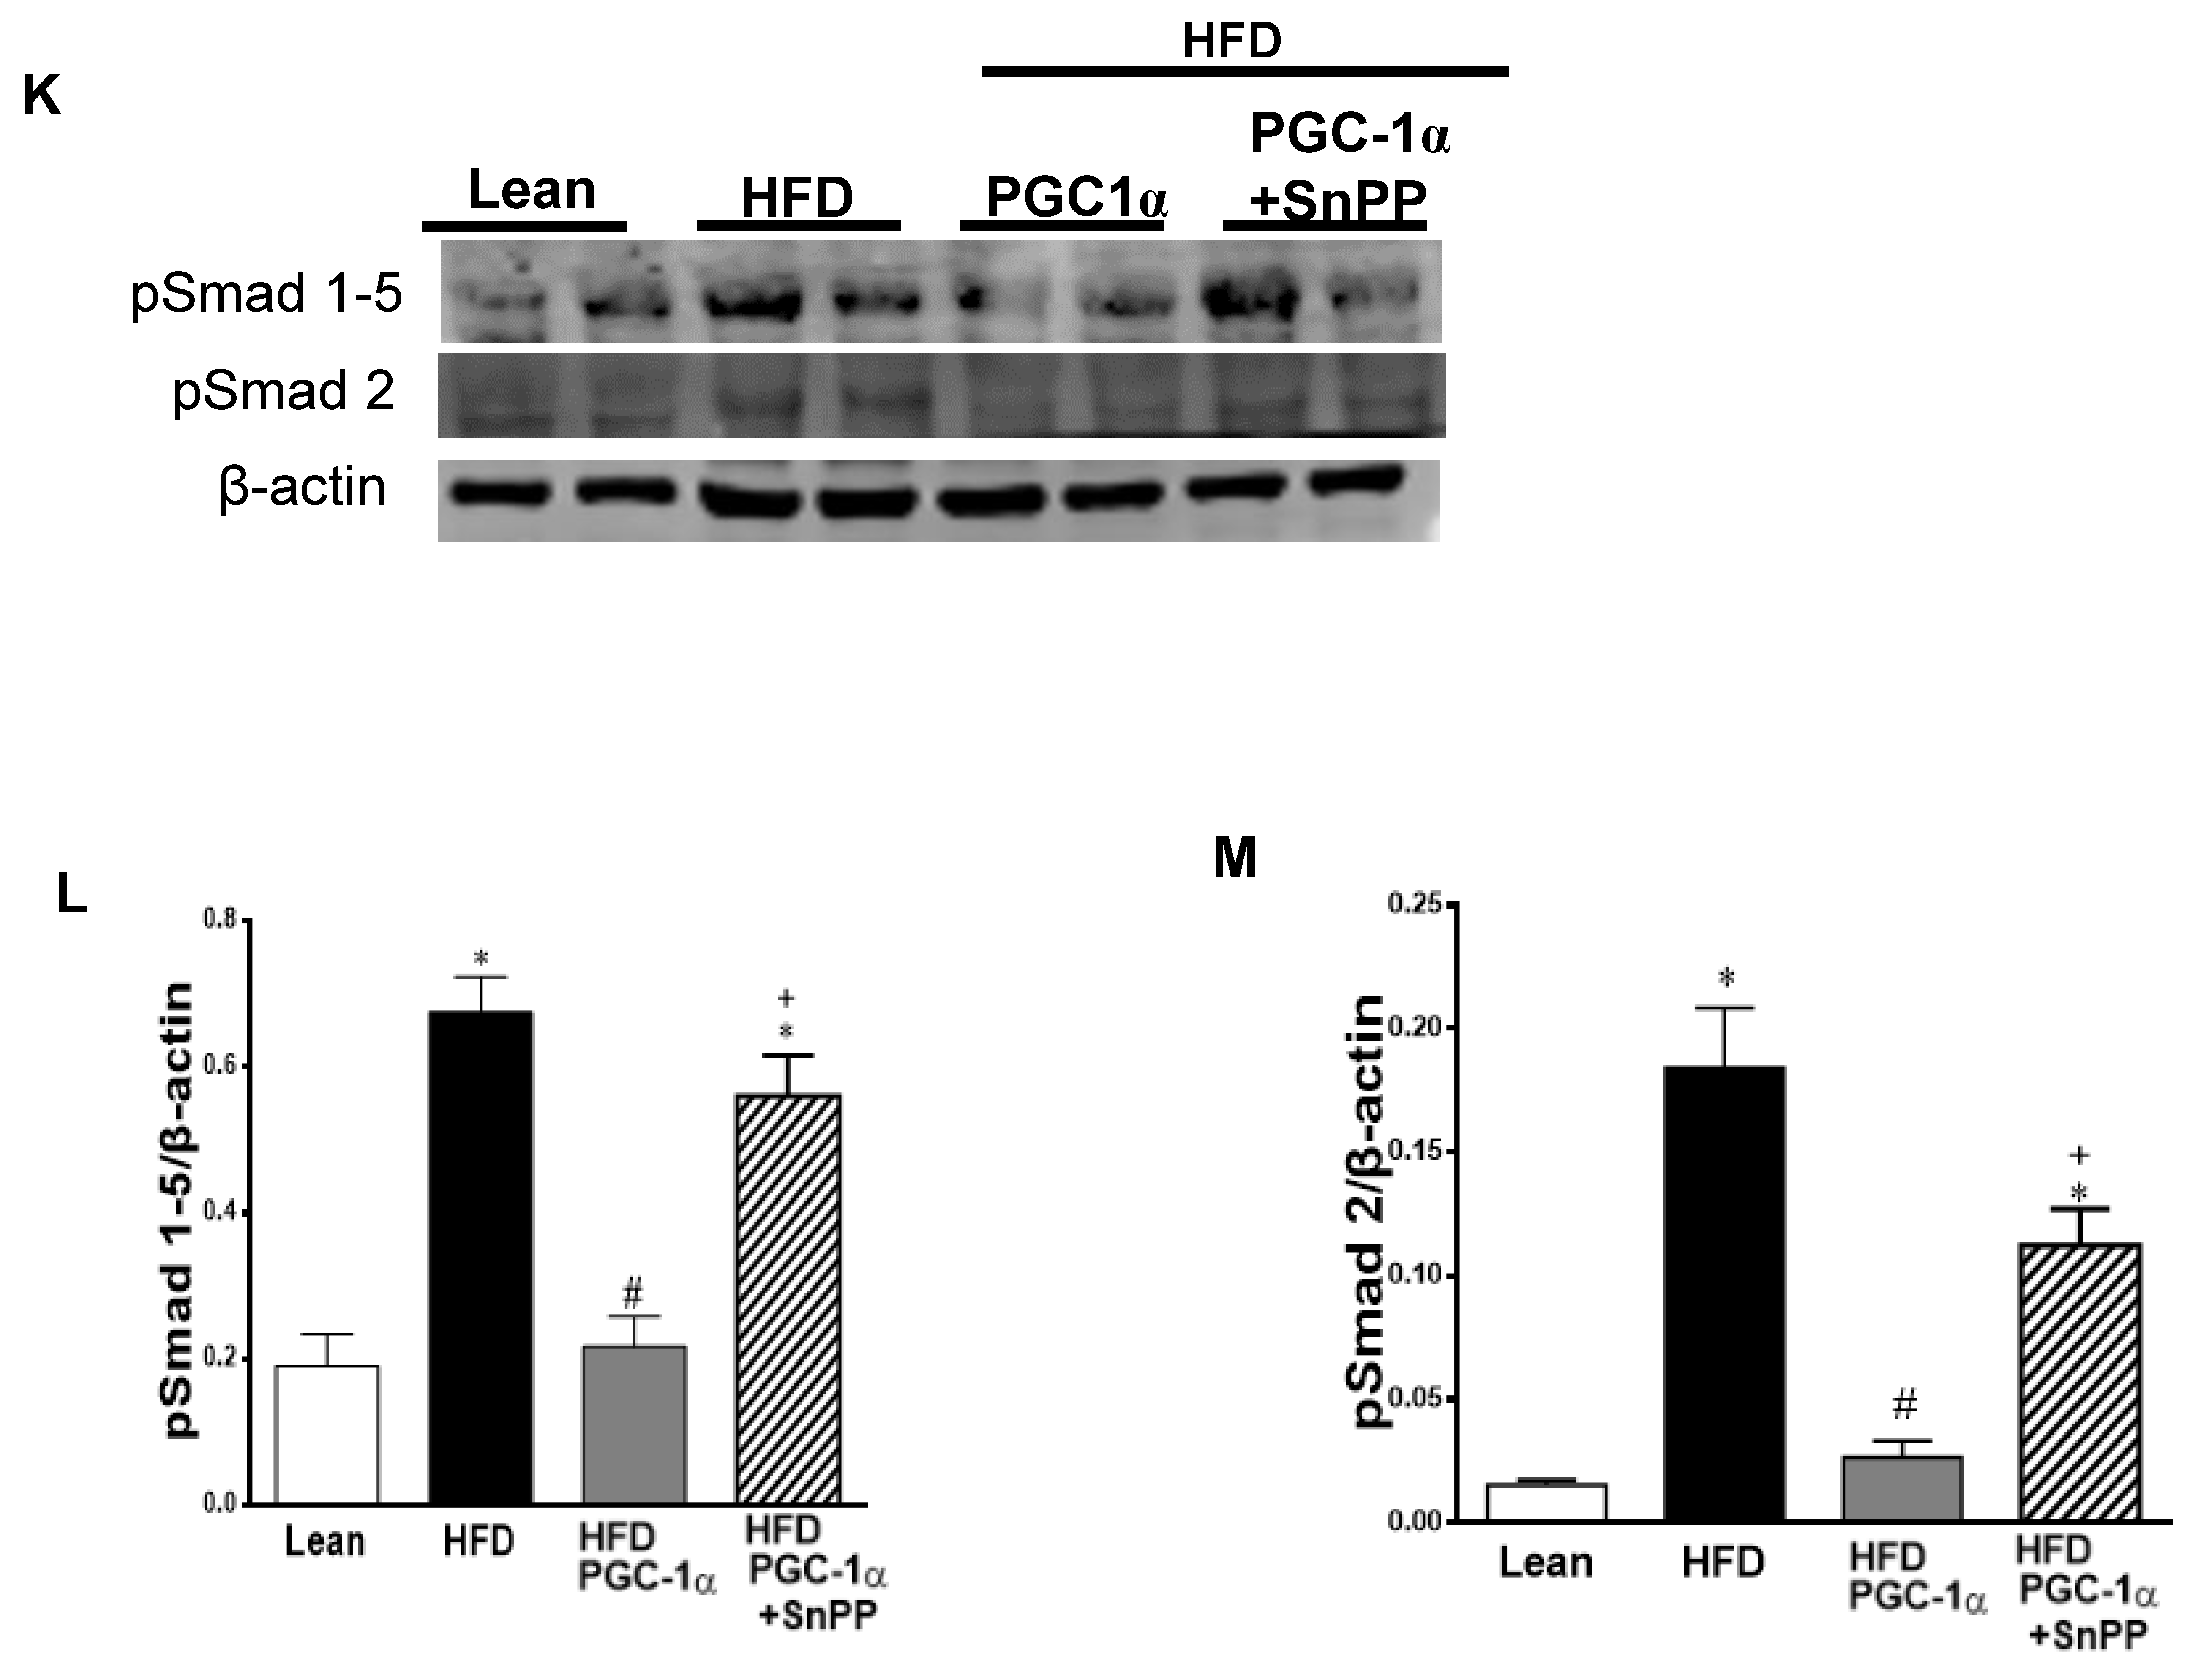
3.11. Effect of SnPP on the Expression of the PGC-1α Target
4. Discussion
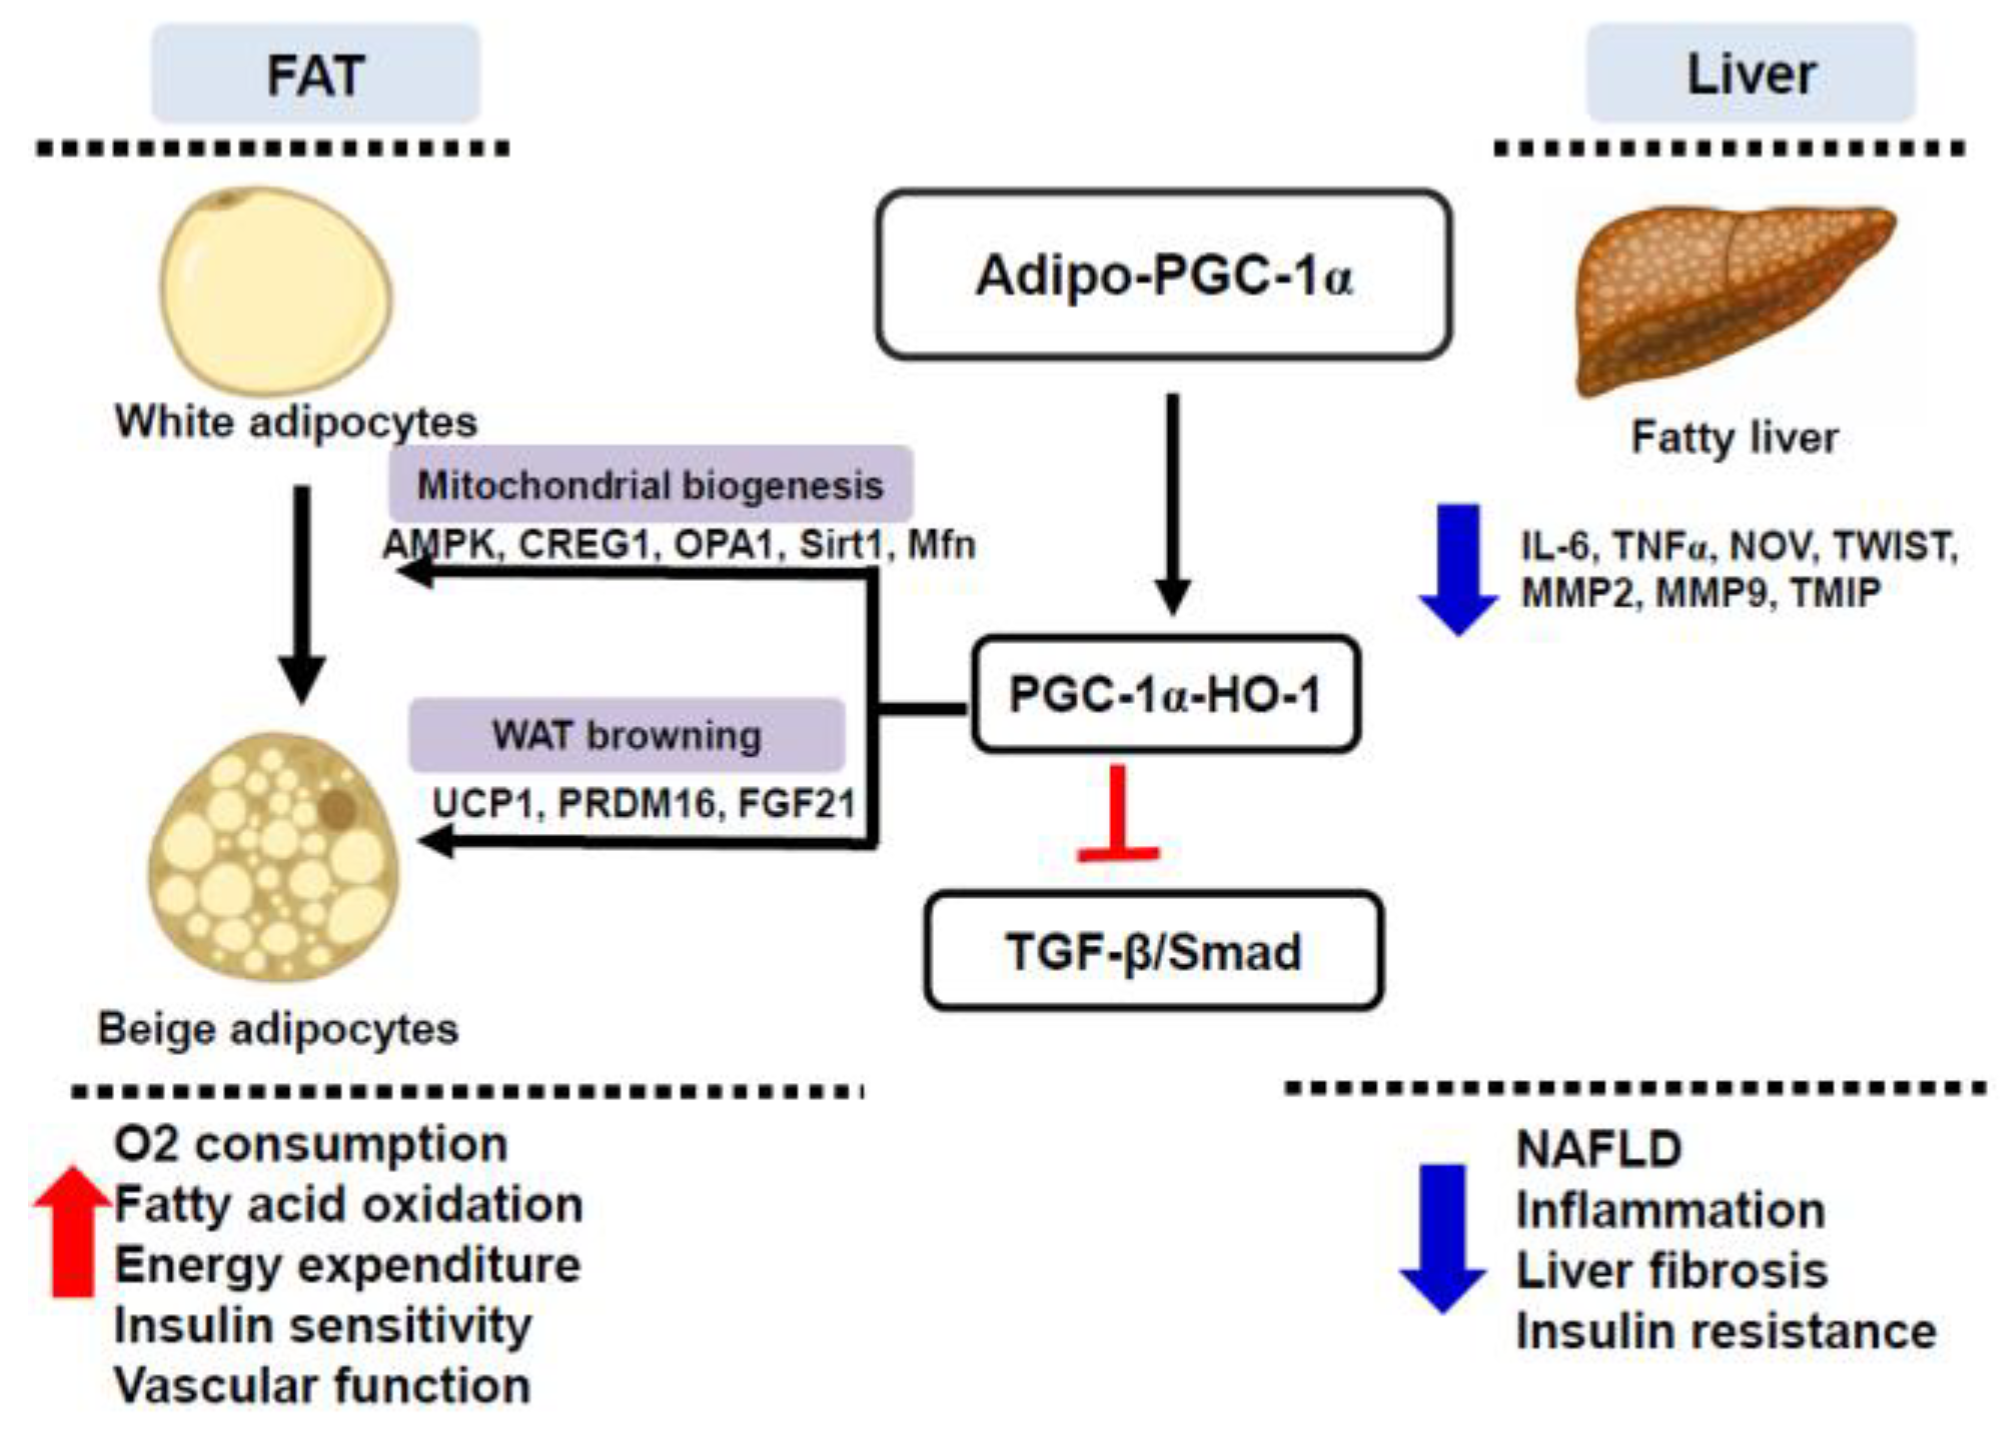
5. Conclusions
Author Contributions
Funding
Institutional Review Board Statement
Informed Consent Statement
Data Availability Statement
Acknowledgments
Conflicts of Interest
References
- Mitchell, S.; Shaw, D. The worldwide epidemic of female obesity. Best Pract. Research. Clin. Obstet. Gynaecol. 2015, 29, 289–299. [Google Scholar] [CrossRef] [PubMed]
- Ladhani, M.; Craig, J.C.; Irving, M.; Clayton, P.A.; Wong, G. Obesity and the risk of cardiovascular and all-cause mortality in chronic kidney disease: A systematic review and meta-analysis. Nephrol. Dial. Transplant. Off. Publ. Eur. Dial. Transpl. Assoc. Eur. Ren. Assoc. 2017, 32, 439–449. [Google Scholar] [CrossRef] [PubMed]
- Wild, S.; Roglic, G.; Green, A.; Sicree, R.; King, H. Global prevalence of diabetes: Estimates for the year 2000 and projections for 2030. Diabetes Care 2004, 27, 1047–1053. [Google Scholar] [CrossRef] [PubMed]
- Mouton, A.J.; Li, X.; Hall, M.E.; Hall, J.E. Obesity, Hypertension, and Cardiac Dysfunction: Novel Roles of Immunometabolism in Macrophage Activation and Inflammation. Circ. Res. 2020, 126, 789–806. [Google Scholar] [CrossRef] [PubMed]
- Lee, B.Y.; Bartsch, S.M.; Mui, Y.; Haidari, L.A.; Spiker, M.L.; Gittelsohn, J. A systems approach to obesity. Nutr. Rev. 2017, 75, 94–106. [Google Scholar] [CrossRef] [PubMed]
- Pugazhenthi, S.; Qin, L.; Reddy, P.H. Common neurodegenerative pathways in obesity, diabetes, and Alzheimer’s disease. Biochim. Biophys. Acta Mol. Basis Dis. 2017, 1863, 1037–1045. [Google Scholar] [CrossRef]
- Ellulu, M.S.; Patimah, I.; Khaza’ai, H.; Rahmat, A.; Abed, Y. Obesity and inflammation: The linking mechanism and the complications. Arch. Med. Sci. AMS 2017, 13, 851–863. [Google Scholar] [CrossRef]
- Kredel, L.I.; Siegmund, B. Adipose-tissue and intestinal inflammation - visceral obesity and creeping fat. Front. Immunol. 2014, 5, 462. [Google Scholar] [CrossRef]
- Sacerdoti, D.; Singh, S.P.; Schragenheim, J.; Bellner, L.; Vanella, L.; Raffaele, M.; Meissner, A.; Grant, I.; Favero, G.; Rezzani, R.; et al. Development of NASH in Obese Mice is Confounded by Adipose Tissue Increase in Inflammatory NOV and Oxidative Stress. Int. J. Hepatol. 2018, 2018, 3484107. [Google Scholar] [CrossRef]
- Bernal, J.M.; Mestres, C.A. Epicardial adipose hypertrophy: The Phantom of the Opera. J. Thorac. Cardiovasc. Surg. 2016, 151, e31–e32. [Google Scholar] [CrossRef]
- Chouchani, E.T.; Kazak, L.; Spiegelman, B.M. Mitochondrial reactive oxygen species and adipose tissue thermogenesis: Bridging physiology and mechanisms. J. Biol. Chem. 2017, 292, 16810–16816. [Google Scholar] [CrossRef] [PubMed]
- Despres, J.P.; Lemieux, I. Abdominal obesity and metabolic syndrome. Nature 2006, 444, 881–887. [Google Scholar] [CrossRef] [PubMed]
- Singh, S.P.; McClung, J.A.; Bellner, L.; Cao, J.; Waldman, M.; Schragenheim, J.; Arad, M.; Hochhauser, E.; Falck, J.R.; Weingarten, J.A.; et al. CYP-450 Epoxygenase Derived Epoxyeicosatrienoic Acid Contribute To Reversal of Heart Failure in Obesity-Induced Diabetic Cardiomyopathy via PGC-1 alpha Activation. Cardiovasc. Pharmacol. 2018, 7, 233. [Google Scholar] [CrossRef]
- Kleiner, S.; Mepani, R.J.; Laznik, D.; Ye, L.; Jurczak, M.J.; Jornayvaz, F.R.; Estall, J.L.; Chatterjee, B.D.; Shulman, G.I.; Spiegelman, B.M. Development of insulin resistance in mice lacking PGC-1alpha in adipose tissues. Proc. Natl. Acad. Sci. USA 2012, 109, 9635–9640. [Google Scholar] [CrossRef] [PubMed]
- Kong, X.; Banks, A.; Liu, T.; Kazak, L.; Rao, R.R.; Cohen, P.; Wang, X.; Yu, S.; Lo, J.C.; Tseng, Y.H.; et al. IRF4 is a key thermogenic transcriptional partner of PGC-1alpha. Cell 2014, 158, 69–83. [Google Scholar] [CrossRef]
- Lin, J.; Handschin, C.; Spiegelman, B.M. Metabolic control through the PGC-1 family of transcription coactivators. Cell Metab. 2005, 1, 361–370. [Google Scholar] [CrossRef]
- Singh, S.P.; Greenberg, M.; Glick, Y.; Bellner, L.; Favero, G.; Rezzani, R.; Rodella, L.F.; Agostinucci, K.; Shapiro, J.I.; Abraham, N.G. Adipocyte Specific HO-1 Gene Therapy is Effective in Antioxidant Treatment of Insulin Resistance and Vascular Function in an Obese Mice Model. Antioxidants 2020, 9, 40. [Google Scholar] [CrossRef]
- Cohen, P.; Levy, J.D.; Zhang, Y.; Frontini, A.; Kolodin, D.P.; Svensson, K.J.; Lo, J.C.; Zeng, X.; Ye, L.; Khandekar, M.J.; et al. Ablation of PRDM16 and beige adipose causes metabolic dysfunction and a subcutaneous to visceral fat switch. Cell 2014, 156, 304–316. [Google Scholar] [CrossRef]
- Choi, C.S.; Befroy, D.E.; Codella, R.; Kim, S.; Reznick, R.M.; Hwang, Y.J.; Liu, Z.X.; Lee, H.Y.; Distefano, A.; Samuel, V.T.; et al. Paradoxical effects of increased expression of PGC-1alpha on muscle mitochondrial function and insulin-stimulated muscle glucose metabolism. Proc. Natl. Acad. Sci. USA 2008, 105, 19926–19931. [Google Scholar] [CrossRef]
- Bostrom, P.; Wu, J.; Jedrychowski, M.P.; Korde, A.; Ye, L.; Lo, J.C.; Rasbach, K.A.; Bostrom, E.A.; Choi, J.H.; Long, J.Z.; et al. A PGC1-alpha-dependent myokine that drives brown-fat-like development of white fat and thermogenesis. Nature 2012, 481, 463–468. [Google Scholar] [CrossRef]
- Arany, Z.; Wagner, B.K.; Ma, Y.; Chinsomboon, J.; Laznik, D.; Spiegelman, B.M. Gene expression-based screening identifies microtubule inhibitors as inducers of PGC-1alpha and oxidative phosphorylation. Proc. Natl. Acad. Sci. USA 2008, 105, 4721–4726. [Google Scholar] [CrossRef] [PubMed]
- Arany, Z.; He, H.; Lin, J.; Hoyer, K.; Handschin, C.; Toka, O.; Ahmad, F.; Matsui, T.; Chin, S.; Wu, P.H.; et al. Transcriptional coactivator PGC-1 alpha controls the energy state and contractile function of cardiac muscle. Cell Metab. 2005, 1, 259–271. [Google Scholar] [CrossRef] [PubMed]
- Schreyer, S.A.; Wilson, D.L.; LeBoeuf, R.C. C57BL/6 mice fed high fat diets as models for diabetes-accelerated atherosclerosis. Atherosclerosis 1998, 136, 17–24. [Google Scholar] [CrossRef]
- Surwit, R.S.; Kuhn, C.M.; Cochrane, C.; McCubbin, J.A.; Feinglos, M.N. Diet-induced type II diabetes in C57BL/6J mice. Diabetes 1988, 37, 1163–1167. [Google Scholar] [CrossRef]
- Schragenheim, J.; Bellner, L.; Cao, J.; Singh, S.P.; Bamshad, D.; McClung, J.A.; Maayan, O.; Meissner, A.; Grant, I.; Stier, C.T., Jr.; et al. EET enhances renal function in obese mice resulting in restoration of HO-1-Mfn1/2 signaling, and decrease in hypertension through inhibition of sodium chloride co-transporter. Prostaglandins Other Lipid Mediat. 2018, 137, 30–39. [Google Scholar] [CrossRef]
- Raffaele, M.; Bellner, L.; Singh, S.P.; Favero, G.; Rezzani, R.; Rodella, L.F.; Falck, J.R.; Abraham, N.G.; Vanella, L. Epoxyeicosatrienoic intervention improves NAFLD in leptin receptor deficient mice by an increase in PGC1alpha-HO-1-PGC1alpha-mitochondrial signaling. Exp. Cell Res. 2019, 380, 180–187. [Google Scholar] [CrossRef]
- Waldman, M.; Bellner, L.; Vanella, L.; Schragenheim, J.; Sodhi, K.; Singh, S.P.; Lin, D.; Lakhkar, A.; Li, J.; Hochhauser, E.; et al. Epoxyeicosatrienoic Acids Regulate Adipocyte Differentiation of Mouse 3T3 Cells, Via PGC-1alpha Activation, Which Is Required for HO-1 Expression and Increased Mitochondrial Function. Stem Cells Dev. 2016, 25, 1084–1094. [Google Scholar] [CrossRef]
- Cao, J.; Singh, S.P.; McClung, J.; Joseph, G.; Vanella, L.; Barbagallo, I.; Jiang, H.; Falck, J.R.; Arad, M.; Shapiro, J.I.; et al. EET Intervention on Wnt1, NOV and HO-1 Signaling Prevents Obesity-Induced Cardiomyopathy in Obese Mice. Am. J. Physiol. Heart Circ. Physiol. 2017, 313, H368–H380. [Google Scholar] [CrossRef]
- Singh, S.P.; Bellner, L.; Vanella, L.; Cao, J.; Falck, J.R.; Kappas, A.; Abraham, N.G. Downregulation of PGC-1alpha Prevents the Beneficial Effect of EET-Heme Oxygenase-1 on Mitochondrial Integrity and Associated Metabolic Function in Obese Mice. J. Nutr. Metab. 2016, 2016, 9039754. [Google Scholar] [CrossRef]
- Singh, S.; Grant, I.; Meissner, A.; Kappas, A.; Abraham, N. Ablation of adipose-HO-1 expression increases white fat over beige fat through inhibition of mitochondrial fusion and of PGC1alpha in female mice. Horm. Mol. Biol. Clin. Investig. 2017, 31. [Google Scholar] [CrossRef]
- Singh, S.P.; Schragenheim, J.; Cao, J.; Falck, J.R.; Abraham, N.G.; Bellner, L. PGC-1 alpha regulates HO-1 expression, mitochondrial dynamics and biogenesis: Role of epoxyeicosatrienoic acid. Prostaglandins Other Lipid Mediat. 2016, 125, 8–18. [Google Scholar] [CrossRef] [PubMed]
- Singh, S.P.; McClung, J.A.; Thompson, E.; Glick, Y.; Greenberg, M.; Acosta-Baez, G.; Edris, B.; Shapiro, J.I.; Abraham, N.G. Cardioprotective Heme Oxygenase-1-PGC1alpha Signaling in Epicardial Fat Attenuates Cardiovascular Risk in Humans as in Obese Mice. Obes. Silver Spring 2019, 27, 1634–1643. [Google Scholar] [CrossRef] [PubMed]
- Warnes, G.R.; Bolker, B.; Bonebakker, L.; Gentleman, R.; Liaw, W.H.A.; Lumley, T.; Maechler, M.; Magnusson, A.; Moeller, S.; Schwartz, M.; et al. Gplots: Various R Programming Tools for Plotting Data. R Package, Version 3.0.1.1. 2019. Available online: https://www.R-project.org/ (accessed on 4 March 2022).
- Cao, J.; Peterson, S.J.; Sodhi, K.; Vanella, L.; Barbagallo, I.; Rodella, L.F.; Schwartzman, M.L.; Abraham, N.G.; Kappas, A. Heme oxygenase gene targeting to adipocytes attenuates adiposity and vascular dysfunction in mice fed a high-fat diet. Hypertension 2012, 60, 467–475. [Google Scholar] [CrossRef] [PubMed]
- Voldstedlund, M.; Tranum-Jensen, J.; Vinten, J. Quantitation of Na+/K(+)-ATPase and glucose transporter isoforms in rat adipocyte plasma membrane by immunogold labeling. J. Membr. Biol. 1993, 136, 63–73. [Google Scholar] [CrossRef] [PubMed]
- Shen, H.H.; Peterson, S.J.; Bellner, L.; Choudhary, A.; Levy, L.; Gancz, L.; Sasson, A.; Trainer, J.; Rezzani, R.; Resnick, A.; et al. Cold-Pressed Nigella Sativa Oil Standardized to 3% Thymoquinone Potentiates Omega-3 Protection against Obesity-Induced Oxidative Stress, Inflammation, and Markers of Insulin Resistance Accompanied with Conversion of White to Beige Fat in Mice. Antioxidants 2020, 9, 489. [Google Scholar] [CrossRef] [PubMed]
- Liang, H.; Ward, W.F. PGC-1alpha: A key regulator of energy metabolism. Adv. Physiol. Educ. 2006, 30, 145–151. [Google Scholar] [CrossRef]
- Hammarstedt, A.; Jansson, P.A.; Wesslau, C.; Yang, X.; Smith, U. Reduced expression of PGC-1 and insulin-signaling molecules in adipose tissue is associated with insulin resistance. Biochem. Biophys. Res. Commun. 2003, 301, 578–582. [Google Scholar] [CrossRef]
- Puigserver, P. Tissue-specific regulation of metabolic pathways through the transcriptional coactivator PGC1-alpha. Int. J. Obes. 2005, 29, S5–S9. [Google Scholar] [CrossRef]
- Canto, C.; Auwerx, J. PGC-1alpha, SIRT1 and AMPK, an energy sensing network that controls energy expenditure. Curr. Opin. Lipidol. 2009, 20, 98–105. [Google Scholar] [CrossRef]
- Pakradouni, J.; Le, G.W.; Calmel, C.; Antoine, B.; Villard, E.; Frisdal, E.; Abifadel, M.; Tordjman, J.; Poitou, C.; Bonnefont-Rousselot, D.; et al. Plasma NOV/CCN3 levels are closely associated with obesity in patients with metabolic disorders. PLoS ONE 2013, 8, e66788. [Google Scholar] [CrossRef]
- Weingarten, J.; Bellner, L.; Peterson, S.; Zaw, M.; Chadha, P.; Singh, S.; Abraham, N. The association of NOV/CCN3 with obstructive sleep apnea (OSA): Preliminary evidence of a novel biomarker in OSA. Horm. Mol. Biol Clin. Investig. 2017, 31. [Google Scholar] [CrossRef] [PubMed]
- Vanella, L.; Li, M.; Kim, D.; Malfa, G.; Bellner, L.; Kawakami, T.; Abraham, N.G. ApoA1: Mimetic peptide reverses adipocyte dysfunction in vivo and in vitro via an increase in heme oxygenase (HO-1) and Wnt10b. Cell Cycle 2012, 11, 706–714. [Google Scholar] [CrossRef] [PubMed]
- Vanella, L.; Sodhi, K.; Kim, D.H.; Puri, N.; Maheshwari, M.; Hinds, T.D., Jr.; Bellner, L.; Goldstein, D.; Peterson, S.J.; Shapiro, J.I.; et al. Increased heme-oxygenase 1 expression decreases adipocyte differentiation and lipid accumulation in mesenchymal stem cells via upregulation of the canonical Wnt signaling cascade. Stem. Cell Res. Ther. 2013, 4, 28. [Google Scholar] [CrossRef] [PubMed]
- Cao, J.; Tsenovoy, P.L.; Thompson, E.A.; Falck, J.R.; Touchon, R.; Sodhi, K.; Rezzani, R.; Shapiro, J.I.; Abraham, N.G. Agonists of epoxyeicosatrienoic acids reduce infarct size and ameliorate cardiac dysfunction via activation of HO-1 and Wnt1 canonical pathway. Prostaglandins Other Lipid Mediat. 2015, 116–117, 76–86. [Google Scholar] [CrossRef] [PubMed]
- Dooley, S.; ten Dijke, P. TGF-beta in progression of liver disease. Cell Tissue Res. 2012, 347, 245–256. [Google Scholar] [CrossRef]
- Wankhade, U.D.; Lee, J.H.; Dagur, P.K.; Yadav, H.; Shen, M.; Chen, W.; Kulkarni, A.B.; McCoy, J.P.; Finkel, T.; Cypess, A.M.; et al. TGF-beta receptor 1 regulates progenitors that promote browning of white fat. Mol. Metab. 2018, 16, 160–171. [Google Scholar] [CrossRef]
- Pervin, S.; Reddy, S.T.; Singh, R. Novel Roles of Follistatin/Myostatin in Transforming Growth Factor-β Signaling and Adipose Browning: Potential for Therapeutic Intervention in Obesity Related Metabolic Disorders. Front. Endocrinol. 2021, 12, 653179. [Google Scholar] [CrossRef]
- Yadav, H.; Quijano, C.; Kamaraju, A.K.; Gavrilova, O.; Malek, R.; Chen, W.; Zerfas, P.; Zhigang, D.; Wright, E.C.; Stuelten, C.; et al. Protection from obesity and diabetes by blockade of TGF-beta/Smad3 signaling. Cell Metab. 2011, 14, 67–79. [Google Scholar] [CrossRef]
- Shoelson, S.E.; Lee, J.; Goldfine, A.B. Inflammation and insulin resistance. J. Clin. Investig. 2006, 116, 1793–1801. [Google Scholar] [CrossRef]
- Xia, M.F.; Bian, H.; Gao, X. NAFLD and Diabetes: Two Sides of the Same Coin? Rationale for Gene-Based Personalized NAFLDTreatment. Front. Pharmacol. 2019, 10, 877. [Google Scholar] [CrossRef]
- Peng, J.H.; Leng, J.; Tian, H.J.; Yang, T.; Fang, Y.; Feng, Q.; Zhao, Y.; Hu, Y.Y. Geniposide and Chlorogenic Acid Combination Ameliorates Non-alcoholic Steatohepatitis Involving the Protection on the Gut Barrier Function in Mouse Induced by High-FatDiet. Front. Pharmacol. 2018, 9, 1399. [Google Scholar] [CrossRef] [PubMed]
- Chandrasekharan, K.; Alazawi, W. Genetics of Non-Alcoholic Fatty Liver and Cardiovascular Disease: Implications for Therapy? Front. Pharmacol. 2019, 10, 1413. [Google Scholar] [CrossRef] [PubMed]
- Chen, X.; Xu, Y.; Zhao, D.; Chen, T.; Gu, C.; Yu, G.; Chen, K.; Zhong, Y.; He, J.; Liu, S.; et al. LncRNA-AK012226 Is Involved in Fat Accumulation in db/db Mice Fatty Liver and Non-alcoholic Fatty Liver Disease Cell Model. Front. Pharmacol. 2018, 9, 888. [Google Scholar] [CrossRef] [PubMed]
- Viscomi, C.; Bottani, E.; Civiletto, G.; Cerutti, R.; Moggio, M.; Fagiolari, G.; Schon, E.A.; Lamperti, C.; Zeviani, M. In vivo correction of COX deficiency by activation of the AMPK/PGC-1alpha axis. Cell Metab. 2011, 14, 80–90. [Google Scholar] [CrossRef]
- Hinds, T.D., Jr.; Sodhi, K.; Meadows, C.; Fedorova, L.; Puri, N.; Kim, D.H.; Peterson, S.J.; Shapiro, J.; Abraham, N.G.; Kappas, A. Increased HO-1 levels ameliorate fatty liver development through a reduction of heme and recruitment of FGF21. Obes. Silver Spring 2014, 22, 705–712. [Google Scholar] [CrossRef]
- Sasson, A.; Kristoferson, E.; Batista, R.; McClung, J.A.; Abraham, N.G.; Peterson, S.J. The pivotal role of heme Oxygenase-1 in reversing the pathophysiology and systemic complications of NAFLD. Arch. Biochem. Biophys. 2021, 697, 108679. [Google Scholar] [CrossRef]
- Shen, H.H.; Singh, S.P.; Raffaele, M.; Baum, J.; Lewis, D.; Waldman, M.; Alex, R.; Bellner, L.; Rezzani, R.; Favero, G.; et al. Adipocyte Specific Overexpression of HO-1 Alters Hepatic Steatosis, Inflammation and Fibrosis. J. Food Nutr. Sci. 2022, 4, 1–20. [Google Scholar] [CrossRef]
- Raffaele, M.; Licari, M.; Amin, S.; Alex, R.; Shen, H.H.; Singh, S.P.; Vanella, L.; Rezzani, R.; Bonomini, F.; Peterson, S.J.; et al. Cold Press Pomegranate Seed Oil Attenuates Dietary-Obesity Induced Hepatic Steatosis and Fibrosis through Antioxidant and Mitochondrial Pathways in Obese Mice. Int. J. Mol. Sci. 2020, 21, 5469. [Google Scholar] [CrossRef]
- McClung, J.A.; Levy, L.; Garcia, V.; Stec, D.E.; Peterson, S.J.; Abraham, N.G. Heme-oxygenase and lipid mediators in obesity and associated cardiometabolic diseases: Therapeutic implications. Pharmacol. Ther. 2022, 231, 107975. [Google Scholar] [CrossRef]
- Peterson, S.J.; Rubinstein, R.; Faroqui, M.; Raza, A.; Boumaza, I.; Zhang, Y.; Stec, D.; Abraham, N.G. Positive Effects of Heme Oxygenase Upregulation on Adiposity and Vascular Dysfunction: Gene Targeting vs. Pharmacologic Therapy. Int. J. Mol. Sci. 2019, 20, 2514. [Google Scholar] [CrossRef]
- Peterson, S.J.; Dave, N.; Kothari, J. The Effects of Heme Oxygenase Upregulation on Obesity and the Metabolic Syndrome. Antioxid. Redox Signal. 2020, 32, 1061–1070. [Google Scholar] [CrossRef] [PubMed]


Publisher’s Note: MDPI stays neutral with regard to jurisdictional claims in published maps and institutional affiliations. |
© 2022 by the authors. Licensee MDPI, Basel, Switzerland. This article is an open access article distributed under the terms and conditions of the Creative Commons Attribution (CC BY) license (https://creativecommons.org/licenses/by/4.0/).
Share and Cite
Shen, S.-H.; Singh, S.P.; Raffaele, M.; Waldman, M.; Hochhauser, E.; Ospino, J.; Arad, M.; Peterson, S.J. Adipocyte-Specific Expression of PGC1α Promotes Adipocyte Browning and Alleviates Obesity-Induced Metabolic Dysfunction in an HO-1-Dependent Fashion. Antioxidants 2022, 11, 1147. https://doi.org/10.3390/antiox11061147
Shen S-H, Singh SP, Raffaele M, Waldman M, Hochhauser E, Ospino J, Arad M, Peterson SJ. Adipocyte-Specific Expression of PGC1α Promotes Adipocyte Browning and Alleviates Obesity-Induced Metabolic Dysfunction in an HO-1-Dependent Fashion. Antioxidants. 2022; 11(6):1147. https://doi.org/10.3390/antiox11061147
Chicago/Turabian StyleShen, Shin-Hsueh, Shailendra P. Singh, Marco Raffaele, Maayan Waldman, Edith Hochhauser, Juancarlos Ospino, Michael Arad, and Stephen J. Peterson. 2022. "Adipocyte-Specific Expression of PGC1α Promotes Adipocyte Browning and Alleviates Obesity-Induced Metabolic Dysfunction in an HO-1-Dependent Fashion" Antioxidants 11, no. 6: 1147. https://doi.org/10.3390/antiox11061147