Article

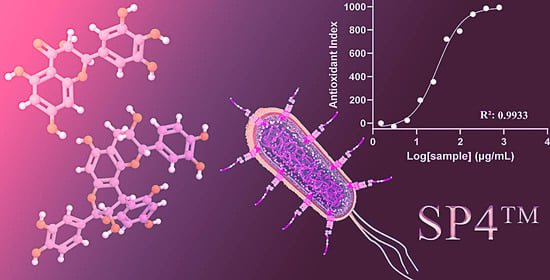
Metabolomics-Based Profiling, Antioxidant Power, and Uropathogenic Bacterial Anti-Adhesion Activity of SP4TM, a Formulation with a High Content of Type-A Proanthocyanidins

by
Giuseppe Mannino
* and
Massimo E. Maffei
Department of Life Sciences and Systems Biology, University of Turin, Via Quarello 15/a, 10135 Turin, Italy
*
Author to whom correspondence should be addressed.
Antioxidants 2022, 11(7), 1234; https://doi.org/10.3390/antiox11071234
Submission received: 28 April 2022 / Revised: 16 June 2022 / Accepted: 21 June 2022 / Published: 23 June 2022
(This article belongs to the Special Issue Antioxidant Potential of Extracts from Foods and Plants)

Abstract

:
Flavonoids and proanthocyanidins (PACs) have been the subject of intense scientific investigations, both for their antioxidant properties and anti-adhesion activity against uropathogenic bacteria. We investigated the metabolomics and antioxidant capacity of SP4TM, a patent-pending formulation based on a mixture of plant extracts with a high content of bioactive PACs and other polyphenols. The total content of polyphenols (885.51 ± 14.19 mg/g), flavonoids (135.52 ± 8.98 mg/g), anthocyanins (54.84 ± 2.97 mg/g), and PACs (379.43 ± 12.44 mg/g) was quantified using UV-Vis assays. Use of HPLC-ESI-MS/MS revealed the presence of 5 flavanols (100.77 ± 3.90 mg g−1 d.wt), 11 flavonols (59.96 ± 1.83 mg g−1 d.wt), and 8 anthocyanins (46.96 ± 1.59 mg g−1 d.wt), whereas MALDI-TOF MS showed that SP4TM contains PACs with one or more type-A interflavan bonds at each degree of polymerization. Regarding antioxidant properties, LUCS technology on HepG2 cells evidenced the ability of SP4TM to neutralize intracellular free radicals, inhibit membrane lipid peroxidation, quench H2O2, and reduce free radicals mainly through chelating mechanism, as demonstrated by a higher FRAP value (2643.28 ± 39.86 mmol/g) compared with ABTS (139.92 ± 6.16 mmol/g) and DPPH (89.51 ± 3.91 mmol/g). Finally, the SP4TM type-A PAC content strongly prevented bacterial adhesion of P-fimbriated uropathogenic Escherichia coli (0.23 mg/mL). In conclusion, SP4TM has a strong antioxidant capacity involving multitarget mechanisms and is a potential supplement to fight urinary tract infections due to its ability to inhibit uropathogenic E. coli adhesion.

Graphical Abstract

1. Introduction

During aerobic respiration, metabolic reduction of molecular oxygen to water leads to the production of reactive oxygen species (ROS), including hydroxyl radicals (OH), hydrogen peroxide (H2O2) and superoxide ion (O2•−). Oxidative stress (OS) is defined as an imbalance of ROS generation in excess of the capacity of cells/tissues to detoxify or scavenge them. Oxidative stress may alter the structure/function of cellular macromolecules that eventually leads to tissue/organ dysfunction [1].
Exposure to a variety of pollutants generates ROS and OS [2] that contribute to the pathogenesis of vascular disease, cardiovascular fibrosis [1], atherosclerosis, endothelial dysfunction, platelet aggregation and heart failure [3]. Genetic predisposition and OS caused by exogenous and endogenous factors can contribute to abnormal differentiation and hyper-proliferation of keratinocytes, accordingly the development and maintenance of psoriasis [4]. Oxidative stress has also been suggested to be involved in the pathogenesis of hypertension [5] and plays an important role in diabetic endothelial dysfunction [6] and insulin resistance that affect pancreatic beta cells [7]. Oxidative stress and oxidative DNA damage are important in the pathogenesis of benign prostatic hyperplasia [8,9], while recent evidence in the field of Alzheimer disease research, OS has been identified as one of the causes of its pathogenesis [10]. Many respiratory viral infections, including COVID-19, activate innate immune responses and secretion of inflammatory cytokines that may cause death of the infected cells. An important contribution to pathogenesis of microbial infections is the development of OS [11,12,13,14].
One of the most common infectious diseases of humans is urinary tract infection (UTI), which is also a major cause of morbidity. About 50% of healthy adult women are estimated to experience at least one UTI episode in their lifetime [15]. In uropathogenic strains of Escherichia coli, the increased level of endogenous ROS may be responsible for adaptive mutations [16]. Antibiotic-tolerant persister cells acting on the cell wall cope with two important processes regulated by cyclic AMP in uropathogenic E. coli, such as OS and DNA damage. Consequently, OS response and DNA repair are relevant pathways to target in the design of persister-specific antibiotic compounds [17]. Escherichia coli also promotes calcium oxalate stone formation via enhancing OS and inflammation [18]. Different antimicrobial agents have beneficial role on UTI [19].
The ROS are intercepted by the antioxidative defense system, including antioxidants in food. Thus, the antioxidant defense system can be enhanced by consuming foods containing antioxidants—either at high levels or at high bioavailability [20]. Plant antioxidants play an important role in antioxidative defense systems against OS. The metabolomic approach identified in plant foods flavonoids and other dietary polyphenol antioxidants that are believed to play a major role as antioxidants and be responsible for the health benefits associated with fruit, vegetable, and red wine intake [21,22]. Examples of foods containing antioxidants include tea polyphenols [23], and grape polyphenols like resveratrol that suppress oxidative/nitrative stress [24] and mitigate the exercise induced OS [25,26]. Recent preclinical findings show that plant polyphenols provide neuroprotection against OS-induced toxicity in Parkinson’s disease [27]. The health-promoting potential of several plants is also associated with their antibacterial activity resulting from the presence of proanthocyanidins (PACs) with documented anti-adherence properties [28].
Proanthocyanidins are polymeric flavonoids known for their high free radical scavenging capacity. Proanthocyanidins show modulation of oxidative stress by a strong inhibitory effect on the murine tyrosinase and melanin synthesis [29], increase the antioxidant enzymes activity and inhibit pro-apoptotic genes expression in granulosa cells [30], rescued cognitive impairment accompanied by suppressed OS and inflammatory stress in brain regions [31], play an important role in controlling the antioxidant response of lung cancer cells via the Nrf2-ARE pathway [32], have a protective role in the abatement of doxorubicin-induced mutagenesis and cell proliferation changes [33], have promising potential to preserve retinal tissue functions via regulating oxidative stress and mitochondrial functions [34], and reverse the mRNA and protein expression of apoptosis-associated genes [35].
Type-A PACs (PAC-A) have the potential function in the prevention of prostatic cells OS damage [36], and those present in the American cranberry (Vaccinium macrocarpon) exert antimicrobial activities because of both anti-adhesive activity [37,38] and anti-aging effects via regulating in vivo redox state [39]. The PAC-A from Geranium niveum show a powerful radical scavenging in vitro activity [40] whereas PAC-A from Euterpe oleracea show a high antioxidant capacity, confirmed by DPPH, TEAC and ORAC methods as well as antimicrobial activities against gram-positive bacterial strains and Candida albicans [41]. The PAC-A from peanut (Arachis hypogaea) alleviates the symptoms of ulcerative colitis by regulating gut microbiota and metabolism [42], whereas PAC-A from Aesculus turbinata protected the retina from light exposure damage by inhibiting OS and apoptotic mechanisms [43].
The important properties of polyphenols, and particularly PAC-A, have been the target of a deep search for plant natural sources containing these compounds that eventually produced the formulation SP4TM, a patent pending formulation (PCT/US2022/021087) characterized by a mixture of plant extracts with a very a high content of bioactive PAC-A and other polyphenols.
The aim of this work is the metabolomic profile, the chemical and cellular antioxidant power, and the anti-adhesion activity against uropathogenic P-fimbriate E. coli of SP4TM.

2. Materials and Methods

2.1. Plant Material, Cell Lines, Reagents and Chemicals

SP4TM is a patent pending formulation (PCT/US2022/021087) composed by a mixture of plant extracts containing a high content of type-A proanthocyanidins and other polyphenols. The origin of the plants is included in the relevant patent (PCT/US2022/021087).
Dulbecco’s Modified Eagle Medium (DMEM) was purchased from Thermo Fisher (Waltham, MA USA), cell lysis solution and luciferin were purchased from BPS Bioscience (San Diego, CA, USA), HepG2 human hepatocyte carcinoma, 85,011,430 cell lines, Fetal Calf Serum (FCS), ethanol (95%), Folin–Ciocolteu reagent, sodium carbonate, sodium nitrite, aluminum chloride, sodium hydroxide, potassium chloride, sodium acetate, potassium ferricyanide (99.8%), 1,1-diphenyl-2-picryl-hydrazil stable radical (DPPH) (>98%), ABTS (2,2′-Azino-bis(3-ethylbenzothiazoline)-6-sulfonic acid) (98%), and phenolic compounds standards (including PAC-A2) were purchased from Sigma-Aldrich (Milan, Italy). The c-PAC standard was provided by Complete Phytochemical Solutions (Cambridge, USA). The 4-(dimethylamino)-cinnamaldehyde (DMAC), hydrochloric acid, acetic acid, acetone, acetonitrile, formic acid, potassium persulfate, 2,4,6-Tris(2-pyridyl)-s-triazine (TPTZ), and iron(III) chloride were purchased from VWR International (Radnor, PA, USA).

2.2. Spectophotometric Determination of Bioactive Compounds

2.2.1. Content of Total Phenolic Compounds

The total phenolic content (TPC) of SP4TM was determined by the Folin–Ciocalteu’s method [44], using an UV/Vis Spectrophotometer (UV-1900i, Shimadzu®, Milan, Italy). Briefly, 150 µL of Folin–Ciocolteu reagent was added to 300 µL of 20% (v/v) sodium carbonate and 30 µL of SP4TM dissolved in 95% (v/v) ethanol using a 1:10 (w/v) ratio. Finally, the reaction mixture was made up to 1 mL with distilled water. Gallic acid (GA) was used for the preparation of the external calibration curve (y = 2.18x + 0.01; R2 = 0.9993; LOD: 0.0078 mg/mL; LOQ = 0.0257 mg/mL), and the results were expressed as mg GA equivalent (GAE) per gram of dry material (g−1 d.wt). All measurements were repeated three times.

2.2.2. Content of Total Flavonoid Compounds

The total flavonoid content (TFC) of SP4TM was determined by the Aluminum Chloride assay [45] using an UV/Vis Spectrophotometer (UV-1900i, Shimadzu®, Milan, Italy). Briefly, 30 µL of 5% (w/v) NaNO2 were added to 200 µL of SP4TM extract dissolved as previously described. After vortexing and incubation at room temperature (RT) for 5 min, 30 µL of 10% (w/v) AlCl3 were added to the mixture, and samples were again incubated at room temperature (RT) for 6 min. Finally, 400 µL of 4% (w/v) NaOH were added along with 340 µL of double distilled water (ddH2O). After 15 min of incubation time at RT, the absorbance was read at 510 nm. Rutin was used for the preparation of the external calibration curve (y = 2.26x + 0.02; R2 = 0.9983; LOD: 0.0098 mg/mL; LOQ = 0.0323 mg/mL), and the results were expressed as mg Rutin equivalent (RE) per gram of dry material (g−1 d.wt). All measurements were repeated three times.

2.2.3. Content of Total Anthocyanin Compounds

The total anthocyanin content (TAC) of SP4TM was measured by the differential pH method [46], using an UV/Vis Spectrophotometer (UV-1900i, Shimadzu®, Milan, Italy). Briefly, 20 µL of properly diluted SP4TM were added to 980 µL of 0.1 M KCl buffer (pH = 1) or to 0.04 M sodium acetate buffer (pH = 4.5). Then, the absorbances of both reaction mixtures were read at 510 nm and 700 nm. All measurements were repeated three times. The results were expressed as mg Cyanidin equivalent (CE) per gram of dry material (g−1 d.wt) using Equation (1).
TAC   ( mg   CE   g 1   d . wt ) = [ ( Abs 510 Abs 700 ) pH 1 ( Abs 510 Abs 700 ) pH 4.5 ] ×   MW   × 1000 ×   FD   ×   V ext ε   ×   l   ×   PW
where: Abs is the absorbance value read at the respective wavelength (510 or 700 nm); MW is the molecular weight of cyanidin-3-glucoside (449.2 g mol−1); FD is the dilution coefficient used before reading the samples; ε is the molar extinction coefficient of cyanidin-3-glucoside (26,900 mM−1 mol−1); l is the path length, that in our experimental condition was 1 cm; PW is the weight SP4TM used for the preparation of the extracts.

2.2.4. Determination of SP4TM Total PAC Content with the BL-DMAC Method

The BL-DMAC assay was performed according to the method of Prior et al. [47]. The SP4TM (200–300 mg) was dissolved in 50 mL of extraction buffer. The total PACs were quantified via an external calibration curve with the use of both PAC-A2 standard and c-PAC standard, the latter has been developed for the quantification of cranberry (Vaccinium macrocarpon) soluble PAC [48,49]. The quantification was performed in triplicate within the linear range of calibration curves (5–30 µg/mL).

2.3. Characterization of SP4TM Soluble Proanthocyanidin (PAC) Distribution by Matrix-Assisted Laser Desorption/Ionization-Time of Flight Mass Spectrometry (MALDI-TOF MS)

The MALDI-TOF MS analysis was performed following AOAC First Action Method: 2019.05 [50] with a Bruker UltraFlexVR III MALDI TOF/TOF mass spectrometer equipped with a SmartBeamTM laser (Billerica, MA, USA). MALDI-TOF MS conditions were as previously described [50]. FlexControl, and Flex Analysis software (Bruker Daltonik GmbH, Bremen, Germany) are used for data acquisition and data processing, respectively. The percentage of A- to B-type interflavan bonds in PAC was calculated according to [50].

2.4. Characterization of Other SP4TM Phenolic Compounds by HPLC-DAD-ESI-MS/MS

The HPLC (Agilent Technologies 1200) coupled to a diode array detector (DAD) and a 6330 Series Ion Trap Mass Spectrometry (MS) System (Agilent Technologies, Santa Clara, CA, USA) equipped with an electrospray ionization (ESI) source was used for separation and identification of compounds. The chromatographic separation was carried out as previously described [51]. Compounds were identified by comparison of the retention time (RT) and UV-VIS/MS spectra with those of authentic reference compounds or using literature data, while their quantification was performed using calibration curves of pure standard injections. For anthocyanin analysis, the binary solvent system was MilliQ H2O acidified with 10% (v/v) formic acid (Solvent A) and MetOH 50% (v/v) acidified with 10% (v/v) formic acid (Sigma-Aldrich, St. Louis, MO, USA) (Solvent B). The elution method involved a multistep linear solvent gradient changing from an initial concentration of 85% (v/v) A and 15% (v/v) B to 55% (v/v) A and 45% (v/v) B in 15 min. Finally, the gradient was 30% (v/v) A and 70% (v/v) B in 20 min. The initial solvent concentration was restored at the end of each run and maintained for an additional 10 min before the next injection. Sample injection volume was 10 μL. For the analysis of other polyphenolic compounds, the binary solvent system was MilliQ H2O acidified with 0.1% (v/v) formic acid (Solvent A) and Acetonitrile acidified with 0.1% (v/v) formic acid (Sigma-Aldrich, St. Louis, MO, USA) (Solvent B). The initial concentration of the solvents was set at 90% (v/v) A and 10% B for 5 min, then the concentration of the Solvent B was raised to 55% (v/v) A in 25 min, and finally at 70% (v/v) B in 25 min. The initial solvent concentration was restored at the end of each run and maintained for an additional 10 min before the next injection. Sample injection volume was 5 μL. Analyses were performed in triplicate.

2.5. Antioxidant Activity of SP4TM on Human HepG2 Cells Using the Light-Up Cell System (LUCS) Method

2.5.1. Neutralization of Intracellular Free Radicals by SP4TM

Samples of SP4TM were solubilized at a final concentration of 50 mg ml−1 in DMEM culture medium. Solutions were then centrifuged at 8700 rpm for 10 min and experiments were performed with the supernatants. The pH of samples was compatible with the assay. HepG2 cells were seeded in 96-well plates at a density of 75,000 cells/well in DMEM medium supplemented with Fetal Calf Serum (FCS) and kept in the incubator for 24h at 37 °C in the presence of 5% CO2. Cells were then incubated with samples (eight concentrations obtained by serial log2 dilutions) for 4 h at 37 °C in the presence of 5% CO2. Experiments were done in DMEM medium without FCS. At least two independent experiments were performed each on triplicate wells. This LUCS assay measures the ability of an antioxidant to neutralize oxidative stress and the effect is measured by a delay in the kinetic evolution of fluorescence emission [52]. The antioxidant cell index (AOP index) was calculated from normalized kinetic profiles according to Equation (2):
AOP   index   ( % ) = 100     100   ( 20 0 RFU sample 20 0 RFU control   )
Dose-response curves, obtained by compiling AOP indices according to Log of the sample concentration, were submitted to a sigmoid fit according to Equation (3):
AOP   index = AOP   index min + ( AOP   index max AOP   index min ) 1 + 10 log ( EC 50 SC ) HS
where SC = sample concentration, HS = Hill slope, EC50 (50% efficacy concentration). EC10 and EC90 were also evaluated.

2.5.2. Inhibition of Plasma Membrane-Based Lipid Peroxidation by SP4TM

Otherwise known as CAA or DCFDA in the literature, this assay takes advantage of the presence of a diacetate (DA) group, which allows for the passage of 2′-7′-dihydrodichloro fluorescein (DCFH) diacetate (DCFHDA) across the plasma membrane. The DCFHDA is cleavable by intracellular esterases, producing the non-permeable DCFH. When cells are treated with a radical generator such as 2,2’-azobis (2-amidinopropane) dihydro-chloride (AAPH), peroxyl radicals (ROO•) are produced at the plasma membrane level, triggering transformation of intracellular non-fluorescent DCFH into fluorescent dichloro-fluorescein (DCF). Samples of SP4TM were solubilized at a final concentration of 50 mg ml−1 in DMEM culture medium. Solutions were then centrifuged at 8700 rpm for 10 min and experiments were performed with the supernatants. The pH of samples was compatible with the assay. The HepG2 cells were seeded as above and kept in the incubator for 24 h at 37 °C in the presence of 5% CO2. Cells were treated with DCFH-DA at 30 μM final concentration for 1 h, washed three times, then treated with AAPH at 600 μM final concentration. Fluorescence was read on a kinetics mode every 5 min for the necessary time. Dose response standard curves are calculated according to Equation (4):
CAA   units   = 100     ( 0 65 RFU sample 0 65 RFU control   ) × 100

2.5.3. H2O2 Quenching (Catalase-like) Activity of SP4TM

The assay is based on the intracellular presence of a DNA biosensor whose fluorescence increases in presence of H2O2. Decrease or time delayed increase of fluorescence indicates capacity of sample to neutralize (scavenge) H2O2 in a catalase-like reaction. The SP4TM samples were preincubated with H2O2 at 0.34% final concentration for 1h (new SP4TM sample). New SP4TM sample was added with a final proportion of 14.7% to cells preincubated with TO at final concentration of 4μM for 30 min. Fluorescence was recorded on a kinetic mode for 75 min with T0 = TO addition time. Catalase (25 U/ mL final activity) was used as an internal positive control. Dose response standard curves are calculated according to Equation (5):
CAT - like   index   ( % ) = 100 × ( 35 75 RFU sample 35 75 RFU control 35 75 RFU SAMPLE   MAX   control 35 75 RFU C   control   )
For all conditions, two independent experiments were performed, each on triplicate wells.

2.6. Chemical Antioxidant Capacity of SP4TM by TEAC, FRAP and DPPH Assays

The free radical scavenging activity of SP4TM was measured using both Trolox equivalent antioxidant capacity (TEAC) and DPPH assay, while the metal reducing power was evaluated via Ferric reducing antioxidant power (FRAP) assay. The TEAC and DPPH are two spectrophotometric assays monitoring the ability of antioxidants to scavenge and reduce the colored radical cations (ABTS•+: blue-green; DPPH: violet) into a more stable and colorless compound [53,54,55]. Color loss was monitored at 725 nm and 540 nm for DPPH and ABTS assay, respectively. For each of these assays, dose-response curves were obtained by incubating the proper reaction mix (ABTS assay: 7 mM 2,2′-azino-bis(3-ethylbenzothiazoline-6-sulphonic acid + 2.45 mM K2S2O8; DPPH assay: 0.1mM 2,2-diphenyl-1-picrylhydrazyl) with different concentrations of the analyzed sample. For each concentration, the percentage of antioxidant activity (AA%) was then measured according to Equation (6), and the concentration determining 50% decrease of the initial radical concentration (IC50) was calculated accordingly.
AA % = A blank   A sample A blank × 100
where: Ablank is the absorbance of blank, and Asample the absorbance of sample at 517 nm.
Concerning the FRAP assay, the reaction mixture composed by 300 mM CH3COONa (pH = 3.6), 1 mM 2,4,6-Tris(2-pyridyl)-s-triazine (TPTZ), and 2 mM FeCl3 was added to properly diluted samples of SP4TM. After incubation at 37 °C for one hour, electrophoretic readings were taken at 595 nm against a blank not containing the sample.
For all antioxidant assays described, dose-response curves or calibration curves were created using pure Trolox as standard. Data were then expressed as IC50 (µg/mL) or mmol Trolox Equivalent (TE) per gram of d.wt. All analyses were performed in triplicate.

2.7. In Vitro Bacterial Anti-Adhesion Activity (AAA) of SP4TM

The SP4TM was tested for in vitro bacterial anti-adhesion activity (AAA) on a per weight basis. The SP4TM was suspended (60 mg/mL in PBS, neutralized with 1 N NaOH, diluted serially (2-fold), and tested for bacterial anti-adhesion activity utilizing an HRBC hemagglutination assay specific for uropathogenic P-fimbriated Escherichia coli according to Foo et al. [56]. In particular, tests included measuring ability of SP4TM to suppress agglutination of either HRBCs (A1,Rh+) [57] or latex beads coated with synthetic P receptor analog [58] following incubation with P-fimbriated E. coli. The concentration at which hemagglutination activity was suppressed by 50% was recorded as an indicator of the strength of the bacterial anti-adhesion activity (AAA). Anti-adhesion assays were repeated three times and the results averaged. Controls included wells containing bacteria + PBS, HRBC + PBS, bacteria + test compound, HRBC + test compound, and bacteria + HRBC.

2.8. Statistical Analysis

At least three biological replicates were always performed. An ANOVA followed by Tukey–Kramer’s HSD post-hoc test (p < 0.05) was used to determine significant differences. A nested ANOVA was calculated for fluorometric analyses. All statistical analyses were performed by using the IBM Statistical Package for Social Sciences (SPSS) version 25 (Armonk, New York, NY, USA).

3. Results and Discussion

The search for plant extracts that may exert a strong cellular antioxidant activity led to the formulation of a mixture of polyphenolic compounds that are the base of the SP4TM patent pending formulation (PCT/US2022/021087). Owing to the high potential of SP4TM, we characterized its phytochemical composition and performed a series of antioxidant assays to evaluate both its ability to neutralize free radicals and ROS at the intracellular level and its chemical antioxidant power. Surprisingly, we discovered that the SP4TM formulation has a strong activity against uropathogenic P-fimbriated E. coli by showing a significant bacterial anti-adhesion activity.

3.1. SP4TM Contains a High Level of Total Proanthocyanidins and Other Phenolic Compounds

The phytochemical composition of SP4TM was firstly investigated through spectrophotometric assays aimed at identifying the main classes of polyphenols composing the formulation. In particular, the Folin–Ciocolteu assay, the pH differential method, and the Aluminum Chloride assay were used for the detection and quantification of the total content of polyphenols, anthocyanins, and flavonoids, respectively. In addition, the BL-DMAC assay was used for the quantification of total proanthocyanidin content.
Based on spectrophotometric data, SP4TM formulation is characterized by a high content of phytochemical compounds having at least one hydroxyl group attached to an aromatic ring, as evidenced by the Folin–Ciocolteu assay (Table 1). Specifically, TPC accounts for more than 85% (w/w) of the total weight of the formulation. Comparing TPC value with that previously measured by other authors for common dried fruits [59] or dried fruit extracts [60], SP4TM demonstrates a 5 to 10-fold higher content of polyphenols.
Because of the characteristic action mechanism of the Folin–Ciocolteau assay, which is based on the reduction of molybdenum and tungsten salts in blue-colored complexes, the spectrophotometric quantification is strongly affected by the presence of other compounds having at least one hydroxyl group linked to an aromatic ring, such as aromatic amino acids, proteins, and organic acids. Consequently, to selectively estimate the contribution of other phytochemicals, specific spectrophotometric assays were performed. In particular, TFC was estimated through a complexation reaction between the aluminum, the C4 keto group of the flavonoid scaffold, and the ortho-dihydroxyl groups of the A- or B-ring [61], whereas TAC was calculated by exploiting the peculiar characteristic of anthocyanidic compounds to have a red coloration in acidic (pH = 1) environment and to be uncolored in slightly acid (pH = 4.5) environment [62]. The TPAC was evaluated by reaction with the DMAC reagent that selectively reacts with condensed flavan-3-ols having the C2-C3 linkage of the flavonoid C-ring lacking in double bond [63]. The data obtained from these spectrophotometric assays suggested that although the anthocyanin and flavonoid content was modest (about 5% (w/w) and 13% (w/w) of the total dry weight, respectively), SP4TM was characterized by a very high content of total proanthocyanidins. Indeed, when the formulation was tested with the BL-DMAC method, the quantification based on the PAC-A2 standard accounted for the 38% of the total weight, whereas the same analysis performed by using c-PAC as a standard yielded a 74% value. The c-PAC standard has been developed specifically to address needs for more accurate quantification of soluble PAC in cranberry (Vaccinium macrocarpon) products [48]. Although c-PAC standard has not yet been validated for the quantification of proanthocyanidins from sources other than cranberry [64], the quantification based on the universally recognized PAC-A2 standard confirms that SP4TM possesses a high content of proanthocyanidins.

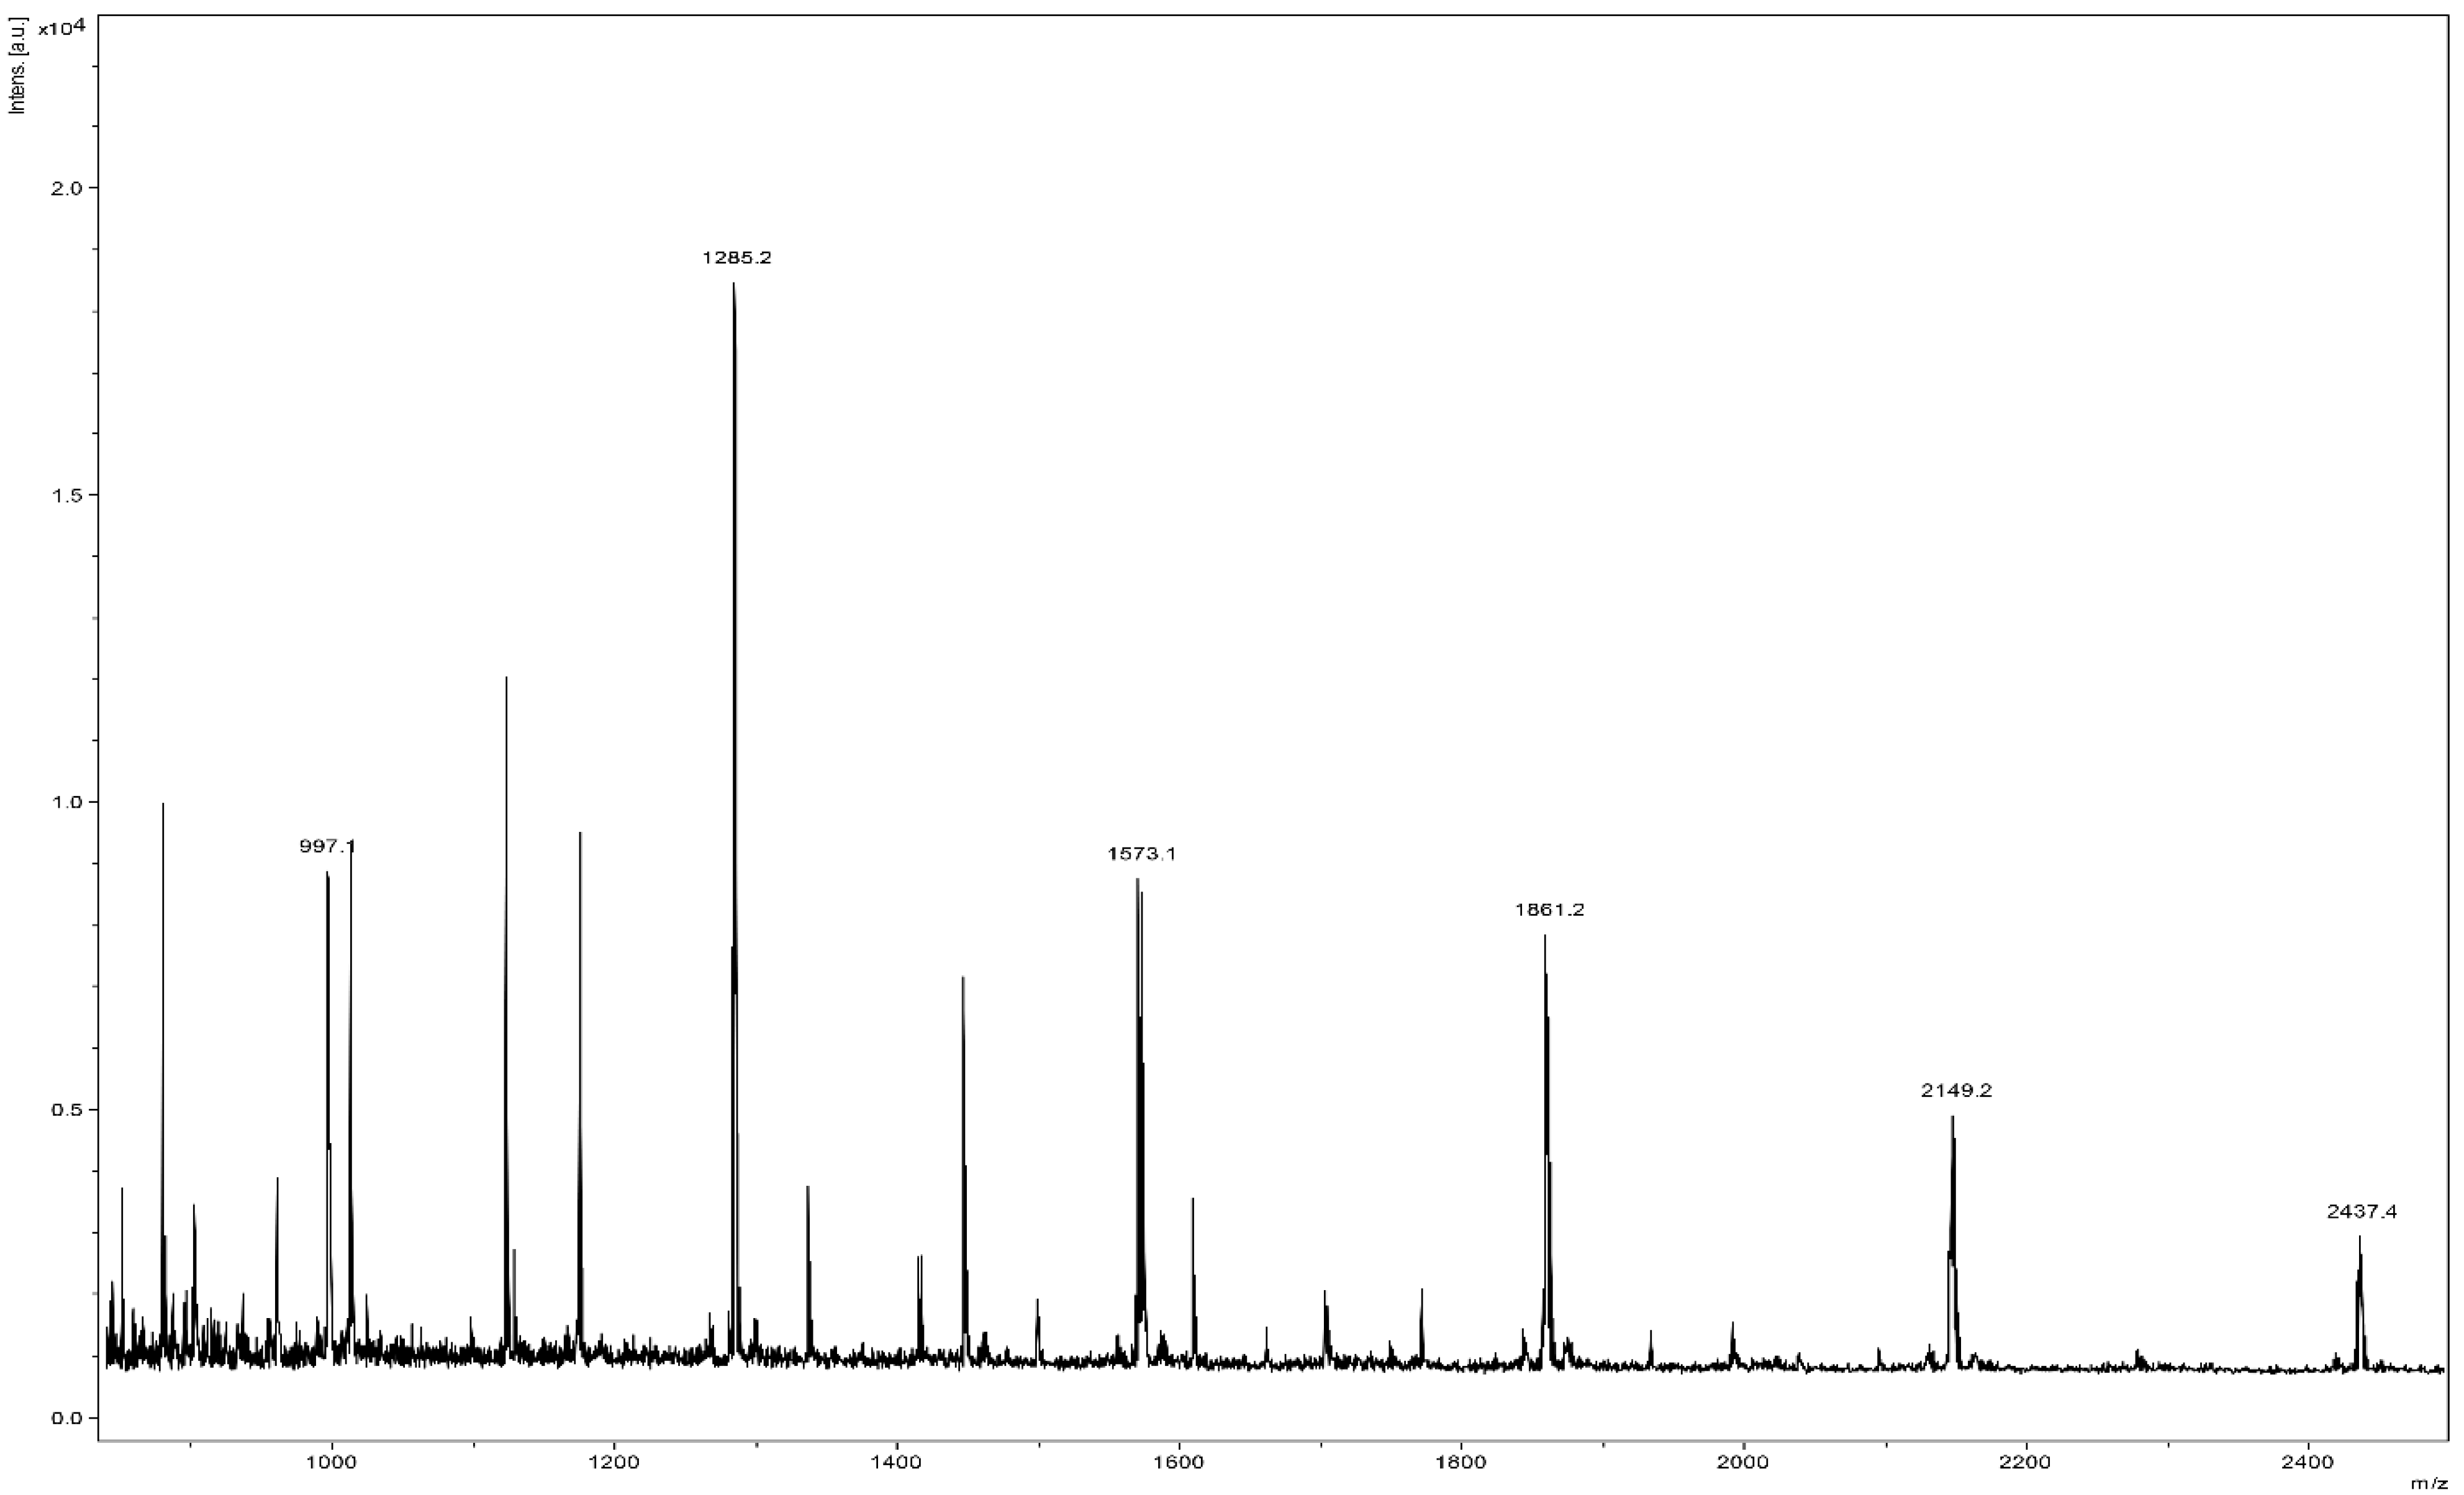
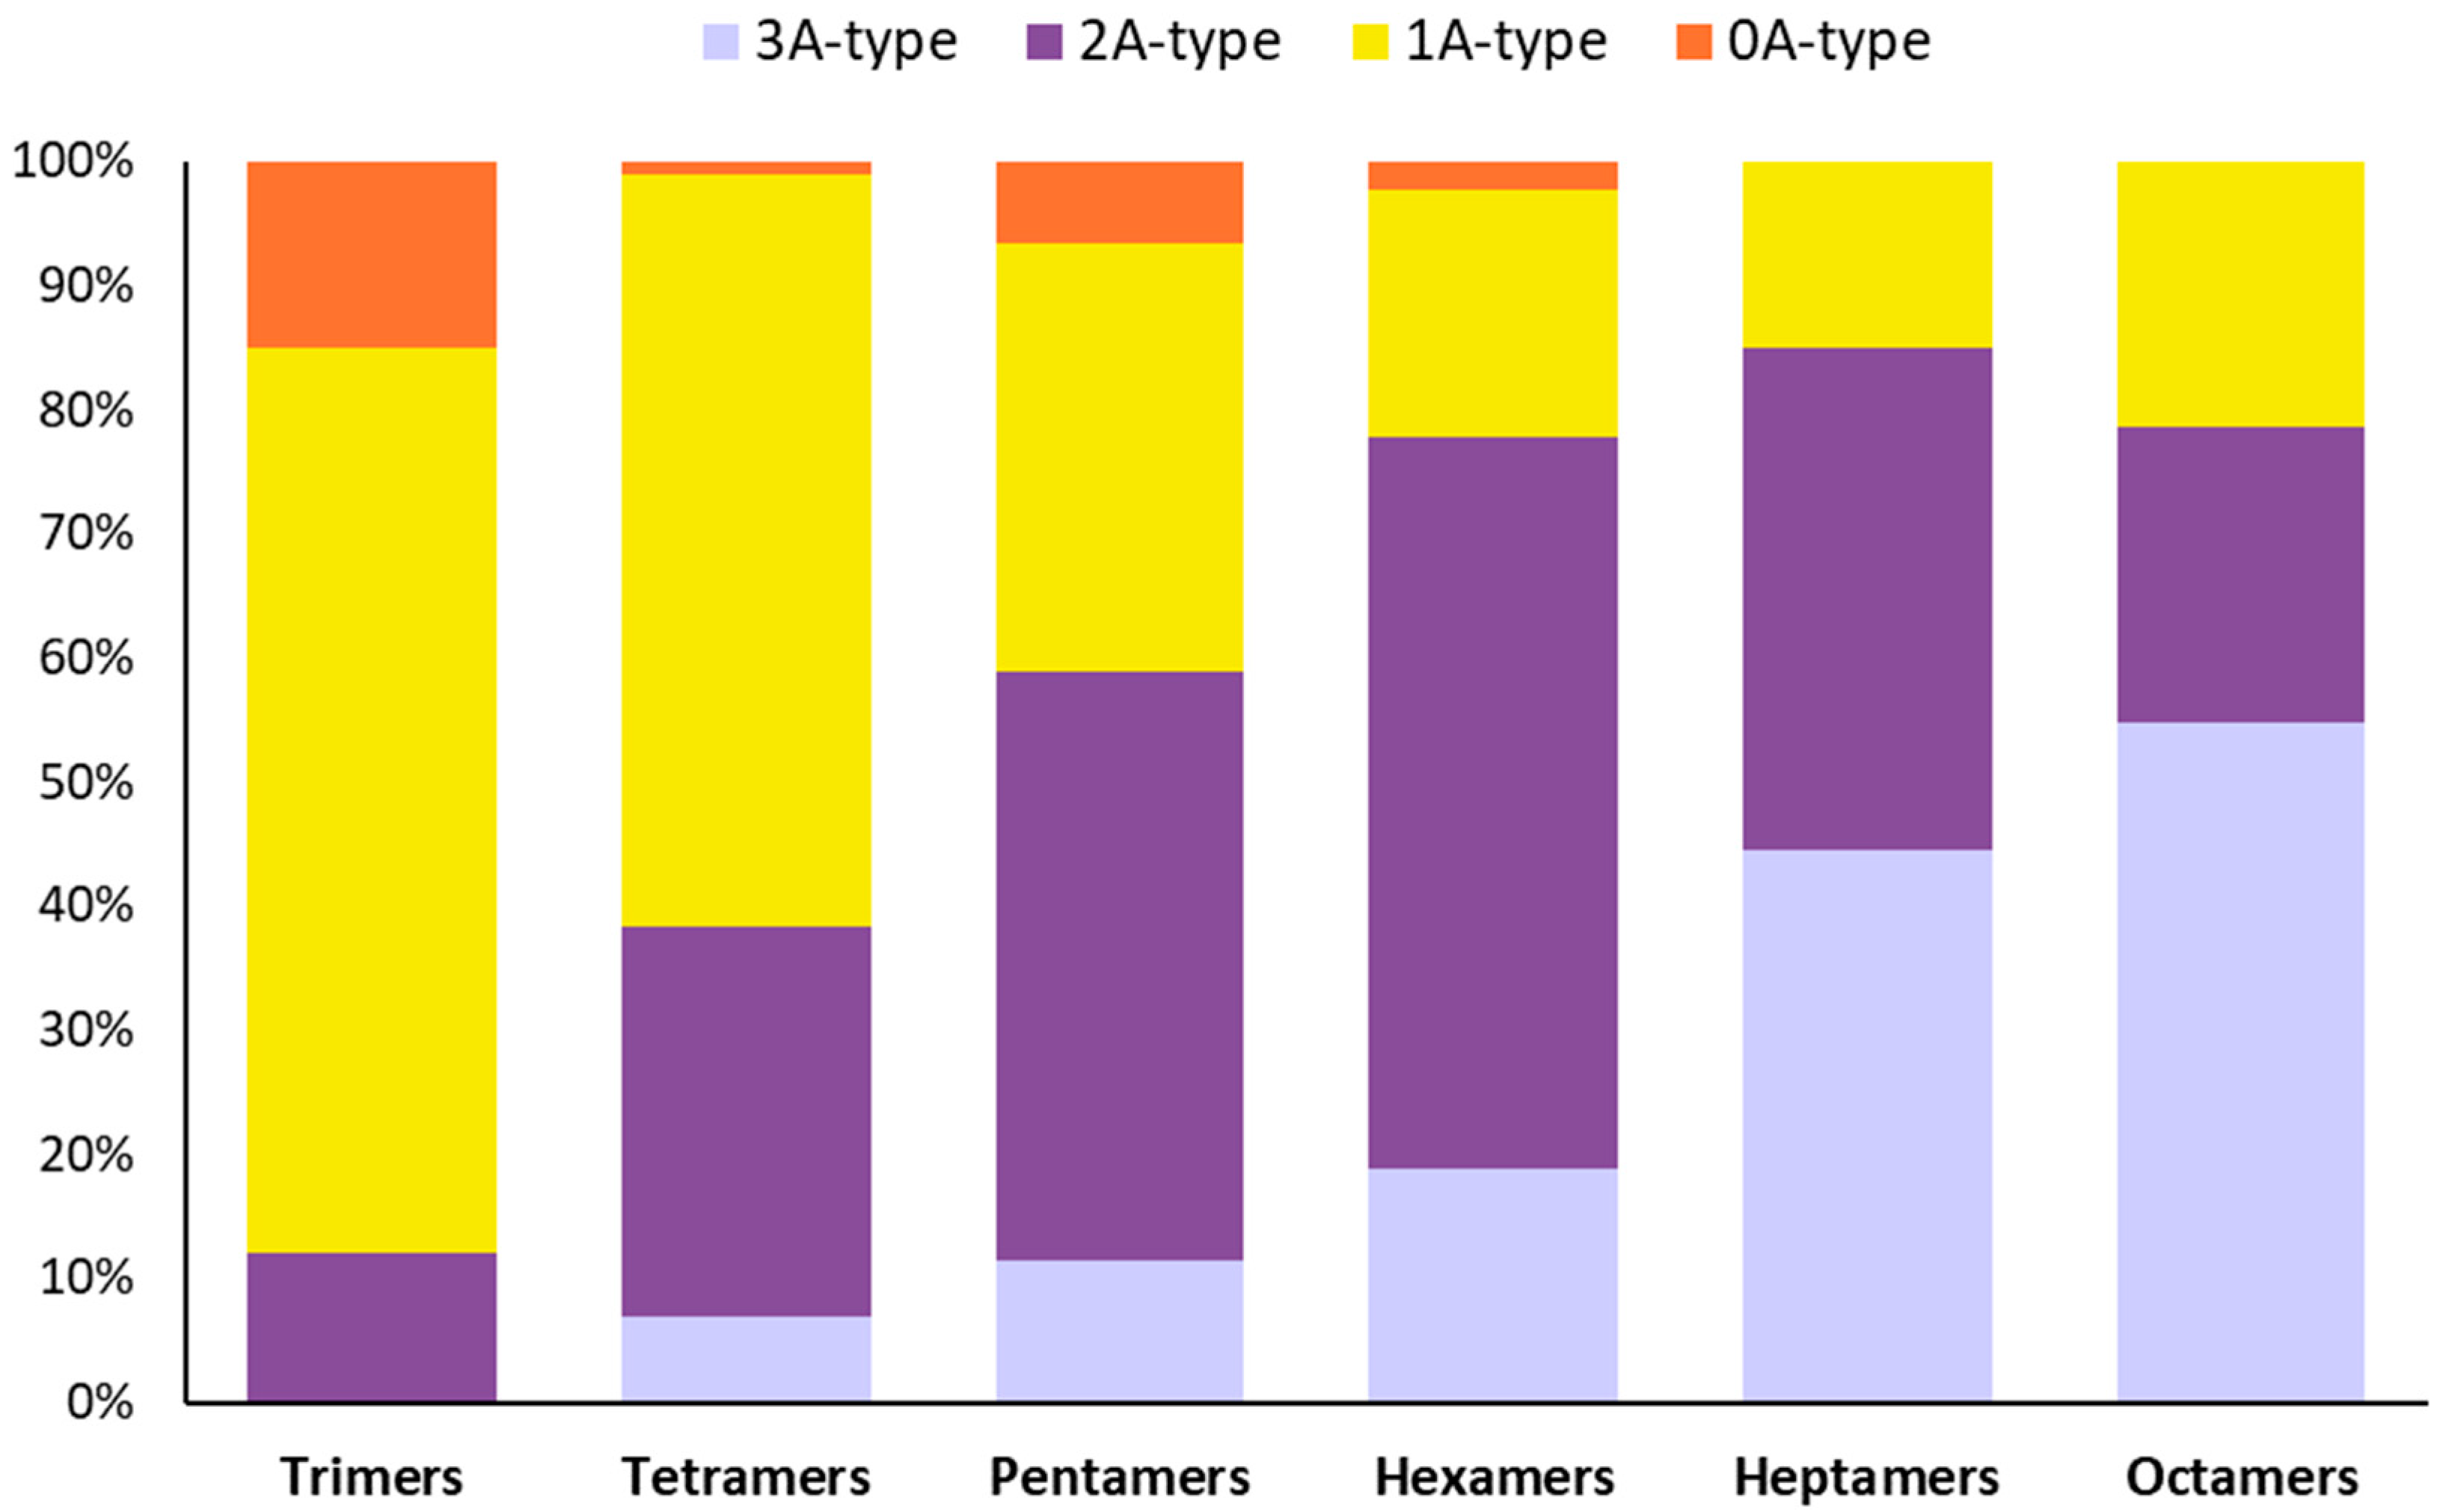
3.2. The Chemical Characterization of SP4TM by MALDI-TOF MS Shows a High Percentage of Type-A- PACs and the Presence of an Oligosaccharide

The MALDI-TOF MS is ideally suited for characterizing polydispersed oligomers and is considered the mass spectral method of choice for analysis of PAC, which exhibit large structural heterogeneity. The observed masses (m/z) correspond to the monoisotope of the predicted compound. For example, the predicted and observed monoisotope of a PAC trimer is (m/z 887) representing the contribution of 12C, 1H and 16O to the molecule. The mass at (m/z 890) represents two 13C, or one 13C and one 2H, or one 18O, or two 2H. Mass calculating programs such as IsoPro 3.0 are used to predict the isotopic distribution of compounds and allow for comparison between predicted and observed isotopic distributions [65]. The MALDI-TOF MS separates molecular ions in the flight tube and allows baseline detection of a broad range of PAC oligomers over the degree of polymerization (DP) range of 2 to >23.
The molecular weight difference between a Type-B interflavan bond and an A-type interflavan bond is due to the loss of two hydrogen atoms (Δ 2 amu) in forming the ether linkage. The observed masses (m/z) correspond to the monoisotope of the predicted compound. We used the mass calculating programs IsoPro 3.0 to predict the isotopic distribution of compounds and to compare predicted and observed isotopic distributions [65].
A series of PACs, which vary only in the ratio of type-A to -B interflavan bonds, produces mass spectra with overlapping isotope patterns for each individual oligomer. An understanding of the natural abundance of C, H, and O isotopes within PAC oligomers allowed us to determine the ratios of type-A to -B interflavan bonds in PACs by applying matrix algebra to deconvolute overlapping MALDI-TOF MS isotope patterns. Precision and accuracy were validated for binary mixtures of procyanidins A2 and B2 as early reported [49].
Prior to analysis, SP4TM was deionized with a strong cation exchange resin and spiked with cesium trifluoroacetate (0.01M). The PACs are detected as cesium ion adducts [M+Cs]+.
Positive reflectron mode MALDI-TOF MS shows the presence of a PAC DP series from the trimer (m/z 997) to octamer (m/z 2437). The labeled masses at each degree of polymerization are representative of a PAC structure that contains one or more type-A interflavan bonds (Figure 1).
Deconvolution of positive reflectron mode MALDI-TOF MS shows PACs at DP (3–4) containing predominantly one or more type-A interflavan bonds (Figure 2 and Table 2). PACs at DP (5–7) contain predominantly two or more type-A interflavan bonds, whereas PACs at DP (8) contain predominantly three or more type-A interflavan bonds.
The MALDI-TOF MS also tentatively identified an oligosaccharide series of repeating hexoses from 5 DP (m/z 851) to 12 DP (m/z 1985). The hexose has a molecular weight of 180 and the additive mass of each additional hexose is 162 atomic mass units, the difference of 18 amu is due to the loss of water during each extension of the oligosaccharide chain. Despite deionization and subsequent spiking with Cesium trifluroacetate the oligosaccharides appear to be preferably detected as sodium ion adducts [M+Na]+, indicating that this class of compounds has a higher affinity for sodium ion than PACs (See Figure S1). The MALDI-TOF MS results indicate that SP4TM contains a PAC series in which the most predominant masses correspond to a compound with one or more type-A interflavan bonds at each degree of polymerization. The proportion of multiple type-A bonds increases as the DP increases. The large percentage content of type-A PACs, especially at high DP levels, should not be underestimated. Indeed, from a biological point of view, type-A PACs have shown a better bioactivity than type-B ones, probably due to the extra bond between subunits of type-A procyanidins, which increase their rigidity [63,66]. Moreover, considering that the ecological distribution of type-A PACs is quite limited in the plant kingdom [63], the percentage composition of SP4TM formulation is very interesting. Indeed, although several and different plant genera are able to control the stereochemistry of flavanols via the reduction of leucoanthocyanidins or anthocyanins to the respective 2R,3S-flavan-3-ols or 2R,3R-flavan-3-ols thanks to the action of leucoanthocyanidin reductase (LAR; EC 1.17.1.3) or anthocyanins reductase (ANR; EC 1.3.1.77), not all plants are subsequently able to regulate the formation of type-A or type-B PACs during polymerization process [63].
Additionally, SP4TM appears to contain an oligosaccharide (hexose) series from the pentamer to the dodecamer, which chemical characterization is under study and will be reported soon.

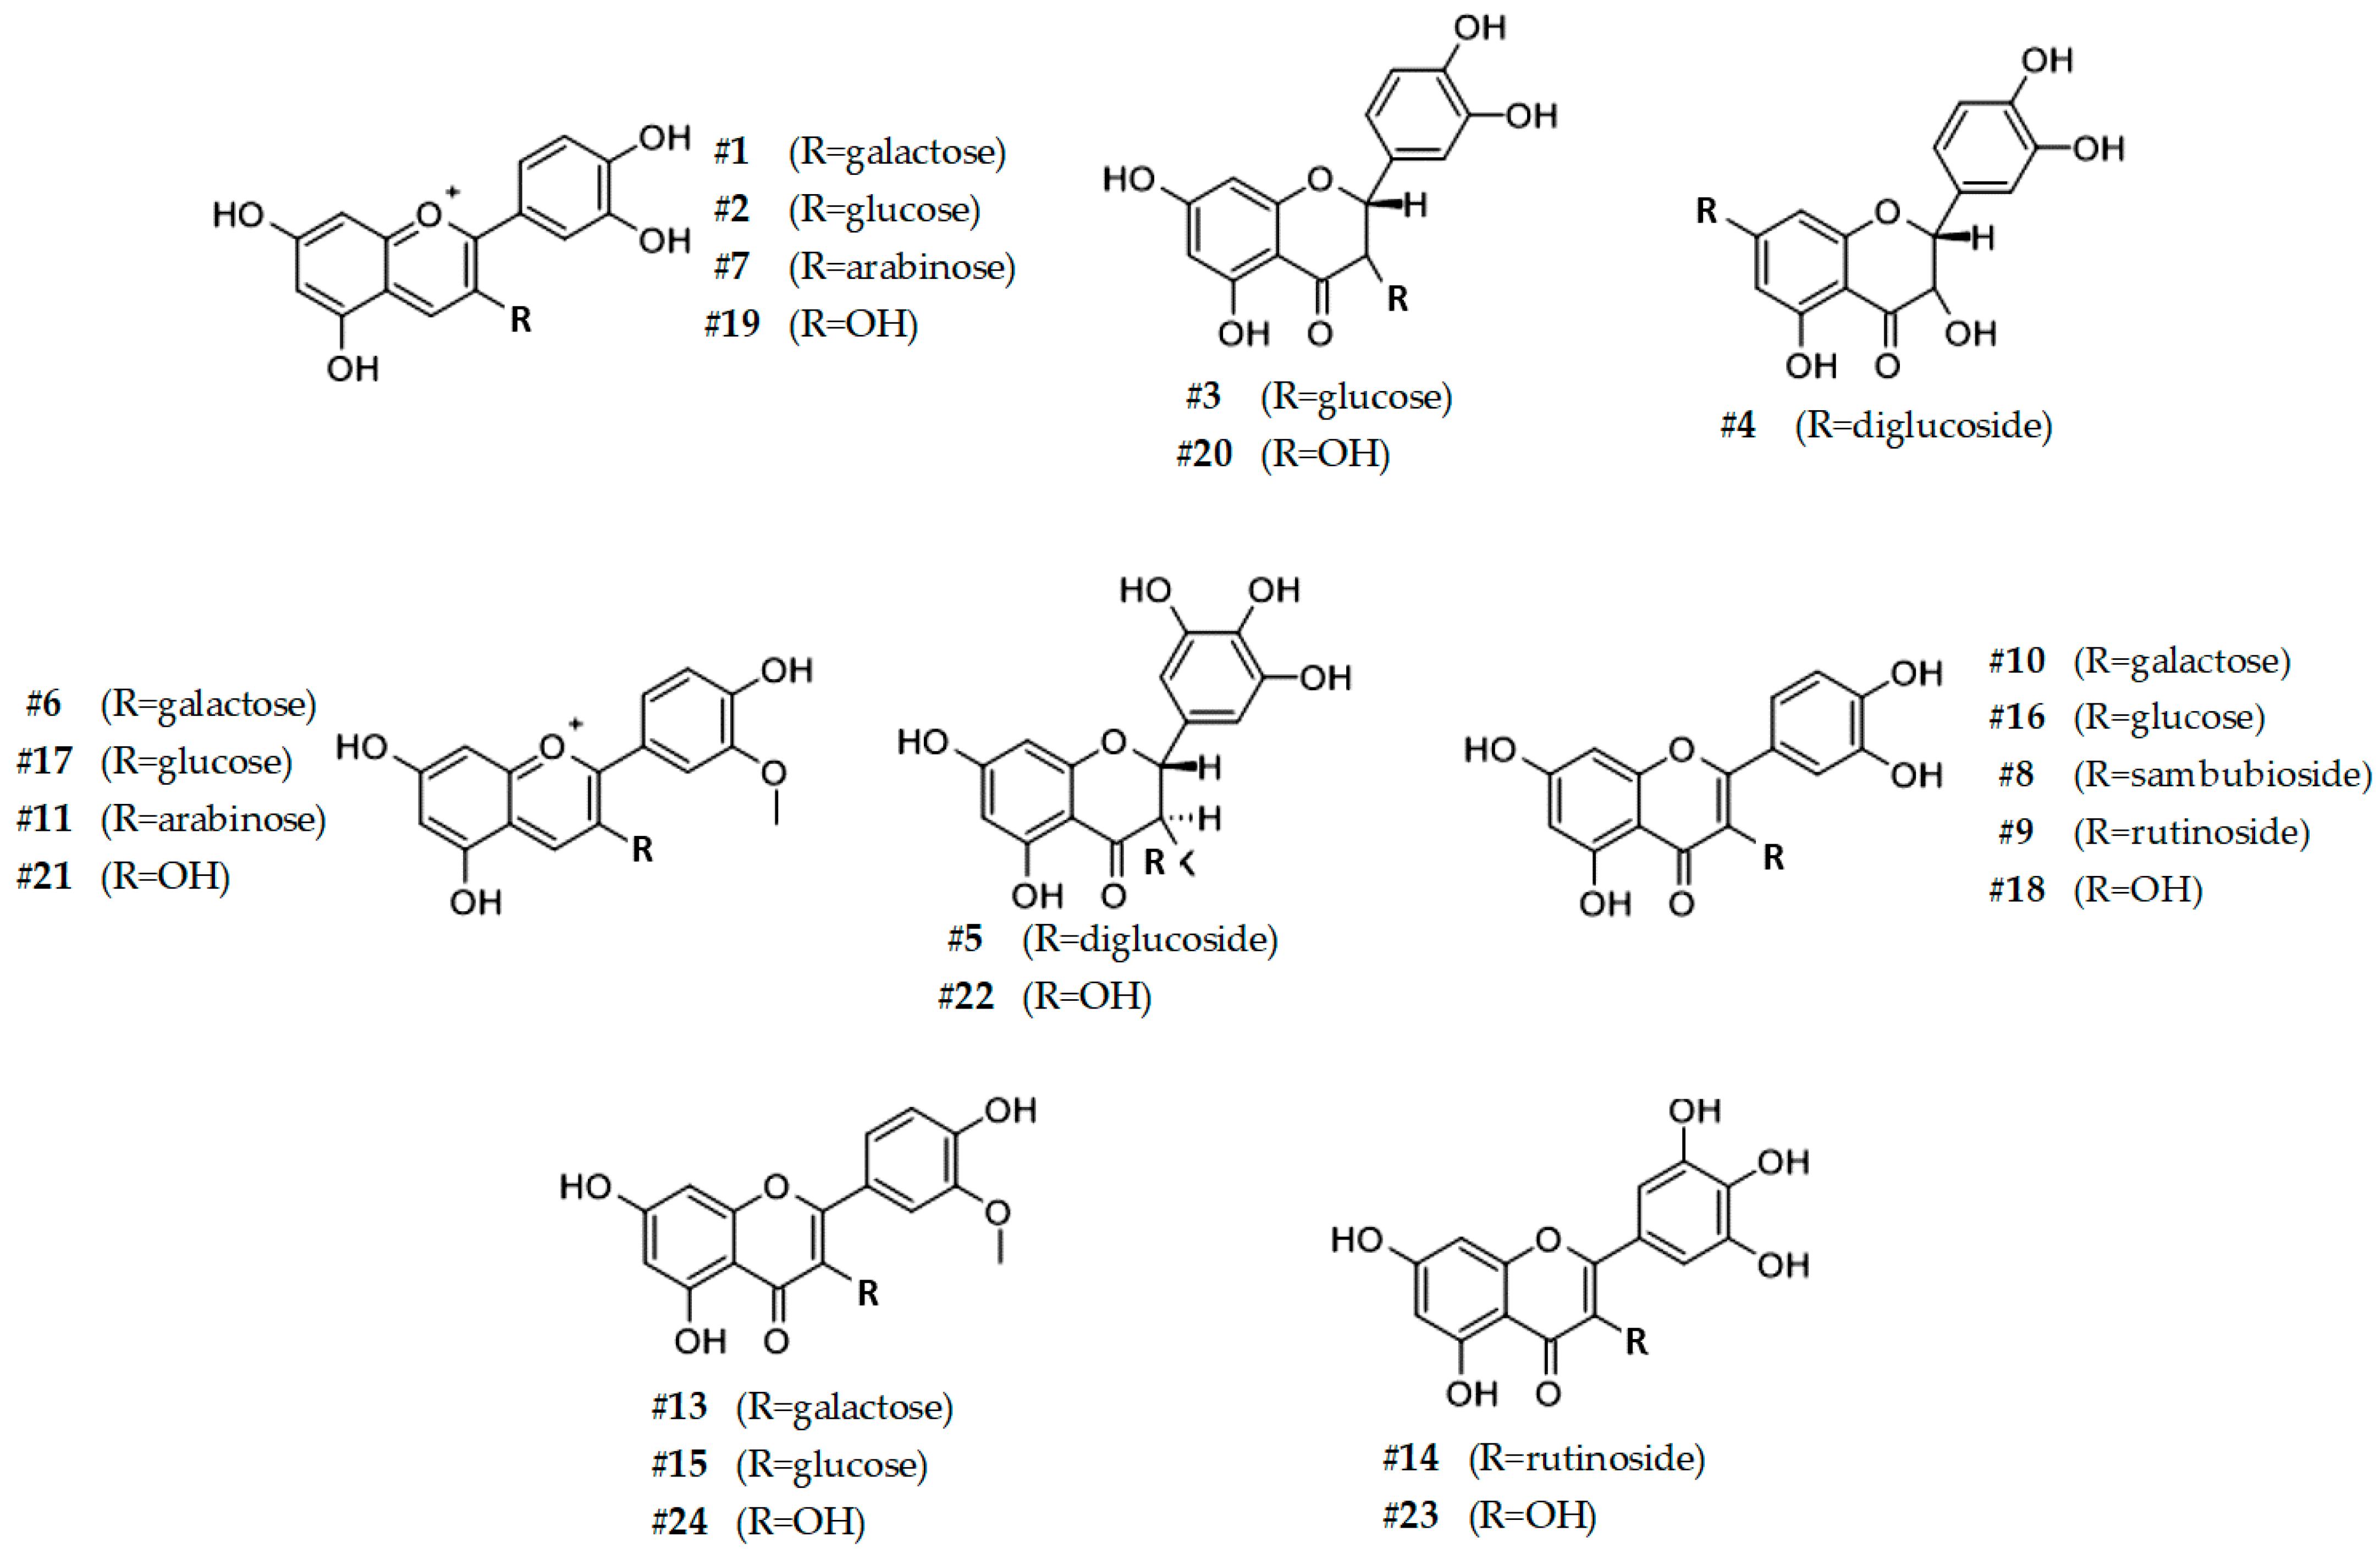
3.3. HPLC-DAD-ESI-MS/MS Analysis of SP4TM Reveals the Presence of Other Phenolic Compounds

In order to identify and quantify other polyphenolic compounds present in the SP4TM formulation, HPLC coupled with DAD and an Ion Trap Mass Spectrometer was used. The detected compounds, along with their retention times (RT), charged molecular weight (m/z), mass fragmentations (MS/MS), characteristic absorption wavelength (λ), and analytical quantification (mg g−1 d.wt) are reported in Table 3. Moreover, the corresponding chemical structure is shown in Figure 3.
Chromatographic analysis revealed the presence of 8 anthocyanins (46.96 ± 1.59 mg g−1 d.wt), 5 flavanols (100.77 ± 3.90 mg g−1 d.wt), and 11 flavonols (59.96 ± 1.83 mg g−1 d.wt), for a total of 204.11 ± 7.32 mg g−1 d.wt. Anthocyanins are a special class of phytochemicals that are characterized by a positive charge in the flavonoid scaffold. From an ecological point of view, anthocyanin compounds from flowers have the important function of enchanting pollinating insects or animals due to their wide range of coloration, which mainly depends on the pH of the environment in which they are solubilized [67].
Thanks to their UV-screening properties and antioxidant characteristics, anthocyanidic compounds are attracting the interest not only of the pharmaceutical and cosmetic industry, but also of the modern consumer, who is more and more careful to include in the diet bioactive plant compounds with potential beneficial effects on own well-being [63]. Among the identified anthocyanins, cyanidin (#19) and its O-methylated form peonidin (#21) were detected, along with their respective glycoside (#2 and #17), galactoside (#1 and #6), and arabinoside (#7 and #11) conjugates. In accordance with the spectrophotometric analyses discussed in the previous section, LC-MS confirmed the total identified anthocyanins accounted for more than 4% (w/w) of the dried weight of the SP4TM formulation. In particular, cyanidin (#19) and its glycosides forms [idaein (#1), chrysanthemin (#2), and cyanidin 3-O-arabinoside (#7)] reached almost 90% (w/w) of the identified anthocyanins. These data suggest that peonidin derivatives might contribute little to the TAC value measured via pH differential method.
In SP4TM formulation, the pentahydroxyflavanone taxifolin (#20) and its 3-O-diglycosid (#3) and 7-O-diglycosid (#4) forms accounted for 26.26 ± 0.95 mg g−1 d.wt. However, the most abundant flavanol in SP4TM formulation was the tetrahydroxyflavanone dihydromyricetin (#22) and its 3,4′-diglucoside conjugate (#5) (Table 3). Concerning the respective flavonols, most of the identified compounds were tetrahydroxyflavonols. In particular, six of them were sugar-conjugates of quercetin (#18), namely rutin (#9), hyperoside (#10), miquelianin (#12), isoquercitrin (#16), and its sambunoside derivate (#8). In addition, another tetrahydroxyflavonol was identified as isorhamnetin (#24), which is the O-methylated form of #18. Notably, compound #24 was also detected in both galactosidate (#13) and glucosidate (#15) forms. The remaining two flavonols, were the tetrahydroxyflavanol myricetin (#23) and its rutinoside conjugate (#14). Most of the quantified polyphenolic compounds belong to the flavanol class, together reaching about 50% (w/w) of the total identified polyphenols. Flavanols are characterized by having both a ketone and a hydroxyl group respectively bound to C4 and C3 of the C-ring of the flavonoid core. In addition, unlike their respective flavonols, these phytochemicals have the saturated C2-C3 bond [68]. The presence of the C2-C3 double bond in other flavonoids is very crucial not for the antioxidant properties, which are mainly due to the presence of hydroxyl groups on the chemical scaffold, but for the potential bioactivity towards other biological macromolecules, such as enzymes. Flavanols, lacking this bond, are very susceptible to inactivation through the formation of strong hydrogen bonds with macromolecules. However, it has also been documented that the presence of the hydroxyl group in the C3 of the C-ring, as well as the orthogonal arrangement of the catechol, is responsible for both the modulatory effect against neutrophil oxidative burst and the self-assembly of amyloid β protein [69,70].

3.4. The Antioxidant Power of SP4TM by Cell-Based Methods on HepG2 Human Liver Cell Models Reveals a Strong Intracellular Free Radical Quenching Activity

Having assessed the phytochemical profile of SP4TM, we tested its potential radical scavenging activity by using the LUCS technology on HepG2 cells. The LUCS assay measures the ability of an antioxidant to neutralize the oxidative stress at the cellular level [52]. The LUCS assay is based on the production of cellular radical species following the addition in the human hepatocellular carcinoma (HepG2) cells culture medium of thiazole orange (TO), a photo-inducible fluorescent nucleic acid biosensor [71]. The approach has been standardized on high throughput 96-well plates to allow reliable statistical analyses.
The SP4TM showed an antioxidant effect in human HepG2 liver cells. Both direct and indirect antioxidant activities were assayed. Direct antioxidant activity (neutralization of intracellular free radicals) shows and antioxidant index of 984/1000 at 390.5 μg/mL whereas the CAA Index (max. 100) was 64.08 at 25 mg/mL. Comparing the CAA value obtained during our experiments with that reported by Wolfe for commonly consumed fruits [72], SP4TM recorded a higher value than fruits known to have a potent antioxidant action, such as wild blueberry (292.0 ± 11.0), pomegranate (250.0 ± 10.0), blackberry (232.0 ± 11.0), strawberry (136.0 ± 18.0), and blueberry (128.0.0 ± 30.0) [73].
Figure 4 illustrates the kinetic data used to calculate the antioxidant power of SP4TM in HepG2 cells (Table 4) by using the LUCS approach. The assays demonstrate a direct antioxidant activity of SP4TM with a maximum effect for intracellular free radical quenching and a neutralization of intracellular free radicals with an EC50 of 30.11 μg/mL, followed by a H2O2 quenching effect with an EC50 of 596 μg/mL and to a lesser extent, an inhibition of plasma membrane based lipid peroxidation with an EC50 of 7.81 mg/mL.
We can range the different direct antioxidant effects as follows (max to min): intracellular free radical quenching >> H2O2 quenching >> lipid peroxidation inhibition.
A direct comparison of the obtained data with data from the literature indicates that SP4TM possesses a similar antioxidant activity of BHA (31.54 μg/mL and BHT (34.25 μg/mL, twice as much the antioxidant activity of resveratrol (64.66 μg/mL, 4.5 times that of Trolox (138.50 μg/mL and 20.7 times the antioxidant activity of epicatechin [74]. The antioxidant properties observed during the experimentation assessed on the cell model system suggest a high potential of SP4TM in balancing the redox status of HepG2 cells. In particular, Figure 4 shows how the formulation is able to neutralize not only free radicals (Panel A), but also to quench non-radical reactive oxygen species (Panel E), thus preventing and counteracting an excessive peroxidation of cell membrane lipids (Panel C).

3.5. Chemical Antioxidant Analysis of SP4TM Confirm Its High Antioxidant Capacity

In order to elucidate the potential mechanism of action of the observed antioxidant effect at the cellular level, we performed three spectrophotometric assays evaluating the radical scavenging and metal reducing capacity through in solution assay (Table 5).
The DPPH and ABTS spectrophotometric assays are based on a decolorization principle. These molecules are powerful synthetic chemical radicals, not constitutive of a biological environment such as the cellular one. However, the various antioxidant compounds, such as polyphenols, can scavenge by electron- or hydrogen-transfer mechanisms reducing them in colorless molecules. The DPPH and ABTS assays have different specificities and kinetics. The DPPH is much more selective for small molecules, such as polyphenol aglycones, because the radical site of the molecule is stereochemically less accessible than the radical ABTS. On the other hand, ABTS has two different radical sites, and it can efficiently react with both hydrophilic and lipophilic moieties. However, it is poorly sensitive to phytochemical compounds that reduce radicals via hydrogen atom donation mechanism [75]. The mechanism of action evaluated in the FRAP assay is different. This spectrophotometric assay evaluates the ability of compounds having ortho- or meta-oriented hydroxyl groups to chelate and reduce oxidized metals. Specifically, FRAP measures the reductive capacity towards FE(III) which is reduced to Fe(II) [76]. Regarding SP4TM, spectrophotometric analyses revealed that FRAP >>> ABTS > DPPH (Table 5), suggesting that the main antioxidant mechanism could be reduction by chelation. Indeed, according to chromatographic analyses, almost all identified compounds had at least two ortho- or meta-oriented hydroxyl groups linked to the flavonoid A-ring, with the exception of O-methylated anthocyanin #21 and O-methylated flavonol #24, along with their corresponding conjugates (#6, #11, #13, #15, and #17). Comparing the values obtained from the antioxidant assays on SP4TM on those previously obtained from common fresh fruits [77], SP4TM shows a 100 to 300-fold higher antioxidant potential. Partially, this great difference can be certainly explained by the high water content of fresh fruits, ranging between 90% and 98% of the whole fruit. However, even correcting the values for the water content of each type of fruit, SP4TM would show values about 10-fold times higher.

3.6. SP4TM Shows a Strong In Vitro Bacterial Anti-Adhesion Activity against Uropathogenic P-Fimbriated E. coli

Urinary tract infections (UTIs) are the most common bacterial diseases affecting the world population each year. Among the usual uropathogens correlated to UTIs, uropathogenic Escherichia coli (UPEC) is the primary cause [19]. The administration of antibiotics, including fluoroquinolones, is commonly suggested in frequent and severe infections, but the risk of these medications generally outweighs the benefits of treatment [78]. For this reason, patients with a moderate and/or recurrent clinical picture of UTI, prefer the use of natural remedies, as they perceived safer and with fewer side problems [79]. In literature, it is reported that many people use cranberry juice to prevent UTIs. Indeed, there are several therapeutic indications that suggest that this fruit has a beneficial action due to the presence of type-A PACs [56,64,80]. Consequently, in addition to evaluating the antioxidant potential of SP4TM formulation, we decided to investigate its potential ability to prevent bacterial adhesion of E. coli by microbiological assay. Our results demonstrate that the final concentration at which anti-adhesion activity could be detected in SP4TM was 0.23 mg/mL. The value of 0.23 mg/mL is consistent with results obtained from other juice-based column-extracted cranberry powders tested. A direct comparison with organic cranberry juice powder (30 mg/mL), high PAC level cranberry extracts (0.47 mg/mL), low PAC level cranberry extracts (3.5–7.5 mg/mL), bacterial anti-adhesion activity of the commercial cranberry powder (measured by MRHA activity, 0.47 mg/mL) [80,81,82] and some fruit extracts of chosen Rosaceae family species (20–80 mg/mL) [83] indicates that SP4TM, with 0.23 mg/mL possesses a very high antiadhesion activity towards uropathogenic P-fimbriated E. coli.

4. Conclusions

The results of this work indicate that SP4TM, a patented formulation based on a mixture of plant extracts with a high content of bioactive polyphenols, shows an interesting antioxidant potential when tested by both chemical and cellular assays. In particular, the formulation was able to protect HepG2 cells from OS through different mechanisms of action, such as neutralization of intracellular free radicals, inhibition of plasma membrane lipid peroxidation, quenching of H2O2, and reduction of free radicals mainly through chelating mechanism. Furthermore, phytochemical analyses, in addition to revealing the presence of 24 different polyphenolic compounds, showed that most of the identified PACs had type-A binding. Notably, the proportion of multiple type-A bonds improved as the degree of polymerization increased. The real antioxidant potential of SP4TM involving multitarget mechanisms indicates that SP4TM is an interesting formulation that may find applications for the nutraceutical industry, with particular reference to the production of dietary supplements aimed to alleviate OS. Due to the presence of a high content of type-A PACs, the SP4TM was found to strongly exert an anti-adhesion activity against uropathogenic P-fimbriated E. coli, providing preliminary evidence of its potential use for the treatment of urinary tract infections.

5. Patents

This work is based on the formulation SP4TM for which a patent is pending: PCT/US2022/021087.

Supplementary Materials

The following supporting information can be downloaded at https://www.mdpi.com/article/10.3390/antiox11071234/s1. Figure S1: Positive reflectron mode MALDI-TOF MS showing the oligosaccharide series of repeating hexoses from 5 degrees of polymerization (m/z 851) to 12 degrees of polymerization (m/z 1985). Masses are detected as sodium ion adducts [M+Na]+.

Author Contributions

Conceptualization, methodology, validation, formal analysis, investigation, data curation, writing—original draft preparation, writing—review and editing, visualization: G.M. and M.E.M.; project administration, supervision, resources, funding acquisition, M.E.M. All authors have read and agreed to the published version of the manuscript.

Funding

This research was partly funded by the local research funds assigned to M.E.M. and by Tintoria Piana U.S.

Institutional Review Board Statement

Not applicable.

Informed Consent Statement

Not applicable.

Data Availability Statement

The data presented in this study are available on request from the corresponding author, due to patent pending (PCT/US2022/021087).

Conflicts of Interest

The authors declare no conflict of interest. The funders had no role in the design of the study; in the collection, analyses, or interpretation of data; in the writing of the manuscript; or in the decision to publish the results.

References

  1. Pennathur, S.; Hecker, L.; Thannickal, V.J. Oxidative stress and cardiovascular fibrosis. In Studies on Cardiovascular Disorders; Sauer, H., Shah, A.M., Laurindo, F.R.M., Eds.; Springer: New York, NY, USA, 2010; pp. 425–441. [Google Scholar]
  2. Dozor, A.J. The role of oxidative stress in the pathogenesis and treatment of asthma. In Oxidative/Nitrosative Stress and Disease; Laskin, D.L., Ed.; Wiley-Blackwell: Malden, MA, USA, 2010; Volume 1203, pp. 133–137. [Google Scholar]
  3. Hoeschen, R.J. Oxidative stress and cardiovascular disease. Can. J. Cardiol. 1997, 13, 1021–1025. [Google Scholar] [PubMed]
  4. Ivan, P.; Anna, J.; Zeno, A.; Istvan, K.; Balazs, N. Psoriasis and oxidative stress. Orv. Hetil. 2016, 157, 1781–1785. [Google Scholar]
  5. Ward, N.C.; Croft, K.D. Hypertension and oxidative stress. Clin. Exp. Pharmacol. Physiol. 2006, 33, 872–876. [Google Scholar] [CrossRef] [PubMed]
  6. Haskins, K.; Bradley, B.; Powers, K.; Fadok, V.; Flores, S.; Ling, X.F.; Pugazhenthi, S.; Reusch, J.; Kench, J. Oxidative stress in type 1 diabetes. In Immunology of Diabetes II: Pathogenesis from Mouse to Man; Sanjeevi, C.B., Eisenbarth, G.S., Eds.; New York Acad Sciences: New York, NY, USA, 2003; Volume 1005, pp. 43–54. [Google Scholar]
  7. Ozturk, Z. Diabetes, oxidative stress and endothelial dysfunction. Bezmialem Sci. 2019, 7, 52–57. [Google Scholar] [CrossRef]
  8. Vital, P.; Castro, P.; Ittmann, M. Oxidative stress promotes benign prostatic hyperplasia. Prostate 2016, 76, 58–67. [Google Scholar] [CrossRef] [PubMed] [Green Version]
  9. Roumeguere, T.; Sfeir, J.; El Rassy, E.; Albisinni, S.; Van Antwerpen, P.; Boudjeltia, K.Z.; Fares, N.; Kattan, J.; Aoun, F. Oxidative stress and prostatic diseases. Mol. Clin. Oncol. 2017, 7, 723–728. [Google Scholar] [CrossRef] [PubMed] [Green Version]
  10. Rottkamp, C.A.; Nunomura, A.; Raina, A.K.; Sayre, L.M.; Perry, G.; Smith, M.A. Oxidative stress, antioxidants, and alzheimer disease. Alzheimer Dis. Assoc. Dis. 2000, 14, S62–S66. [Google Scholar] [CrossRef]
  11. Chernyak, B.V.; Popova, E.N.; Prikhodko, A.S.; Grebenchikov, O.A.; Zinovkina, L.A.; Zinovkin, R.A. COVID-19 and oxidative stress. Biochemistry 2020, 85, 1543–1553. [Google Scholar] [CrossRef]
  12. Vicari, E.; La Vignera, S.; Calogero, A.E. Oxidative stress and infection. In Studies on Mens Health and Fertility; Agarwal, A., Aitken, R.J., Alvarez, J.G., Eds.; Springer: New York, NY, USA, 2012; pp. 551–570. [Google Scholar]
  13. Grant, S.S.; Hung, D.T. Persistent bacterial infections, antibiotic tolerance, and the oxidative stress response. Virulence 2013, 4, 273–283. [Google Scholar] [CrossRef] [Green Version]
  14. Bandyopadhyay, D.; Mukherjee, M. Reactive oxygen species and uspa overexpession: An alternative bacterial response toward selection and maintenance of multidrug resistance in clinical isolates of uropathogenic E. Coli. Eur. J. Clin. Microbiol. Infect. Dis. 2020, 39, 1753–1760. [Google Scholar] [CrossRef]
  15. Foxman, B. Epidemiology of urinary tract infections: Incidence, morbidity, and economic costs. Am. J. Med. 2002, 113, 5s–13s. [Google Scholar] [CrossRef]
  16. Aubron, C.; Glodt, J.; Matar, C.; Huet, O.; Borderie, D.; Dobrindt, U.; Duranteau, J.; Denamur, E.; Conti, M.; Bouvet, O. Variation in endogenous oxidative stress in Escherichia Coli natural isolates during growth in urine. BMC Microbiol. 2012, 12, 10. [Google Scholar] [CrossRef] [PubMed] [Green Version]
  17. Molina-Quiroz, R.C.; Silva-Valenzuela, C.; Brewster, J.; Castro-Nallar, E.; Levy, S.B.; Camilli, A. Cyclic amp regulates bacterial persistence through repression of the oxidative stress response and sos-dependent DNA repair in uropathogenic escherichia coli. mBio 2018, 9, 10. [Google Scholar] [CrossRef] [PubMed] [Green Version]
  18. An, L.Y.; Wu, W.Z.; Li, S.J.; Lai, Y.C.; Chen, D.; He, Z.C.; Chang, Z.L.; Xu, P.; Huang, Y.P.; Lei, M.; et al. Escherichia coli aggravates calcium oxalate stone formation via ppk1/flagellin-mediated renal oxidative injury and inflammation. Oxidative Med. Cell. Longev. 2021, 2021, 16. [Google Scholar] [CrossRef]
  19. Terlizzi, M.E.; Gribaudo, G.; Maffei, M.E. Uropathogenic Escherichia coli (upec) infections: Virulence factors, bladder responses, antibiotic, and non-antibiotic antimicrobial strategies. Front. Microbiol. 2017, 8, 1566. [Google Scholar] [CrossRef]
  20. Stahl, W. Oxidative stress—Antioxidants in foods. Ernahr. Umsch. 2011, 58, 536–541. [Google Scholar]
  21. Urquiaga, I.; Leighton, F. Plant polyphenol antioxidants and oxidative stress. Biol. Res. 2000, 33, 55–64. [Google Scholar] [CrossRef]
  22. Guo, Q.P.; Li, F.N.; Duan, Y.H.; Wen, C.Y.; Wang, W.L.; Zhang, L.Y.; Huang, R.L.; Yin, Y.L. Oxidative stress, nutritional antioxidants and beyond. Sci. China-Life Sci. 2020, 63, 866–874. [Google Scholar] [CrossRef]
  23. Mao, X.B.; Gu, C.S.; Chen, D.W.; Yu, B.; He, J. Oxidative stress-induced diseases and tea polyphenols. Oncotarget 2017, 8, 81649–81661. [Google Scholar] [CrossRef] [Green Version]
  24. Duan, G.L.; Wang, C.N.; Liu, Y.J.; Yu, Q.; Tang, X.L.; Ni, X.; Zhu, X.Y. Resveratrol alleviates endotoxemia-associated adrenal insufficiency by suppressing oxidative/nitrative stress. Endocr. J. 2016, 63, 569–580. [Google Scholar] [CrossRef] [Green Version]
  25. Elejalde, E.; Villaran, M.C.; Alonso, R.M. Grape polyphenols supplementation for exercise-induced oxidative stress. J. Int. Soc. Sport Nutr. 2021, 18, 12. [Google Scholar] [CrossRef] [PubMed]
  26. Tejada, S.; Nabavi, S.M.; Capo, X.; Martorell, M.; Bibiloni, M.D.; Tur, J.A.; Pons, A.; Sureda, A. Quercetin effects on exercise induced oxidative stress and inflammation. Curr. Org. Chem. 2017, 21, 348–356. [Google Scholar] [CrossRef]
  27. Hor, S.L.; Teoh, S.L.; Lim, W.L. Plant polyphenols as neuroprotective agents in Parkinson’s disease targeting oxidative stress. Curr. Drug Targets 2020, 21, 458–476. [Google Scholar] [CrossRef]
  28. Baranowska, M.; Bartoszek, A. Antioxidant and antimicrobial properties of bioactive phytochemicals from cranberry. Postep. Hig. Med. Dosw. 2016, 70, 1460–1468. [Google Scholar] [CrossRef] [PubMed]
  29. Kim, Y.J.; Yokozawa, T. Modulation of oxidative stress and melanogenesis by proanthocyanidins. Biol. Pharm. Bull. 2009, 32, 1155–1159. [Google Scholar] [CrossRef] [PubMed] [Green Version]
  30. Li, B.J.; Weng, Q.N.; Liu, Z.Q.; Shen, M.; Zhang, J.Q.; Wu, W.J.; Liu, H.L. Selection of antioxidants against ovarian oxidative stress in mouse model. J. Biochem. Mol. Toxicol. 2017, 31, 6. [Google Scholar] [CrossRef] [PubMed]
  31. Chen, Q.; Hu, P.P. Proanthocyanidins prevent ethanol-induced cognitive impairment by suppressing oxidative and inflammatory stress in adult rat brain. Neuroreport 2017, 28, 980–986. [Google Scholar] [CrossRef] [PubMed]
  32. Sun, C.; Jin, W.G.; Shi, H.C. Oligomeric proanthocyanidins protects a549 cells against h2o2-induced oxidative stress via the nrf2-are pathway. Int. J. Mol. Med. 2017, 39, 1548–1554. [Google Scholar] [CrossRef] [Green Version]
  33. Attia, S.M.; Bakheet, S.A.; Al-Rasheed, N.M. Proanthocyanidins produce significant attenuation of doxorubicin-induced mutagenicity via suppression of oxidative stress. Oxidative Med. Cell. Longev. 2010, 3, 404–413. [Google Scholar] [CrossRef] [PubMed] [Green Version]
  34. Li, L.L.; Geng, X.; Tian, L.L.; Wang, D.B.; Wang, Q. Grape seed proanthocyanidins protect retinal ganglion cells by inhibiting oxidative stress and mitochondrial alteration. Arch. Pharm. Res. 2020, 43, 1056–1066. [Google Scholar] [CrossRef]
  35. Rajput, S.A.; Zhang, C.; Feng, Y.; Wei, X.T.; Khalil, M.M.; Rajput, I.R.; Baloch, D.M.; Shaukat, A.; Rajput, N.; Qamar, H.; et al. Proanthocyanidins alleviates aflatoxinb(1)-induced oxidative stress and apoptosis through mitochondrial pathway in the bursa of fabricius of broilers. Toxins 2019, 11, 157. [Google Scholar] [CrossRef] [PubMed] [Green Version]
  36. Yan, F.F.; Chen, L.; Chen, W.B.; Zhao, L.; Lu, Q.; Liu, R. Protective effect of procyanidin a-type dimers against h2o2-induced oxidative stress in prostate du145 cells through the mapks signaling pathway. Life Sci. 2021, 266, 11. [Google Scholar] [CrossRef]
  37. Mathison, B.D.; Kimble, L.L.; Kaspar, K.L.; Khoo, C.; Chew, B.P. Consumption of cranberry beverage improved endogenous antioxidant status and protected against bacteria adhesion in healthy humans: A randomized controlled trial. Nutr. Res. 2014, 34, 420–427. [Google Scholar] [CrossRef] [PubMed]
  38. Nabavi, S.F.; Sureda, A.; Daglia, M.; Izadi, M.; Nabavi, S.M. Cranberry for urinary tract infection: From bench to bedside. Curr. Top. Med. Chem. 2017, 17, 331–339. [Google Scholar] [CrossRef] [PubMed]
  39. Jiao, J.J.; Wei, Y.; Chen, J.N.; Chen, X.Y.; Zhang, Y. Anti-aging and redox state regulation effects of a-type proanthocyanidins-rich cranberry concentrate and its comparison with grape seed extract in mice. J. Funct. Food. 2017, 30, 63–73. [Google Scholar] [CrossRef]
  40. Maldonado, P.D.; Rivero-Cruz, I.; Mata, R.; Pedraza-Chaverri, J. Antioxidant activity of a-type proanthocyanidins from Geranium niveum (Geraniaceae). J. Agric. Food Chem. 2005, 53, 1996–2001. [Google Scholar] [CrossRef] [PubMed]
  41. Martins, G.R.; do Amaral, F.R.L.; Brum, F.L.; Mohana-Borges, R.; de Moura, S.S.T.; Ferreira, F.A.; Sangenito, L.S.; Santos, A.L.S.; Figueiredo, N.G.; da Silva, A.S. Chemical characterization, antioxidant and antimicrobial activities of acai seed (euterpe oleracea mart.) extracts containing a- and b-type procyanidins. LWT-Food Sci. Technol. 2020, 132, 11. [Google Scholar] [CrossRef]
  42. Huang, B.; Wang, L.; Liu, M.; Wu, X.; Lu, Q.; Liu, R. The underlying mechanism of a-type procyanidins from peanut skin on dss-induced ulcerative colitis mice by regulating gut microbiota and metabolism. J. Food Biochem. 2022, e14103. [Google Scholar] [CrossRef]
  43. Ishihara, T.; Kaidzu, S.; Kimura, H.; Koyama, Y.; Matsuoka, Y.; Ohira, A. Protective effect of highly polymeric a-type proanthocyanidins from seed shells of japanese horse chestnut (Aesculus turbinata blume) against light-induced oxidative damage in rat retina. Nutrients 2018, 10, 14. [Google Scholar] [CrossRef] [Green Version]
  44. Singleton, V.L.; Orthofer, R.; Lamuela-Raventos, R.M. Analysis of total phenols and other oxidation substrates and antioxidants by means of folin-ciocalteu reagent. Method Enzym. 1999, 299, 152–178. [Google Scholar]
  45. Ochieng, B.O.; Anyango, J.O.; Nduko, J.M.; Cheseto, X.; Mudalungu, C.M.; Khamis, F.M.; Ghemoh, C.J.; Egonyu, P.J.; Subramanian, S.; Nakimbugwe, D.; et al. Dynamics in nutrients, sterols and total flavonoid content during processing of the edible long-horned grasshopper (Ruspolia differens serville) for food. Food Chem. 2022, 383, 132397. [Google Scholar] [CrossRef] [PubMed]
  46. Elisia, I.; Hu, C.; Popovich, D.G.; Kitts, D.D. Antioxidant assessment of an anthocyanin-enriched blackberry extract. Food Chem. 2007, 101, 1052–1058. [Google Scholar] [CrossRef]
  47. Prior, R.L.; Fan, E.; Ji, H.; Howell, A.; Nio, C.; Payne, M.J.; Reed, J. Multi-laboratory validation of a standard method for quantifying proanthocyanidins in cranberry powders. J. Sci. Food Agric. 2010, 90, 1473–1478. [Google Scholar] [CrossRef] [PubMed]
  48. Birmingham, A.D.; Esquivel-Alvarado, D.; Maranan, M.; Krueger, C.G.; Reed, J.D. Inter-laboratory validation of 4-(dimethylamino) cinnamaldehyde (dmac) assay using cranberry proanthocyanidin standard for quantification of soluble proanthocyanidins in cranberry foods and dietary supplements, first action official methodsm: 2019.06. J. AOAC Int. 2021, 104, 216–222. [Google Scholar] [CrossRef]
  49. Feliciano, R.P.; Shea, M.P.; Shanmuganayagam, D.; Krueger, C.G.; Howell, A.B.; Reed, J.D. Comparison of isolated cranberry (Vaccinium macrocarpon ait.) proanthocyanidins to catechin and procyanidins a2 and b2 for use as standards in the 4-(dimethylamino)cinnamaldehyde assay. J. Agric. Food Chem. 2012, 60, 4578–4585. [Google Scholar] [CrossRef]
  50. Esquivel-Alvarado, D.; Alfaro-Viquez, E.; Krueger, C.G.; Vestling, M.M.; Reed, J.D. Identification of a-type proanthocyanidins in cranberry-based foods and dietary supplements by matrix-assisted laser desorption/ionization time-of-flight mass spectrometry, first action method: 2019.05. J. AOAC Int. 2021, 104, 223–231. [Google Scholar] [CrossRef]
  51. Mannino, G.; Gentile, C.; Maffei, M.E. Chemical partitioning and DNA fingerprinting of some pistachio (pistacia vera l.) varieties of different geographical origin. Phytochemistry 2019, 160, 40–47. [Google Scholar] [CrossRef]
  52. Derick, S.; Gironde, C.; Perio, P.; Reybier, K.; Nepveu, F.; Jauneau, A.; Furger, C. Lucs (light-up cell system), a universal high throughput assay for homeostasis evaluation in live cells. Sci. Rep. 2017, 7, 18069. [Google Scholar] [CrossRef]
  53. Gliszczyńska-Świgło, A. Antioxidant activity of water soluble vitamins in the teac (trolox equivalent antioxidant capacity) and the frap (ferric reducing antioxidant power) assays. Food Chem. 2006, 96, 131–136. [Google Scholar] [CrossRef]
  54. Tyrakowska, B.; Soffers, A.E.; Szymusiak, H.; Boeren, S.; Boersma, M.G.; Lemańska, K.; Vervoort, J.; Rietjens, I.M. Teac antioxidant activity of 4-hydroxybenzoates. Free. Radic. Biol. Med. 1999, 27, 1427–1436. [Google Scholar] [CrossRef]
  55. Kiselova-Kaneva, Y.; Galunska, B.; Nikolova, M.; Dincheva, I.; Badjakov, I. High resolution lc-ms/ms characterization of polyphenolic composition and evaluation of antioxidant activity of sambucus ebulus fruit tea traditionally used in Bulgaria as a functional food. Food Chem. 2022, 367, 130759. [Google Scholar] [CrossRef] [PubMed]
  56. Foo, L.Y.; Lu, Y.R.; Howell, A.B.; Vorsa, N. The structure of cranberry proanthocyanidins which inhibit adherence of uropathogenic p-fimbriated escherichia coli in vitro. Phytochemistry 2000, 54, 173–181. [Google Scholar] [CrossRef]
  57. Evans, D.G.; Evans, D.J., Jr.; Tjoa, W. Hemagglutination of human group a erythrocytes by enterotoxigenic escherichia coli isolated from adults with diarrhea: Correlation with colonization factor. Infect. Immun. 1977, 18, 330–337. [Google Scholar] [CrossRef] [PubMed] [Green Version]
  58. De Man, P.; Cedergren, B.; Enerbäck, S.; Larsson, A.C.; Leffler, H.; Lundell, A.L.; Nilsson, B.; Svanborg-Edén, C. Receptor-specific agglutination tests for detection of bacteria that bind globoseries glycolipids. J. Clin. Microbiol. 1987, 25, 401–406. [Google Scholar] [CrossRef] [PubMed] [Green Version]
  59. Pérez-Jiménez, J.; Neveu, V.; Vos, F.; Scalbert, A. Identification of the 100 richest dietary sources of polyphenols: An application of the phenol-explorer database. Eur. J. Clin. Nutr. 2010, 64, S112–S120. [Google Scholar] [CrossRef]
  60. Cosmulescu, S.; Trandafir, I.; Nour, V. Phenolic acids and flavonoids profiles of extracts from edible wild fruits and their antioxidant properties. Int. J. Food Prop. 2017, 20, 3124–3134. [Google Scholar] [CrossRef] [Green Version]
  61. Shraim, A.M.; Ahmed, T.A.; Rahman, M.M.; Hijji, Y.M. Determination of total flavonoid content by aluminum chloride assay: A critical evaluation. LWT 2021, 150, 111932. [Google Scholar] [CrossRef]
  62. Taghavi, T.; Patel, H.; Rafie, R. Comparing ph differential and methanol-based methods for anthocyanin assessments of strawberries. Food Sci. Nutr. 2021, 1–9. [Google Scholar] [CrossRef]
  63. Mannino, G.; Chinigò, G.; Serio, G.; Genova, T.; Gentile, C.; Munaron, L.; Bertea, C.M. Proanthocyanidins and where to find them: A meta-analytic approach to investigate their chemistry, biosynthesis, distribution, and effect on human health. Antioxidants 2021, 10, 1229. [Google Scholar] [CrossRef]
  64. Krueger, C.G.; Reed, J.D.; Feliciano, R.P.; Howell, A.B. Quantifying and characterizing proanthocyanidins in cranberries in relation to urinary tract health. Anal. Bioanal. Chem. 2013, 405, 4385–4395. [Google Scholar] [CrossRef]
  65. Reed, J.D.; Krueger, C.G.; Vestling, M.M. Maldi-tof mass spectrometry of oligomeric food polyphenols. Phytochemistry 2005, 66, 2248–2263. [Google Scholar] [CrossRef]
  66. Rue, E.A.; Glinski, J.A.; Glinski, V.B.; van Breemen, R.B. Ion mobility-mass spectrometry for the separation and analysis of procyanidins. J. Mass Spectrom. 2020, 55, e4377. [Google Scholar] [CrossRef] [PubMed]
  67. Liu, H.; Zhou, K.; Jiang, H.Q.; Wen, L.K.; He, Y.; Lu, S.Y.; Wang, B.X.; Li, J. Current advances in anthocyanins: Structure, bioactivity and human health. J. Food Nutr. Res. 2021, 60, 203–216. [Google Scholar]
  68. Das, A.; Baidya, R.; Chakraborty, T.; Samanta, A.K.; Roy, S. Pharmacological basis and new insights of taxifolin: A comprehensive review. Biomed. Pharmacother. 2021, 142, 112004. [Google Scholar] [CrossRef]
  69. Ribeiro, D.; Fernandes, E.; Freitas, M. Chapter 20—Flavonoids as modulators of neutrophils’ oxidative burst: Structure-activity relationship. In Polyphenols: Mechanisms of Action in Human Health and Disease, 2nd ed.; Watson, R.R., Preedy, V.R., Zibadi, S., Eds.; Academic Press: London, UK, 2018; pp. 261–276. [Google Scholar]
  70. Sato, M.; Murakami, K.; Uno, M.; Nakagawa, Y.; Katayama, S.; Akagi, K.-I.; Masuda, Y.; Takegoshi, K.; Irie, K. Site-specific inhibitory mechanism for amyloid β42 aggregation by catechol-type flavonoids targeting the Lys residues. J. Biol. Chem. 2013, 288, 23212–23224. [Google Scholar] [CrossRef] [Green Version]
  71. Furger, C. Live cell assays for the assessment of antioxidant activities of plant extracts. Antioxidants 2021, 10, 944. [Google Scholar] [CrossRef]
  72. Wolfe, K.L.; Liu, R.H. Cellular antioxidant activity (caa) assay for assessing antioxidants, foods, and dietary supplements. J. Agric. Food Chem. 2007, 55, 8896–8907. [Google Scholar] [CrossRef]
  73. Sun, J.; Chu, Y.-F.; Wu, X.; Liu, R.H. Antioxidant and antiproliferative activities of common fruits. J. Agric. Food Chem. 2002, 50, 7449–7454. [Google Scholar] [CrossRef]
  74. Gironde, C.; Rigal, M.; Dufour, C.; Furger, C. Aop1, a new live cell assay for the direct and quantitative measure of intracellular antioxidant effects. Antioxidants 2020, 9, 471. [Google Scholar] [CrossRef]
  75. Karadag, A.; Ozcelik, B.; Saner, S. Review of methods to determine antioxidant capacities. Food Anal. Methods 2009, 2, 41–60. [Google Scholar] [CrossRef]
  76. Bolanos de la Torre, A.A.S.; Henderson, T.; Nigam, P.S.; Owusu-Apenten, R.K. A universally calibrated microplate ferric reducing antioxidant power (frap) assay for foods and applications to manuka honey. Food Chem. 2015, 174, 119–123. [Google Scholar] [CrossRef] [PubMed]
  77. Thaipong, K.; Boonprakob, U.; Crosby, K.; Cisneros-Zevallos, L.; Hawkins Byrne, D. Comparison of abts, dpph, frap, and orac assays for estimating antioxidant activity from guava fruit extracts. J. Food Compos. Anal. 2006, 19, 669–675. [Google Scholar] [CrossRef]
  78. Foxman, B. The epidemiology of urinary tract infection. Nat. Rev. Urol. 2010, 7, 653–660. [Google Scholar] [CrossRef] [PubMed]
  79. Mantzorou, M.; Giaginis, C. Cranberry consumption against urinary tract infections: Clinical stateof- the-art and future perspectives. Curr. Pharm. Biotechnol. 2018, 19, 1049–1063. [Google Scholar] [CrossRef] [PubMed]
  80. Liu, H.Y.; Howell, A.B.; Zhang, D.J.; Khoo, C. A randomized, double-blind, placebo-controlled pilot study to assess bacterial anti-adhesive activity in human urine following consumption of a cranberry supplement. Food Funct. 2019, 10, 7645–7652. [Google Scholar] [CrossRef] [Green Version]
  81. Howell, A.; Souza, D.; Roller, M.; Fromentin, E. Comparison of the anti-adhesion activity of three different cranberry extracts on uropathogenic p-fimbriated Escherichia coli: A randomized, double-blind, placebo controlled, ex vivo, acute study. Nat. Prod. Commun. 2015, 10, 1215–1218. [Google Scholar] [CrossRef] [Green Version]
  82. Kaspar, K.L.; Howell, A.B.; Khoo, C. A randomized, double-blind, placebo-controlled trial to assess the bacterial anti-adhesion effects of cranberry extract beverages. Food Funct. 2015, 6, 1212–1217. [Google Scholar] [CrossRef]
  83. Hendrich, A.B.; Strugala, P.; Dudra, A.; Kucharska, A.Z.; Sokol-Letowska, A.; Wojnicz, D.; Cisowska, A.; Sroka, Z.; Gabrielska, J. Microbiological, antioxidant and lipoxygenase-1 inhibitory activities of fruit extracts of chosen rosaceae family species. Adv. Clin. Exp. Med. 2020, 29, 215–224. [Google Scholar] [CrossRef] [Green Version]
Figure 1. Positive reflectron mode MALDI-TOF MS of SP4TM showing a PAC series from the trimer (m/z 997) to octamer (m/z 2437) in which the predominant mass at each degree of polymerization is representative of a PAC structure that contains one or more type-A interflavan bonds. Compounds are detected as Cs+ ion adducts [M+Cs]+.
Antioxidants 11 01234 g001
Figure 2. Deconvolution of positive reflectron mode MALDI-TOF MS of SP4TM showing the relative type-A percentage of PACs at different degree of polymerization (DP). At 2–4 DP, PACs contain predominantly one or more type-A interflavan bonds, at 4–7 DP contain predominantly two or more type-A interflavan bonds, while at 9 DP they contain predominantly three of more type-A bonds.
Antioxidants 11 01234 g002
Figure 3. Structural formulas of the phenolic compounds characterized and quantified via HPLC-DAD-ESI-MS/MS in SP4TM formulation.
Antioxidants 11 01234 g003
Figure 4. Kinetics (left panel) and dose-response (right panel) of the antioxidant power of SP4TM in HepG2 cells by using the LUCS approach. (A,B), kinetics and dose-response of neutralization of intracellular free radicals; (C,D), kinetics and dose-response of plasma membrane-based lipid peroxidation; (E,F), kinetics and dose-response of H2O2 quenching (catalase-like) activity.
Antioxidants 11 01234 g004
Table 1. Total phytochemical content of SP4TM formulation based on different assays. Values are expressed as equivalent mg of reference compounds per gram of dry weight material (d.wt).
Class of PhenolicsMethod UsedContent
TPCFolin–Ciocalteu assay885.51 ± 14.19 mg GAE g−1 d.wt
TFCAluminum Chloride assay135.52 ± 8.98 mg RE g−1 d.wt
TACpH differential method54.84 ± 2.97 mg CE g−1 d.wt
TPACDMAC assay379.43 ± 12.44 mg PAC-A2 type g−1 d.wt
737.54 ± 8.12 mg cPAC g−1 d.wt
TPC: Total Polyphenol Content; TFC: Total Flavonoid Content; TAC: Total Anthocyanin Content; TPAC: Total Proanthocyanidin Content; GAE: Gallic Acid Equivalent; RE: Rutin Equivalent; CE: Cyanidin-glucoside Equivalent; PAC-A2: Type A2 proanthocyanidin; cPAC: c-PAC proanthocyanidin standard.
Table 2. Deconvolution of positive reflectron mode MALDI-TOF MS of SP4TM showing the relative percentage of type-A to -B interflavan bonds at each degree of PAC polymerization.
Degree of PolymerizationType-A to Type-B Interflavan BondsRelative
Percentage (%)
Trimers2Type-A:0Type-B12.10
1Type-A:1Type-B72.83
0Type-A:2Type-B15.07
Tetramers3Type-A:0Type-B6.91
2Type-A:1Type-B31.37
1Type-A:2Type-B60.70
0Type-A:3Type-B1.02
Pentamers4Type-A:0Type-B0.00
3Type-A:1Type-B11.38
2Type-A:2Type-B47.41
1Type-A:3Type-B34.59
0Type-A:4Type-B6.62
Hexamers4Type-A: 1Type-B0.00
3Type-A: 2Type-B18.88
2Type-A: 3Type-B58.81
1Type-A: 4Type-B19.98
0Type-A: 5Type-B2.33
Heptamers4Type-A: 2Type-B0.00
3Type-A: 3Type-B45.93
2Type-A: 4Type-B41.86
1Type-A: 5Type-B15.50
0Type-A: 6Type-B0.00
Octamers4Type-A: 2Type-B0.00
3Type-A: 3Type-B57.29
2Type-A: 4Type-B25.05
1Type-A: 5Type-B22.33
0Type-A: 6Type-B0.00
Table 3. Qualitative and quantitative phytochemical characterization of bioactive compounds in SP4TM formulation. Results are expressed as mean ± SD of three different experiments carried out in triplicate, and the values are expressed as mg g−1 dried material (d.wt). Different lowercase letters indicate significant differences at p ≤ 0.05, as measured by one-way ANOVA followed by Tukey’s test.
#RTm/zMS/MSλCompound
Common NameChemical NameCAS-IDmg g−1 d.wt
122.6449286.9520IdaeinCyanidin 3-O-galactoside27661-36-50.52 ± 0.01 m
224.6449286.9520ChrysantheminCyanidin 3-O-glucoside7084-24-44.14 ± 0.12 f
324.9465436.7; 302.7260, 280Taxifolin-glucosideDihydroquercetin-3-O-glucoside27297-45-60.12 ± 0.01 op
425.0611574.7; 422.7260, 280DihydroneohesperidinDihydroquercetin-7-O-diglucoside13241-33-32.06 ± 0.06 h
525.1643596.6; 490.6; 318.7260, 280 Dihydromyricetin 3,4’-O-diglucoside 0.28 ± 0.01 n
626.4463301520 Peonidin 3-O-galactoside28148-89-21.95 ± 0.06 h
726.8419286.8520 Cyanidin 3-O-arabinoside57186-11-50.09 ± 0.01 op
826.9597548.9; 301.0260, 280 Quercetin 3-O-sambubioside83048-35-50.01 ± 0.01 p
927.5609342.7; 300.7260, 280RutinQuercetin 3-O-rutinoside153-18-40.96 ± 0.02 l
1028.7463416.7; 300.7260, 280HyperosideQuercetin 3-O-galactoside482-36-00.18 ± 0.01 no
1129.1473455.1, 427.0, 300.9520 Peonidin 3-O-arabinoside524943-91-70.55 ± 0.02 m
1229.2477300.7260, 280MiquelianinQuercetin 3-O-glucuronide22688-79-50.08 ± 0.01 op
1330.2623314.7; 299.7; 270.7260, 280Isorhamnetin-galactoside3′-Methylquercetin 3-O-galactoside6743-92-60.43 ± 0.01 m
1430.2625317.1260, 280 Myricetin 3-O-rutinoside41093-68-90.15 ± 0.01 op
1531.0477356.7; 314.7260, 280Isorhamnetin-glucoside3′-Methylquercetin 3-O-glucoside5041-82-70.15 ± 0.01 op
1631.9463416.7; 300.7260, 280IsoquercitrinQuercetin 3-O-glucoside482-35-91.47 ± 0.04 i
1732.5463300.9520OxycoccicyaninPeonidin 3-O-glucoside68795-37-90.29 ± 0.0 1n
1835.5301256.8260, 280 Quercetin117-39-511.29 ± 0.43 e
1936.1287258.9; 230.9520 Cyanidin13306-05-337.21 ± 1.29 b
2038.5303284.7260.28TaxifolinDihydroquercetin480-18-224.08 ± 0.88 d
2148.0301240.1520 Peonidin134-01-02.21 ± 0.07 g
2248.4318295.4260, 280AmpelopsinDihydromyricetin27200-12-074.23 ± 2.94 a
2351.9317297.9; 270.7260, 280 Myricetin529-44-230.36 ± 0.93 c
2452.1315297260, 280Isorhamnetin3′-Methylquercetin480-19-311.55 ± 0.35 e
RT: Retention Time; m/z: mass-to-charge ratio; MS/MS: detected fragmentations; λ: maximum absorption wavelength; CAS-ID: Chemical Abstracts Service Identification Number.
Table 4. Antioxidant power of SP4TM in HepG2 cells by using the LUCS approach. In the same column, different letters indicate significant (p < 0.05) differences.
Antioxidant AssayEC10EC50EC90
Neutralization of intracellular free radicals7.18 a μg/ mL
(95% CI: 3.36–12.13 μg/mL)
30.11 a μg/ mL
(95% CI: 23.23–39.08 μg/mL)
126.30 a μg/ mL
(95% CI: 74.62–267.7 μg/mL)
Inhibition of plasma membrane-based lipid peroxidation2.26 b mg/ mL
(95% CI: 0.021–238.3)
7.81 b mg/ mL
(95% CI: 1.105–55.2)
27.02 b mg/ mL
(95% CI: 0.058–12548)
H2O2 quenching (catalase-like) activity7.17 a μg/ mL
(95% CI: ND)
596.00 c μg/ mL
(95% CI: ND)
49.53 c mg/ mL
(95% CI: ND)
Table 5. Chemical antioxidant activity of SP4TM. Values are expressed as µmol of Trolox Equivalent (TE) per gram of dried material and as IC50 (in mg ml−1).
Assayµmol TE/gIC50
ABTS139.92 ± 6.162.85 ± 0.03
DPPH89.51 ± 3.914.46 ± 0.12
FRAP2643.28 ± 39.86
ABTS: 2,2’-azino-bis(3-ethylbenzothiazoline-6-sulfonic acid; DPPH: 2,2-diphenyl-1-picrylhydrazyl; FRAP: Ferric Reducing Antioxidant Power.
Publisher’s Note: MDPI stays neutral with regard to jurisdictional claims in published maps and institutional affiliations.

