Article

DL-Methionyl–DL-Methionine/DL-Methionine Supplementation Alleviated the Adverse Effects of Dietary Low Fishmeal Levels on Growth and Intestinal Health of Micropterus salmoides

1
Wuxi Fisheries College, Nanjing Agricultural University, Wuxi 214081, China
2
Evonik Operations GmbH, Hanau-Wolfgang, 63457 Hanau, Germany
3
Key Laboratory of Integrated Rice-Fish Farming Ecology, Ministry of Agriculture and Rural Affairs, Freshwater Fisheries Research Center, Chinese Academy of Fishery Sciences, Wuxi 214081, China
4
School of Pharmaceutical Sciences, Guangzhou Medical University, Guangzhou 511436, China
*
Authors to whom correspondence should be addressed.
Antioxidants 2024, 13(3), 359; https://doi.org/10.3390/antiox13030359
Submission received: 14 February 2024 / Revised: 9 March 2024 / Accepted: 13 March 2024 / Published: 18 March 2024
(This article belongs to the Special Issue Oxidative Stress of Aquatic Animals)

Abstract

:
DL-methionyl–DL-methionine (AQUAVI® Met-Met) (Met-Met) (0.10%, 0.20%, 0.30%, and 0.40%) or DL-methionine (DL-Met) (0.10%, 0.20%, 0.30%, and 0.40%) were added to a low-fishmeal diet in an attempt to reduce fishmeal in the diet of Micropterus salmoides (M. salmoides). The fish were randomly allocated into ten experimental groups (n = 100), each with 4 replicates of 25 fish (16.39 ± 0.01 g) each. Compared to 25% FM, 0.40% of DL-Met and 0.10% of Met-Met promoted growth, and 0.10% of Met-Met decreased FCR. Compared to 25% FM, the supplementation of Met-Met or DL-Met improved the intestinal antioxidant capacity by upregulating the NF-E2-related factor 2-mediated antioxidant factors and enzyme activities and nuclear factor kappa-B-mediated anti-inflammatory factors while downregulating the pro-inflammatory factors, thereby exerting anti-inflammatory effects. Moreover, 0.10% of the Met-Met diet affected the Firmicutes-to-Bacteroidota ratio, increased the levels of Proteobacteria, changed the composition of intestinal flora (Roseburia, Lachnospiraceae_NK4A136_group, and unclassified_Oscillospiraceae), and enhanced intestinal dominant bacteria (Caldicoprobacter, Pseudogracilibacillus, and Parasutterella), leading to improved gut health. In summary, the supplementation of DL-Met or Met-Met alleviated the adverse effect of fishmeal reduction (from 40 to 25%) on the growth performance and intestinal health of M. salmoides.

1. Introduction

Nutritional balance is closely related to human health, and fish is crucial for the human diet due to its rich nutritional content. Fish meat is a source of rich and high-quality protein that is more accessible and affordable than other animal proteins [1,2]. Since the 1950s, aquaculture production increased globally, while fishery production remained consistent since the early 1990s [3]. Moreover, the production of aquaculture for human consumption exceeded that of the fisheries in 2016 [3]. Aquaculture plays an important role in world food security by providing aquatic protein [4]. According to a report by FAO [5], the production of freshwater fish is at least five times that of marine fish, demonstrating the important role of freshwater fish farming in food security. Micropterus salmoides (M. salmoides) is a native to North America and was imported into China for farming as food fish. M. salmoides has fast growth, strong adaptability, and delicious meat [6]; therefore, its production increased from 243,196 to 802,486 tons during the last decade in China [7]. However, the increased production necessitates sufficient feed and raw materials for culturing M. salmoides. Fishmeal (FM) is one of the most important, expensive, and high-quality sources of protein due to its good palatability, amino acid balance, and high nutritional value [8]. However, FM production and its price are projected to increase by 1% and 30%, respectively, by the year 2030 [9], which may impede the sustainable development of the aquaculture industry. As a carnivorous fish, M. salmoides requires 40–50% more FM than herbivorous and omnivorous fish [10]. Therefore, reducing the proportion of FM in M. salmoides feed is crucial to overcoming the FM production challenge, thereby promoting the sustainable farming of M. salmoides.
To reduce the FM content, animal- and plant-based protein sources are used as important ingredients in aquatic animal feed. However, due to an imbalance of essential amino acids (EAAs), their extensive use results in several adverse effects [11,12,13]. Therefore, it is important to balance the essential nutrients, including EAAs, in the feed to replace FM with animal- and plant-based proteins without affecting the production performance of the fish. A potential alternate protein source is poultry by-products, as they have similar protein contents, reasonable prices, and a stable supply [14]. However, one of the limiting amino acids in poultry by-product feed is methionine [15], which should be included in aquatic animal feed to reduce the adverse impact on growth, antioxidant capacity, and immune function resulting from reduced FM content [16].
Supplementation with EAAs, particularly methionine (Met), was considered an effective way of replacing FM with animal- and plant-based proteins in aquatic feeds [12,17,18]. Methionine products are commercially available in various forms, such as DL-methionine (DL-Met) or Met-Met. Met-Met has an advantage over DL-Met in that it is insoluble in water and absorbed easily [19,20]. Guo et al. found that Met-Met supplementation could improve the growth performance and antioxidant capacity of Nile tilapia (Oreochromis niloticus) [20]. Mamauag et al. reported similar utilization effects of DL-Met and Met-Met by Red Sea Bream (Pagrus major) larvae and juveniles [21]. Met-Met is mainly used to supplement the feed of Litopenaeus vannamei (L. vannamei) with a higher availability than DL-Met [19]. Dietary supplementation with 0.34% of Met-Met could reduce the FM content from 18 to 6% without any adverse effect on the performance of L. vannamei [22]. Moreover, Met-Met supplementation ameliorates the negative effects on growth caused by limiting Met content in low-FM diets and effectively improves the immune and antioxidant capacity of L. vannamei [23]. However, considering the differences between shrimp and fish, the present study investigated the effects of Met-Met supplementation on the growth, intestinal antioxidant capacity, immunity, and microbiota of M. salmoides. The outcomes would facilitate the further evaluation of the application of Met-Met in different species, thereby limiting the FM content to promote the sustainable development of M. salmoides.

2. Materials and Methods

2.1. Experimental Design

M. salmoides were initially placed in floating net cages in a pond for two weeks for environmental acclimation. Thereafter, the fish were randomly allocated into ten experimental groups (n = 100), each with 4 replicates of 25 fish (16.39 ± 0.01 g) each. Subsequently, M. salmoides was fed to satiety twice daily (07:30 and 17:30 h) for 10 weeks. The key indicators of water quality monitoring during the culture cycle are listed in Table 1.

2.2. Experimental Diets and Feeding Plan

Met-Met and DL-Met were procured from Evonik Operations GmbH (Hanau, Germany). The commercial product (AQUAVI® Met-Met) is a mixture of four different methionine stereoisomers (LD-Met-Met, DL-Met-Met, LL-Met-Met, and DD-Met-Met) [19]. The following dietary formulations were used: (1) 40% FM, 25% FM, and 25% FM supplemented with varying levels of Met-Met (0.10%, 0.20%, 0.30%, and 0.40%) or DL-Met (0.10%, 0.20%, 0.30%, and 0.40%). The ingredient and proximate analysis of the experimental diets are shown in Table 2. Amino acid content in diets and Met-Met and DL-Met levels after supplementation are shown in Table 3. The raw protein materials were crushed using a pulverizer and re-screened through a 60-mesh screen. The resultant protein ingredients were mixed sequentially according to the principle of gradual mixing with water and oil supply. Thereafter, an F-26 (II)-type granulator was used to obtain feed granules. After drying, the prepared feed was stored at −20 °C for further use.

2.3. Sampling

The fish were fasted for 24 h before sample collection. A total of 8 fish per group were selected to evaluate the whole-body composition. In addition, two extra fish were randomly selected from each net cage. In other words, the intestinal antioxidant indices and gene expression levels were tested using 8 fish from each group. Furthermore, intestinal tissue samples from three randomly selected fish from each of the 40% FM (HF), 25% FM (LF), and 25% FM supplemented with 0.10% Met-Met groups (LFM) were used to analyze intestinal microbes. The collected samples were stored at −80 °C for further analysis.

2.4. The Nutrient Composition and Intestinal Antioxidant Parameter Assays

The experimental assay methods with details of manufacturers or assay kits utilized for the analyses of serum, intestinal antioxidant parameters, whole fish, and diet composition are elaborated in Table 4.

2.5. Microbial DNA Extraction and 16S rDNA Sequencing

The intestinal tissues from three M. salmoides fed with HF, LF, and LFM diets were used for microbiological analysis. The constructed libraries were screened and sequenced on Illumina NovaSeq 6000. Effective Reads were obtained by quality filtering, double-ended sequence splicing, and chimera removal. USEARCH software (version 10.0) [25] was used to cluster Reads and obtain OTUs with 97.0% similarity.

2.6. 16S rDNA Sequencing Data Analysis

The α- and β-diversities were analyzed using QIIME2, and the diversity index was tested by the independent sample t-test in SPSS 20. The featured sequences were then classified and labeled by a plain Bayesian classifier, according to the Silv.138 database. The community structure of samples at the taxonomic level (phylum, class, order, family, genus, and species) was calculated by QIIME2 (2020.6) software to generate abundance at different taxonomic levels and mapped using R-language means.

2.7. Quantitative Real-Time PCR Detection

The intestinal tissues of M. salmoides stored at −80 °C were transferred to dry ice, followed by RNA extraction using the standard reagents by Vazyme (Nanjing, China) according to the manufacturer’s instructions. The RNA quantification and qualitative analysis for further experiments utilized a spectrophotometer (NanoDrop 2000, Thermo Fisher Scientific) (Waltham, MA, USA). HiScript® II One Step qRT-PCR SYBR Green Kit (Vazyme, Nanjing, China) was used to configure the system and detect gene expression levels. The primer sequences are shown in Table 5. Beta-actin (β-actin) was used as an internal reference primer, and the gene-relative quantitative levels were estimated by the standard curve method [26].

2.8. Statistical Analysis

The statistical data were analyzed by SPSS (Version 20) and mean values were compared using one-way ANOVA and Tukey’s method. The values with p < 0.05 were considered statistically significant. The quadratic regression equation was used to analyze the dietary DL-Met and Met-Met requirements for M. salmoides using FCR indicators.

3. Results

3.1. Growth and Feed Utilization

The results showed no significant difference in IW among the groups (p > 0.05; Table 6). Conversely, significantly decreased FW, WGR, and SGR and an increased feed conversion ratio (FCR) were observed in LF than in the HF group (p < 0.05). Moreover, the 0.40% DL-Met or 0.10% Met-Met groups showed similar values for FW, WGR, and SGR with the 40% FM group; however, only the 0.10% Met-Met group shows similar values with that of the 40% FM group for FCR (p < 0.05). In addition, the FI and SR of M. salmoides remained unaffected for all treatment groups (p > 0.05). The quadratic regression equation estimated the suitable dietary supplement of DL-Met and Met-Met as 0.34% or 0.22% of the diet, respectively, based on FCR (Figure 1).

3.2. The Whole Fish Composition and Amino Acid Composition

As shown in Table 7 and Table 8, no significant differences were observed in the whole fish and amino acid compositions among the groups (p > 0.05).

3.3. Intestinal Antioxidant Parameters

As shown in Figure 2, CAT, SOD, and GSH contents were significantly decreased in the LF group; however, the corresponding MDA levels were increased in comparison to the HF group. Moreover, the 0.30–0.40% DL-Met or 0.10–0.30% Met-Met groups showed significantly increased CAT activities relative to the LF group. Additionally, no differences were reported between the low-FM group supplemented with the 0.10% Met-Met and HF group. Furthermore, supplementation with 0.40% of DL-Met or 0.10% of Met-Met in the LF group significantly increased SOD activity in comparison to the LF group, but no significant difference was observed among the 0.40% DL-Met, 0.10% Met-Met, and HF groups. Moreover, Met-Met supplementation significantly increased GSH levels, whereas DL-Met supplementation had no significant effect when compared with the LF group. Specifically, supplementation with 0.10% of Met-Met significantly increased GSH composition compared with the 40% FM group. Moreover, 0.20–0.40% DL-Met or 0.10–0.40% Met-Met significantly reduced MDA contents in comparison to the LF group. In addition, no significant difference was observed between the 0.40% DL-Met and the HF groups; however, 0.10% Met-Met significantly reduced MDA content. On the other hand, GSH-Px activity was consistent among all the groups (p > 0.05).

3.4. Intestinal Antioxidant-Related Gene Levels

Results demonstrated significantly downregulated expressions of the nrf2, cat, and sod genes and an upregulated expression of the keap1 gene in the LF group compared with the HF group (p < 0.05; Figure 3). Moreover, the expressions of nrf2 and sod genes were significantly upregulated by supplementation with 0.20–0.40% of DL-Met, whereas 0.40% of DL-Met upregulated cat gene expression and 0.10–0.40% of DL-Met significantly downregulated keap1 gene expression when compared with the LF group (p < 0.05). The results of supplementation with 0.10–0.40% of Met-Met in the LF group showed significantly upregulated expressions of nrf2, cat, and sod genes and downregulated expression of the keap1 gene relative to the LF group (p < 0.05). No difference was observed in the level of the gsh-px gene expression among the groups (p > 0.05).

3.5. Intestinal Inflammatory-Related Gene Levels

As shown in Figure 4, compared with the HF group, significantly upregulated expressions of nf-κb, tnf-α, and il-8 genes and the downregulated expression of the il-10 gene were observed in the LF group (p < 0.05). Furthermore, supplementation with 0.30–0.40% of DL-Met significantly decreased the expressions of the nf-κb, tnf-α, and il-8 genes, respectively, whereas 0.20–0.40% of DL-Met significantly increased the expression of the il-10 gene (p < 0.05). In addition, 0.10–0.30% of Met-Met significantly reduced the expression of the nf-κb, tnf-α, and il-8 genes, while it increased the expression of the il-10 gene relative to the LF group (p < 0.05).

3.6. Microbial Community Analysis in the Intestine

No difference was observed in the ACE index among the samples (p > 0.05; Figure 5A). Simpson and Shannon indices obtained the lowest and highest values in the LF and LFM groups, respectively (p < 0.05; Figure 5B,C). Principal coordinate analysis (PCoA) demonstrated differences in the intestinal microbiota of M. salmoides fed with three different diets (Figure 5D). The abundance histogram of each sample at the genus level was used to determine the similarity in microbial abundance among the samples. The species enrichment levels in three samples within the groups were similar, but they were different among the groups (Figure 5E). The results of the clustering Heatmap suggested that samples within the group were similar, while those among the groups were different (Figure 5F).

3.7. Intestinal Bacterial Community Phenotypes

The horizontal community structure of the intestinal microbiota in three groups is shown in Figure 6A. At the phylum level, the abundance of Proteobacteria, Bacteroidota, Actinobacteriota, and Acidobacteriota decreased in the LF relative to the HF group, while that of the Firmicutes and Fusobacteriota increased. Simultaneously, the abundance of Proteobacteria and Bacteroidota increased in the LFM compared with the LF group but decreased for Fusobacteriota. The ternary plot could visually reveal the abundance of different species in the samples. As shown in Figure 6B, the species enrichment level was higher in the LFM, followed by HF, and it was lowest in the LF group. LEfSe analysis of the evolutionary branching map showed the differential bacterial taxa in the intestine of M. salmoides fed with HF, LF, and LFM diets. In addition, the ratio of Firmicutes to Bacteroidota in the LF group was significantly higher than that in the HF and LFM groups (p < 0.05; Figure 6C). Moreover, Proteobacteria were markedly lower in the LF group (p < 0.05; Figure 6D). In the cladogram, compared with the HF and LF groups, Roseburia, Lachnospiraceae_NK4A136_group, and unclassified_Oscillospiraceae were unique within the LFM group (Figure 6E). The differences in genus abundance between the two groups were analyzed by Metastats. Figure 6F,G show the comparison among genera of the LFM group with HF and LF groups, respectively.

4. Discussion

Fishmeal is widely used in aquatic animal feed due to its balanced amino acids [30]. Compared to fishmeal, soy protein is known for its low levels of methionine [31]. In the present study, the content of methionine in soybean meal is the lowest among several main ingredients in feed (as shown in the Supplementary Materials). In addition, compared with the plant protein source used in this study, the essential amino acid content of poultry meal is more similar to that of fishmeal, except for lysine and methionine (as shown in the Supplementary Materials), which are also the main limiting amino acids in poultry by-products [32]. Therefore, in the present study, methionine was supplemented with a low-fishmeal diet to explore its application effect in M. salmoides feed. Peptides have attracted widespread attention due to their unique transport mechanisms, leading to faster and more effective absorption rates than free-form crystalline amino acids in the intestines [21,33,34]. A study on DL-Methionine (DL-Met) and Met-Met showed that dietary Met-Met supplementation was more effective than DL-Met in L. vannamei [35]. Our results showed that growth-related indicators and feed utilization were decreased by reducing FM from 40 to 25%. However, compared to 25% FM, the supplementation of 25% FM with 0.40% DL-Met or 0.10% Met-Met significantly improved FW, WGR, and SGR. These results suggested the role of DL-Met or Met-Met supplementation in alleviating the negative effects of low-FM diets. Previous studies showed that DL-Met or Met-Met could promote the growth of larvae, juvenile Red Sea Bream [21], and L. vannamei [
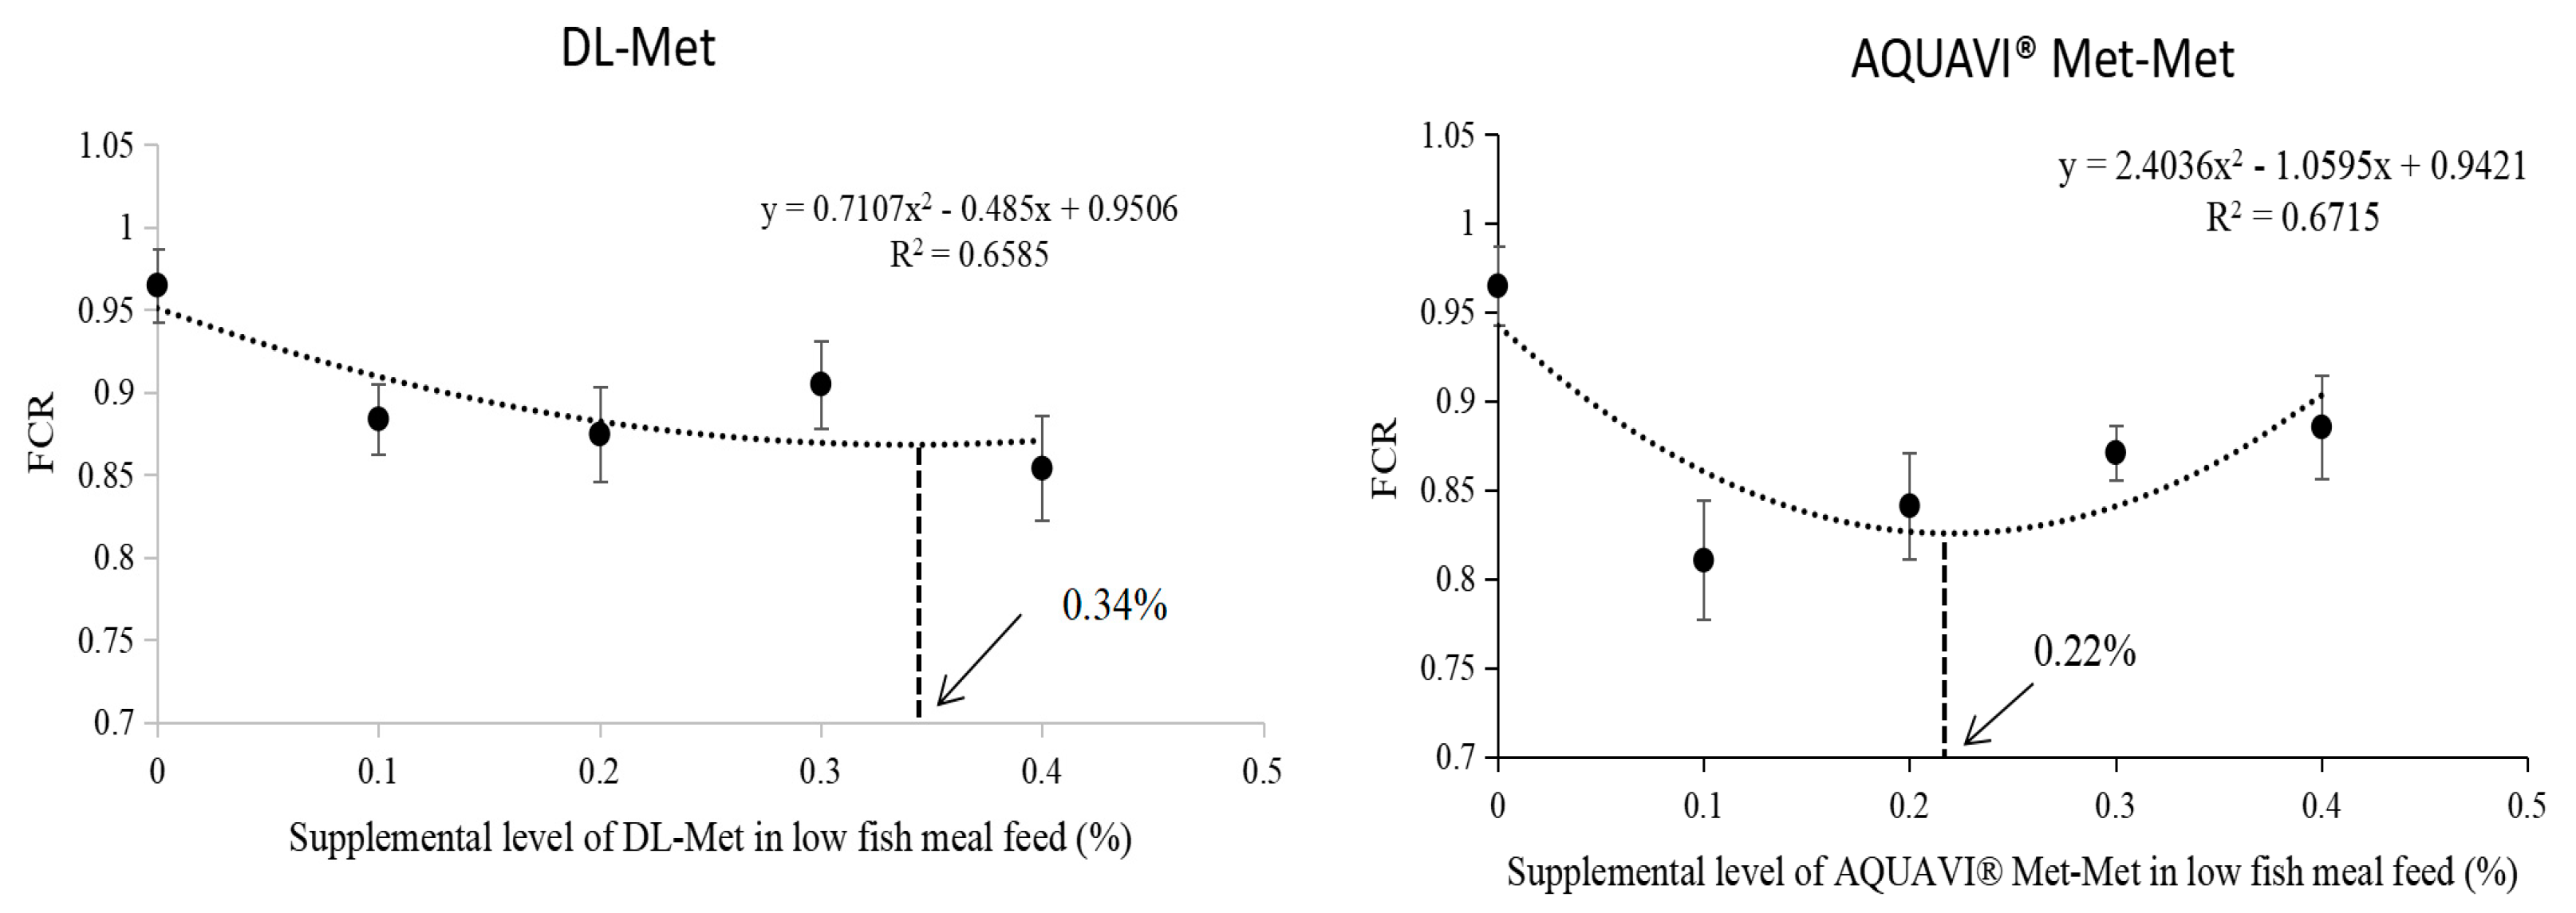
35]. According to the quadratic regression analysis of the FCR index, 0.34% DL-Met or 0.22% Met-Met added to LF meal resulted in similar growth and feed utilization by M. salmoides as those feeding on high FM. Therefore, it can be concluded that the M. salmoides diet with low FM required a higher level of DL-Met supplementation than that of Met-Met to induce desirable growth. In other words, M. salmoides shows better utilization of Met-Met than DL-Met. In addition, Xie et al. reported that an improved growth performance of L. vanname could be achieved by adding 0.10% of Met-Met or 0.30% of DL-Met to a low-FM diet [35], which further validated our results. Moreover, in the present study, no significant difference was observed in the whole-body and amino acid composition of M. salmoides among the groups. The results were similar to those reported in the previous studies on L. vannamei [36] and Red Sea Bream [21].
Dietary low-FM contents lead to oxidative stress in M. salmoides [37], which is relieved by antioxidant enzymes and related genes mainly through the Nrf2 signaling pathway [38,39]. Oxidative stress results from the overproduction of reactive oxygen species (ROS), which are removed by the action of antioxidant enzymes (such as SOD, GSH-Px, and CAT) [40]. One of the important indicators of oxidative damage in the body is the increased level of MDA [16]. In the present study, relative to the HF diet, feeding with the LF diet significantly reduced the intestinal CAT, SOD, and GSH levels, whereas the MDA content was increased. This suggests that consuming a low-FM diet could reduce the antioxidant ability of the intestines of M. salmoides, resulting in oxidative damage. Furthermore, in comparison to the LF group, CAT, SOD, and GSH levels in the intestines of M. salmoides increased significantly when DL-Met or Met-Met were added to LF diets. Specifically, 0.20–0.40% of DL-Met or 0.10–0.40% of Met-Met significantly reduced MDA content relative to the LF group. Previous studies on Nile tilapia [20] and L. vannamei [23] reported that 0.20% and 0.10–0.15% of Met-Met increased the antioxidant capacity, respectively. Ji et al. [23] also reported that 0.10–0.25% of Met-Met significantly reduced the MDA content in L. vannamei. Collectively, these results indicated that supplementing with DL-Met or Met-Met could effectively alleviate the intestinal oxidative damage caused by a low-FM diet. Particularly, 0.10% of Met-Met increased GSH and decreased MDA content in comparison to the HF group, suggesting a more effective role of Met-Met than that of DL-Met.
The nrf2-mediated gene expression of antioxidant enzymes reduces external oxidative stress [41]. In the present study, relative to the HF group, the LF diet significantly reduced the expressions of nrf2, cat, and sod genes, whereas the keap1 gene expression levels were significantly increased. According to a study, dietary low FM could reduce the antioxidant capacity in juvenile golden pompano (Trachinotus ovatus) by decreasing the nrf2 expression level in the nrf2 signaling pathway, increasing the keap1 expression level, thereby inhibiting the expression of oxidative stress-related genes, such as sod, cat, and gsh-px [42]. Similarly, a low-FM diet for M. salmoides could downregulate the intestinal antioxidant capacity through the nrf2-mediated expression of antioxidant enzymes and related genes. Compared with the LF group, 0.20–0.40% of DL-Met supplementation significantly upregulated nrf2 and sod genes expression and downregulated keap1 gene expression, whereas 0.10–0.40% of Met-Met the upregulated nrf2, cat, and sod and downregulated the keap1 gene expression in the present study. Conclusively, DL-Met or Met-Met improved the antioxidant capacity of M. salmoides by regulating the activity of related enzymes and genes of the Nrf2 signaling pathway.
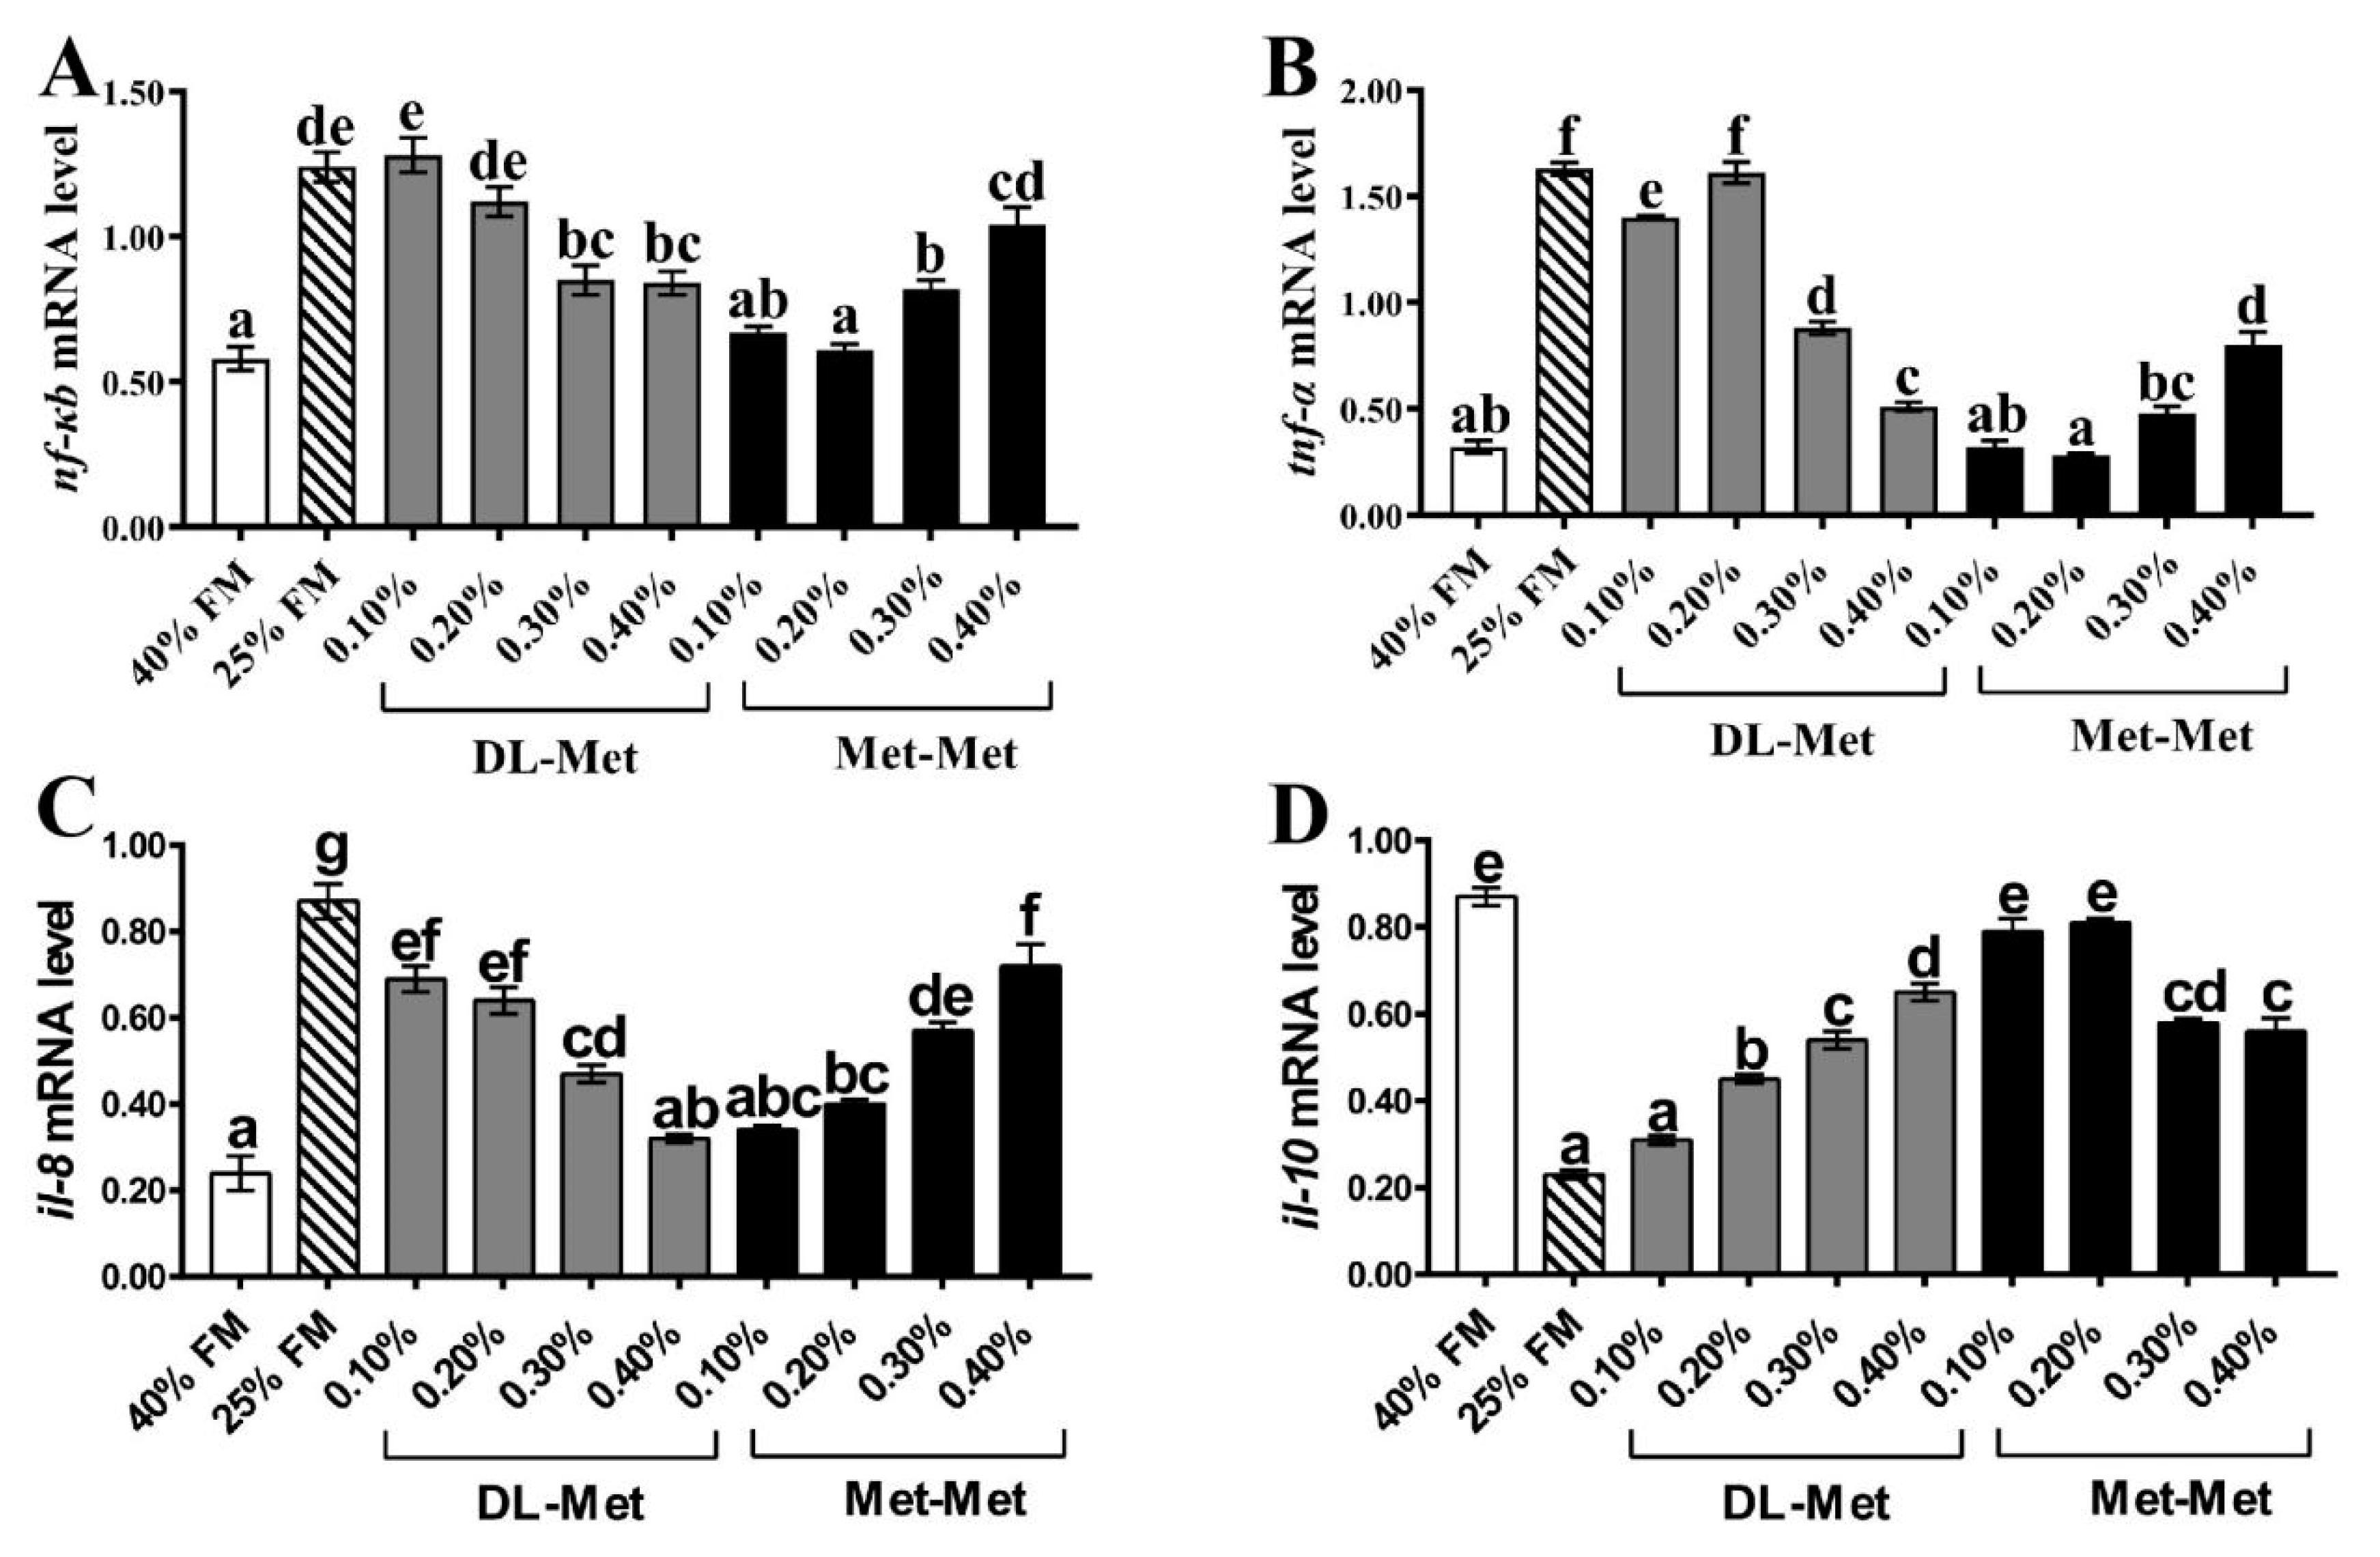
The nuclear factor (nf-κb) can regulate inflammation through cytokines. As a transcription factor, it regulates the expression of pro-inflammatory genes, including tnf-α and il-8, and anti-inflammatory genes, such as il-10 [43,44]. In the present study, significantly upregulated levels of the nf-κb, tnf-α, and il-8 genes and downregulated levels of il-10 were induced by the LF diet relative to the HF group, which is consistent with the results of a previous study [45]. In addition, our results showed that in comparison to the LF group, supplementation with DL-Met or Met-Met significantly down- and upregulated the pro- and anti-inflammatory genes, respectively, in the intestine of M. salmoides. The above results indicated that consumption of a low-FM diet could lead to intestinal inflammation in M. salmoides, and DL-Met or Met-Met supplementation could alleviate the inflammatory response.
The intestinal microbiome is crucial for human health and is substantially influenced by diet [46]. Similarly, in fish, intestinal microbiota plays an important role in nutrition, immunity, and resistance to invading pathogens, and diet greatly influences its composition [47]. According to a study on Nile tilapia, the addition of Met-Met to fish feed could influence the composition of intestinal microbiota [20]. The core microbiota are closely related to the host genotype and remain unaffected by the external environment [48,49]. In the present study, the intestinal tissue samples of M. salmoides fed with the HF, LF, and LFM diets were used for microbiological analysis. The ACE and Simpson and Shannon indices in α-diversity are commonly used to evaluate the species richness and diversity. Our results did not show a significant difference in ACE among the groups, and the lowest values of the Simpson and Shannon index were observed in the LF group, which were significantly increased by Met-Met supplementation. This suggests the potential of Met-Met in enhancing the diversity of intestinal microbiota. PCoA, UPGMA, and sample clustering heatmaps for β-diversity analysis revealed that the microorganisms in the three random samples within the groups were similar; however, there were significant differences in the microbiota among the groups.
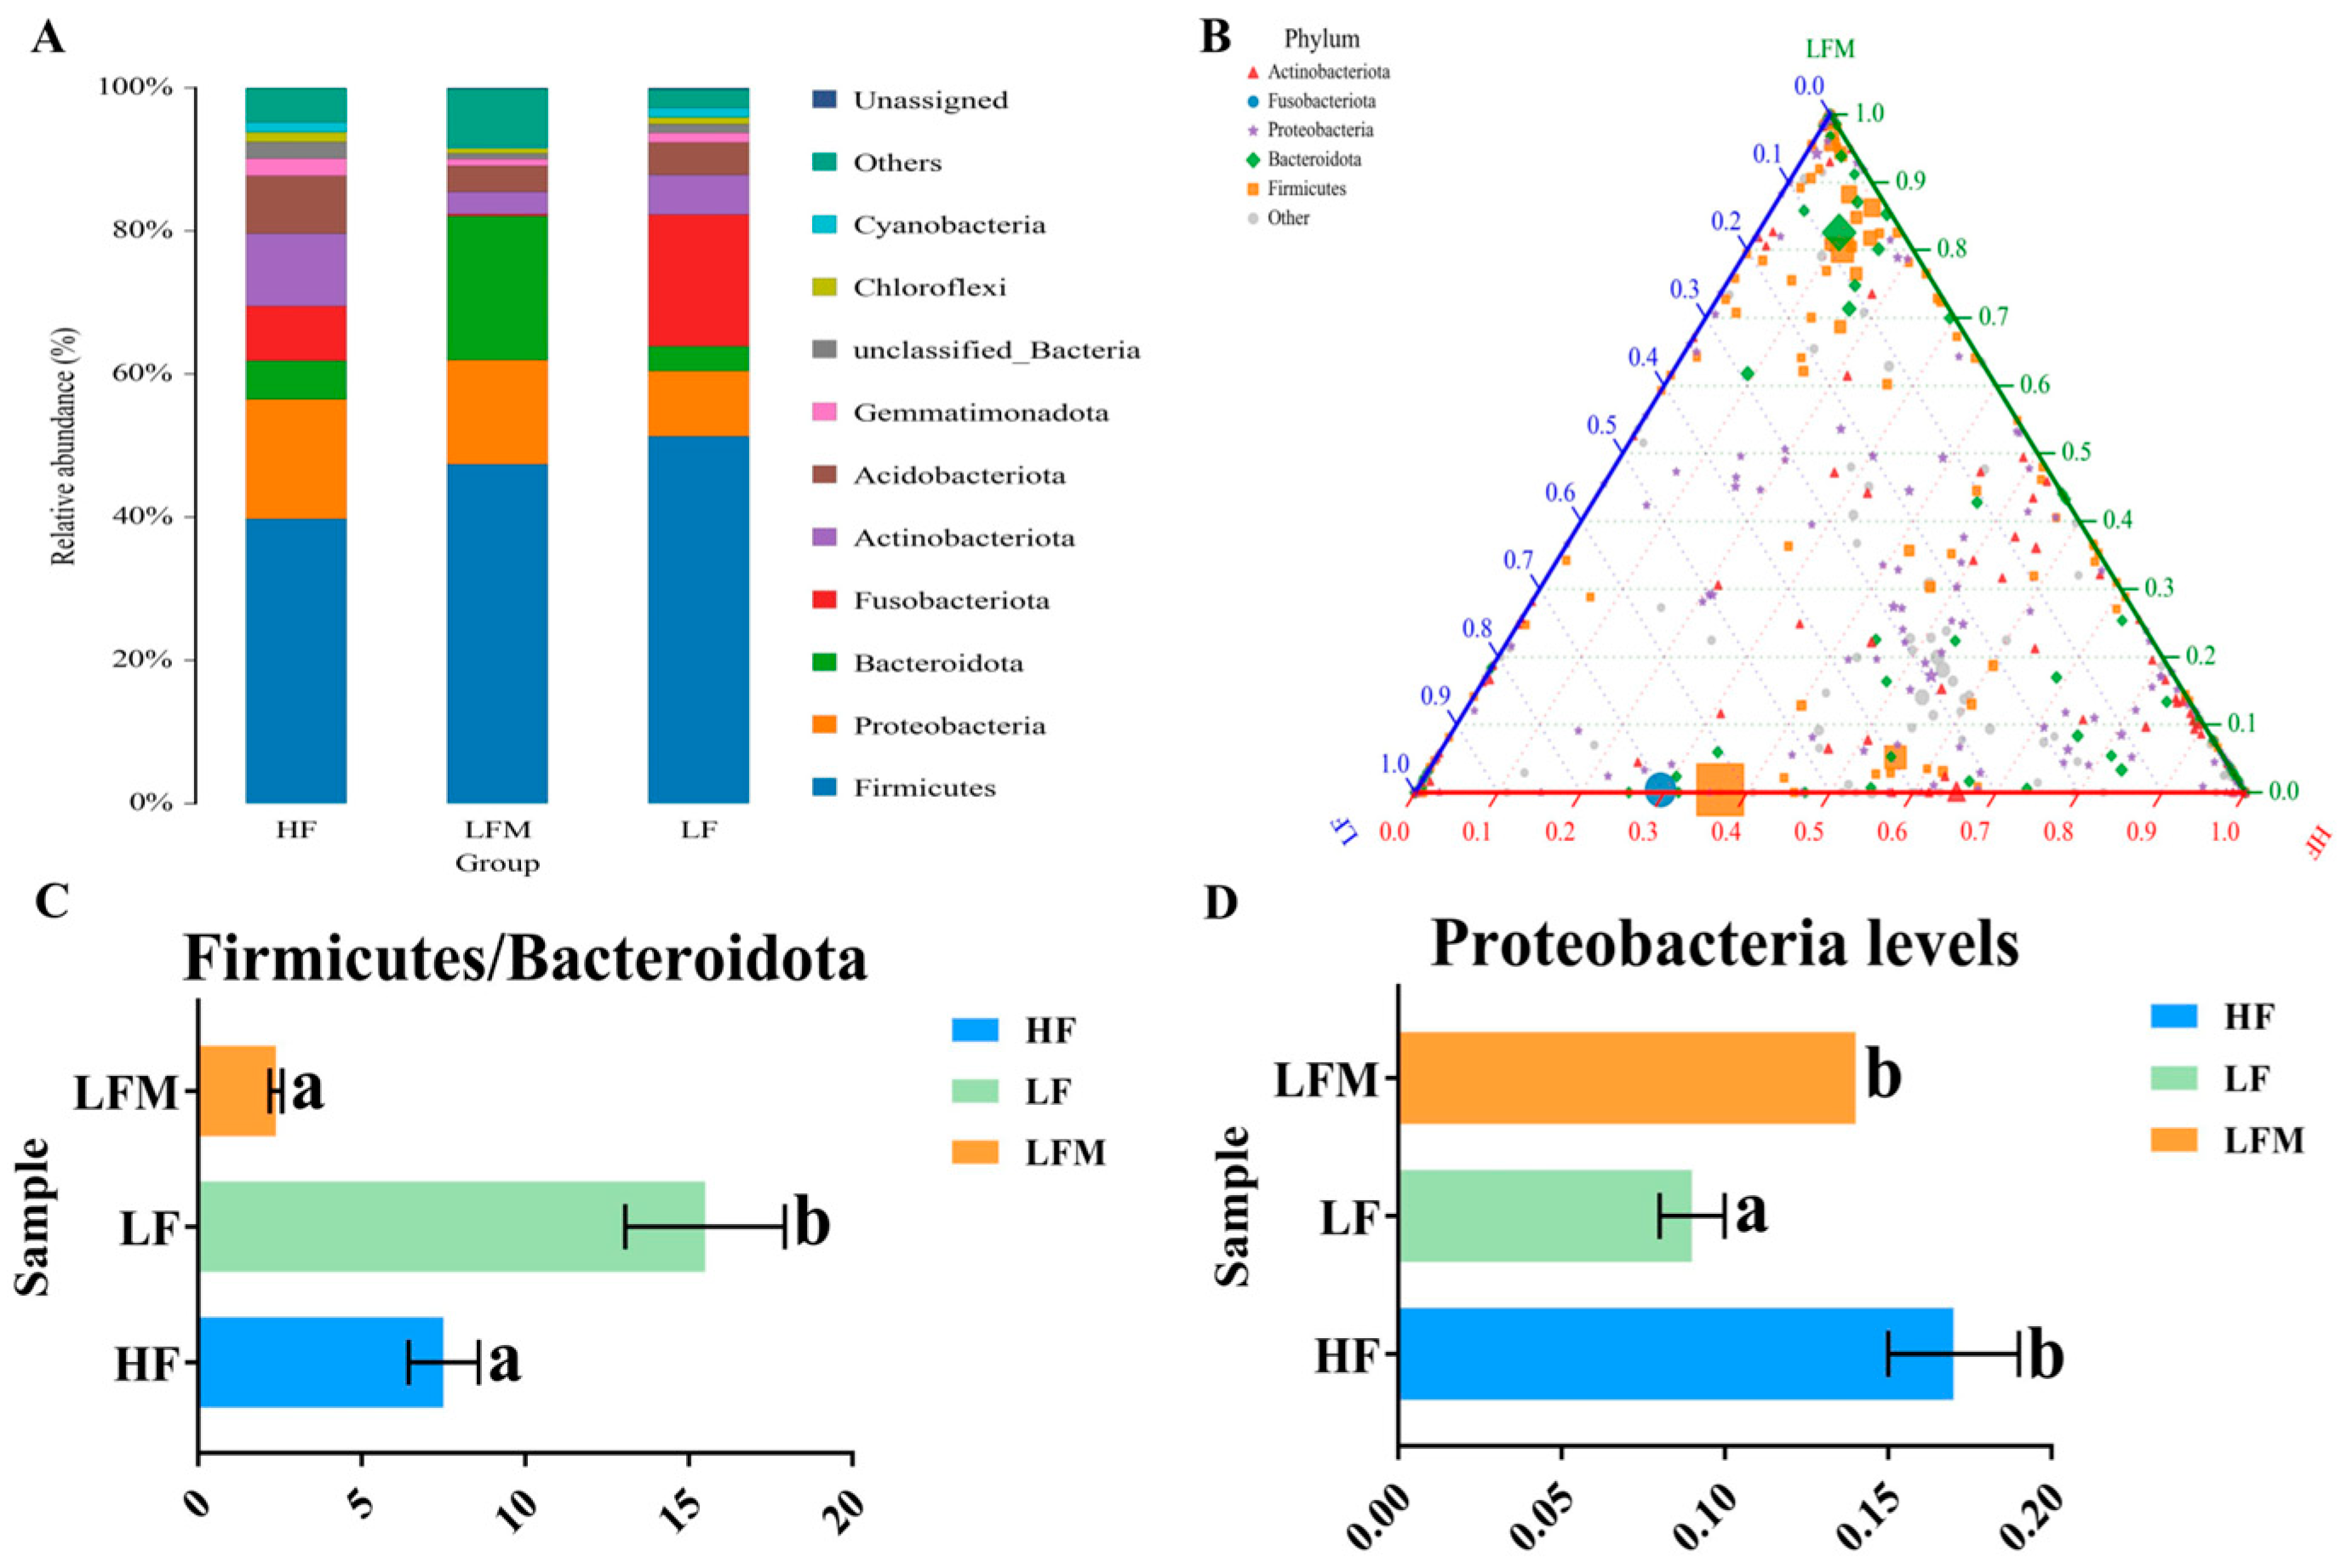
Nevertheless, an imbalanced Firmicutes-to-Bacteroidota ratio could lead to pathogenic invasion [50]. In the present study, the Firmicutes-to-Bacteroidota ratio of the LF group was significantly higher than that of the HF and LFM groups. This suggested that the low-FM diet may lead to an imbalanced Firmicutes-to-Bacteroidota ratio in the intestine of M. salmoides, which was more likely to promote pathogenic invasion, thereby reducing the immunity of fish. However, the supplementation of Met-Met in a low-FM diet could improve intestinal immunity by regulating the Firmicutes-to-Bacteroidota ratio. Furthermore, Proteobacteria is the core intestinal microbiota of fish [51,52]. Previous studies on the intestinal tissue samples of grass carp (Ctenopharyngodon idella) revealed that Proteobacteria is positively correlated with the anti-inflammatory factor tgf-β, suggesting its role in improving the anti-inflammatory ability of fish [53]. Our results showed significantly lower levels of Proteobacteria in the LM group relative to the HF and LFM groups. Moreover, the upregulation of pro-inflammatory factors and downregulation of anti-inflammatory factors might be induced by the imbalanced Firmicutes-to-Bacteroidota ratio or reduced levels of Proteobacteria in a low-FM diet. However, the relevant regulatory mechanisms of bacterial abundance and inflammatory factors need further investigation. The results also demonstrated that Met-Met may improve intestinal health by increasing the abundance of beneficial bacteria. Additionally, the results of the ternary plot showed that Met-Met changed the bacterial diversity, whereas the LEfSe analysis revealed that the unique Roseburia [54,55], Lachnospiraceae_NK4A136_group [56], and unclassified_Oscillospiraceae [57] in the LFM group were beneficial bacteria. Roseburia was negatively correlated with MDA level and positively correlated with antioxidant enzymes, including SOD in the gut of mice [58]. Moreover, it plays an anti-inflammatory role in alleviating colitis pathology, suggesting its potential anti-inflammatory effects [59]. Similarly, Lachnospiraceae_NK4A136_group found in the gut of mice was positively correlated with anti-inflammatory genes and negatively correlated with the pro-inflammatory and oxidative stress factors [60]. Therefore, it can be concluded that changes in the abundance of Roseburia and Lachnospiraceae_NK4A136_group may have resulted from Met-Met supplementation, thereby enhancing the intestinal oxidation and anti-inflammatory capacity of M. salmoides. Notably, unclassified Oscillospiraceae produces butyrate after fermentation in the gut, which helps in the utilization of dietary fiber [61]. The differences in genus abundance between the two groups were analyzed by Metastats. In the present study, compared with the LF and HF groups, the abundance of probiotic bacteria, such as Caldicoprobacter, Pseudogracilibacillus, and Parasutterella, was increased in the LFM group. Moreover, Caldicoprobacter could ferment complex carbohydrates in the intestine to produce lactic acid, thereby promoting the production of short-chain fatty acids to maintain intestinal health [62,63]. Pseudogracilibacilluse and Parasutterella are considered beneficial bacteria [64,65]. In addition, anti-inflammatory effects may be exerted by the metabolites (7-ketodeoxycholic acid and haloperidol glucuronide) produced by Parasutterella [66]. This implies that the supplementation of Met-Met in a low-FM diet could improve the composition and abundance of beneficial bacteria in the gut, thereby improving intestinal health.

5. Conclusions

An FM reduction from 40 to 25% could affect the growth performance and feed utilization, whereas the supplementation with DL-Met or Met-Met improved these parameters. In addition, Met-Met could enhance the antioxidant and anti-inflammatory capacity and effectively regulate the abundance of dominant bacteria to promote the intestinal health of M. salmoides. Moreover, the quadratic regression analysis evaluated the suitable dietary supplementation of DL-Met or Met-Met as 0.34% or 0.22% of the diet, respectively, based on FCR. Finally, relative to DL-Met, Met-Met demonstrated a better utilization rate, and results demonstrated that the effects produced by 0.09% of Met-Met were equivalent to those produced by 0.36% of DL-Met supplementation.

Supplementary Materials

The following supporting information can be downloaded at: https://www.mdpi.com/article/10.3390/antiox13030359/s1, Table S1. The main ingredients’ chemical content and amino acid content.

Author Contributions

Designed the study and diet formulation, M.R. and J.H.; carried out the experiments, analyzed data, and wrote the manuscript, H.Y.; corrected the draft manuscript, K.M.; provided technical, X.G. and H.L.; fish sampling and provided technical, D.H. and C.X. All authors have read and agreed to the published version of the manuscript.

Funding

This study was financially supported by the National Key R & D Program of China (2023YFD2400601), the earmarked fund for CARS (CARS-46), and the National Natural Science Foundation of China (32102806).

Institutional Review Board Statement

The study was conducted according to Management Rule of Laboratory Animals (Chinese Order No. 676 of the State Council, revised 1 March 2017). The study was approved by the Laboratory Animal Ethics Committee of the Freshwater Fisheries Research Center (LAECFFRC-2022-06-13).

Informed Consent Statement

Not applicable.

Data Availability Statement

Data are contained within the article.

Acknowledgments

The authors would like to express sincere thanks to the personnel of the Freshwater Fisheries Research Center, Chinese Academy of Fishery Sciences, for their kind assistance.

Conflicts of Interest

Karthik Masagounder is employed by Evonik Operations GmbH. The remaining authors declare that the research was conducted in the absence of any commercial or financial relationships that could be construed as potential conflicts of interest. Karthik Masagounder made important contributions to the revision of the draft manuscript.

References

  1. Pal, J.; Shukla, B.N.; Maurya, A.K.; Verma, H.O.; Pandey, G.; Amitha. A review on role of fish in human nutrition with special emphasis to essential fatty acid. Int. J. Fish. Aquat. Stud. 2018, 6, 427–430. [Google Scholar]
  2. Mohanty, B.P.; Ganguly, S.; Mahanty, A.; Mitra, T.; Patra, S.; Karunakaran, D.; Mathew, S.; Chakraborty, K.; Paul, B.N.; Sarma, D.; et al. Fish in human health and nutrition. Adv. Fish. Res. 2019, 7, 189–218. [Google Scholar]
  3. FAO. Fisheries and Aquaculture Statistics. Global Aquaculture and Fisheries Production 1950–2018 (Fishstat); FAO Fisheries and Aquaculture Department: Rome, Italy, 2020. [Google Scholar]
  4. Boyd, C.E.; McNevin, A.A.; Davis, R.P. The contribution of fisheries and aquaculture to the global protein supply. Food Secur. 2022, 14, 805–827. [Google Scholar] [CrossRef]
  5. FAO. The State of World Fisheries and Aquaculture—Towards Blue Transformation; Food and Agriculture Organization of the United Nations: Rome, Italy, 2022. [Google Scholar]
  6. Hussein, G.H.G.; Chen, M.; Qi, P.P.; Cui, Q.K.; Yu, Y.; Hu, W.H.; Tian, Y.; Fan, Q.X.; Gao, Z.X.; Feng, M.W.; et al. Aquaculture industry development, annual price analysis and out-of-season spawning in largemouth bass Micropterus salmoides. Aquaculture 2020, 220, 725–735. [Google Scholar] [CrossRef]
  7. Ministry of Agriculture (Ed.). Chinese Fishery Statistical Yearbook Bureau of Fisheries; China Agriculture Press: Beijing, China. Available online: https://www.zgtjnj.org/navibooklist-n3023120419-1.html (accessed on 12 March 2024).
  8. Cho, J.H.; Kim, I.H. Fish meal-nutritive value. J. Anim. Physiol. Anim. Nutr. 2011, 95, 685–692. [Google Scholar] [CrossRef] [PubMed]
  9. FAO. The State of World Fisheries and Aquaculture; Food and Agricultural Organization: Rome, Italy, 2020; Available online: http://www.fao.org/documents/card/en/c/ca9229en (accessed on 12 March 2024).
  10. Huang, D.; Wu, Y.B.; Lin, Y.Y.; Chen, J.M.; Karrow, N.; Ren, X.; Wang, Y. Dietary protein and lipid requirements for juvenile Largemouth Bass, Micropterus salmoides. J. World Aquac. Soc. 2017, 48, 782–790. [Google Scholar] [CrossRef]
  11. Kaushik, S.J.; Seiliez, I. Protein and amino acid nutrition and metabolism in fish: Current knowledge and future needs. Aquac. Res. 2010, 41, 322–332. [Google Scholar] [CrossRef]
  12. Hardy, R.W. Utilization of plant proteins in fish diets: Effects of global demand and supplies of fishmeal. Aquac. Res. 2010, 41, 770–776. [Google Scholar] [CrossRef]
  13. Suresh, A.V.; Nates, S. Attractability and palatability of protein ingredients of aquatic and terrestrial animal origin, and their practical value for blue shrimp, Litopenaeus stylirostris fed diets formulated with high levels of poultry byproduct meal. Aquaculture 2011, 319, 132–140. [Google Scholar] [CrossRef]
  14. Irm, M.; Taj, S.; Jin, M.; Luo, J.X.; Andriamialinirina, H.J.T.; Zhou, Q.C. Effects of replacement of fish meal by poultry by-product meal on growth performance and gene expression involved in protein metabolism for juvenile black sea bream (Acanthoparus schlegelii). Aquaculture 2020, 528, 735544. [Google Scholar] [CrossRef]
  15. Karapanagiotidis, I.T.; Psofakis, P.; Mente, E.; Malandrakis, E.; Golomazou, E. Effect of fishmeal replacement by poultry by-product meal on growth performance, proximate composition, digestive enzyme activity, haematological parameters and gene expression of gilthead seabream (Sparus aurata). Aquac. Nutr. 2019, 25, 3–14. [Google Scholar] [CrossRef]
  16. Wang, Q.C.; Ye, W.; Tao, Y.F.; Li, Y.; Lu, S.Q.; Xu, P.; Qiang, J. Transport Stress Induces Oxidative Stress and Immune Response in Juvenile Largemouth Bass (Micropterus salmoides): Analysis of Oxidative and Immunological Parameters and the Gut Microbiome. Antioxidants 2023, 12, 157. [Google Scholar] [CrossRef]
  17. Gaylord, T.G.; Barrows, F.T.; Teague, A.M.; Johansen, K.A.; Overturf, K.E.; Shepherd, B. Supplementation of taurine and methionine to all-plant protein diets for rainbow trout (Oncorhynchus mykiss). Aquaculture 2007, 269, 514–524. [Google Scholar] [CrossRef]
  18. Hu, M.H.; Wang, Y.J.; Wang, Q.; Zhao, M.; Xiong, B.G.; Qian, X.Q.; Zhao, Y.J.; Luo, Z. Replacement of fish meal by rendered animal protein ingredients with lysine and methionine supplementation to practical diets for gibel carp, Carassius auratus gibelio. Aquaculture 2008, 275, 260–265. [Google Scholar] [CrossRef]
  19. Niu, J.; Lemme, A.; He, J.Y.; Li, H.Y.; Xie, S.W.; Liu, Y.J.; Yang, H.J.; Silva, C.F.; Tian, L.X. Assessing the bioavailability of the Novel Met-Met product (AQUAVI® Met-Met) compared to DL-methionine (DL-Met) in white shrimp (Litopenaeus vannamei). Aquaculture 2018, 484, 322–332. [Google Scholar] [CrossRef]
  20. Guo, T.Y.; Zhao, W.; He, J.Y.; Liao, S.Y.; Xie, J.J.; Xie, S.W.; Masagounder, K.; Liu, Y.J.; Tian, L.X.; Niu, J. Dietary dl-methionyl-dl-methionine supplementation increased growth performance, antioxidant ability, the content of essential amino acids and improved the diversity of intestinal microbiota in Nile tilapia (Oreochromis niloticus). Br. J. Nutr. 2020, 123, 72–83. [Google Scholar] [CrossRef]
  21. Mamauag, R.E.P.; Gao, J.; Nguyen, B.T.; Ragaza, J.A.; Koshio, S.; Ishikawa, M. Supplementations of dl-methionine and methionine dipeptide in diets are effective for the development and growth of larvae and juvenile red sea bream, Pagrus major. J. World Aquac. Soc. 2012, 43, 362–374. [Google Scholar] [CrossRef]
  22. Nunes, A.J.P.; Masagounder, K. Optimal Levels of Fish Meal and Methionine in Diets for Juvenile Litopenaeus vannamei to Support Maximum Growth Performance with Economic Efficiency. Animals 2023, 13, 20. [Google Scholar] [CrossRef]
  23. Ji, R.L.; Wang, Z.; He, J.Y.; Masagounder, K.; Xu, W.; Mai, K.S.; Ai, Q.H. Effects of DL-methionyl-DL-methionine supplementation on growth performance, immune and antioxidative responses of white leg shrimp (Litopenaeus vannamei) fed low fishmeal diet. Aquac. Rep. 2021, 21, 100785. [Google Scholar] [CrossRef]
  24. AOAC (Association of Official Analytical Chemists). Official Methods of Analysis of the Association of Official Analytical Chemists, 15th ed.; Association of Official Analytical Chemists: Washington, DC, USA, 2003. [Google Scholar]
  25. Edgar, R.C. UPARSE: Highly accurate OTU sequences from microbial amplicon reads. Nat. Methods 2013, 10, 996. [Google Scholar] [CrossRef]
  26. Stone, D.A.J.; Gaylord, T.G.; Johansen, K.A.; Overturf, K.; Sealey, W.M.; Hardy, R.W. grdxcEvaluation of the effects of repeated fecal collection by manual stripping on the plasma cortisol levels, TNF-α gene expression, and digestibility and availability of nutrients from hydrolyzed poultry and egg meal by rainbow trout, Oncorhynchus mykiss (Walbaum). Aquaculture 2008, 275, 250–259. [Google Scholar] [CrossRef]
  27. Xv, Z.C.; He, G.L.; Wang, X.L.; Shun, H.; Chen, Y.J.; Lin, S.M. Mulberry leaf powder ameliorate high starch-induced hepatic oxidative stress and inflammation in fish model. Anim. Feed. Sci. Technol. 2021, 278, 115012. [Google Scholar] [CrossRef]
  28. Zhao, F.Y.; Xu, P.; Xu, G.C.; Hunag, D.Y.; Zhang, L.; Ren, M.C.; Liang, H.L. Dietary valine affects growth performance, intestinal immune and antioxidant capacity in juvenile largemouth bass (Micropterus salmoides). Anim. Feed. Sci. Technol. 2023, 295, 115541. [Google Scholar] [CrossRef]
  29. Gu, J.Z.; Liang, H.L.; Ge, X.P.; Xia, D.; Pan, L.K.; Mi, H.F.; Ren, M.C. A study of the potential effect of yellow mealworm (Tenebrio molitor) substitution for fish meal on growth, immune and antioxidant capacity in juvenile largemouth bass (Micropterus salmoides). Fish Shellfish. Immunol. 2022, 120, 214–221. [Google Scholar] [CrossRef]
  30. Olsen, R.L.; Hasan, M.R. A limited supply of fishmeal: Impact on future increases in global aquaculture production. Trends Food Sci. Technol. 2012, 27, 120–128. [Google Scholar] [CrossRef]
  31. Gatlin, D.M., III; Barrows, F.T.; Brown, P.; Dabrowski, K.; Gaylord, T.G.; Hardy, R.W.; Herman, E.; Hu, G.S.; Krogdahl, Å.; Nelson, R.; et al. Expanding the utilization of sustainable plant products in aquafeeds: A review. Aquac. Res. 2007, 38, 551–579. [Google Scholar] [CrossRef]
  32. Shapawi, R.; Ng, W.K.; Mustafa, S. Replacement of fish meal with poultry by-product meal in diets formulated for the humpback grouper, Cromileptes altivelis. Aquaculture 2007, 273, 118–126. [Google Scholar] [CrossRef]
  33. Reynal, S.; Ipharraguerre, I.; Lineiro, M.; Brito, A.; Broderick, G.; Clark, J. Omasal flow of soluble proteins, peptides, and free amino acids in dairy cows fed diets supplemented with proteins of varying ruminal degradabilities. J. Dairy Sci. 2007, 90, 1887–1903. [Google Scholar] [CrossRef]
  34. Dabrowski, K.; Lee, K.J.; Rinchard, J. The smallest vertebrate, teleost fish, can utilize synthetic dipeptide-based diets. J. Nutr. 2003, 133, 4225–4229. [Google Scholar] [CrossRef] [PubMed]
  35. Xie, J.J.; Lemme, A.; He, J.Y.; Yin, P.; Figueiredo-Silva, C.; Liu, Y.J.; Xie, S.W.; Niu, J.; Tian, L.X. Fishmeal levels can be successfully reduced in white shrimp (Litopenaeus vanname) if supplemented with DL-Methionine (DL-Met) or DL-Methionyl-DL-Methionine (Met-Met). Aquac. Nutr. 2018, 24, 1144–1152. [Google Scholar] [CrossRef]
  36. Wang, L.; Ye, L.; Hua, Y.; Zhang, G.W.; Li, Y.H.; Zhang, J.Z.; He, J.Y.; Liu, M.Y.; Shao, Q.J. Effects of dietary dl-methionyl-dl-methionine (Met-Met) on growth performance, body composition and haematological parameters of white shrimp (Litopenaeus vannamei) fed with plant protein-based diets. Aquac. Res. 2019, 50, 1718–1730. [Google Scholar] [CrossRef]
  37. Yu, H.; Ge, X.P.; Zhang, L.; Chen, X.R.; Ren, M.C.; Liang, H.L. Transcriptome analysis reveals the feeding response and oxidative stress in juvenile Micropterus salmoides fed a low-fish-meal diet with enzyme-hydrolysed intestinal mucosa protein substitution. Aquaculture 2023, 570, 739441. [Google Scholar] [CrossRef]
  38. Deng, Y.P.; Jiang, W.D.; Liu, Y.; Jiang, J.; Kuang, S.Y.; Tang, L.; Wu, P.; Zhang, Y.A.; Feng, L.; Zhou, X.Q. Differential growth performance, intestinal antioxidant status and relative expression of Nrf2 and its target genes in young grass carp (Ctenopharyngodon idella) fed with graded levels of leucine. Aquaculture 2014, 434, 66–73. [Google Scholar] [CrossRef]
  39. Giuliani, M.E.; Regoli, F. Identification of the Nrf2-Keap1 pathway in the European eel Anguilla anguilla: Role for a transcriptional regulation of antioxidant genes in aquatic organisms. Aquat. Toxicol. 2014, 150, 117–123. [Google Scholar] [CrossRef] [PubMed]
  40. Lesser, M.P. Oxidative stress in marine environments: Biochemistry and physiological ecology. Annu. Rev. Physiol. 2006, 68, 253–278. [Google Scholar] [CrossRef] [PubMed]
  41. Bloom, D.; Dhakshinamoorthy, S.; Wang, W.; Celli, C.M.; Jaiswal, A.K. Role of NF-E2 related factors in oxidative stress. Cell Mol. Responses. Stress. 2001, 2, 229–238. [Google Scholar] [CrossRef]
  42. Liu, J.X.; Guo, H.Y.; Zhu, K.C.; Liu, B.S.; Zhang, N.; Zhang, D.C. Effects of exogenous taurine supplementation on the growth, antioxidant capacity, intestine immunity, and resistance against Streptococcus agalactiae in juvenile golden pompano (Trachinotus ovatus) fed with a low-fishmeal diet. Front. Immunol. 2022, 13, 1036821. [Google Scholar] [CrossRef] [PubMed]
  43. Tak, P.P.; Firestein, G.S. NF-κB: A key role in inflammatory diseases. J. Clin. Investig. 2001, 107, 7–11. [Google Scholar] [CrossRef] [PubMed]
  44. Al-Ashy, R.; Chakroun, I.; El-Sabban, M.E.; Homaidan, F.R. The role of NF-κB in mediating the anti-inflammatory effects of IL-10 in intestinal epithelial cells. Cytokine 2006, 36, 1–8. [Google Scholar] [CrossRef]
  45. Cai, W.J.; Fu, L.L.; Liu, H.K.; Yi, J.H.; Yang, F.; Hua, L.H.; He, L.Y.; Han, D.; Zhu, X.M.; Yang, Y.X.; et al. Dietary yeast glycoprotein supplementation improves the growth performance, intestinal health and disease resistance of largemouth bass (Micropterus salmoides) fed low-fishmeal diets. Front. Immunol. 2023, 14, 1164087. [Google Scholar] [CrossRef] [PubMed]
  46. Voreades, N.; Kozil, A.; Weir, T.L. Diet and the development of the human intestinal microbiome. Front. Microbiol. 2014, 5, 494. [Google Scholar] [CrossRef]
  47. Wang, A.R.; Ran, C.; Ringø, E.; Zhou, Z.G. Progress in fish gastrointestinal microbiota research. Rev. Aquac. 2018, 10, 626–640. [Google Scholar] [CrossRef]
  48. Yan, Q.Y.; Li, J.J.; Yu, Y.H.; Wang, J.J.; He, Z.L.; Nostrand, J.D.V.; Kempher, M.L.; Wu, L.Y.; Wang, Y.P.; Liao, L.Y.; et al. Environmental filtering decreases with fish development for the assembly of gut microbiota. Environ. Microbiol. 2016, 18, 4739–4754. [Google Scholar] [CrossRef] [PubMed]
  49. Sullam, K.E.; Rubin, B.E.; Dalton, C.M.; Kilham, S.S.; Flecker, A.S.; Russell, J.A. Divergence across diet, time and populations rules out parallel evolution in the gut microbiomes of Trinidadian guppies. ISME J. 2015, 9, 1508–1522. [Google Scholar] [CrossRef] [PubMed]
  50. Huang, P.; Cao, L.P.; Du, J.L.; Gao, J.C.; Zhang, Y.N.; Sun, Y.; Li, Q.J.; Nie, Z.Y.; Xu, G.C. Effects of Prometryn Exposure on Hepatopancreas Oxidative Stress and Intestinal Flora in Eriocheir sinensis (Crustacea: Decapoda). Antioxidants 2023, 12, 1548. [Google Scholar] [CrossRef]
  51. Li, J.; Ni, J.; Li, J.; Wang, C.; Li, X.; Wu, S.; Zhang, T.; Yu, H.; Yan, Q. Comparative study on gastrointestinal microbiota of eight fish species with different feeding habits. J. Appl. Microbiol. 2014, 117, 1750–1760. [Google Scholar] [CrossRef] [PubMed]
  52. Roeselers, G.; Mittge, E.K.; Stephens, W.Z.; Parichy, D.M.; Cavanaugh, C.M.; Guillemin, K.; Rawls, J.F. Evidence for a core gut microbiota in the zebrafish. ISME J. 2011, 5, 1595–1608. [Google Scholar] [CrossRef] [PubMed]
  53. Liu, S.L.; Wang, S.D.; Liu, X.W.; Wen, L.F.; Zou, J.X. Effects of dietary antimicrobial peptides on intestinal morphology, antioxidant status, immune responses, microbiota and pathogen disease resistance in grass carp Ctenopharyngodon idellus. Microb. Pathog. 2022, 165, 105386. [Google Scholar] [CrossRef] [PubMed]
  54. Nie, K.; Ma, K.J.; Luo, W.W.; Shen, Z.H.; Yang, Z.Y.; Xiao, M.W.; Tong, T.; Yang, Y.Y.; Wang, X.Y. Roseburia intestinalis: A beneficial gut organism from the discoveries in genus and species. Front. Cell. Infect. Microbiol. 2021, 11, 757718. [Google Scholar] [CrossRef]
  55. Mabwi, H.A.; Lee, H.J.; Hitayezu, E.; Mauliasari, I.R.; Pan, C.H. Emodin modulates gut microbial community and triggers intestinal immunity. J. Sci. Food Agric. 2023, 103, 1273–1282. [Google Scholar] [CrossRef]
  56. Wu, M.R.; Chou, T.S.; Huang, C.Y.; Hsiao, J.K. A potential probiotic-Lachnospiraceae NK4A136 group: Evidence from the restoration of the dietary pattern from a high-fat diet. Res. Sq. 2020. [Google Scholar] [CrossRef]
  57. Rang, Y.F.; Liu, H.; Cheng, X.B.; Li, W.Y.; Shi, J.; Ou, G.H.; Huang, H.Y.; Chen, C.Y.; Xiao, X.M.; Liu, C.H. Structural characterization of pectic polysaccharides from Amaranth caudatus leaves and the promotion effect on hippocampal glucagon-like peptide-1 level. Int. J. Biol. Macromol. 2023, 242, 124967. [Google Scholar] [CrossRef]
  58. Zhang, S.; Ma, Y.T.; Feng, Y.C.; Wang, C.Y.; Zhang, D.J. Potential effects of mung bean protein and a mung bean protein-polyphenol complex on oxidative stress levels and intestinal microflora in aging mice. Food Funct. 2022, 13, 186–197. [Google Scholar] [CrossRef]
  59. Shen, Z.; Zhu, C.; Quan, Y.; Yang, J.; Yuan, W.; Yang, Z.Y.; Wu, S.; Luo, W.W.; Tan, B.; Wang, X.Y. Insights into Roseburia intestinalis which alleviates experimental colitis pathology by inducing anti-inflammatory responses. J. Gastroenterol. Hepatol. 2018, 33, 1751–1760. [Google Scholar] [CrossRef] [PubMed]
  60. Xia, T.; Duan, W.H.; Zhang, Z.J.; Li, S.P.; Zhao, Y.X.; Geng, B.B.; Zheng, Y.; Yu, J.W.; Wang, Y. Polyphenol-rich vinegar extract regulates intestinal microbiota and immunity and prevents alcohol-induced inflammation in mice. Food Res. Int. 2021, 140, 110064. [Google Scholar] [CrossRef] [PubMed]
  61. Konikoff, T.; Gophna, U. Oscillospira: A central, enigmatic component of the human gut microbiota. Trends. Microbiol. 2016, 24, 523–524. [Google Scholar] [CrossRef] [PubMed]
  62. Kuprys, P.V.; Cannon, A.R.; Shieh, J.; Iftekhar, N.; Park, S.K.; Eberhardt, J.M.; Ding, X.Z.; Choudhry, M.A. Alcohol decreases intestinal ratio of Lactobacillus to Enterobacteriaceae and induces hepatic immune tolerance in a murine model of DSS-colitis. Gut Microbes 2020, 12, 1838236. [Google Scholar] [CrossRef] [PubMed]
  63. Xue, G.; Lai, S.Z.; Li, X.; Zhang, W.J.; You, J.G.; Chen, H.; Qian, Y.J.; Gao, P.; Liu, Z.H.; Liu, Y.N. Efficient bioconversion of organic wastes to high optical activity of L-lactic acid stimulated by cathode in mixed microbial consortium. Water Res. 2018, 131, 1–10. [Google Scholar] [CrossRef]
  64. Xiao, M.F.; Lin, L.; Chen, H.P.; Ge, X.D.; Huang, Y.; Zheng, Z.P.; Li, S.M.; Pan, Y.Y.; Liu, B.; Zeng, F. Anti-fatigue property of the oyster polypeptide fraction and its effect on gut microbiota in mice. Food Funct. 2020, 11, 8659–8669. [Google Scholar] [CrossRef]
  65. Ju, T.T.; Kong, J.Y.; Stothard, P.; Willing, B.P. Defining the role of Parasutterella, a previously uncharacterized member of the core gut microbiota. ISME J. 2019, 13, 1520–1534. [Google Scholar] [CrossRef] [PubMed]
  66. Yu, J.T.; Hu, Q.; Liu, J.S.; Luo, J.M.; Liu, L.; Peng, X.C. Metabolites of gut microbiota fermenting Poria cocos polysaccharide alleviates chronic nonbacterial prostatitis in rats. Int. J. Biol. Macromol. 2022, 209, 1593–1604. [Google Scholar] [CrossRef] [PubMed]
Figure 1. Quadratic regression equation analysis of feed conversion rate (FCR) in juvenile M. salmoides fed with different levels of DL-Met and Met-Met.
Antioxidants 13 00359 g001
Figure 2. Activity of antioxidant-related parameters in the intestine of M. salmoides. Catalase (CAT) (A), superoxide dismutase (SOD) (B), glutathione (GSH) (C), glutathione peroxidase (GSH-Px) (D), malondialdehyde (MDA) (E). The 40% FM group (HF) and 25% FM group (LF). Data are presented as mean ± standard error, with different letters indicating differences within the groups (p < 0.05).
Antioxidants 13 00359 g002
Figure 3. Expression of antioxidant-related genes in the intestine of M. salmoides. Nuclear factor erythroid 2-related factor 2 (nrf2) (A), kelch-like ECH-associated protein 1 (keap1) (B), catalase (cat) (C), superoxide dismutase (sod) (D), glutathione peroxidase (gsh-px) (E). The 40% FM group (HF) and 25% FM group (LF). Data are presented as mean ± standard error, with different letters indicating differences within the groups (p < 0.05).
Antioxidants 13 00359 g003
Figure 4. Expression of inflammatory-related genes in the intestine of M. salmoides. The nuclear factor κB (nf-κb) (A), tumor necrosis factor-alpha (tnf-α) (B), interleukin 8 (il-8) (C), interleukin 10 (il-10) (D). The 40% FM group (HF) and 25% FM group (LF). Data are presented as mean ± standard error, with different letters indicating differences within the groups (p < 0.05).
Antioxidants 13 00359 g004
Figure 5. The intestinal tissue samples of three M. salmoides fed with 40% fishmeal (HF), 25% fishmeal (LF), and 25% fishmeal supplemented with 0.10% of Met-Met (LFM) were used for microbiological analysis. ACE and Simpson and Shannon indices of the HF, LF, and LFM groups were shown (AC). The degree of proximity of the samples on the graph indicated the similarity level (D). The species diversity, abundance similarity, and dominant species of each sample were compared according to the intensity of each color (E). The color gradient from blue to red indicates the distance among samples from near to far (F). Data are presented as mean ± standard error, with different letters indicating differences within the groups (p < 0.05).
Antioxidants 13 00359 g005
Figure 6. Each color represents one phylum level, and the color block length (bar chart) represents the relative abundance of the species, showing only the top ten phylum levels of abundance (A). Different shapes and points represent different phyla and genus, respectively, and the size of the points is the relative abundance of the genus. The three vertices represent three groups. The closer the point is to a vertex, the higher the abundance of the flora represented at that point in the sample represented at that vertex (B). Firmicutes/Bacteroidota represent the ratio of Firmicutes to Bacteroidota (C) and Proteobacteria levels (D) in three samples, with different letters indicating differences within the groups (p < 0.05); the circles radiating from the inside out represent taxonomic levels from phylum to species. Each small circle at a different classification level represents a classification at that level, and the diameter of the small circle is proportional to the relative abundance. The coloring rule uniformly imparts color to species with no significant differences as yellow, whereas species with differences are colored according to the highest abundance group where the species were located. Different colors represent different groups, and nodes with different colors represent microbial communities that occupy an important position in the groups represented by that color (E). The first and second columns provided information on species classification and grouping, respectively. The third and fourth columns listed the average abundance with standard error and relative abundance histograms of each group, respectively. p value < 0.05 was considered as a significant difference, ** p < 0.001, *** p < 0.0001, and the blue boxs represents the significantly increased bacterial genera in the LFM group compared to the HF and LF groups, respectively (F,G).
Antioxidants 13 00359 g006aAntioxidants 13 00359 g006b
Table 1. The key indicators of water quality monitoring during the culture cycle.
Water Environmental FactorsRange
Temperature15–20 °C
Dissolved oxygen>6 mg/L
Ammonia nitrogen content<0.1 mg/L
pH6.8–7.5
Table 2. Ingredient and proximate analysis of the experimental diets.
ItemDiets
40% FM25% FM0.10% DL-Met0.20% DL-Met0.30% DL-Met0.40% DL-Met0.10% Met-Met0.20% Met-Met0.30% Met-Met0.40% Met-Met
Fishmeal 140252525252525252525
Poultry meal 11151515151515151515
Blood cell protein 1 3333333333
Soybean meal 118181818181818181818
Corn gluten meal 12222222222
Soy protein concentrate 17777777777
Shrimp paste2222222222
Rice bran4.983.653.533.43.283.153.533.43.283.15
Wheat6666666666
Tapioca4444444444
Fish oil5.876.026.046.066.086.16.046.066.086.1
Soybean oil2222222222
Monocalcium phosphate23.663.663.663.663.673.663.663.663.67
Choline chloride0.30.30.30.30.30.30.30.30.30.3
L-carnitine hydrochloride0.30.30.30.30.30.30.30.30.30.3
L-ascorbate-2-phosphate ester0.050.050.050.050.050.050.050.050.050.05
Vitamin premix feed for carnivorous fish 20.50.50.50.50.50.50.50.50.50.5
Trace mineral premix for carnivorous fish 21111111111
L-Lysine 300.290.290.30.30.30.290.30.30.3
DL-Met000.10.20.30.40000
Met-Met0000000.10.20.30.4
L-threonine 300.230.230.230.230.230.230.230.230.23
Proximate analysis (% dry basis)
Protein47.4847.2847.447.2247.5147.5547.347.4547.3747.27
Lipid12.0411.9512.112.1212.1312.0912.1212.0212.1812
Gross energy (KJ/g)20.1119.772019.9920.0519.6919.8919.6819.5319.65
Note: 1 Fishmeal and other major protein sources were purchased from Wuxi Tongwei feedstuffs Co., Ltd. (Wuxi, China); 2 Vitamin premix and trace mineral premix were obtained from HANOVE Animal Health Products (IU, mg/kg of premix). Vitamin premix (IU or mg/kg of premix): vitamin A, 800,000 IU; vitamin D3, 250,000 IU; vitamin E, 4500 IU; vitamin K3, 600 mg; thiamin, 800 mg; ribofavin, 800 mg; calcium pantothenate, 2000 mg; pyridoxine HCl, 2500 mg; cyanocobalamin, 8 mg; biotin, 16 mg; folic acid, 400 mg; niacin, 2800 mg; inositol, 10,000 mg; vitamin C, 10,000 mg. Mineral premix (g/kg of premix): magnesium sulfate, 15 g; ferrous sulfate, 30 g; zinc sulfate, 13.5 g; cupric sulfate, 0.8 g; manganese sulfate, 6 g; zeolite was used as a carrier. 3 L-Lysine and L-threonine obtained from Feeer Co., Ltd. (Shanghai, China).
Table 3. Amino acid content in diets and Met-Met and DL-Met levels after supplementation.
ItemDiets
40% FM25% FM0.10% DL-Met0.20% DL-Met0.30% DL-Met0.40% DL-Met0.10% Met-Met0.20% Met-Met0.30% Met-Met0.40% Met-Met
Essential amino acid
Met1.03 0.94 1.04 1.13 1.23 1.31 1.10 1.15 1.23 1.35
Lys3.17 3.13 3.12 3.12 3.13 3.15 3.20 3.14 3.07 3.13
Thr1.80 1.98 1.98 1.99 1.98 2.00 2.05 1.99 1.94 1.98
Arg2.68 2.83 2.92 2.91 2.89 2.89 2.90 2.87 2.80 2.92
ILe1.89 1.99 1.98 1.98 1.99 2.01 2.03 1.99 1.95 1.98
Leu3.62 3.61 3.60 3.62 3.60 3.65 3.71 3.62 3.56 3.62
Val2.34 2.35 2.32 2.31 2.29 2.32 2.39 2.32 2.28 2.33
His1.41 1.29 1.29 1.29 1.28 1.30 1.31 1.29 1.26 1.29
Phe2.14 2.12 2.10 2.11 2.09 2.13 2.15 2.11 2.07 2.11
Nonessential amino acid
Gly2.48 2.66 2.64 2.63 2.64 2.67 2.74 2.65 2.59 2.66
Ser1.91 2.00 2.02 2.03 2.01 2.03 2.08 2.01 1.97 2.02
Pro2.08 2.19 2.23 2.20 2.21 2.21 2.26 2.24 2.18 2.31
Ala2.68 2.62 2.61 2.62 2.62 2.64 2.72 2.63 2.58 2.63
Asp4.49 4.37 4.37 4.37 4.38 4.41 4.48 4.39 4.28 4.37
Glu6.61 6.58 6.53 6.56 6.55 6.62 6.72 6.58 6.45 6.61
Cys0.50 0.54 0.53 0.53 0.53 0.54 0.56 0.53 0.53 0.53
Met + Cys1.53 1.48 1.57 1.66 1.76 1.85 1.65 1.68 1.76 1.88
Other parameters (after supplementation)
DL-Met0.01 0.02 0.10 0.18 0.27 0.36 0.02 0.02 0.02 0.03
Met-Met<0.01<0.01<0.01<0.01<0.01<0.010.09 0.17 0.26 0.37
Note: Methionine (Met), lysine (Lys), threonine (Thr), arginine (Arg), isoleucine (ILe), leucine (Leu), valine (Val), histidine (His), phenylalanine (Phe), glycine (Gly), serine (Ser), proline (Pro), alanine (Ala), aspartic acid (Asp), glutamic acid (Glu), serine (Cys).
Table 4. Experimental assay methods with details of manufacturers or assay kits utilized for sample analyses.
ItemsMethodsAssay Kits/Manufacturer
GSHThe intestine tissues of the M. salmoides fed with different diets were crushed and mixed with ice-cold normal saline; afterwards, centrifuging according to the instructions in the manual to obtain the supernatant was used to detect antioxidant parameters according to the manufacturer’s instructions.The intestinal antioxidant parameters were detected using the kits purchased from Nanjing Jiancheng Bioengineering Institute (Nanjing, China).
GSH-Px
SOD
CAT
MDA
Crude proteinThe nutritional components of experimental fish and feed were tested by AOAC [24].Detected by automatic Kjeldahl nitrogen analyzer (K9840) (Hanon Advanced Technology Group Co., Ltd., Jinan, China).
Crude fatExtracted according to the soxhlet extraction method.
Crude ashDetected by incineration in a muffle furnace at 550 °C for 24 h (XL-2A) (Hangzhou Zhuochi Instrument Co., Ltd., Hangzhou, China).
MoistureDetected by an oven (105 °C) (Shanghai Yiheng Scientific Instrument Co., Ltd., Shanghai, China).
Gross energyMeasured with an oxygen bomb calorimeter (C6000, IKA) (Staufen, Germany).
Amino acid The amino acid contents, except that of tryptophan, were measured by an amino acid analyzer (SYKAM S-433D, Germany SYKAM Instruments Co., Ltd., Eresing, Germany). The level of tryptophan was measured on the instrument after alkaline hydrolysis (5 mol/L NaOH, 110 °C, 20 h).
Note: glutathion (GSH), glutathione peroxidase (GSH-Px), superoxide dismutase (SOD), catalase (CAT), malondialdehyde (MDA).
Table 5. Primer sequences for qPCR.
Gene Name SequenceAccession Number/Reference
nrf2FCCACACGTGACTCTGATTTCTCGene ID: 119904119 (Transcriptome data)
RTCCTCCATGACCTTGAAGCAT
sodFCCACCAGAGGTCTCACAGCA[27]
RCCACTGAACCGAAGAAGGACT
catFCTATGGCTCTCACACCTTCMK614708.1
RTCCTCTACTGGCAGATTCT
gsh-pxFATGGCTCTCATGACTGATCCAAAMK614713.1
RGACCAACCAGGAACTTCTCAAA
keap1FGCACCTAACCGTGGAACTCAA[28]
RCCAGTTTTAGCCAGTCATTGTTCC
nf-κbFAGAAGACGACTCGGGGATGA[27]
RGCTTCTGCAGGTTCTGGTCT
tnf-αFCTTCGTCTACAGCCAGGCATCG[29]
RTTTGGCACACCGACCTCACC
il-8FGAGGGTACATGTCTGGGGGAXM_038713529.1
RCCTTGAAGGTTTGTTCTTCATCGT
il-10FCGGCACAGAAATCCCAGAGC[29]
RCAGCAGGCTCACAAAATAAACATCT
β-actinFATGCAGAAGGAGATCACAGCCTAF253319.1
RAGTATTTACGCTCAGGTGGGG
Note: nuclear factor erythroid 2-related factor 2 (nrf2), superoxide dismutase (sod), catalase (cat), glutathione peroxidase (gsh-px), kelch-like ECH-associated protein 1 (keap1), the nuclear factor κB (nf-κb), tumor necrosis factor-alpha (tnf-α), interleukin 8 (il-8), interleukin 10 (il-10), beta-actin (β-actin).
Table 6. Effects of different levels of Met-Met and DL-Met supplementation on the growth and feed utilization in juvenile M. salmoides.
ItemDiets 1
40% FM25% FM0.10% DL-Met0.20% DL-Met0.30% DL-Met0.40% DL-Met0.10% Met-Met0.20% Met-Met0.30% Met-Met0.40% Met-Met
IW 2, g16.38 ± 0.0316.38 ± 0.0316.39 ± 0.0416.39 ± 0.0316.38 ± 0.0316.41 ± 0.0316.39 ± 0.0216.41 ± 0.0316.40 ± 0.0216.39 ± 0.02
FW 3, g60.16 ± 0.73 b52.34 ± 0.79 a55.84 ± 1.12 ab55.94 ± 1.08 ab56.57 ± 1.73 ab58.63 ± 1.80 b58.96 ± 1.26 b58.15 ± 1.00 ab58.08 ± 1.48 ab54.8 ± 1.10 ab
WGR 4, %267.24 ± 4.46 b219.51 ± 4.60 a240.79 ± 6.99 ab241.39 ± 6.51 ab245.24 ± 10.13 ab257.40 ± 11.33 b259.675 ± 8.06 b254.42 ± 5.84 ab254.20 ± 9.20 ab234.40 ± 6.83 ab
SGR 5, %/d1.86 ± 0.02 b1.66 ± 0.02 a1.75 ± 0.03 ab1.75 ± 0.03 ab1.77 ± 0.04 ab1.82 ± 0.05b1.83 ± 0.03 b1.81 ± 0.02 ab1.81 ± 0.04 ab1.72 ± 0.03 ab
FCR 60.79 ± 0.01 a0.96 ± 0.02 b0.88 ± 0.02 ab0.87 ± 0.02 ab0.91 ± 0.03 ab0.85 ± 0.03 ab0.81 ± 0.03 a0.84 ± 0.03 ab0.87 ± 0.02 ab0.89 ± 0.03 ab
FI 7, g/fish/d0.32 ± 0.010.36 ± 0.010.34 ± 0.010.34 ± 0.010.35 ± 0.010.34 ± 0.010.33 ± 0.010.34 ± 0.010.34 ± 0.010.34 ± 0.01
SR 8, %10099.00 ± 1.0010010098.00 ± 2.0099.00 ± 1.0010010098.00 ± 1.15100
1 The 40% FM group (HF) and 25% FM group (LF). Data are presented as mean ± standard error, with different letters indicating differences within the groups (p < 0.05). 2 Initial average body weight. 3 Final average body weight. 4 Weight gain rate (WGR) (%) = 100 × (final body average weight (g) − initial body average weight (g))/initial weight (g). 5 Specific growth rate (SGR) (%/d) = 100 × ((ln (final body average weight (g)) − ln (initial body average weight (g)))/days). 6 Feed conversion ratio (FCR) = dry feed fed (g)/wet weight gain (g). 7 Feed intake (FI) (g fish−1 d−1) = dry feed fed (g)/((final body weight) (g) + initial body weight (g))/2 × days. 8 Survival rate (SR) (%) = 100 × (final number of fish/initial number of fish).
Table 7. Effects of Met-Met and DL-Met supplementation on whole body composition in juvenile M. salmoides.
ItemDiets
40% FM25% FM0.10% DL-Met0.20% DL-Met0.30% DL-Met0.40% DL-Met0.10% Met-Met0.20% Met-Met0.30% Met-Met0.40% Met-Met
Moisture, %73.65 ± 0.1073.62 ± 0.0473.70 ± 0.3773.64 ± 0.1373.37 ± 0.3573.74 ± 0.1073.70 ± 0.1974.56 ± 0.6773.38 ± 0.4973.61 ± 0.10
Lipid, %5.66 ± 0.155.55 ± 0.115.24 ± 0.205.40 ± 0.085.40 ± 0.235.49 ± 0.095.57 ± 0.085.21 ± 0.235.34 ± 0.195.48 ± 0.14
Ash, %3.94 ± 0.063.86 ± 0.104.20 ± 0.084.25 ± 0.124.21 ± 0.184.25 ± 0.043.89 ± 0.214.13 ± 0.024.11 ± 0.104.21 ± 0.03
Protein, %17.31 ± 0.0217.26 ± 0.1217.24 ± 0.0117.18 ± 0.0917.04 ± 0.1317.05 ± 0.1017.06 ± 0.0417.26 ± 0.0217.16 ± 0.0216.95 ± 0.18
Note: 40% FM group (HF) and 25% FM group (LF). Data are presented as mean ± standard error.
Table 8. Effects of Met-Met and DL-Met supplementation on amino acid composition of whole fish in juvenile M. salmoides.
ItemDiets
40% FM25% FM0.10% DL-Met0.20% DL-Met0.30% DL-Met0.40% DL-Met0.10% Met-Met0.20% Met-Met0.30% Met-Met0.40% Met-Met
Essential amino acid
Met1.97 ± 0.262.02 ± 0.232.10 ± 0.222.11 ± 0.212.02 ± 0.222.07 ± 0.212.06 ± 0.212.86 ± 0.021.86 ± 0.031.86 ± 0.00
Lys5.76 ± 0.875.92 ± 0.766.05 ± 0.756.10 ± 0.715.87 ± 0.756.05 ± 0.756.00 ± 0.715.36 ± 0.035.28 ± 0.115.29 ± 0.02
Thr3.11 ± 0.323.19 ± 0.233.29 ± 0.243.34 ± 0.273.23 ± 0.273.29 ± 0.223.27 ± 0.223.05 ± 0.023.01 ± 0.053.05 ± 0.01
Trp0.69 ± 0.010.63 ± 0.020.67 ± 0.010.67 ± 0.020.65 ± 0.020.66 ± 0.010.65 ± 0.020.68 ± 0.000.64 ± 0.020.68 ± 0.00
Arg4.31 ± 0.364.48 ± 0.234.53 ± 0.264.56 ± 0.244.44 ± 0.234.53 ± 0.244.52 ± 0.234.32 ± 0.024.30 ± 0.054.38 ± 0.02
ILe3.03 ± 0.393.19 ± 0.383.33 ± 0.363.36 ± 0.353.26 ± 0.373.35 ± 0.363.33 ± 0.352.99 ± 0.022.96 ± 0.082.96 ± 0.02
Leu5.24 ± 0.705.41 ± 0.595.54 ± 0.605.60 ± 0.575.44 ± 0.615.59 ± 0.575.56 ± 0.575.02 ± 0.024.92 ± 0.104.95 ± 0.03
Val3.39 ± 0.363.59 ± 0.323.72 ± 0.313.77 ± 0.313.66 ± 0.313.76 ± 0.283.75 ± 0.293.47 ± 0.013.40 ± 0.083.44 ± 0.01
His1.64 ± 0.181.72 ± 0.151.74 ± 0.131.79 ± 0.121.71 ± 0.141.76 ± 0.151.73 ± 0.131.59 ± 0.011.60 ± 0.031.60 ± 0.01
Phe3.24 ± 0.333.35 ± 0.263.43 ± 0.283.48 ± 0.263.31 ± 0.263.36 ± 0.263.40 ± 0.273.28 ± 0.043.21 ± 0.063.22 ± 0.04
Nonessential amino acid
Gly5.36 ± 0.275.77 ± 0.405.86 ± 0.385.68 ± 0.365.78 ± 0.395.76 ± 0.405.68 ± 0.446.02 ± 0.046.02 ± 0.036.32 ± 0.10
Ser2.87 ± 0.262.93 ± 0.162.95 ± 0.172.97 ± 0.182.92 ± 0.192.97 ± 0.162.93 ± 0.172.80 ± 0.022.75 ± 0.052.81 ± 0.03
Pro3.50 ± 0.163.79 ± 0.193.82 ± 0.193.74 ± 0.203.76 ± 0.193.83 ± 0.223.74 ± 0.213.90 ± 0.023.81 ± 0.034.03 ± 0.03
Ala4.75 ± 0.314.94 ± 0.145.04 ± 0.155.03 ± 0.154.95 ± 0.145.06 ± 0.155.00 ± 0.154.85 ± 0.014.79 ± 0.054.93 ± 0.03
Asp9.92 ± 1.1210.31 ± 0.8910.53 ± 0.9010.58 ± 0.8610.32 ± 0.8810.51 ± 0.8510.51 ± 0.849.72 ± 0.069.54 ± 0.169.63 ± 0.07
Glu9.92 ± 1.1210.31 ± 0.8910.53 ± 0.9010.58 ± 0.8610.32 ± 0.8810.51 ± 0.8510.51 ± 0.849.72 ± 0.069.54 ± 0.169.63 ± 0.07
Cys0.64 ± 0.070.67 ± 0.070.67 ± 0.050.67 ± 0.060.62 ± 0.050.60 ± 0.060.60 ± 0.060.56 ± 0.010.56 ± 0.010.57 ± 0.00
Met+ Cys2.61 ± 0.332.69 ± 0.292.77 ± 0.282.78 ± 0.272.65 ± 0.262.67 ± 0.272.66 ± 0.262.42 ± 0.032.42 ± 0.032.43 ± 0.01
Note: Data are presented as mean ± standard error. Methionine (Met), lysine (Lys), threonine (Thr), tryptophan (Trp), arginine (Arg), isoleucine (ILe), leucine (Leu), valine (Val), histidine (His), phenylalanine (Phe), glycine (Gly), serine (Ser), proline (Pro), alanine (Ala), aspartic acid (Asp), glutamic acid (Glu), serine (Cys).
Disclaimer/Publisher’s Note: The statements, opinions and data contained in all publications are solely those of the individual author(s) and contributor(s) and not of MDPI and/or the editor(s). MDPI and/or the editor(s) disclaim responsibility for any injury to people or property resulting from any ideas, methods, instructions or products referred to in the content.

