
Single-Cell Profiling Reveals Immune-Based Mechanisms Underlying Tumor Radiosensitization by a Novel Mn Porphyrin Clinical Candidate, MnTnBuOE-2-PyP5+ (BMX-001)

 , ,
, ,  , and
, and 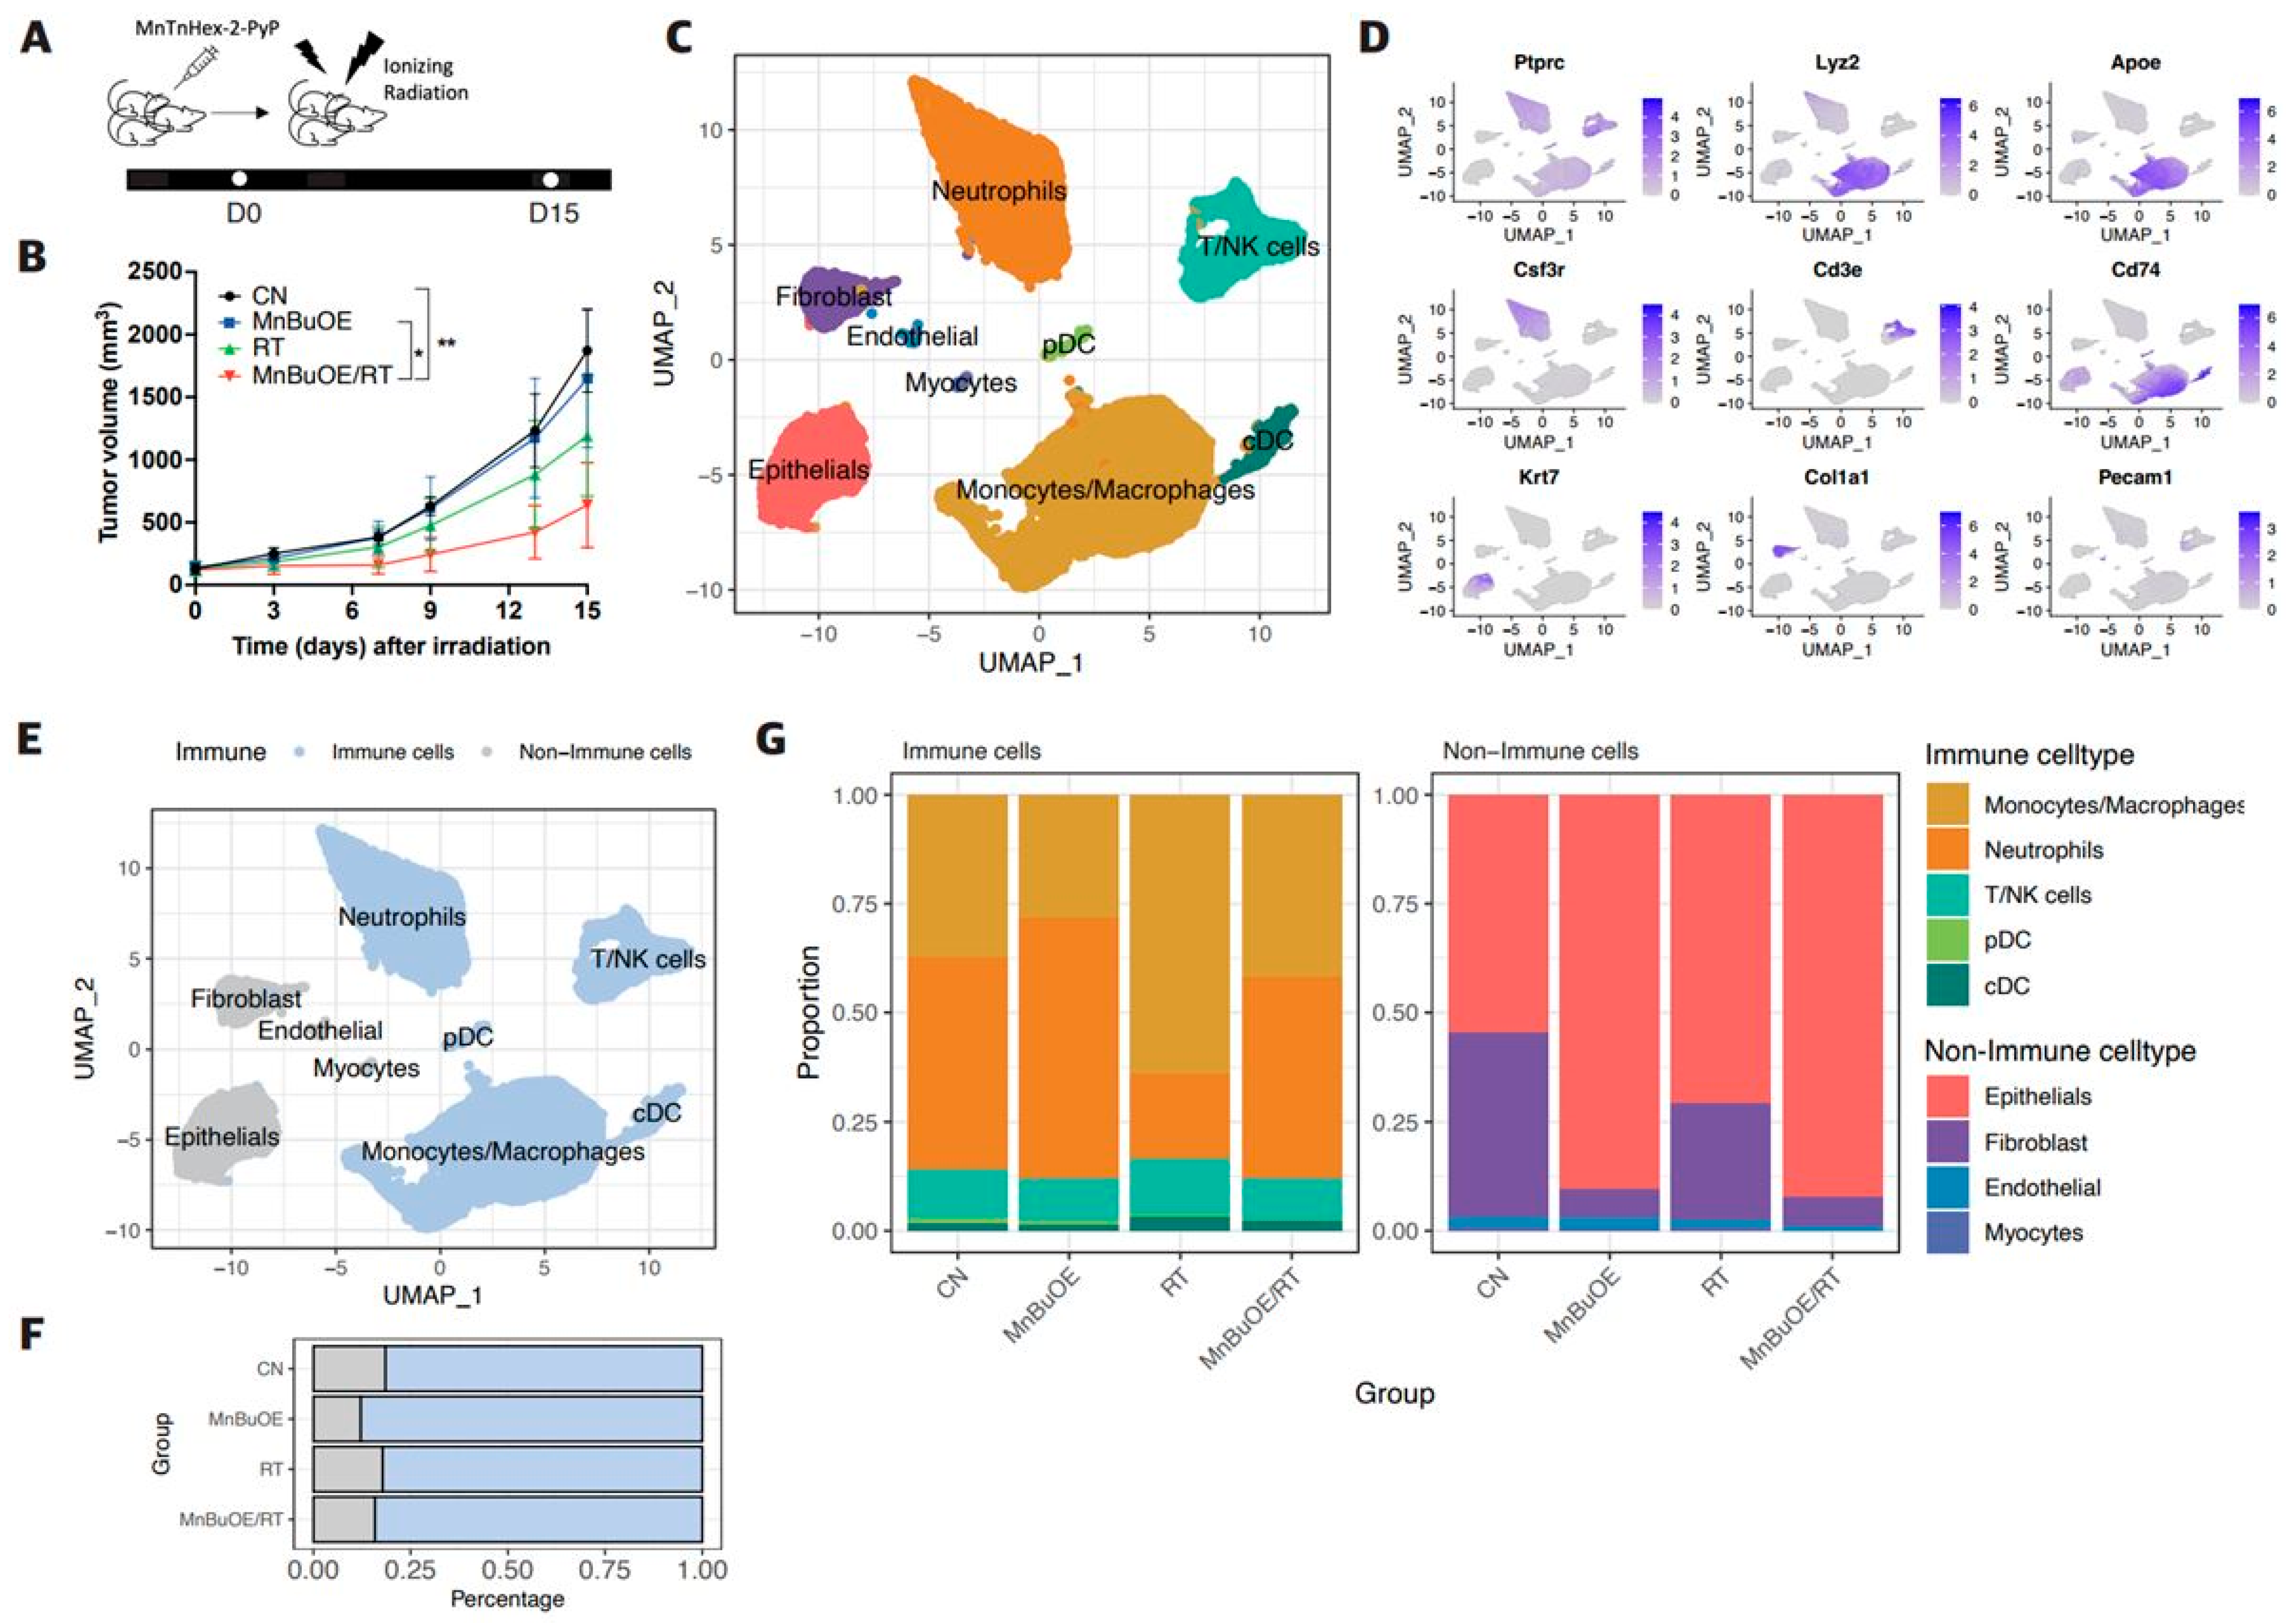
Abstract
:1. Introduction
2. Materials and Methods
2.1. Animal Models
2.2. Tissue Dissociation into Single-Cell Suspension
2.3. Single-Cell RNA Sequencing Data Processing
2.4. Cluster Identification and Annotation
2.5. Identifying Cancer Cells in Epithelial Cell Types
2.6. Pathway Enrichment Analysis
2.7. Trajectory Analysis
2.8. Cell–Cell Communication and Receptor–Ligand Interaction Analysis
2.9. Data and Code Availability
2.10. TUNEL Staining
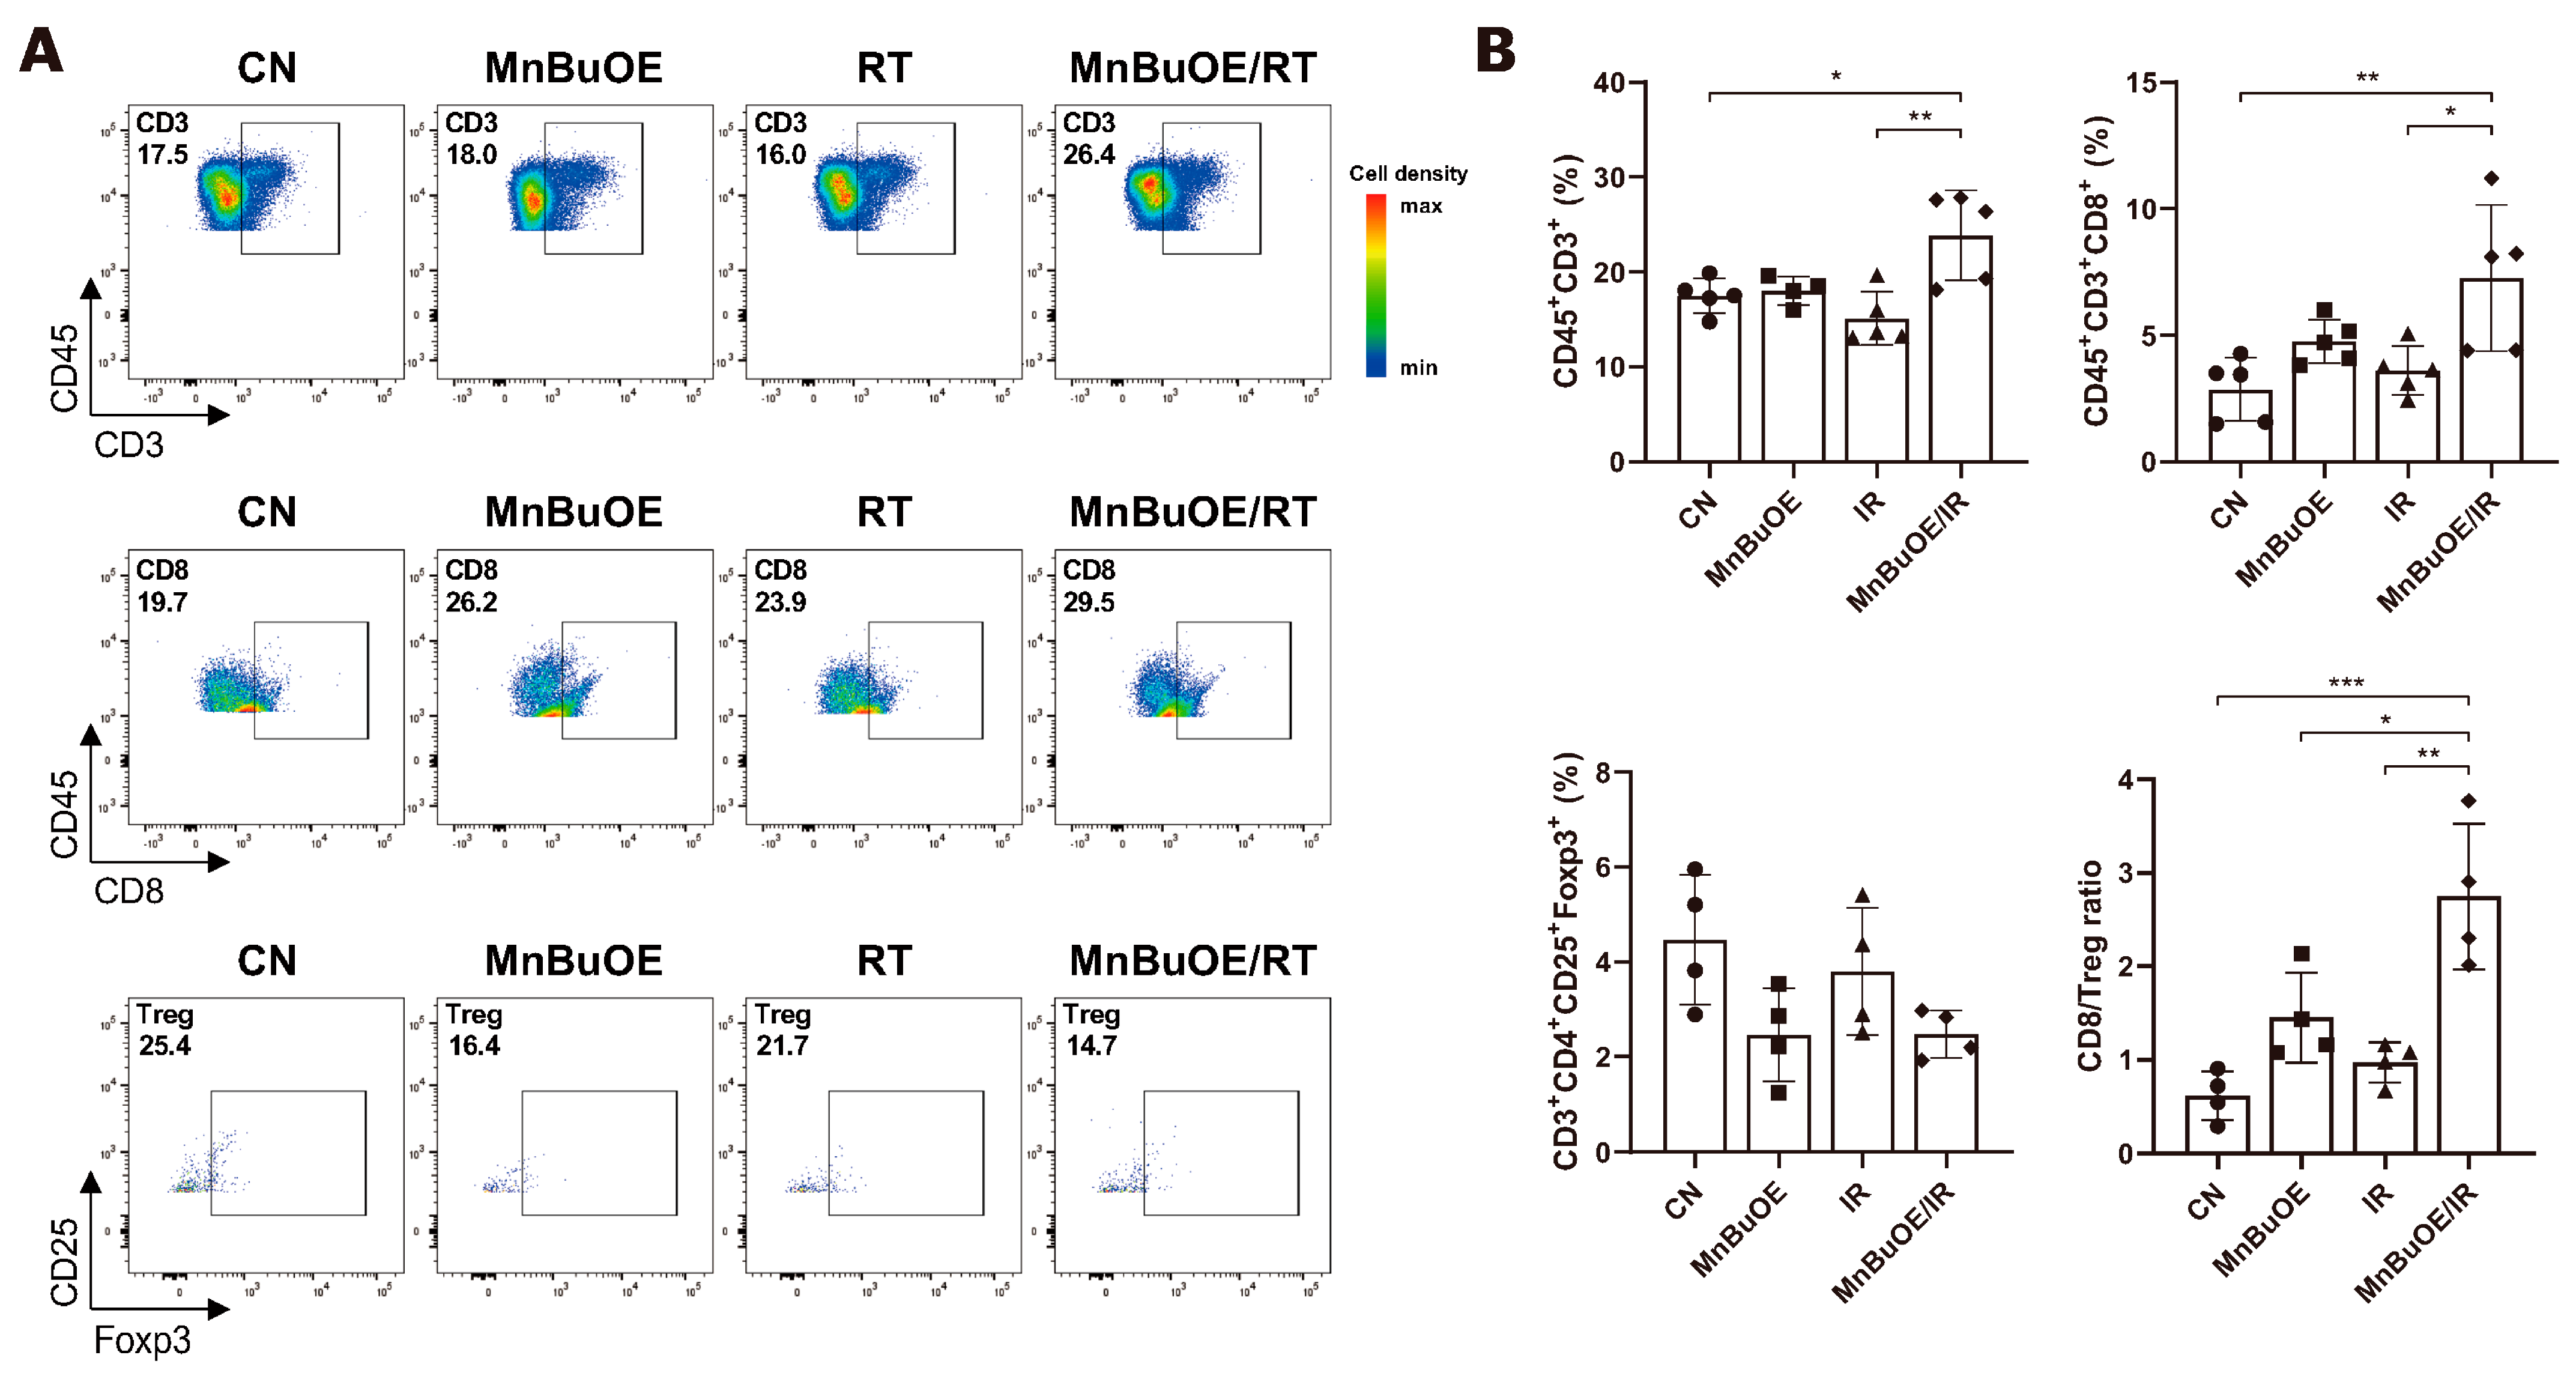
2.11. Flow Cytometric Analysis
2.12. Statistical Analysis
3. Results
3.1. Effect of MnBuOE Coupled with Irradiation and Major Single-Cell Mapping in the 4T1 Tumor Mouse Model
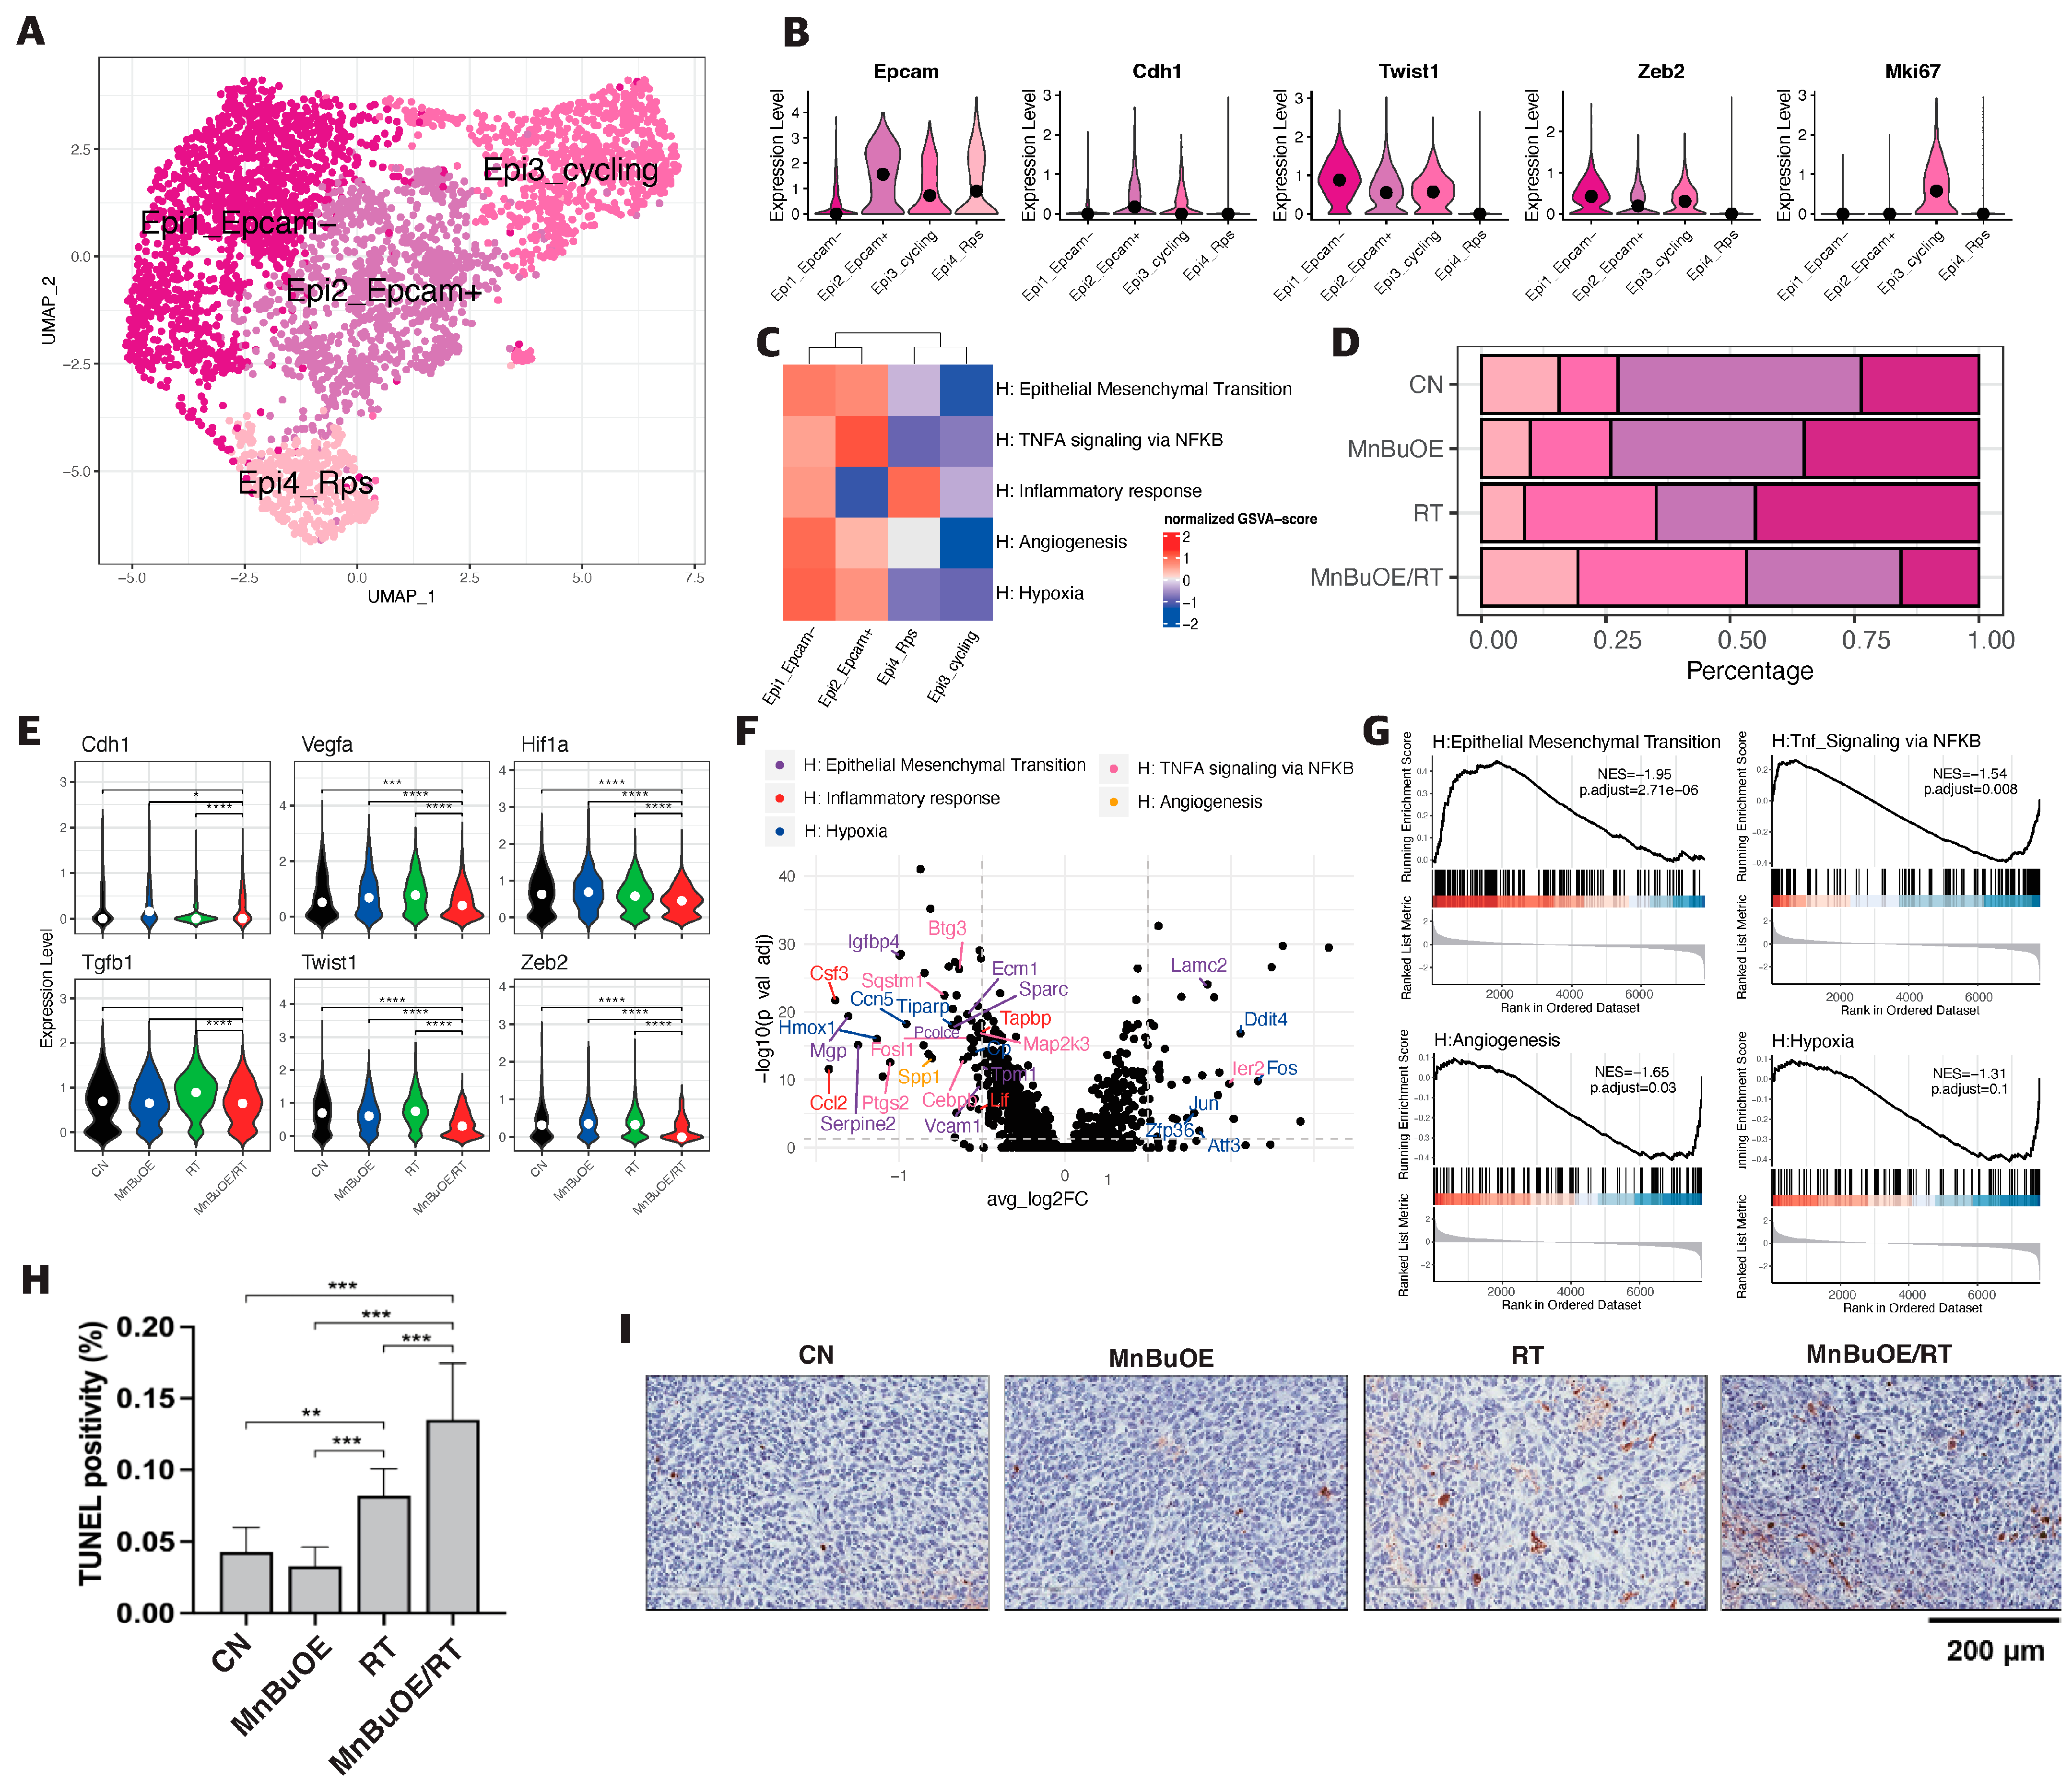
3.2. Epithelial Cell Clustering and Subtype Analysis of the 4T1 Tumor Treated with MnBuOE Coupled with Irradiation
3.3. Fibroblasts Clustering and Subtype Analysis of the 4T1 Tumor Treated with MnBuOE Coupled with Irradiation
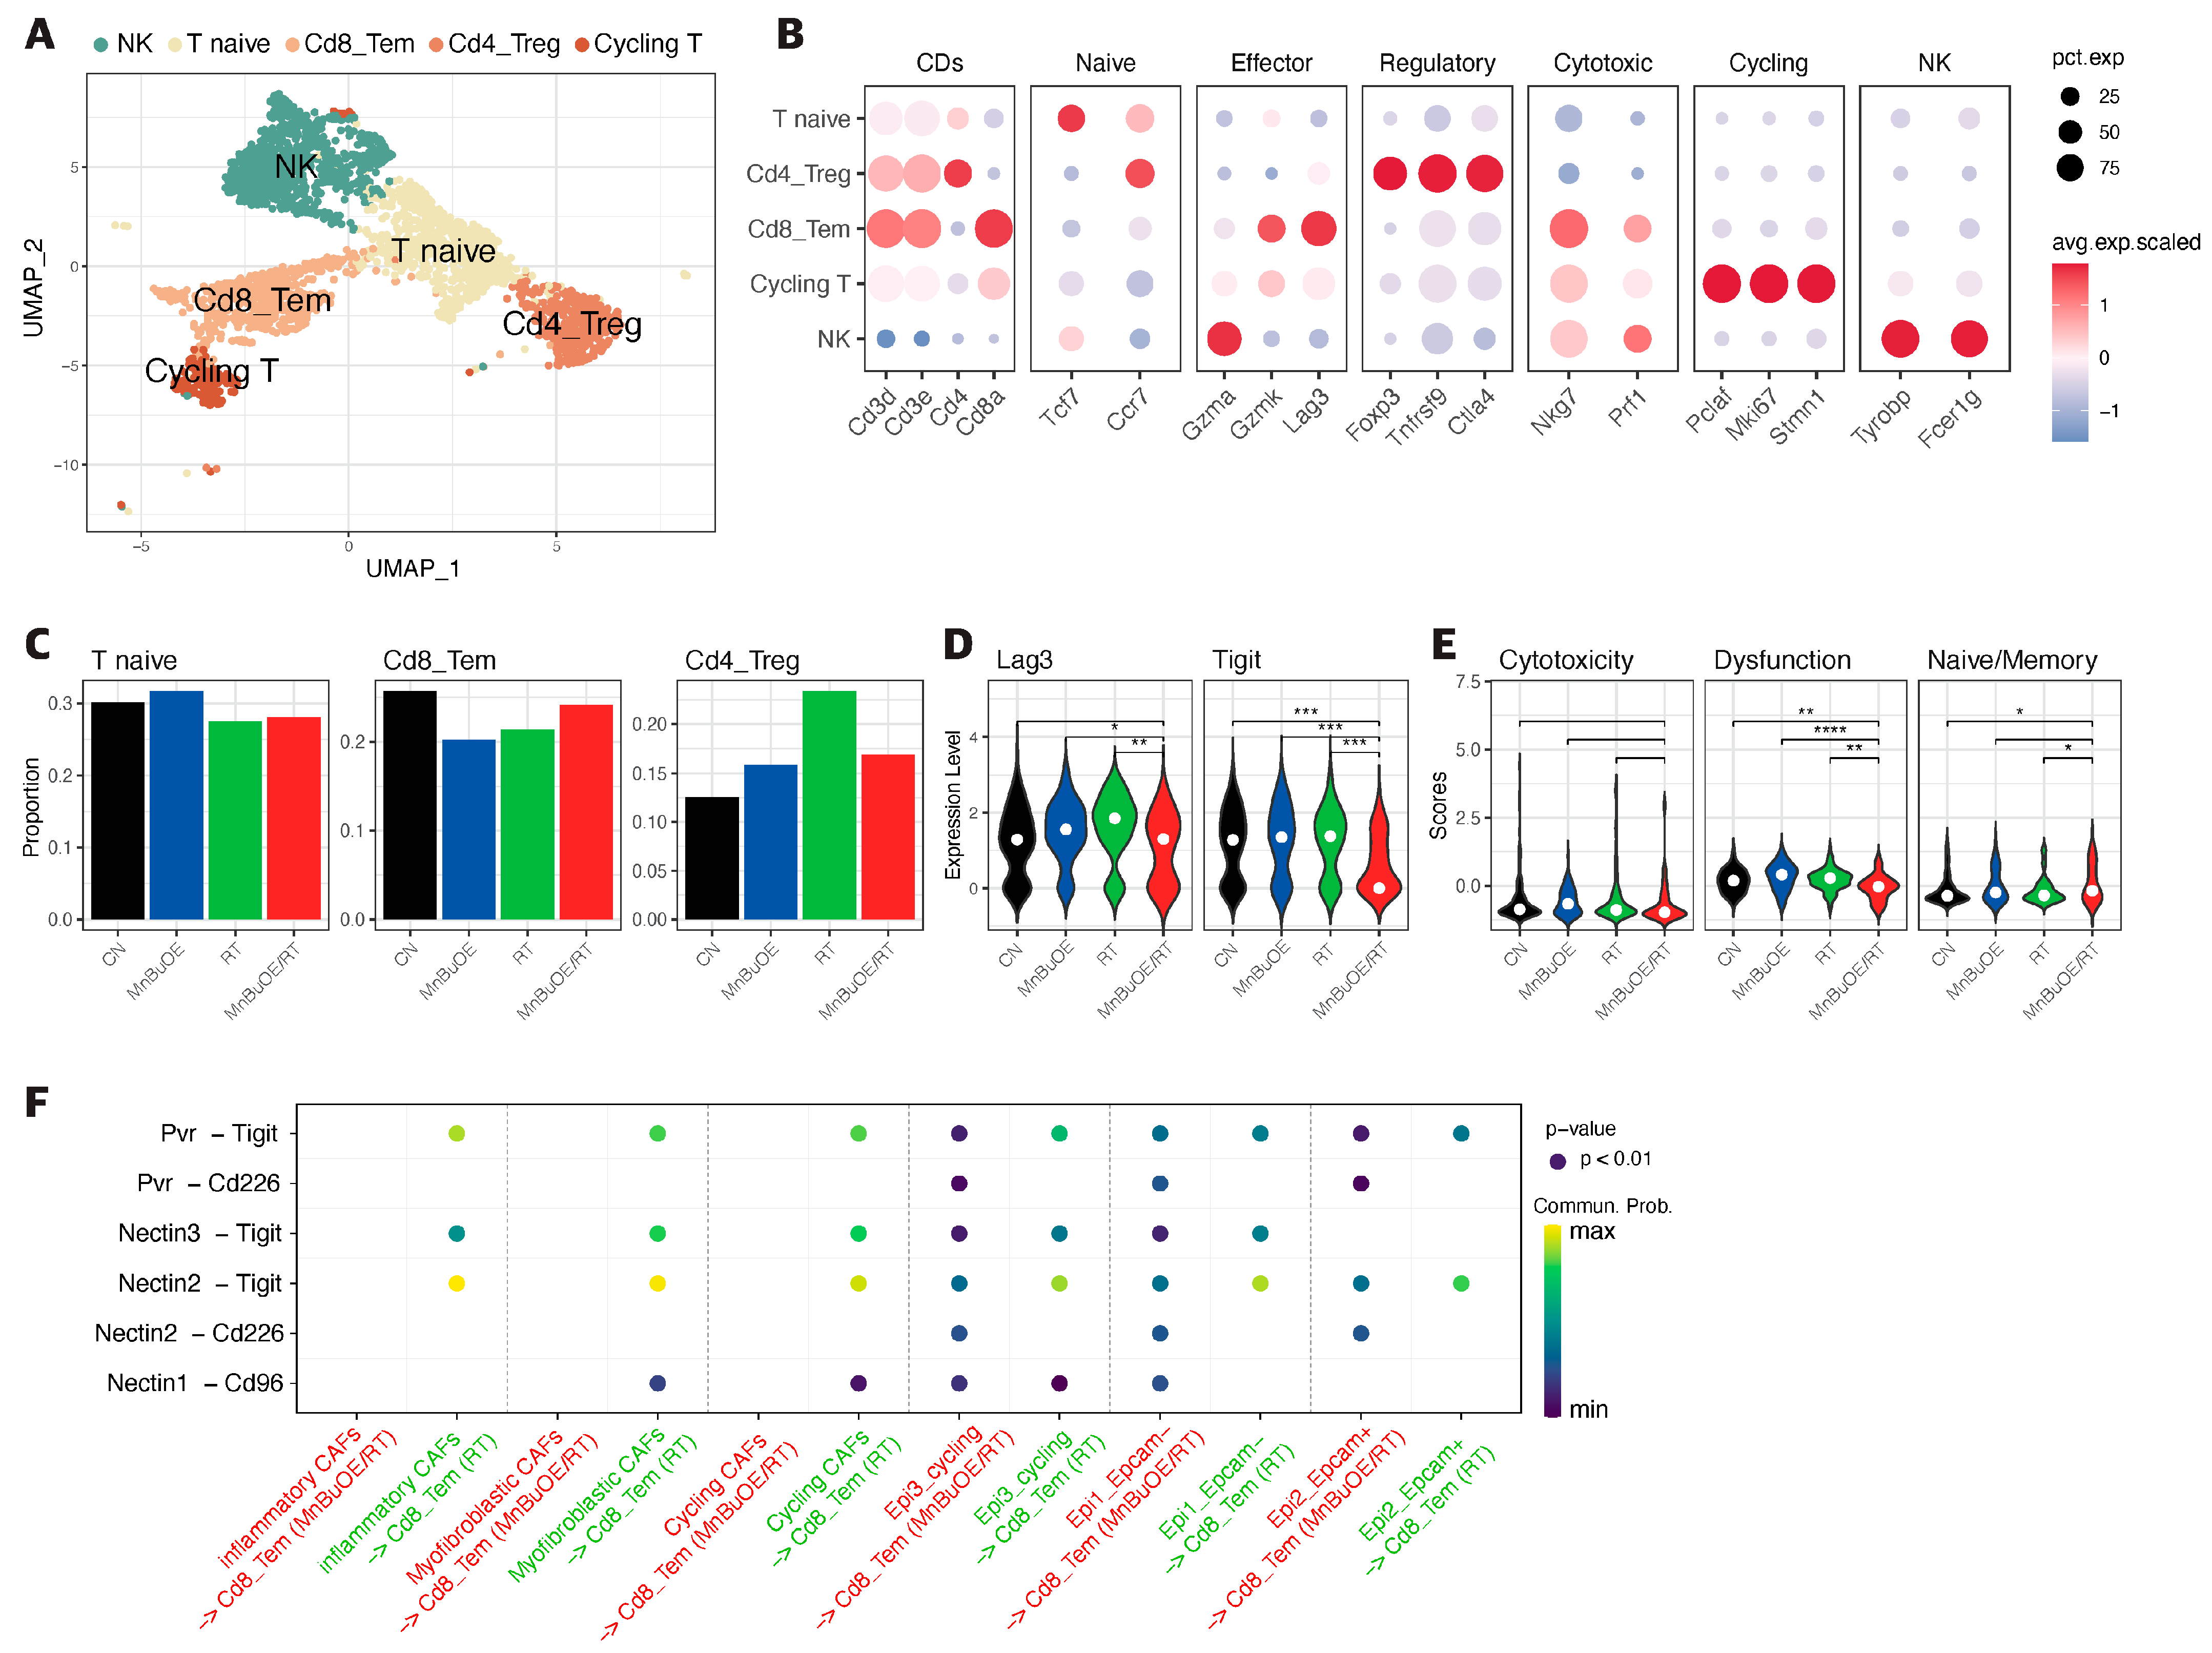
3.4. T Cells Clustering and Subtype Analysis of the 4T1 Tumor Treated with MnBuOE Coupled with Irradiation
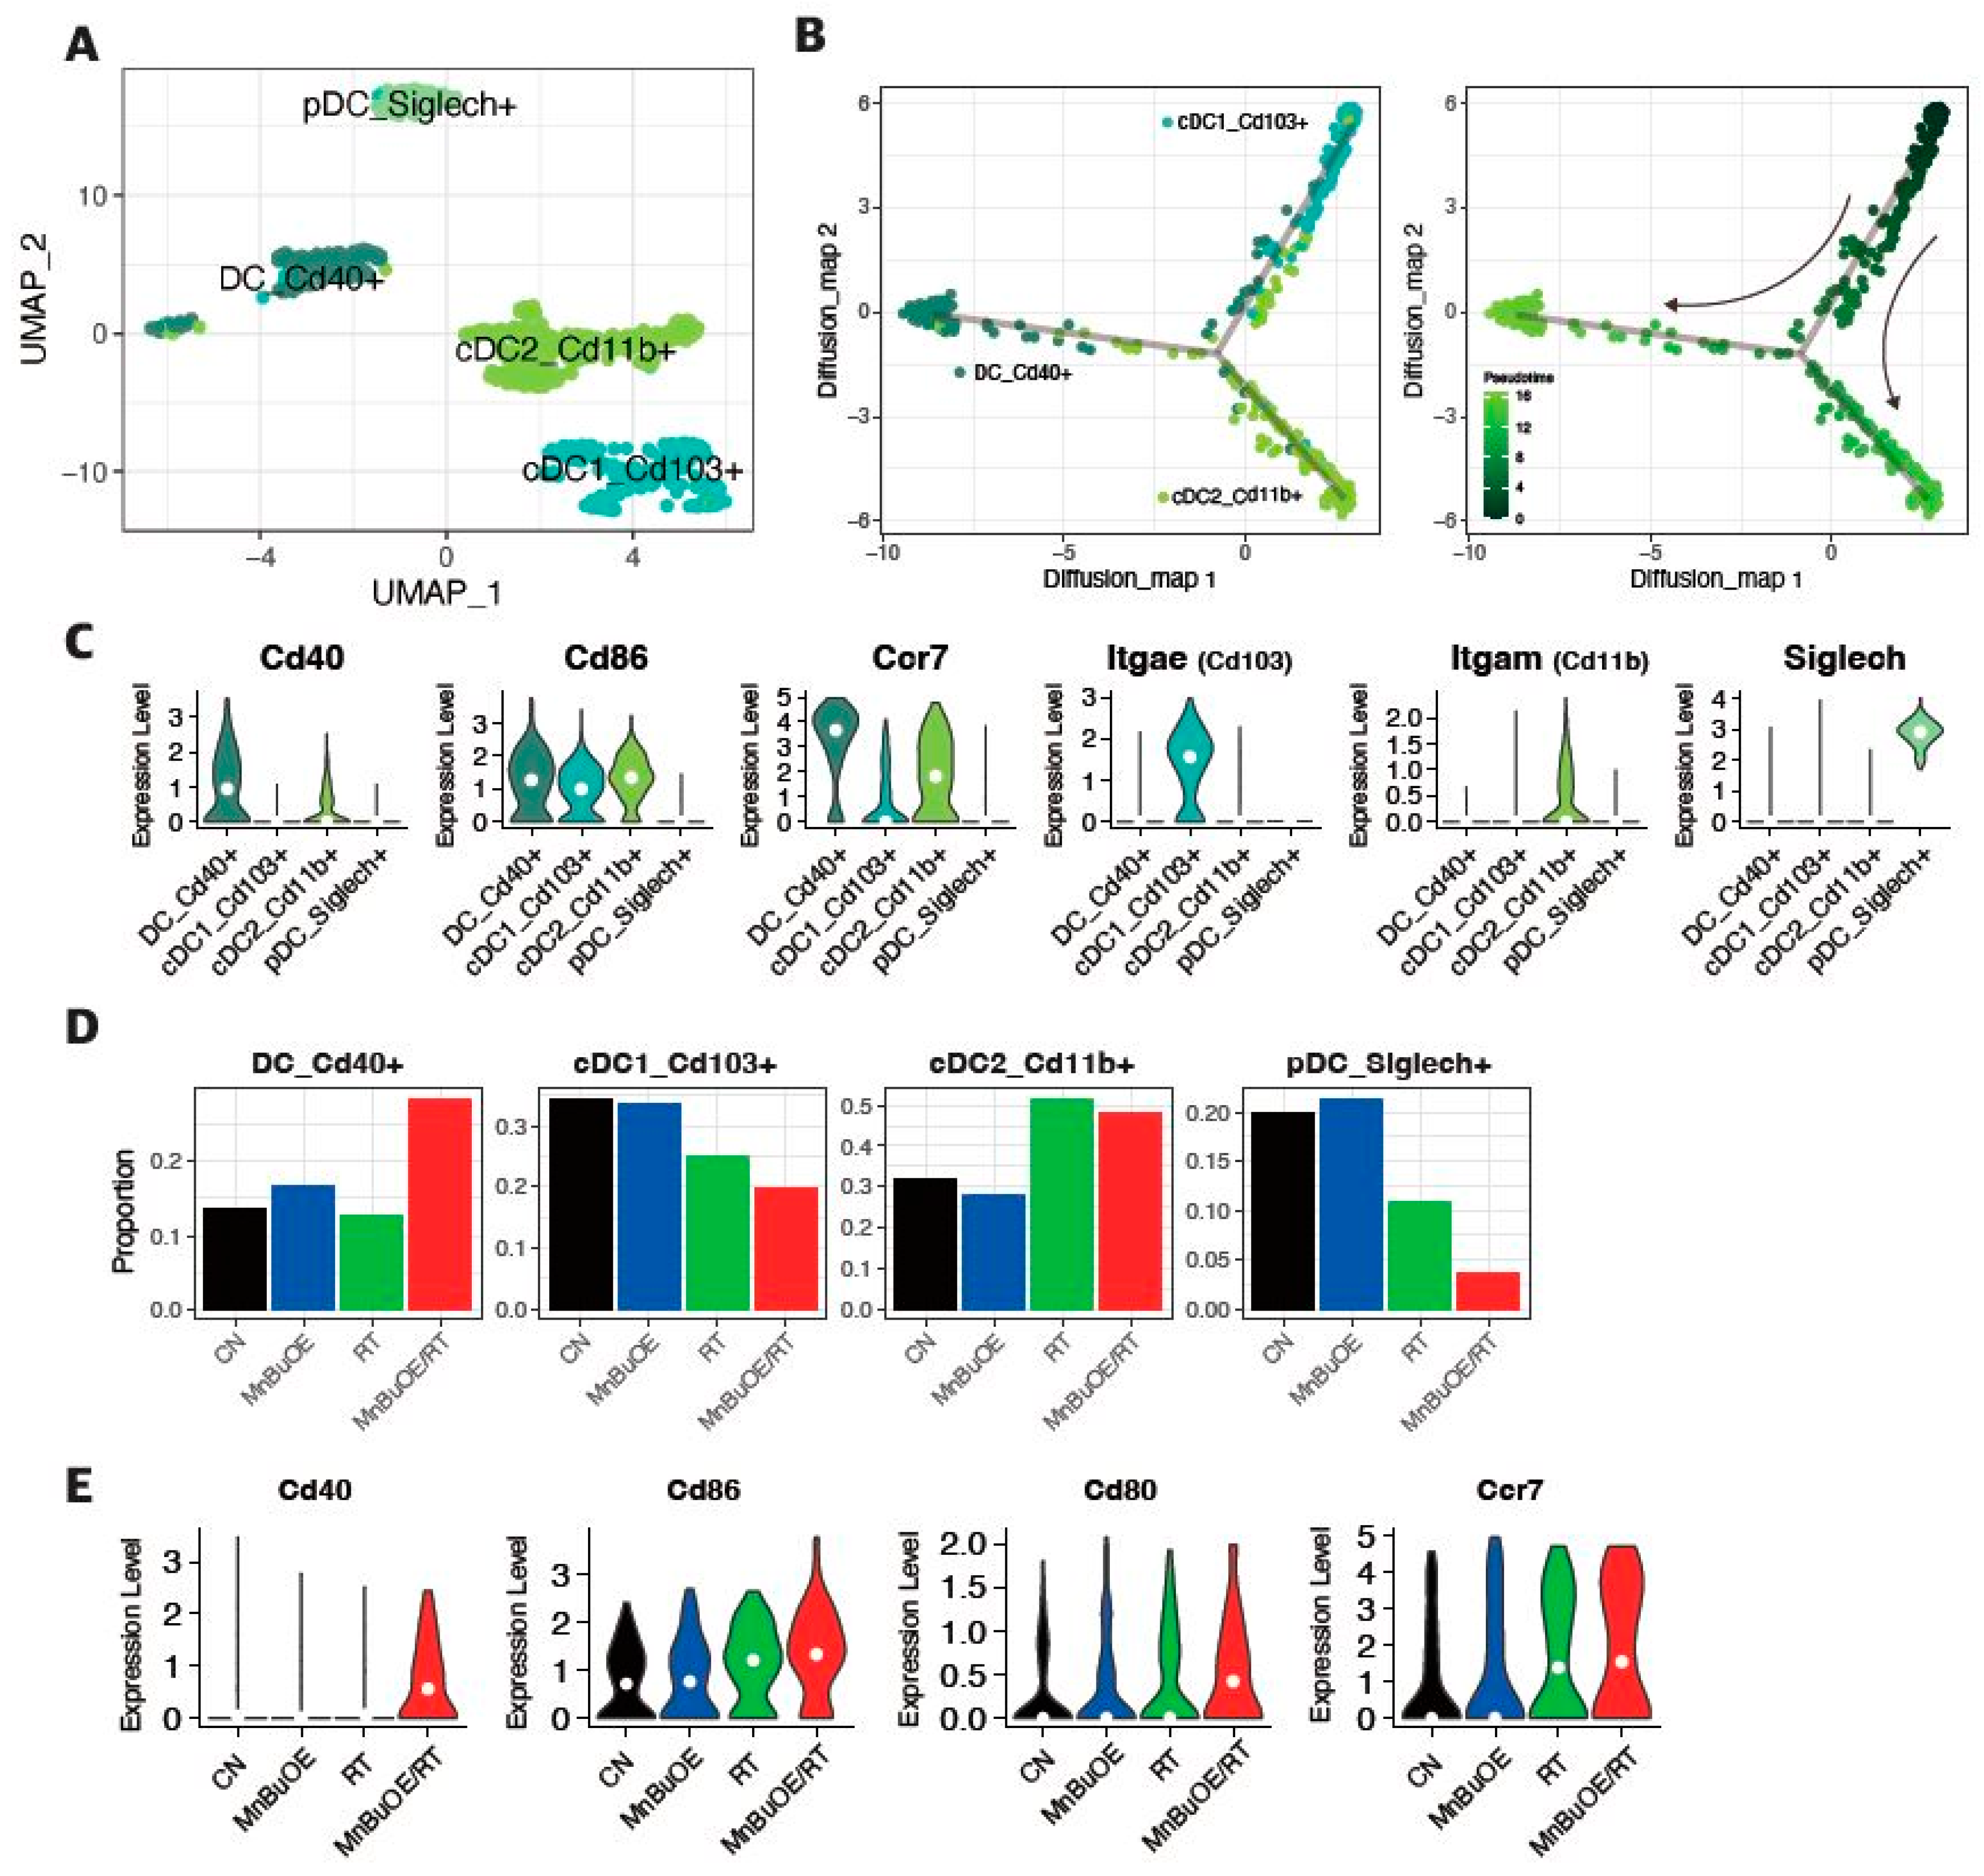
3.5. DC Clustering and Pseudotime Trajectory Analysis of the 4T1 Tumor Treated with MnBuOE Coupled with Irradiation
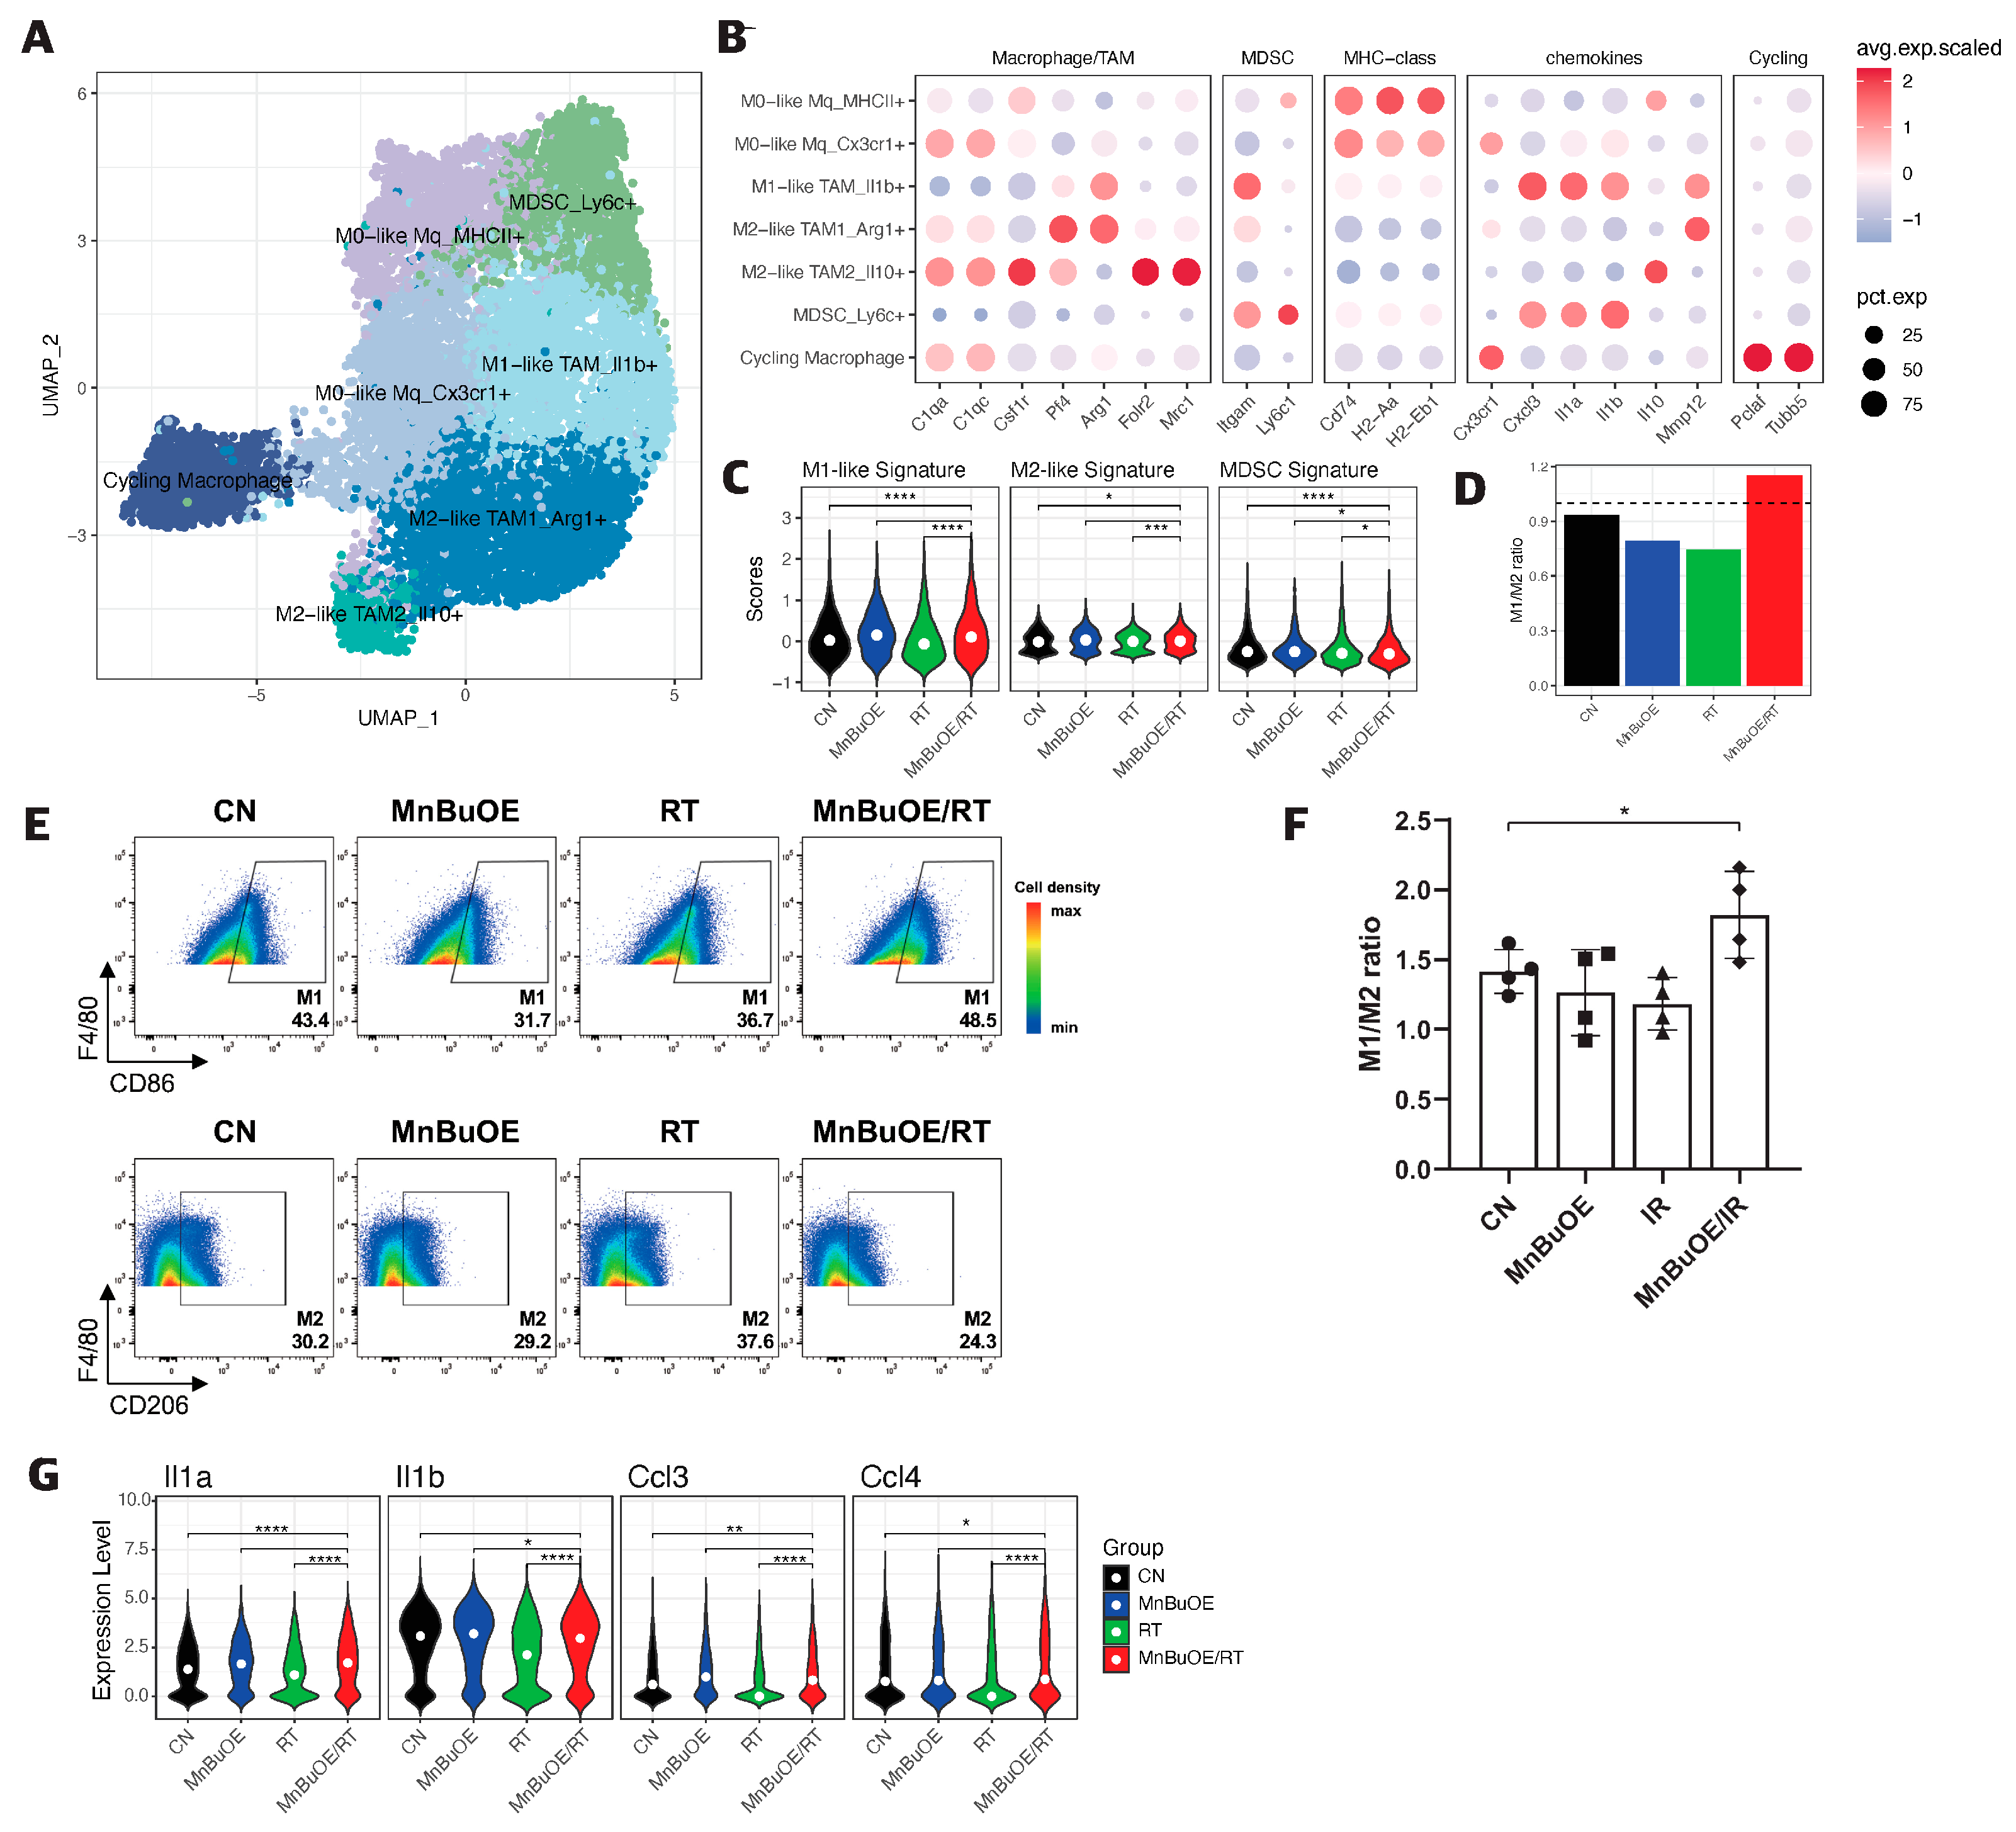
3.6. Macrophage Clustering and Phenotype Analysis of the 4T1 Tumor Treated with MnBuOE Coupled with Irradiation
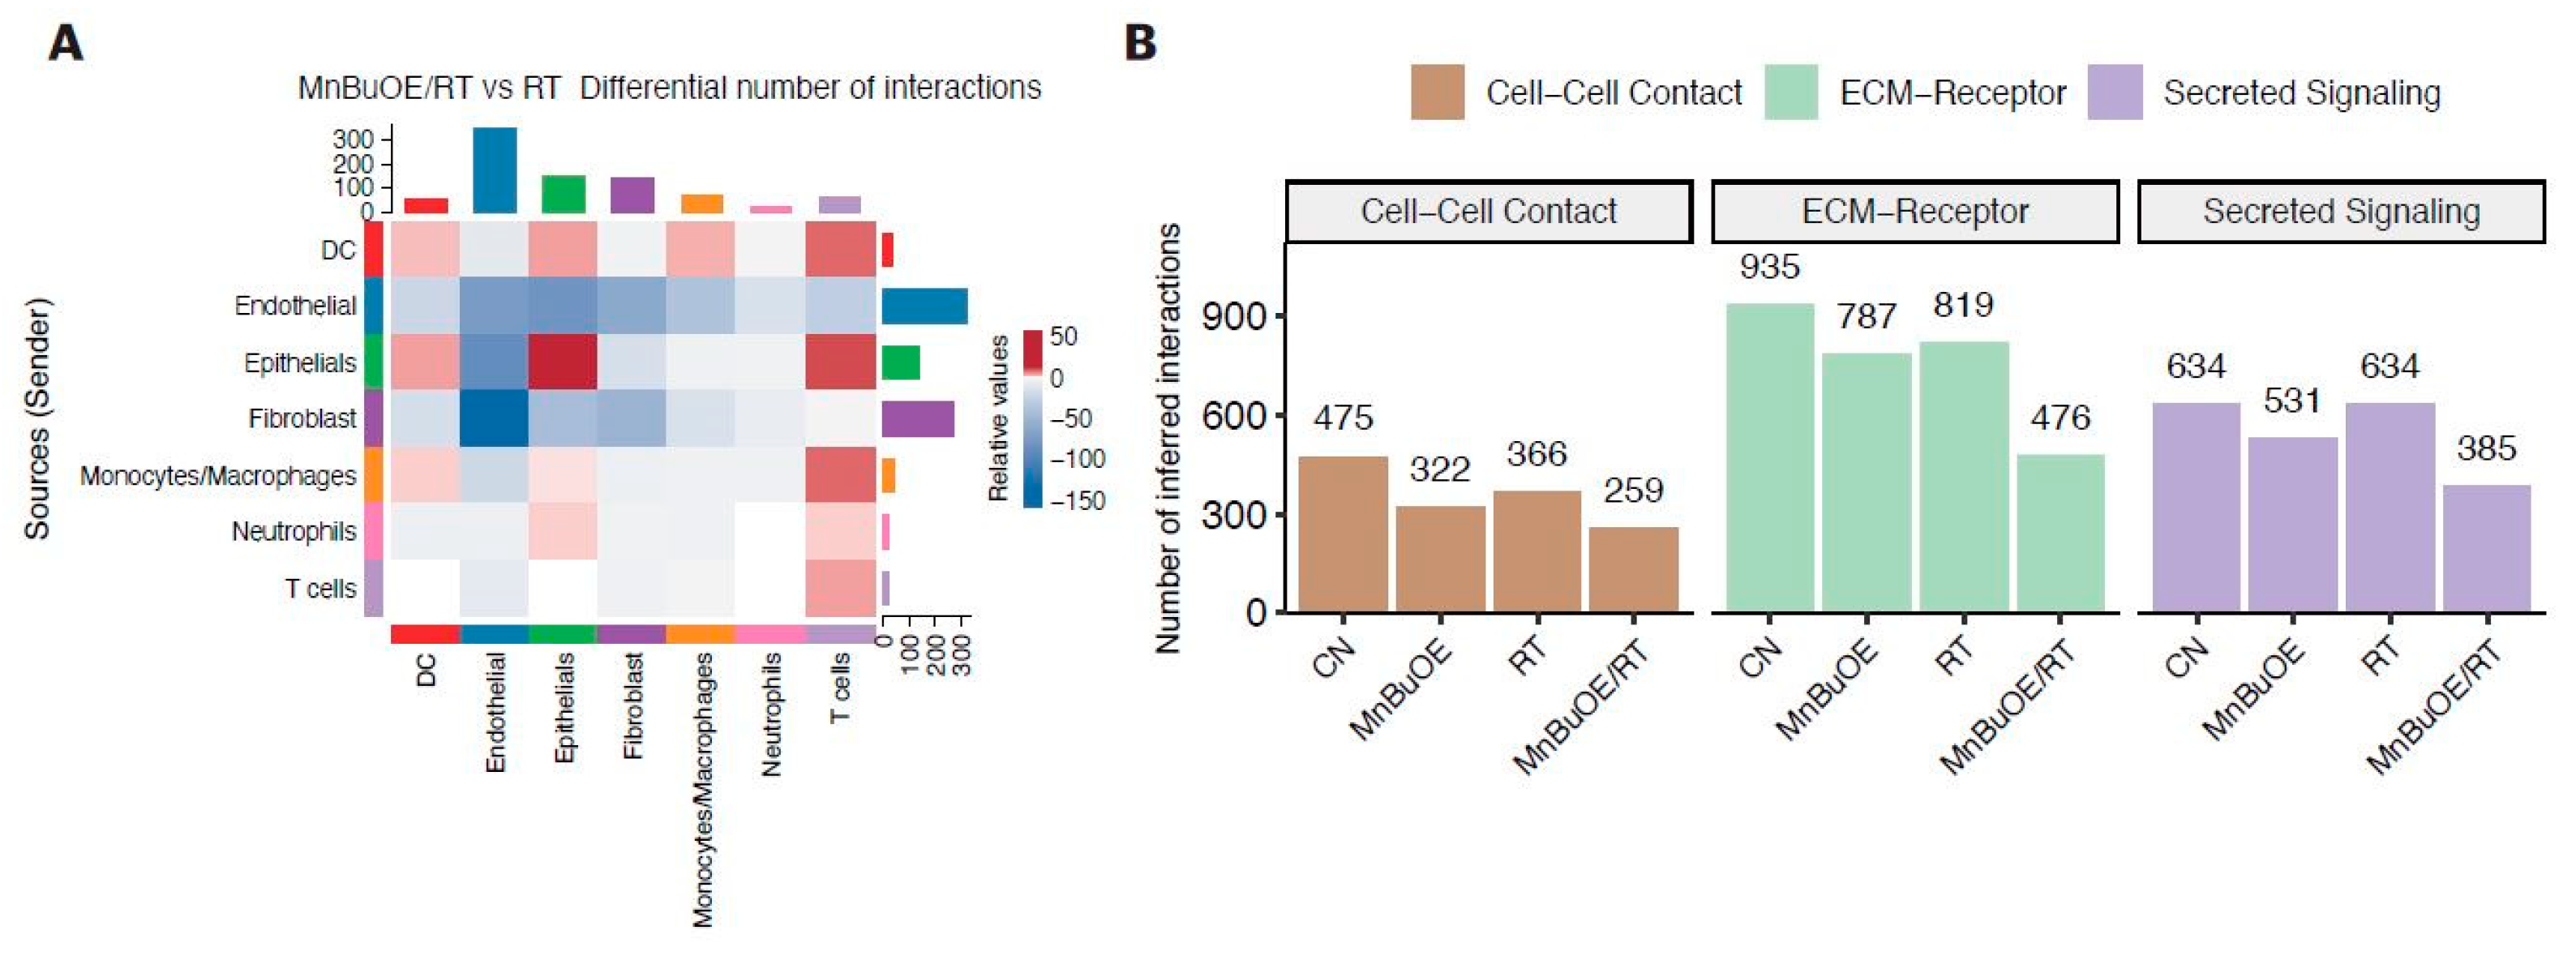
3.7. Intercellular Communications within the TME Regulated by MnBuOE Coupled with Irradiation in the 4T1 Tumor Mice Model
4. Discussion
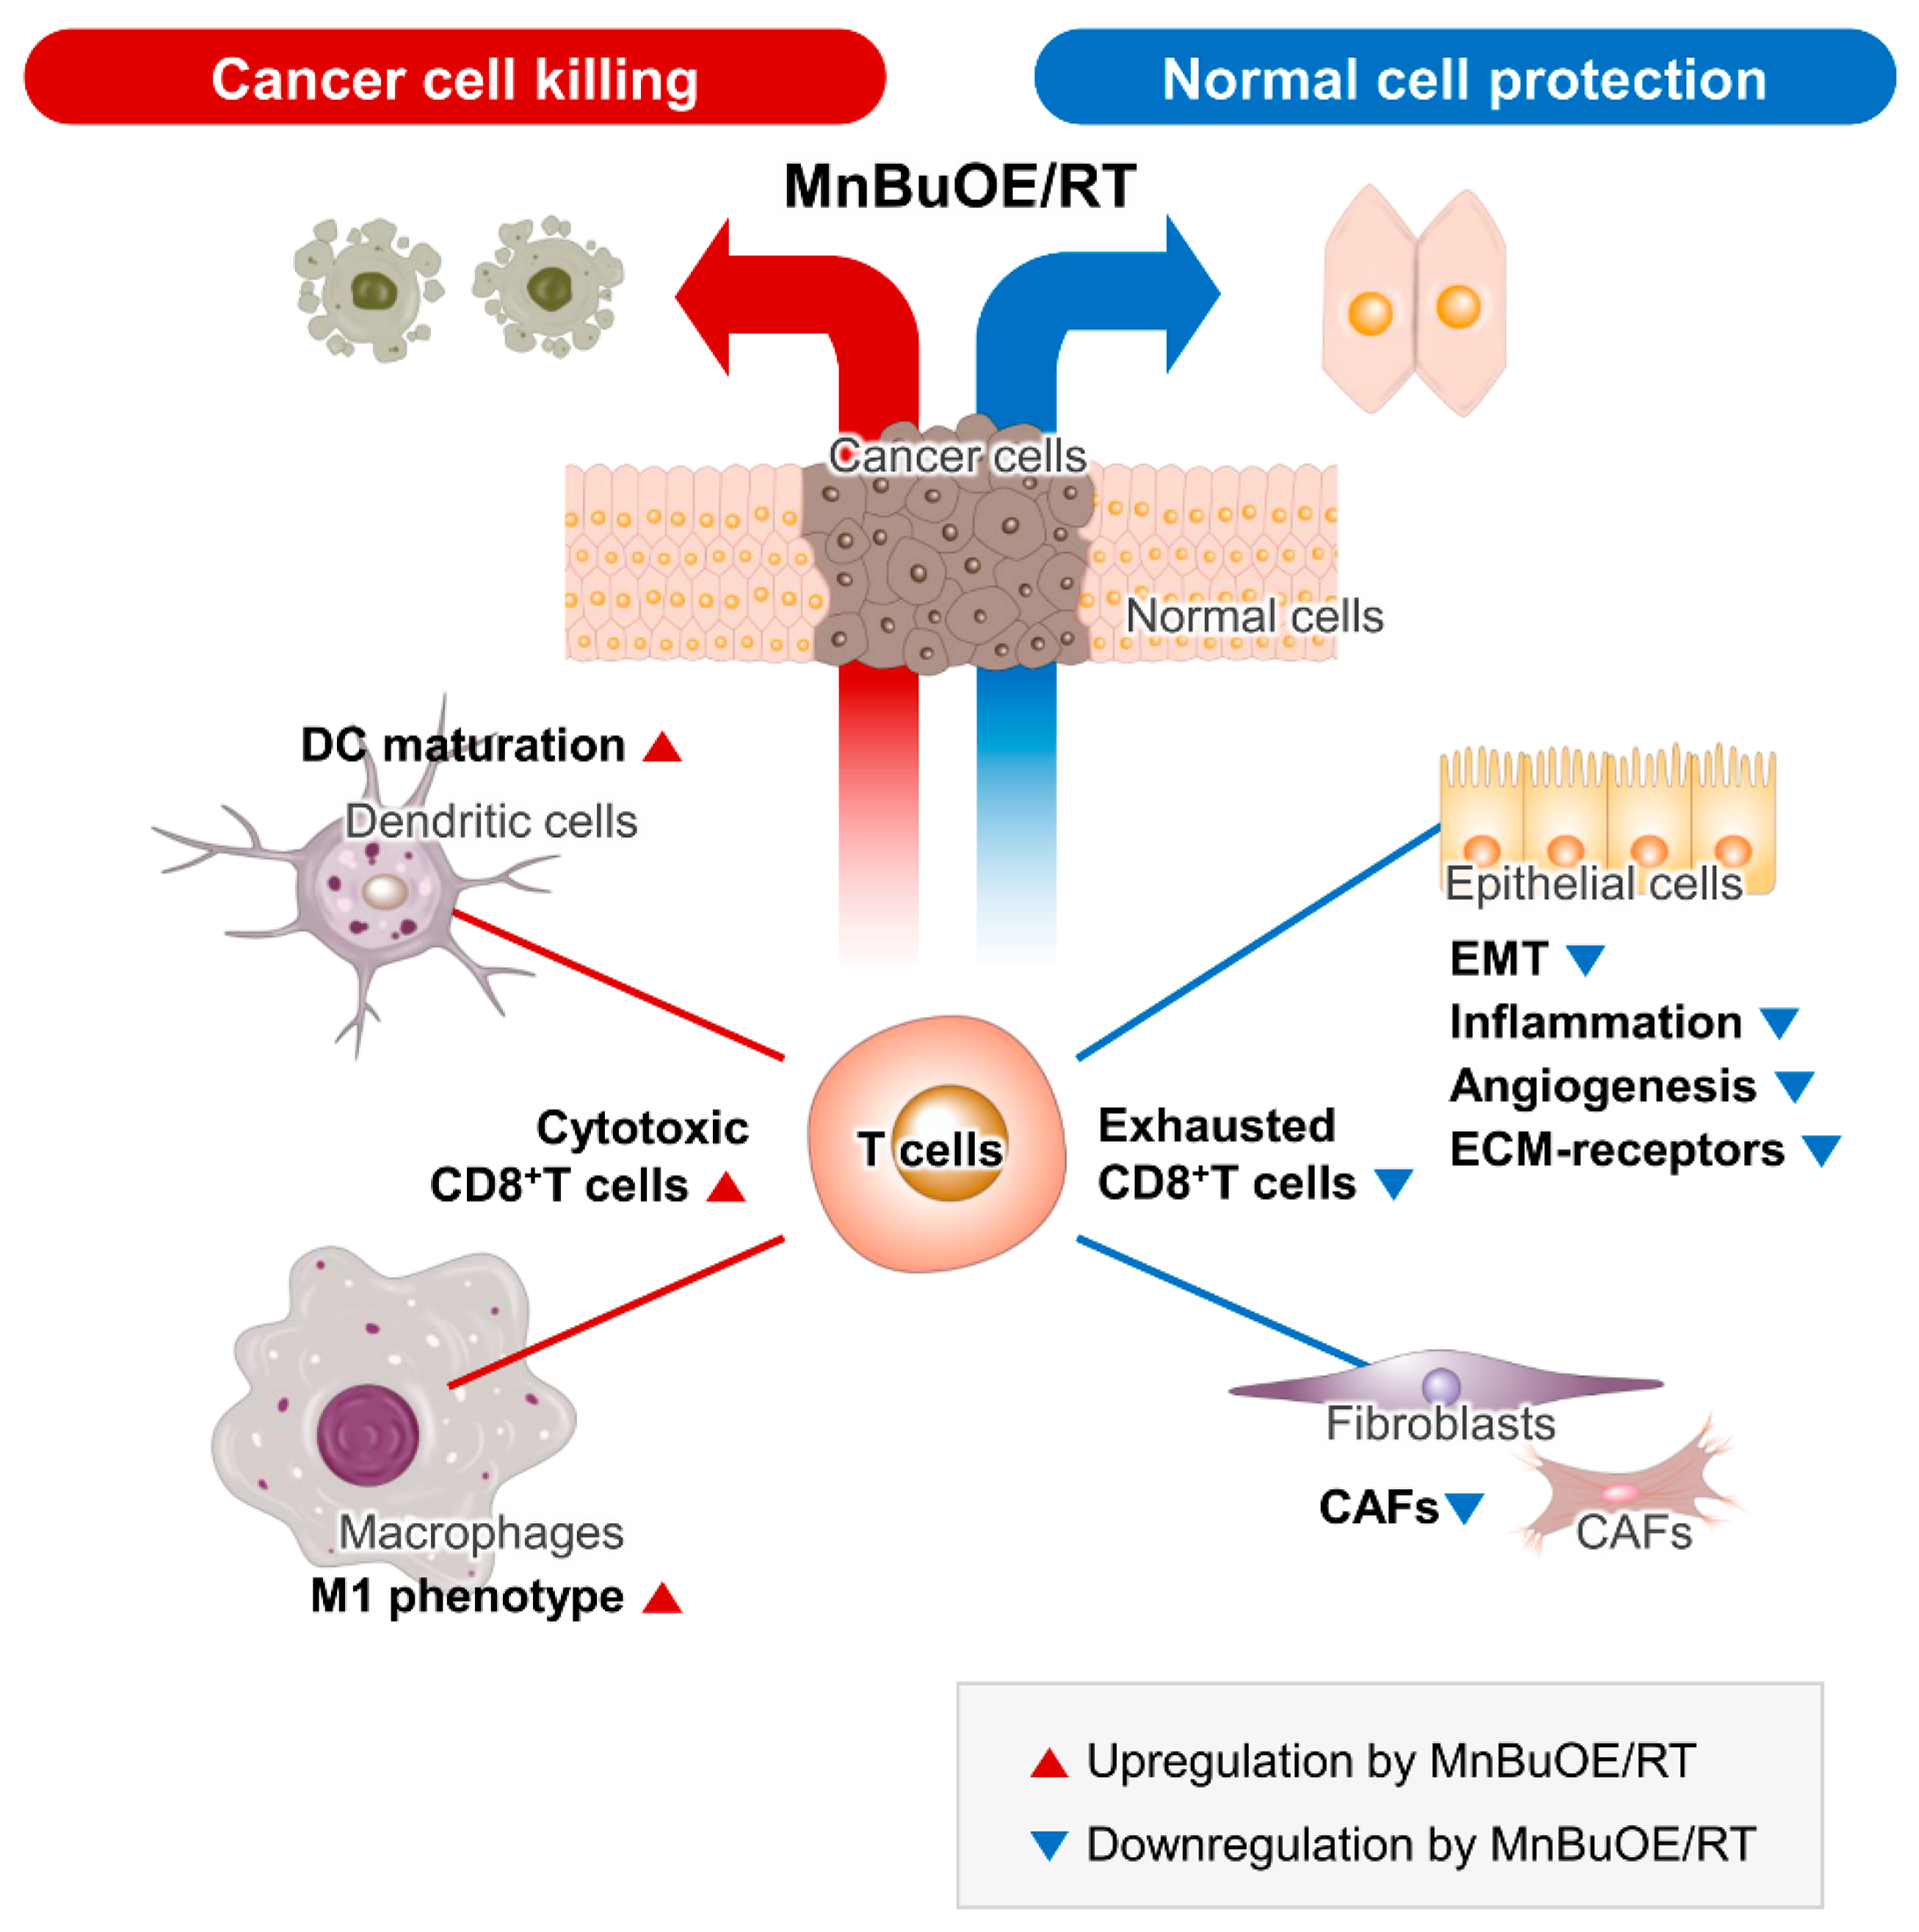
5. Conclusions
Supplementary Materials
Author Contributions
Funding
Institutional Review Board Statement
Informed Consent Statement
Data Availability Statement
Conflicts of Interest
References
- Franchina, D.G.; Dostert, C.; Brenner, D. Reactive Oxygen Species: Involvement in T Cell Signaling and Metabolism. Trends Immunol. 2018, 39, 489–502. [Google Scholar] [CrossRef]
- Chen, X.; Song, M.; Zhang, B.; Zhang, Y. Reactive Oxygen Species Regulate T Cell Immune Response in the Tumor Microenvironment. Oxidative Med. Cell. Longev. 2016, 2016, 1580967. [Google Scholar] [CrossRef]
- Yarosz, E.L.; Chang, C.H. The Role of Reactive Oxygen Species in Regulating T Cell-mediated Immunity and Disease. Immune Netw. 2018, 18, e14. [Google Scholar] [CrossRef]
- Lee, S.Y.; Jeong, E.K.; Ju, M.K.; Jeon, H.M.; Kim, M.Y.; Kim, C.H.; Park, H.G.; Han, S.I.; Kang, H.S. Induction of metastasis, cancer stem cell phenotype, and oncogenic metabolism in cancer cells by ionizing radiation. Mol. Cancer 2017, 16, 10. [Google Scholar] [CrossRef]
- Batinic-Haberle, I.; Tovmasyan, A.; Huang, Z.; Duan, W.; Du, L.; Siamakpour-Reihani, S.; Cao, Z.; Sheng, H.; Spasojevic, I.; Alvarez Secord, A. H2O2-Driven Anticancer Activity of Mn Porphyrins and the Underlying Molecular Pathways. Oxidative Med. Cell. Longev. 2021, 2021, 6653790. [Google Scholar] [CrossRef]
- Batinic-Haberle, I.; Tovmasyan, A.; Spasojevic, I. Mn Porphyrin-Based Redox-Active Drugs: Differential Effects as Cancer Therapeutics and Protectors of Normal Tissue against Oxidative Injury. Antioxid. Redox Signal. 2018, 29, 1691–1724. [Google Scholar] [CrossRef]
- Batinic-Haberle, I.; Tome, M.E. Thiol regulation by Mn porphyrins, commonly known as SOD mimics. Redox Biol. 2019, 25, 101139. [Google Scholar] [CrossRef]
- Ashcraft, K.A.; Boss, M.K.; Tovmasyan, A.; Roy Choudhury, K.; Fontanella, A.N.; Young, K.H.; Palmer, G.M.; Birer, S.R.; Landon, C.D.; Park, W.; et al. Novel Manganese-Porphyrin Superoxide Dismutase-Mimetic Widens the Therapeutic Margin in a Preclinical Head and Neck Cancer Model. Int. J. Radiat. Oncol. Biol. Phys. 2015, 93, 892–900. [Google Scholar] [CrossRef]
- Peters, K.; Cohen, A.; Butowski, N.; Villano, J.; Mendez, J.; Giglio, P.; McGranahan, T.; Zhang, C.; Smeltzer, J.; Raza, S.; et al. LTBK-09. Results of BMX-HGG study: A multi-institutional, randomized phase 2 clinical trial of concurrent chemoradiation with or without BMX-001 in patients with newly diagnosed high grade glioma. Neuro-Oncology 2023, 25, v311. [Google Scholar] [CrossRef]
- Shin, S.W.; Choi, C.; Kim, H.; Kim, Y.; Park, S.; Kim, S.Y.; Batinic-Haberle, I.; Park, W. MnTnHex-2-PyP5+, Coupled to Radiation, Suppresses Metastasis of 4T1 and MDA-MB-231 Breast Cancer via AKT/Snail/EMT Pathways. Antioxidants 2021, 10, 1769. [Google Scholar] [CrossRef]
- Shrishrimal, S.; Chatterjee, A.; Kosmacek, E.A.; Davis, P.J.; McDonald, J.T.; Oberley-Deegan, R.E. Manganese porphyrin, MnTE-2-PyP, treatment protects the prostate from radiation-induced fibrosis (RIF) by activating the NRF2 signaling pathway and enhancing SOD2 and sirtuin activity. Free Radic. Biol. Med. 2020, 152, 255–270. [Google Scholar] [CrossRef] [PubMed]
- Ozpiskin, O.M.; Zhang, L.; Li, J.J. Immune targets in the tumor microenvironment treated by radiotherapy. Theranostics 2019, 9, 1215–1231. [Google Scholar] [CrossRef] [PubMed]
- Lo Presti, E.; Dieli, F.; Meraviglia, S. Tumor-Infiltrating γδ T Lymphocytes: Pathogenic Role, Clinical Significance, and Differential Programing in the Tumor Microenvironment. Front. Immunol. 2014, 5, 607. [Google Scholar] [CrossRef] [PubMed]
- Jiang, Y.; Li, Y.; Zhu, B. T-cell exhaustion in the tumor microenvironment. Cell Death Dis. 2015, 6, e1792. [Google Scholar] [CrossRef] [PubMed]
- Brassart-Pasco, S.; Brézillon, S.; Brassart, B.; Ramont, L.; Oudart, J.B.; Monboisse, J.C. Tumor Microenvironment: Extracellular Matrix Alterations Influence Tumor Progression. Front. Onc ol. 2020, 10, 397. [Google Scholar] [CrossRef]
- Giorello, M.B.; Borzone, F.R.; Labovsky, V.; Piccioni, F.V.; Chasseing, N.A. Cancer-Associated Fibroblasts in the Breast Tumor Microenvironment. J. Mammary Gland. Biol. Neoplasia 2021, 26, 135–155. [Google Scholar] [CrossRef] [PubMed]
- Suvà, M.L.; Tirosh, I. Single-Cell RNA Sequencing in Cancer: Lessons Learned and Emerging Challenges. Mol. Cell 2019, 75, 7–12. [Google Scholar] [CrossRef] [PubMed]
- Quinn, J.J.; Jones, M.G.; Okimoto, R.A.; Nanjo, S.; Chan, M.M.; Yosef, N.; Bivona, T.G.; Weissman, J.S. Single-cell lineages reveal the rates, routes, and drivers of metastasis in cancer xenografts. Science 2021, 371, eabc1944. [Google Scholar] [CrossRef] [PubMed]
- Sheng, B.; Pan, S.; Ye, M.; Liu, H.; Zhang, J.; Zhao, B.; Ji, H.; Zhu, X. Single-cell RNA sequencing of cervical exfoliated cells reveals potential biomarkers and cellular pathogenesis in cervical carcinogenesis. Cell Death Dis. 2024, 15, 130. [Google Scholar] [CrossRef] [PubMed]
- Hao, Y.; Hao, S.; Andersen-Nissen, E.; Mauck, W.M., 3rd; Zheng, S.; Butler, A.; Lee, M.J.; Wilk, A.J.; Darby, C.; Zager, M.; et al. Integrated analysis of multimodal single-cell data. Cell 2021, 184, 3573–3587.e29. [Google Scholar] [CrossRef]
- Finak, G.; McDavid, A.; Yajima, M.; Deng, J.; Gersuk, V.; Shalek, A.K.; Slichter, C.K.; Miller, H.W.; McElrath, M.J.; Prlic, M.; et al. MAST: A flexible statistical framework for assessing transcriptional changes and characterizing heterogeneity in single-cell RNA sequencing data. Genome Biol. 2015, 16, 278. [Google Scholar] [CrossRef] [PubMed]
- Carpen, L.; Falvo, P.; Orecchioni, S.; Mitola, G.; Hillje, R.; Mazzara, S.; Mancuso, P.; Pileri, S.; Raveane, A.; Bertolini, F. A single-cell transcriptomic landscape of innate and adaptive intratumoral immunity in triple negative breast cancer during chemo- and immunotherapies. Cell Death Discov. 2022, 8, 106. [Google Scholar] [CrossRef] [PubMed]
- Aran, D.; Looney, A.P.; Liu, L.; Wu, E.; Fong, V.; Hsu, A.; Chak, S.; Naikawadi, R.P.; Wolters, P.J.; Abate, A.R.; et al. Reference-based analysis of lung single-cell sequencing reveals a transitional profibrotic macrophage. Nat. Immunol. 2019, 20, 163–172. [Google Scholar] [CrossRef] [PubMed]
- Ji, X.; Tsao, D.; Bai, K.; Tsao, M.; Xing, L.; Zhang, X. scAnnotate: An automated cell-type annotation tool for single-cell RNA-sequencing data. Bioinform. Adv. 2023, 3, vbad030. [Google Scholar] [CrossRef] [PubMed]
- Zilionis, R.; Engblom, C.; Pfirschke, C.; Savova, V.; Zemmour, D.; Saatcioglu, H.D.; Krishnan, I.; Maroni, G.; Meyerovitz, C.V.; Kerwin, C.M.; et al. Single cell transcriptomics of human and mouse lung cancers reveals conserved myeloid populations across individuals and species. Immunity 2019, 50, 1317–1334. [Google Scholar] [CrossRef] [PubMed]
- Benayoun, B.A.; Pollina, E.A.; Singh, P.P.; Mahmoudi, S.; Harel, I.; Casey, K.M.; Dulken, B.W.; Kundaje, A.; Brunet, A. Remodeling of epigenome and transcriptome landscapes with aging in mice reveals widespread induction of inflammatory responses. Genome Res. 2019, 29, 697–709. [Google Scholar] [CrossRef] [PubMed]
- Gao, R.; Bai, S.; Henderson, Y.C.; Lin, Y.; Schalck, A.; Yan, Y.; Kumar, T.; Hu, M.; Sei, E.; Davis, A.; et al. Delineating copy number and clonal substructure in human tumors from single-cell transcriptomes. Nat. Biotechnol. 2021, 39, 599–608. [Google Scholar] [CrossRef] [PubMed]
- Korotkevich, G.; Sukhov, V.; Budin, N.; Shpak, B.; Artyomov, M.N.; Sergushichev, A. Fast gene set enrichment analysis. bioRxiv 2021. [Google Scholar] [CrossRef]
- Qiu, X.; Hill, A.; Packer, J.; Lin, D.; Ma, Y.A.; Trapnell, C. Single-cell mRNA quantification and differential analysis with Census. Nat. Methods 2017, 14, 309–315. [Google Scholar] [CrossRef] [PubMed]
- Jin, S.; Guerrero-Juarez, C.F.; Zhang, L.; Chang, I.; Ramos, R.; Kuan, C.H.; Myung, P.; Plikus, M.V.; Nie, Q. Inference and analysis of cell-cell communication using CellChat. Nat. Commun. 2021, 12, 1088. [Google Scholar] [CrossRef]
- Bejarano, L.; Kauzlaric, A.; Lamprou, E.; Lourenco, J.; Fournier, N.; Ballabio, M.; Colotti, R.; Maas, R.; Galland, S.; Massara, M.; et al. Interrogation of endothelial and mural cells in brain metastasis reveals key immune-regulatory mechanisms. Cancer Cell 2024, 42, 378–395. [Google Scholar] [CrossRef] [PubMed]
- Shi, J.; Wei, X.; Xun, Z.; Ding, X.; Liu, Y.; Liu, L.; Ye, Y. The web-based portal SpatialTME integrates histological images with single-cell and spatial transcriptomics to explore the tumor microenvironment. Caner Res. 2024, 84, 1210–1220. [Google Scholar] [CrossRef] [PubMed]
- Yuan, T.; Zhang, J.; Zhao, Y.; Guo, Y.; Fan, S. Single-cell RNA sequencing of intestinal crypts reveals vital events in damage repair and the double-edged sword effect of the Wnt3/β-catenin pathway in irradiated mice. Redox Biol. 2023, 68, 102942. [Google Scholar] [CrossRef] [PubMed]
- Lavie, D.; Ben-Shmuel, A.; Erez, N.; Scherz-Shouval, R. Cancer-associated fibroblasts in the single-cell era. Nat. Cancer 2022, 3, 793–807. [Google Scholar] [CrossRef] [PubMed]
- Wu, F.; Yang, J.; Liu, J.; Wang, Y.; Mu, J.; Zeng, Q.; Deng, S.; Zhou, H. Signaling pathways in cancer-associated fibroblasts and targeted therapy for cancer. Signal Transduct. Target. Ther. 2021, 6, 218. [Google Scholar] [CrossRef] [PubMed]
- Winkler, J.; Abisoye-Ogunniyan, A.; Metcalf, K.J.; Werb, Z. Concepts of extracellular matrix remodelling in tumour progression and metastasis. Nat. Commun. 2020, 11, 5120. [Google Scholar] [CrossRef] [PubMed]
- Baker, A.T.; Abuwarwar, M.H.; Poly, L.; Wilkins, S.; Fletcher, A.L. Cancer-Associated Fibroblasts and T Cells: From Mechanisms to Outcomes. J. Immunol. 2021, 206, 310–320. [Google Scholar] [CrossRef] [PubMed]
- van der Leun, A.M.; Thommen, D.S.; Schumacher, T.N. CD8+ T cell states in human cancer: Insights from single-cell analysis. Nat. Rev. Cancer 2020, 20, 218–232. [Google Scholar] [CrossRef] [PubMed]
- Pauken, K.E.; Wherry, E.J. TIGIT and CD226: Tipping the balance between costimulatory and coinhibitory molecules to augment the cancer immunotherapy toolkit. Cancer Cell 2014, 26, 785–787. [Google Scholar] [CrossRef]
- Chiang, E.Y.; Mellman, I. TIGIT-CD226-PVR axis: Advancing immune checkpoint blockade for cancer immunotherapy. J. Immunother. Cancer 2022, 10, e004711. [Google Scholar] [CrossRef]
- Yeo, J.; Ko, M.; Lee, D.-H.; Park, Y.; Jin, H.S. TIGIT/CD226 Axis Regulates Anti-Tumor Immunity. Pharmaceuticals 2021, 14, 200. [Google Scholar] [CrossRef] [PubMed]
- Gardner, A.; Ruffell, B. Dendritic Cells and Cancer Immunity. Trends Immunol. 2016, 37, 855–865. [Google Scholar] [CrossRef] [PubMed]
- Hourani, T.; Holden, J.A.; Li, W.; Lenzo, J.C.; Hadjigol, S.; O’brien-Simpson, N.M. Tumor Associated Macrophages: Origin, Recruitment, Phenotypic Diversity, and Targeting. Front. Oncol. 2021, 11, 788365. [Google Scholar] [CrossRef] [PubMed]
- Ricketts, T.D.; Prieto-Dominguez, N.; Gowda, P.S.; Ubil, E. Mechanisms of Macrophage Plasticity in the Tumor Environment: Manipulating Activation State to Improve Outcomes. Front. Immunol. 2021, 12, 642285. [Google Scholar] [CrossRef] [PubMed]
- Gabrilovich, D.I.; Nagaraj, S. Myeloid-derived suppressor cells as regulators of the immune system. Nat. Rev. Immunol. 2009, 9, 162–174. [Google Scholar] [CrossRef]
- Hu, Y.; Shao, X.; Xing, L.; Li, X.; Nonis, G.M.; Koelwyn, G.J.; Zhang, X.; Sin, D.D. Single-Cell Sequencing of Lung Macrophages and Monocytes Reveals Novel Therapeutic Targets in COPD. Cells 2023, 12, 2771. [Google Scholar] [CrossRef]


Disclaimer/Publisher’s Note: The statements, opinions and data contained in all publications are solely those of the individual author(s) and contributor(s) and not of MDPI and/or the editor(s). MDPI and/or the editor(s) disclaim responsibility for any injury to people or property resulting from any ideas, methods, instructions or products referred to in the content. |
© 2024 by the authors. Licensee MDPI, Basel, Switzerland. This article is an open access article distributed under the terms and conditions of the Creative Commons Attribution (CC BY) license (https://creativecommons.org/licenses/by/4.0/).
Share and Cite
Noh, S.U.; Lim, J.; Shin, S.-W.; Kim, Y.; Park, W.-Y.; Batinic-Haberle, I.; Choi, C.; Park, W. Single-Cell Profiling Reveals Immune-Based Mechanisms Underlying Tumor Radiosensitization by a Novel Mn Porphyrin Clinical Candidate, MnTnBuOE-2-PyP5+ (BMX-001). Antioxidants 2024, 13, 477. https://doi.org/10.3390/antiox13040477
Noh SU, Lim J, Shin S-W, Kim Y, Park W-Y, Batinic-Haberle I, Choi C, Park W. Single-Cell Profiling Reveals Immune-Based Mechanisms Underlying Tumor Radiosensitization by a Novel Mn Porphyrin Clinical Candidate, MnTnBuOE-2-PyP5+ (BMX-001). Antioxidants. 2024; 13(4):477. https://doi.org/10.3390/antiox13040477
Chicago/Turabian StyleNoh, Sun Up, Jinyeong Lim, Sung-Won Shin, Yeeun Kim, Woong-Yang Park, Ines Batinic-Haberle, Changhoon Choi, and Won Park. 2024. "Single-Cell Profiling Reveals Immune-Based Mechanisms Underlying Tumor Radiosensitization by a Novel Mn Porphyrin Clinical Candidate, MnTnBuOE-2-PyP5+ (BMX-001)" Antioxidants 13, no. 4: 477. https://doi.org/10.3390/antiox13040477
APA StyleNoh, S. U., Lim, J., Shin, S.-W., Kim, Y., Park, W.-Y., Batinic-Haberle, I., Choi, C., & Park, W. (2024). Single-Cell Profiling Reveals Immune-Based Mechanisms Underlying Tumor Radiosensitization by a Novel Mn Porphyrin Clinical Candidate, MnTnBuOE-2-PyP5+ (BMX-001). Antioxidants, 13(4), 477. https://doi.org/10.3390/antiox13040477