Article

Qualitative, Quantitative, In Vitro Antioxidant Activity and Chemical Profiling of Leptadenia pyrotechnica (Forssk.) Decne Using Advanced Analytical Techniques

1
Department of Bioscience and Biotechnology, Banasthali Vidyapith, Tonk 304022, Rajasthan, India
2
Department of Chemistry, Mohanlal Sukhadia University, Udaipur 313001, Rajasthan, India
3
Laboratory of Phytopathology and Microbial Biotechnology, Department of Botany, Mohanlal Sukhadia University, Udaipur 313001, Rajasthan, India
4
Department of Botany and Microbiology, College of Science, King Saud University, Riyadh 11451, Saudi Arabia
*
Author to whom correspondence should be addressed.
Antioxidants 2024, 13(7), 794; https://doi.org/10.3390/antiox13070794
Submission received: 1 June 2024 / Revised: 24 June 2024 / Accepted: 25 June 2024 / Published: 28 June 2024
(This article belongs to the Special Issue Advances in Plant Methods: Antioxidant Activity in Plant Extracts)

Abstract

:
Leptadenia pyrotechnica Forssk. Decne (LP) is a medicinal herb from the Asclepiadaceae family with many advantageous properties. The goal of this research is to identify, quantify, and evaluate the antioxidant potential of LP to validate its remarkable therapeutic advantages. The hot soxhlet extraction method was employed to prepare different extracts of LP (stem and root). These extracts were evaluated physiochemically to check their impurity, purity, and quality; qualitatively to detect different phytochemicals; and quantitatively for phenol, saponin, tannin, flavonoid, and alkaloid contents. Then, the in vitro antioxidant potential was estimated by DPPH, NO, H2O2 scavenging assays, and MC and FRAP assays. The most prevalent phytochemicals of LP were then analysed by AAS, FT-IR, UV–visible, and GC-MS techniques. A higher extractive yield was shown by LPSE and LPRE (7.37 ± 0.11 and 5.70 ± 0.02). The LP stem showed better physicochemical and qualitative results than the root. The quantitative and in vitro antioxidant results indicated maximal phenols, tannins, and alkaloid contents in LPSE, which was further confirmed by UV–visible, FT-IR, and GC-MS results. The extraction methods (soxhlation or ultrasonication) were optimized by utilizing RSM to determine the impacts of multiple parameters. The study concluded that the plant has remarkable therapeutic advantages to promote additional clinical investigations and the mechanisms of its action.

Graphical Abstract

1. Introduction

The region of the Indian Himalayas has excited the curiosity of scientists and offers an endless array of different medicinal herbs [1]. Medicinal herbs have been taken advantage of for their therapeutic properties since the start of human history. Therapeutic plants have a prolonged record, which is continuously utilized to create natural medications for a range of illnesses and diseases worldwide [2,3,4,5]. In accordance with the World Health Organization (WHO), approximately 80% of the global human population relies on traditional medical treatments for basic well-being due to the absence of contemporary medicines and economic hardship [6]. With the progress of new pharmaceuticals, the utilization of plants or organic components in medicinal perspectives for a broad range of factors has been boosted worldwide. Due to their harmless nature and fewer recognized negative effects than contemporary generic pharmaceuticals, herbal remedies have often been used in remote regions [7,8].
Leptadenia pyrotechnica Forssk. Decne (LP) is a medicinal herb from the Leptadenia genus and Asclepiadaceae family with many advantageous properties. It is a massively branched, most often upright, leafless shrub that flourishes in hot, sandy, and arid regions instead of deep, non-saline sand [9]. It stretches throughout the regions of North Africa, the Arabian Peninsula, and Western India from the Northern Sahel region. In addition to Pakistan and India, LP has been identified in Mauritania, Eritrea, Egypt, the United Arab Emirates, Somalia, Saudi Arabia, Qatar, and Bahrain. Some common names for it are Blazing Bush, Desert Broom, Kheep, Khip, and Khimp. According to relevant research, this plant exhibits a broad spectrum of notable medicinal properties, comprising cytotoxic, antibacterial, wound healing, anticancer, antioxidant, antidiabetic, antilipoxygenase, anthelmintic, and antiatherosclerotic properties [10]. Precious phytochemicals such as phenolic acids, flavonoids, cardiac glycosides, terpenes, pregnane glycosides, sugars, alkaloids, fatty acids, amino acids, hydrocarbons, and sterols have been reported to be prevalent in LP [11].
This plant is regarded as a promising natural cure based on prior research, which may be important in the discovery of possible new medications. The data on various parts of the plant (LP) and its biological functions are currently insufficient, even though there have been some studies on phytocompounds and their total content. Therefore, the purpose of this study was to determine the phenolic, saponin, tannin, flavonoid, and alkaloid contents and their antioxidant activities in distinct extracts of LP stem and root using several quantitative assays such as total phenolic content (TPC), total saponin content (TSC), total tannin content (TTC), total flavonoid content (TFC), total alkaloid content (TAC), and in vitro antioxidant activities such as 2,2-diphenyl-1-picryl-hydrazyl-hydrate (DPPH), nitric oxide (NO), hydrogen peroxide (H2O2) scavenging assays and ferric reducing antioxidant power (FRAP) assays, and metal chelation (MC) assays. The present study also intended to describe the bioactive components in the plant extracts using different spectroscopic methods [atomic absorption spectrophotometer (AAS), ultraviolet–visible (UV–vis), Fourier-transform infrared spectroscopy (FT-IR), and gas chromatography–mass spectrometry (GC-MS)] along with the estimation of their bioactivities. This study also aims to optimize the extraction methods of tannins, phenols, and alkaloids from LP stem using conventional soxhlet extraction (CSE) and non-conventional ultrasound-assisted extraction (NCUSAE), taking ethanol as a solvent. To the best of our knowledge, these techniques utilizing ethanol have not been mentioned earlier and this technology can facilitate mass transfer processes and lower energy usage.

2. Materials and Methods

2.1. Chemicals and Drugs Utilized

Ascorbic acid (AA), 2,2-Diphenyl-1-picrylhydrazyl (DPPH), gallic acid (GA), trichloroacetic acid (TCAA), quillaja (QJ), rutin (RUT), caffeine (Cf), ferrozine, Folin–Ciocalteu reagent, Folin–Denis reagent, ferric chloride (FeCl3), aluminium chloride (AlCl3), sodium carbonate (Na2CO3), sodium hydroxide (NaOH), sodium nitrite (NaNO2), tannic acid (TA), vanillin, sulfuric acid (H2SO4), ethylenediaminetetraacetic acid (EDTA), bromothymol blue (BTB), butylated hydroxytoluene (BHT), hydrochloric acid (HCl), 2,4,6-tri (2-pyridyl)-S-triazine (TPTZ), hydrogen peroxide (H2O2), sodium nitroprusside, Griess’ reagent, disodium hydrogen phosphate (Na2HPO4), sodium dihydrogen phosphate (NaH2PO4), nitric acid (HNO3), perchloric acid (HClO4), sulfanilic acid (H3NC6H4SO3), napthylethylene diamine dihydrochloride (C12H16Cl2N2), sodium sulphate (Na2SO4), and other chemicals and solvents (analytical grade) were purchased from Sigma Aldrich (Burlington, MA, USA) and Hi-Media brands (Maharashtra, India).

2.2. Collection of Experimental Plant Material

The experimental plant was collected in the month of January, identified (Altitude: 26°24′14.8414″; Latitude: 73°52′9.7194″), and authenticated by the botanist from Krishi Vigyan Kendra, Banasthali Vidyapith, Rajasthan (304022). A voucher number (BURI-1727/2023) was received, and this species name was submitted to the International Plant Names Index and first published in Annales des Sciences Naturelles, Botanique [12].

2.3. Extract Preparation of the Plant Sample

For the current study, only the relevant parts of LP were utilized, namely the stems and the roots. The plant samples were first cleaned using distilled water, allowed to air-dry (15 to 25 days) in the shade, and then roughly crushed with the grinding machine to turn them into fine powder. We used 400 mL each of petroleum ether (PE) (at 60 °C), hexane (H) (at 68 °C), chloroform (CH) (at 61.2 °C), ethyl acetate (EA) (at 77.2 °C), ethanol (E) (at 82 °C), and aqueous (AQ) solvents (at 100 °C) for 8–24 h to prepare six total separate plant extracts. To quantify the secondary metabolites, extracts were dried, stored in desiccators, and then afterwards kept at 4 °C in an airtight apparatus. The extract concentration employed throughout the experiments was 1 mg/mL. The hot soxhlet extraction method was employed for preparing different LP extracts by utilizing 50 g powdered plant material and 400 mL of each of the solvents, which were further kept at 4 °C in an airtight apparatus for further analysis [13]. The percentage of extraction yield for the various LP extracts was calculated by the following formula [14]:
Extract yield (%) = (Weight of sample extract)/(Weight of dry plant powder) × 100

2.4. Proximate Analyses

Physicochemical parameters such as the ash content (water-soluble ash, total ash, and acid-insoluble ash), foreign organic matter, crude fibre, crude fat, loss of dryness (LOD), and pH (at 1% and 10%) were determined by utilizing fresh plant samples (powdered forms of stem and root) for the evaluation of impurity, purity, and quality of the crude drugs present in the samples. All the evaluations were carried out according to the WHO guidelines on quality control techniques for medicinal plant materials [15].

2.5. Qualitative Screening

Qualitative screening can reveal the presence or absence of numerous kinds of secondary metabolites in a plant. It is based on changes in colour, precipitation, or other macroscopically visible variations. Various primary and secondary plant metabolites, such as carbohydrates, amino acids, flavonoids, tannins, alkaloids, phenols, and saponins, were evaluated in both the stem and root parts of LP extracts.

2.6. Quantitative Analysis of Phytocompounds

2.6.1. Total Phenolic Estimation

To 2.5 mL of Na2CO3 (20%) and 500 µL of Folin–Ciocalteu reagent (1:1 with distilled water) was added 100 µL of sample extract. The solution was properly mixed before being incubated in the dark for 40 min to produce its specific colour. After that, the absorbance was measured at 725 nm following incubation. A calibration curve for the standard gallic acid (GA) was made, and linearity was observed between 100 and 500 µg/mL. The TPC was represented as GA equivalent per 50 g of powdered plant material (µg GA/50 g powdered plant material), using the formula given below [16]:
C = c × V/m
where C = total plant extract content (µg/g); c = concentration determined from standard curve (y); V = extract volume (mL); and m = weight of pure sample extract (g).

2.6.2. Total Saponin Estimation

After mixing 2.5 mL of 72% H2SO4, 0.25 mL of 8% vanillin (w/v) in methanol was then added to 0.1 mL of the appropriately diluted LP stem and root extracts. The solution tubes were then sealed, vortexed, and incubated for an additional 15 min at 60 °C, and their absorbance was determined at 560 nm. A standard graph of quillaja (QJ) was prepared and the TSC was represented as QJ equivalents per 50 g of powdered plant material (µg QJ/50 g powdered plant material) [17].

2.6.3. Total Tannin Estimation

The 0.5 mL sample extract was mixed with methanol (0.5 mL), Folin–Denis (0.5 mL) reagent, and 1 mL Na2CO3 solution (35%). The reaction mixture was mixed with distilled water to make up the volume of 10 mL. The solution was then mixed accurately before being kept for 30 min at room temperature, and the absorbance of the resultant solution was determined at 700 nm. A standard graph of tannic acid (TA) was prepared and the TTC was represented as TA equivalents per 50 g of powdered plant material (µg TA/50 g powdered plant material) [18].

2.6.4. Total Flavonoid Estimation

About 0.1 mL of sample extract was dissolved in distilled water (200 mL) before mixing with 150 mL of NaNO2 (5% w/v) solution. After incubation for five minutes, 150 µL of AlCl3 solution (10% w/v) was added to it, and the mixture was kept for incubation for 6 min. Then, 2 mL of NaOH (4% w/v) solution was added and made up the volume of the solution with distilled water to 5 mL. After thoroughly shaking, the mixture was kept at room temperature (RT) for 15 min and the absorbance was measured at 510 nm. A standard graph of rutin (RUT) was prepared and the TFC was represented as RUT equivalents per 50 g of powdered plant material (µg RUT/50 g powdered plant material) [19].

2.6.5. Total Alkaloid Estimation

About 0.1 mL of sample extract was mixed in 0.4 mL HCl (2 N) and then filtered. An aliquot of 0.5 mL of this mixture was transferred into a separating funnel and rinsed 3 times with chloroform (5 mL). Then, 5 mL of 0.1% chloroform extract was initially dissolved in 5 mL of phosphate buffer with pH 7.5 and 5 mL of BTB, and then mixed with 5 mL of chloroform and shaken for 3 min. The reaction mixture was then transferred again into the separating funnel and left to sit for two hours. Then, after, the chloroform layer had collected (at the bottom of the funnel), and out of that 4 mL was taken separately and anhydrous Na2SO4 (0.2 mg) was added to that portion and shaken well to make the mixture dehydrated. After leaving for 10 min, the absorbance of the solution (supernatant) was determined at 414 nm. A standard graph of caffeine (Cf) was prepared and the TAC was represented as caffeine equivalents per 50 g of powdered plant material (µg Cf/50 g powdered plant material) [20,21].

2.7. Estimation of the In Vitro Antioxidant Activity

The antioxidant activity of LP stem and root extracts was estimated in vitro using DPPH, NO, H2O2 radical scavenging activities, MC, and FRAP assays.

2.7.1. 2,2-Diphenyl-1-picrylhydrazyl (DPPH) Free Radical Scavenging Assay

The free radical scavenging assay of DPPH was determined utilizing the technique described by [22]. DPPH absorbs at 517 nm in its radical state, but its absorbance falls when it is reduced by another radical species or an antioxidant. To be precise, 3 mL of sample solution (stock solution of LP stem and root extracts were prepared by dissolving in methanol) at distinct concentrations (100 to 500 μg/mL) were added to 1 mL of 0.1 mM DPPH solution (weighed at 0.399 mg of DPPH and dissolved in 50 mL of methanol). The absorbance was determined at 517 nm after 30 min. Greater free radical scavenging activity indicated the lesser absorbance of the reaction solution. The 1 mL DPPH solution was added to methanol (3 mL) and the absorbance was taken as a blank. The DPPH radical scavenging activity was evaluated using the equation given below.
DPPH radical scavenging activity (%) = (Ac − As)/Ac × 100
where Ac = absorbance of ascorbic acid (control); As = absorbance in the presence of the extract.

2.7.2. Nitric Oxide (NO) Scavenging Assay

The effectiveness of the NO scavenging assay was evaluated by utilizing Griess’ reagent. Briefly, 2 mL of 10 mM sodium nitroprusside in a standard phosphate buffer (pH 7.4) and 0.5 mL of sample extracts at distinct concentrations (100–500 μg/mL) were added and incubated at 25 °C for 2 h 30 min. The mixture was then kept for 5 min at 25 °C with the sulfanilic acid reagent (1 mL). The mixture was then combined with 1 mL of napthylethylene diamine dihydrochloride (0.1% v/v) and kept at RT (30 min). The absorbance was estimated at 540 nm using a UV–visible spectrophotometer [23]. The positive control was ascorbic acid.
Nitric oxide (NO) scavenging activity (%) = (Ac − As)/Ac × 100
where Ac = absorbance of ascorbic acid (control); As = absorbance in the presence of the extract.

2.7.3. Hydrogen Peroxide (H2O2) Radical Scavenging Activity Analysis

H2O2 is a significant biological oxidant due to its ability to produce the hydroxyl (OH) radical, i.e., a highly potent molecule. One of the most reactive oxidants in biochemical processes, the hydroxyl radical can add or remove hydrogen atoms from unsaturated hydrogen bonds present in organic lipids. However, because of its short half-life, both its efficacy and capacity to diffuse are limited. Here, 40 mM of H2O2 solution was made in phosphate buffer with pH 7.4. The prepared H2O2 solution (0.6 mL) was then added to distinct LP concentrations (10–100 µg/mL). The absorbance of the resultant solution was estimated at 230 nm. The blank was prepared with phosphate buffer only. The positive control was ascorbic acid [22]:
H2O2 radical scavenging activity (%) = (Ac − As)/Ac × 100
where Ac = absorbance of ascorbic acid (control); As = absorbance in the presence of the extract.

2.7.4. Metal Chelation (MC) Activity

The colorimetric MC activity method was utilized for determining the LP extracts’ potential to chelate ferrous (Fe2+) ions. Briefly, plant extract (0.2 mL) with a concentration ranging from 100 to 500 µg/mL was mixed with 0.4 mL of 0.25 mM ferrozine and 0.1 mM FeSO4 (0.2 mL). The absorbance of the stable ferrous–ferrozine complex increased after 10 min (room temperature) at 562 nm. The positive control was EDTA [24].
Metal chelation activity (%) = (Ac − As)/Ac × 100
where Ac = absorbance of EDTA (control); As = absorbance in the presence of the extract.

2.7.5. Ferric Reducing Antioxidant Power (FRAP) Assay

The FRAP assay was utilized to evaluate the antioxidant capacity of the LP extracts. The FRAP reagent was prepared with 10 mM of TPTZ in a 1:1:10 ratio with HCl (40 Mm), FeCl3 (20 mM), and 300 mM of acetate buffer at pH = 3.6. After incubation at room temperature for 30 min in a water bath, the different sample solution concentrations were mixed with 1 mL of the FRAP reagent, and their absorbance was determined at 593 nm. The ferric ion (Fe3+) was reduced to ferrous ion (Fe2+), which afterwards created a blue-coloured combination of Fe2+/TPTZ. The results were represented as µMFe(II)/g and compared with the standard (BHT) [25].

2.8. Elemental Analysis

For the atomic absorption spectrophotometer (AAS: Thermo Scientific, iCE 3000 Series), powdered samples were utilized. About 0.25 g of every test sample was placed in a 50 mL conical flask containing 6.5 mL of HNO3/H2SO4/HClO4 solution in a 5:1:0.5 ratio. The test sample was heated in an acidic mixture in a fume hood until the digestion was complete, as indicated by the release of white vapours from the sample flask. The distilled water (few drops) was then added, and allowed to cool at room temperature. These digested plant samples were then placed in 50 mL volumetric flasks and filled with distilled water to reach a total amount of 50 mL. The filtrate was then collected in the labelled plastic bottles after the extract had been filtered (Whatmann No. 42). The prepared mixtures were examined for the detection of desired elements by using iCE330 GF high-resolution AAS with 50 mm hollow cathode lamps. The gas pressure was air-acetylene, and different rates of gas flow were used (L/min). The proportions of various elements in the respective test samples were measured by the relevant calibration curves of standards generated by utilizing the standard solutions of Mg2+, Mn2+, Zn2+, and Al3+ [26].

2.9. Comparison between Conventional and Non-Conventional Methods

Conventional extraction methods are among the ancient methodologies which often involve the employment of several distinct procedures, including reflux, simple distillation, soxhlation, and cold maceration [27]. The ultrasound-assisted extraction method is a non-conventional extraction technique that can yield more product in a shorter period by using less solvent [28]. One of the most widely utilized statistical and mathematical techniques, RSM, can be utilized to optimize countless biotechnological processes and determine the impacts of multiple parameters [29,30,31,32,33,34]. In this study, ethanol is used as a sustainable solvent to optimize the extraction of alkaloids, tannins, and phenols from the stem of LP, utilizing conventional soxhlet extraction (CSE) and non-conventional ultrasound-assisted extraction (NCUSAE). In CSE, the impacts of temperature, solvent-to-substrate ratio, and extraction duration were assessed. In NCUSAE, the impact of power was also investigated. In NCUSAE, the technique can favour mass transfer procedures and save energy usage.

Experimental Design

The technology utilized in this research study aimed to optimize the extractive conditions of phenols, tannins, and alkaloids sequentially, utilizing ethanol as a common solvent. Two extraction methods, CSE and NCUSAE, were proposed. The impact of distinct solvent-to-substrate ratios was estimated firstly through CSE. Specifically, three factors were involved in each extraction technique, i.e., solvent-to-substrate ratios (300/10, 350/10, and 400/10 v/w); time (18, 26, and 34 h); and temperature (40, 50, and 60 °C) for CSE, and nominal power (120, 220, and 320 W); temperature (40, 50, and 60 °C); and time (30, 45, and 60 min) for NCUSAE (Supplementary Table S1). The best ratio in terms of alkaloids, tannins, and phenol extraction yields was selected to perform subsequent CSE and NCUSAE methods [35]. A central composite design (CCD) was adopted for the CSE system, taking into account temperature, time, and the solvent-to-substrate ratio as three distinct variables. Additionally, CCD was also employed for the NCUSAE. Nominal power, temperature, and time were all independent factors that were investigated. A total of 20 trials using both methods (eight cubic points + six centre point replicates + six axial points) were performed. To calculate the experimental error, the level of centre point replicates in both CCDs was utilized.

2.10. Analytical Methods

2.10.1. Fourier-Transform Infrared Spectroscopy (FT-IR)

The extracts of LP stem and root were examined utilizing FT-IR (Bruker; Billerica, MA, USA), a specified process in the scanning wave number ranges from 4000 to 500 cm−1 with 4 cm−1 resolution in order to generate IR spectra. The data of the spectra were compared with references for determining the functional groups present in the test samples; it was possible to interpret IR spectra acquired from specific extracts [36].

2.10.2. UV–Visible Spectroscopy

The characteristic peaks developed after scanning all the extracts with a UV–visible double-beam spectrophotometer 2202TS (Systronics; Ahmedabad, Gujarat, India) at wavelengths between 200 and 900 nm. Each investigation for the spectrum conformation was carried out in triplicate [37].

2.10.3. GC-MS

In the analysis, the contents were separated using gas chromatography (Thermo Scientific, TSQ 8000 Evo; Waltham, MA, USA) with a fused silica column comprising Elite-5 Mass spectroscopy. Helium (He) was used as a carrier gas with a constant flow rate (1 mL/min). The injector was adjusted at a temperature of 260 °C for the duration of the chromatography run. The extracted sample (1 μL) was placed in the instrument, and the oven temperature was adjusted to 60 °C for 2 min, 300 °C/min at a rate of 10 °C, and 300 °C for 6 min. The specific conditions of the mass detector were as follows: the ionization mode electron impact (70 eV), the scanning period (0.2 s), and the scanning interval (0.1 s) for fragments between 40 and 600 Dalton. The temperature of both the transfer line as well as ion source was 240 °C. The database of known spectral components from the GCMS NIST (2008) library was utilized for comparing the spectral components [38].

2.11. Statistical Calculations

All statistical calculations were made in triplicate, and the outcomes were calculated as mean values with standard error (mean ± SE). Phytoconstituent levels and antioxidant activity were compared on average, and these data were then analysed using analysis of variance (ANOVA) in Graph Pad Prism 8 and IBM SPSS Statistics 20 software. Figures of quantitative analyses and in vitro antioxidant assays were made by using Graph Pad Prism 8 software. A value of * p < 0.01 indicated significance, ** p ˂ 0.001 high significance, and *** p ˂ 0.0001 very high statistical significance. Tukey’s one-way ANOVA test was utilized to determine the differences among groups. Minitab 18.1 software was employed to carry out the ANOVA, RSREG (Response Surface Regression), and respective significance tests. ANOVA was used to figure out how accurately and efficiently the experimental findings fit the created polynomial model. The analysis of UV–visible experimental results was performed by utilizing Origin Pro 8.5 software.

3. Results and Discussion

3.1. Extraction Yield Values of LP Extracts

The percentage yields (% w/w) of the LP stem and root extracts were analysed using different solvents. This indicated the existence of various biologically active components within all extracts of the experimental plant. The findings revealed that in cases of both stem and root, the polar solvent ethanol had a high extractive yield (7.37 ± 0.11 and 5.70 ± 0.02). The pH of LP stem and root extracts (1 mg/mL) was weakly acidic (pH~5–6), i.e., 5.75 ± 0.27 (stem) and 5.11 ± 0.13 (root). Suitable climatic conditions for the collection of LP are from August to January, when plants bloom and produce fruit. The plants may thrive in dry places with exceptionally harsh climates, ranging from −0.4 to 49.5 °C, and sparse, irregular, and variable rainfall [39].

3.2. Physicochemical Analysis of LP

In the present study, the total ash value (TAV) was noted to be higher in the stem (9.96 ± 1.02) than in the root (7.51 ± 0.31). Higher water-soluble ash (WSA) was observed in the stem (3.53 ± 0.45), as compared to the root (3.25 ± 0.56). Higher acid-insoluble ash (AIA) was also observed in the stem (3.53 ± 0.45), as compared to the root (3.59 ± 0.34). Foreign organic matter was observed to be higher in the stem (0.24 ± 0.05) as compared to the root (0.53 ± 0.03). By using the loss on drying (LOD) method at 105 °C, the moisture content was discovered to be higher in the stem (28.36 ± 1.88) than in the root (8.93 ± 1.14). The amount of crude fibre was estimated to be higher in the stem (5.29 ± 0.41) than in the root (1.54 ± 0.44). The amount of crude fat was estimated to be higher in the stem (4.58 ± 0.63) than in the root (3.11 ± 0.18). In Qatar, a study was conducted to discover the proximate mass composition of the aerial part of LP, showing 6.77% moisture, 4.69% ash, 5.60% protein, 15.61% carbs, and 4.39% crude fibre [40].

3.3. Qualitative Screening of Phytochemical Compounds in Various LP Extracts

The plant contains secondary metabolites like alkaloids, flavonoids, terpenoids, glycosides, etc., in an appropriate amount as compared to primary metabolites like proteins, amino acids, carbohydrates, and lipids, as shown by the results of preliminary qualitative screening of distinct phytocompounds within the LP extracts. These metabolites were found in petroleum ether, hexane, chloroform, ethyl acetate, and ethanol solvents, indicating that these solvents can be used to isolate the particular bioactive chemicals effectively from LP extracts (Supplementary Table S2). The results showed that LPSE has a good amount of primary as well as secondary metabolites compared to other LP extracts.
In all, there were approximately 273 phytocompounds (50 phytocompounds were extracted) identified through a preliminary phytochemical screening in distinct parts of LP that involved fatty acids, peptides, sterols, tannins, terpenes, fatty acid esters, phenolics, cardiac glycosides, alkaloids, flavonoids, pregnane glycosides, sugars, amino acids, simple amines, and hydrocarbons. Out of the total recorded LP phytocompounds, 41, or the majority of them, were hydrocarbons (alkanes, alkenes, aromatic hydrocarbons, alcohols, and ketones) [41,42,43,44,45]. Studies have been carried out on the callus of LP that showed the highest concentration of soluble carbohydrates. In contrast, the stems and leaves of LP had the highest concentrations of starch, protein, and phenolic compounds, respectively [46]. A further investigation carried out in the UAE and Egypt found that the 95% ethanol extract of the aerial part of LP included anthraquinone, terpenes, sterols, saponins, tannins, and flavonoids [47,48].

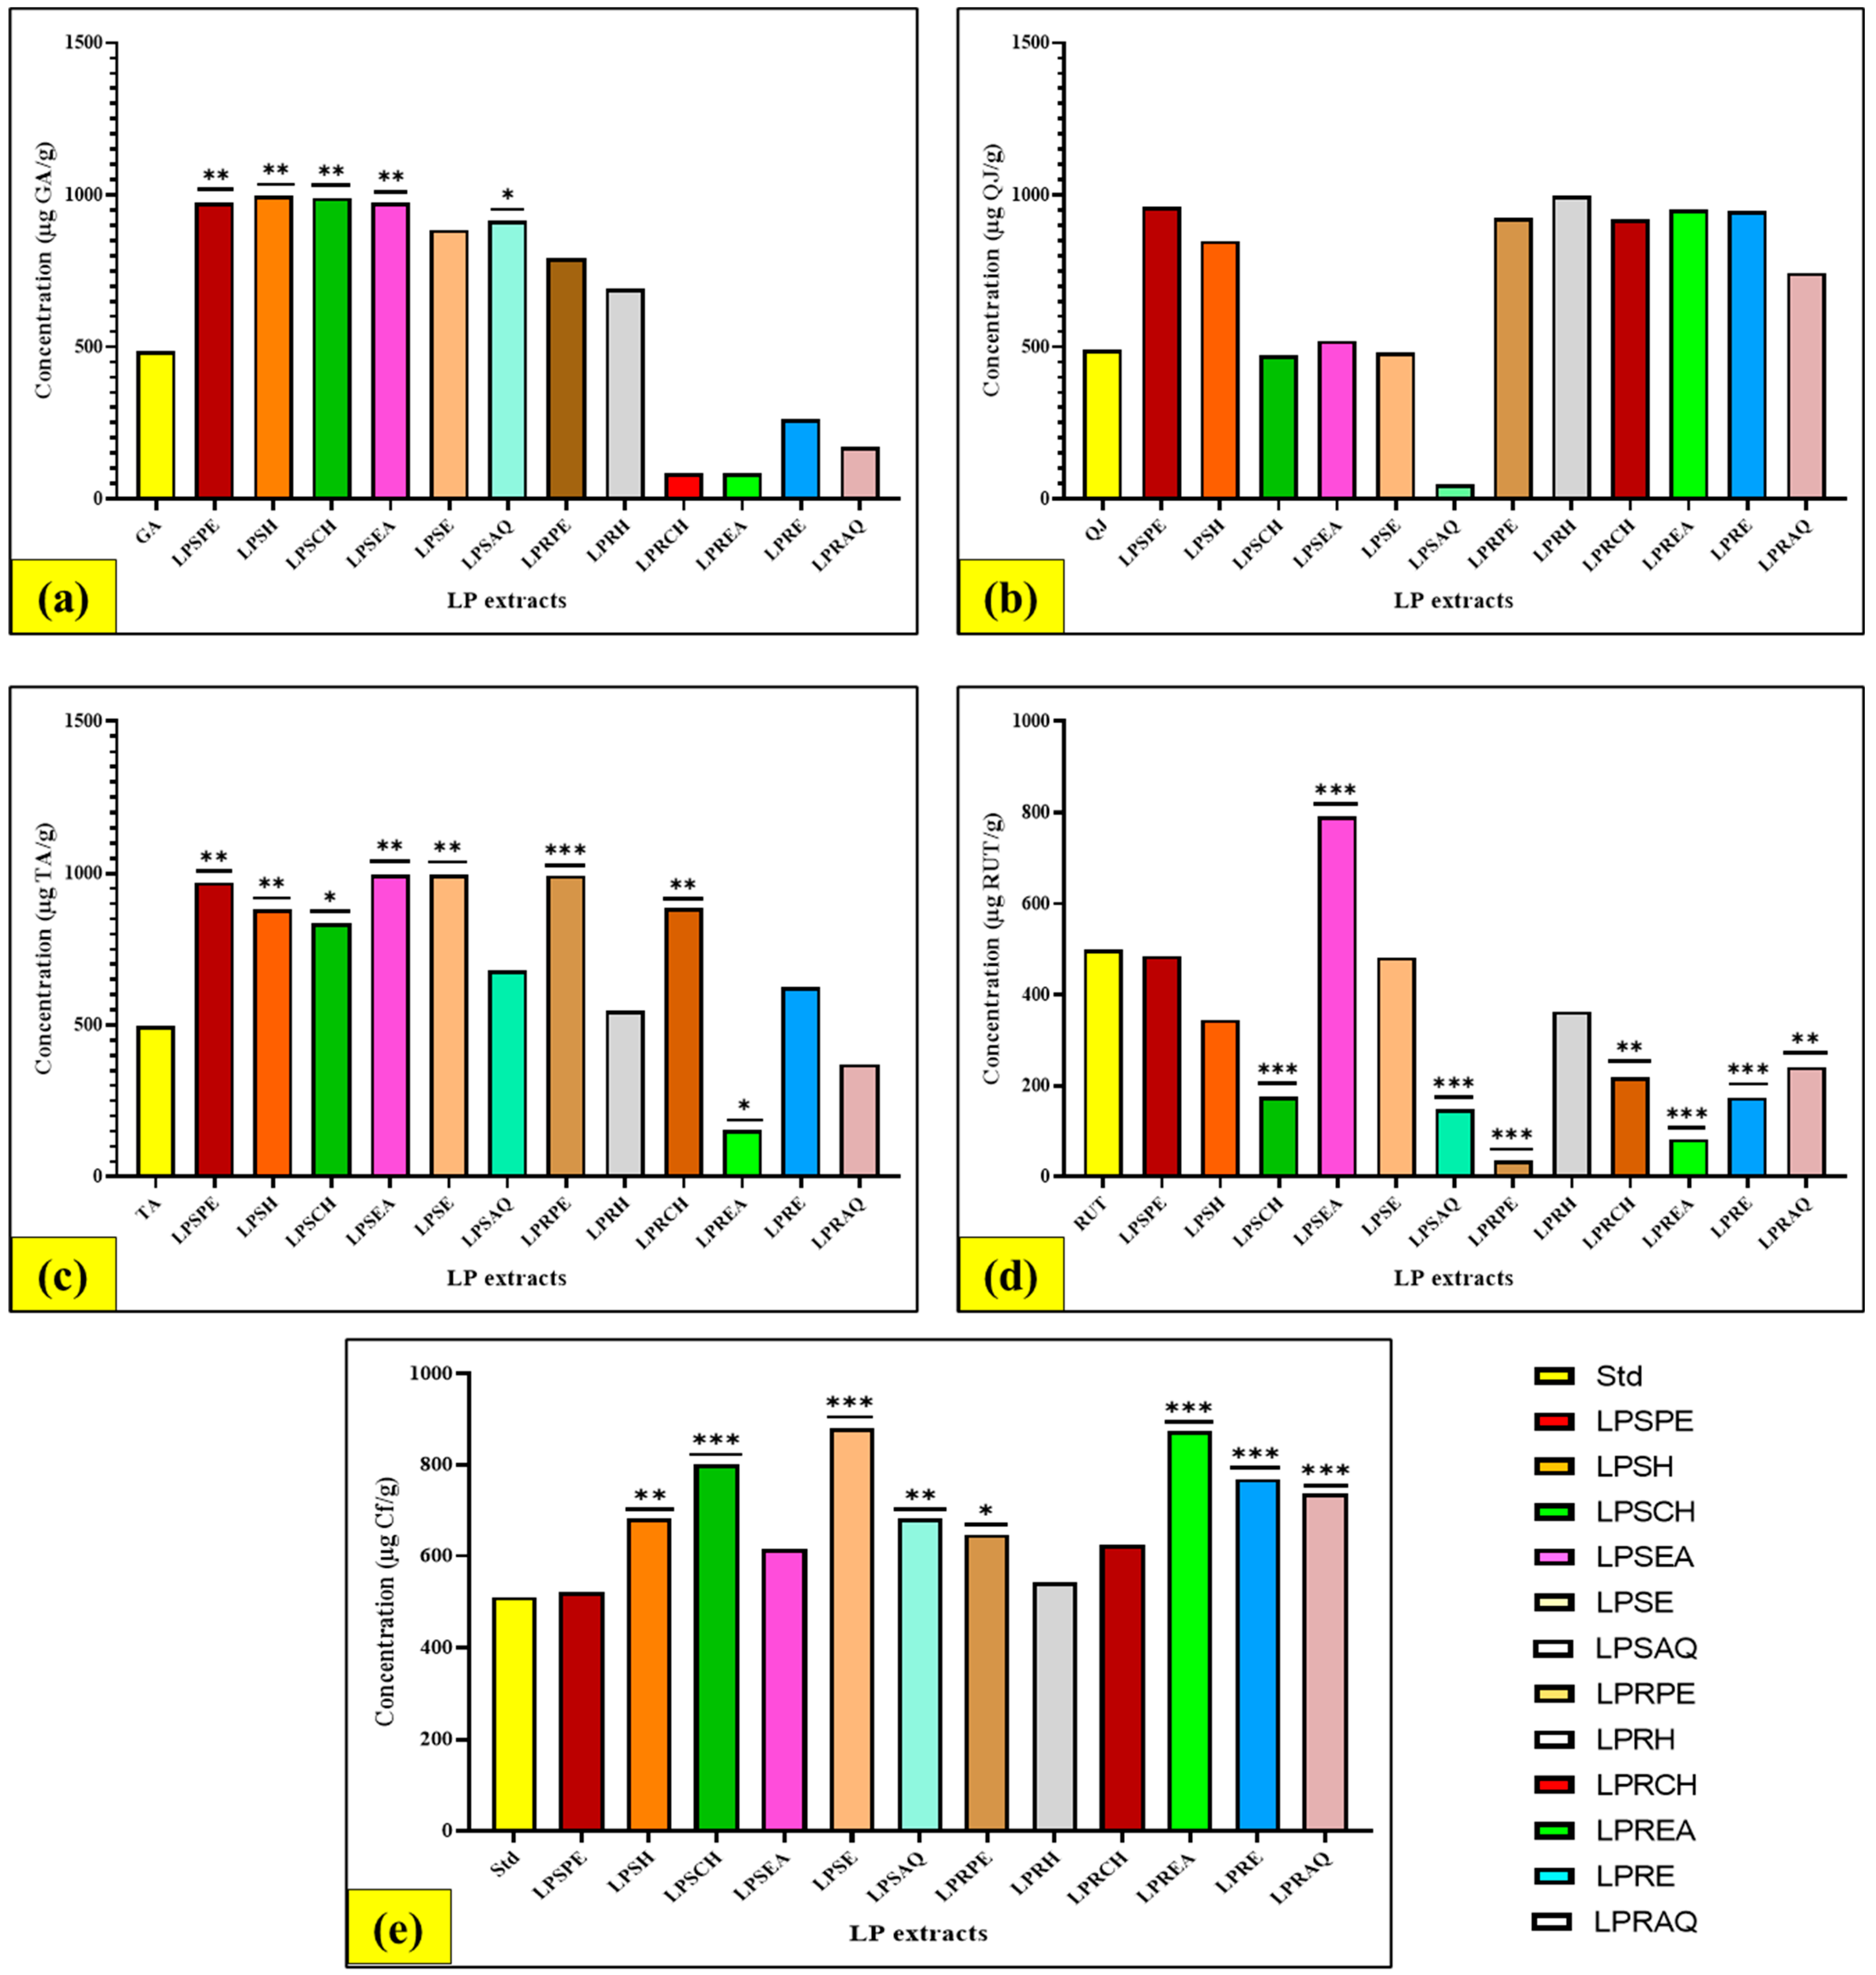
3.4. Quantitative Evaluation of Phytochemical Compounds in Various LP Extracts

3.4.1. Evaluation of Total Phenolic (TPC) Content

The TPC was estimated in all stem and root extracts by using the standard curve’s regression equation (y = 0.0014x + 0.0086, R2 = 0.9946). The TPC was estimated in all extracts of stem and root by using the regression equation of the standard curve (y = 0.0014x + 0.0086, R2 = 0.9946). There was a remarkable variation in TPC present in both stem and root parts of LP, ranging from 83.62 to 996.24 µg GA/50 g dried extract. Different fractions of LP (500 µg/mL) contained phenol content in the respective sequence LPSE (L. pyrotechnica stem ethanolic) > LPSH (L. pyrotechnica stem hexane) > LPSPE (L. pyrotechnica stem petroleum ether) > LPSEA (L. pyrotechnica stem ethyl acetate) > LPSAQ (L. pyrotechnica stem aqueous) > LPSCH (L. pyrotechnica stem chloroform) > LPRPE (L. pyrotechnica root pet-ether) > LPRH (L. pyrotechnica root hexane) > GA (gallic acid) > LPRE (L. pyrotechnica root ethanolic) > LPRAQ (L. pyrotechnica root aqueous) > LPREA (L. pyrotechnica root ethyl-acetate) > LPRCH (L. pyrotechnica root chloroform). The maximum level of phenols was shown by the LPSE extract (996.24 ± 66.81 µg GA/50 g dried extract) in LP stem, and the highest phenol level was shown by the LPRPE extract (793.14 ± 2.12 µg GA/50 g dried extract) in the LP root (Figure 1a).
In one study, it was reported that LP shoots have more lipids, total soluble phenols, and sugar contents (140, 5.5, and 0.26 mg/g dry weight), whereas the roots, on the other hand, contained 15 and 4 mg of protein and starch per g dry weight, respectively [49]. In another study, the TPC of the methanol extract of LP, together with its hexane, ethyl acetate, and aqueous fractions, was investigated using the Folin–Ciocalteu assay. The hexane fraction exhibited the largest level, measuring 25.79 ± 0.11 mg GA/g dry material, whereas the ethanol extract of the aerial parts of LP showed the highest phenol level (158.3 ± 6.25 mg GA/extract) in Egypt [50]. In India, Purohit [45] found that the ethanol extract of the whole LP plant contained 49.47 mg GA/g DW of phenols. Furthermore, the total polyphenolic content of the ethanol crude extract, ethyl acetate, n-butanol, and aqueous fractions of the aerial parts of LP were investigated using previously stated methods. The results revealed that the ethyl acetate fraction displayed a higher phenolic content (252.27 ± 2.84 mg GA/g of dry extract) than other fractions [51]. Moreover, the TPC of the hexane fraction of the aerial parts of LP was studied in other research, and it was measured to be 10.53 mg GA/g of dry extract [52]. An additional study undertaken in Pakistan showed that the TPC was found to be 2.11 ± 0.86 mg GA/g in the 80% methanol extract of the LP leaves [53]. Interestingly, the 70% ethanol extract of the LP green fruits was examined in Egypt for TPC, and it was found to be 59.1 mg GA/g of dry material [54].

3.4.2. Evaluation of Total Saponin (TSC) Content

The TSC was estimated in stem and root extracts by using the standard curve’s regression equation (y = 0.0007x + 0.1103, R2 = 0.9935). The TSC of LP was calculated by analysing the purple colour produced by the reaction that occurs between saponin and acid. In both plant parts, the total saponin content was generally determined to be moderately high (p < 0.05). The LPSPE extract of the stem showed the greatest quantity of saponin content (783.38 + 127.84 g QJ/50 g dried extract), while the LPREA extract of the root (846.24 ± 119.33 µg QJ/50 g dried extract) showed the maximum saponin content (Figure 1b). The sequence of TSC in distinct LP fractions was as follows: LPREA > LPRPE > LPSPE > LPRH > LPRAQ > LPRE > LPSH > LPRCH > LPSEA > QJ > LPSE > LPSAQ > LPSCH. It was evident after the quantitative screening of different parts of LP that the aerial part showed higher saponin content, representing 0.46% compared to other phytocompounds [55].

3.4.3. Evaluation of Total Tannin (TTC) Content

The TTC was estimated in all stem and root extracts by using the standard curve’s regression equation (y = 0.0003x + 0.0552, R2 = 0.9977). The findings of the current quantitative assay showed a broad range of remarkable variations in the TTC within the distinct parts of LP, ranging from 153.78 to 997.11 µg TA/50 g dried extract. The sequence of TTC in distinct LP fractions was as follows: LPSE > LPSEA > LPRPE > LPSPE > LPRCH > LPSH > LPSCH > LPSAQ > LPRE > LPRH > LPRAQ > TA > LPREA.
The LPSE extract of the stem contained maximum tannins (p < 0.05) compared to the other LP extracts. The LPSE extract in the case of the stem (997.11 ± 31.76 µg TA/50 g dried extract) and the LPRPE extract in the case of the root (993.77 ± 68.75 µg TA/50 g dried extract) showed a maximum level of tannin when compared to the other solvents (Figure 1c). It was demonstrated after the quantitative screening of distinct parts of LP that the aerial part showed higher tannin content, representing 154.961 mg of TAE/100 g of extract compared to other phytocompounds [55].

3.4.4. Evaluation of Total Flavonoid (TFC) Content

The TFC was estimated in all stem and root extracts by using the standard curve’s regression equation (y = 0.0025x + 0.0191, R2 = 0.9979). The outcomes represented a remarkable difference in the TFC within the different LP extracts, ranging from 148.23 to 791.43 mg QJ/50 g dried extract. The sequence of TFC in distinct LP fractions was as follows: LPSEA > RUT > LPSPE > LPSE > LPRH > LPSH > LPRAQ > LPRCH > LPRE > LPSAQ > LPSAQ > LPREA > LPRPE. Among the studied LP parts, the maximum flavonoid content was found in the LPSEA extract of the stem with a value of 791.43 ± 3.53 µg RUT/50 g dried extract, followed by the LPRH extract of the root (363.16 ± 3.78 µg RUT/50 g dried extract) (Figure 1d). In one study, the TFC of the methanol extract, together with its hexane, ethyl acetate, and aqueous fractions, was investigated using the AlCl3 assay. The hexane fraction exhibited the largest level, measuring 20.64 ± 0.33 mg RE/g [50]. In contrast, the ethanol extract of the aerial parts of LP showed the highest level of flavonoids (89.0 ± 3.40 mg QE/g extract) in Egypt [56]. In India, Purohit [45] found higher TFC content in the ethanol extract of the whole LP plant, with a value of 34.85 mg QE/g dried extract.

3.4.5. Evaluation of Total Alkaloid (TAC) Content

The TAC was estimated in all stem and root extracts by using the standard curve’s regression equation (y = 0.0035x + 0.0173, R2 = 0.9913). The outcomes of the current assay showed a broad range of remarkable differences in TAC within the distinct parts of LP, ranging from 520.10 to 966.48 µg TA/50 g dried extract. The sequence of TAC in distinct LP fractions was as follows: LPSE > LPREA > LPSCH > LPRE > LPRAQ > LPSAQ > LPSH > LPRPE > LPRCH > LPSEA > LPRHA > LPSPE > Cf. The LPSE extract of the stem (966.48 ± 24.51 µg TA/50 g dried extract) and the LPREA extract of the root (874.96 ± 5.92 µg TA/50 g dried extract) showed a maximum level of alkaloid compared to the other solvent systems (Figure 1e). In a study, the results of quantitative screening of all parts of LP showed that the roots exhibited a greater amount of alkaloids (3.267%) than other parts of LP [57].

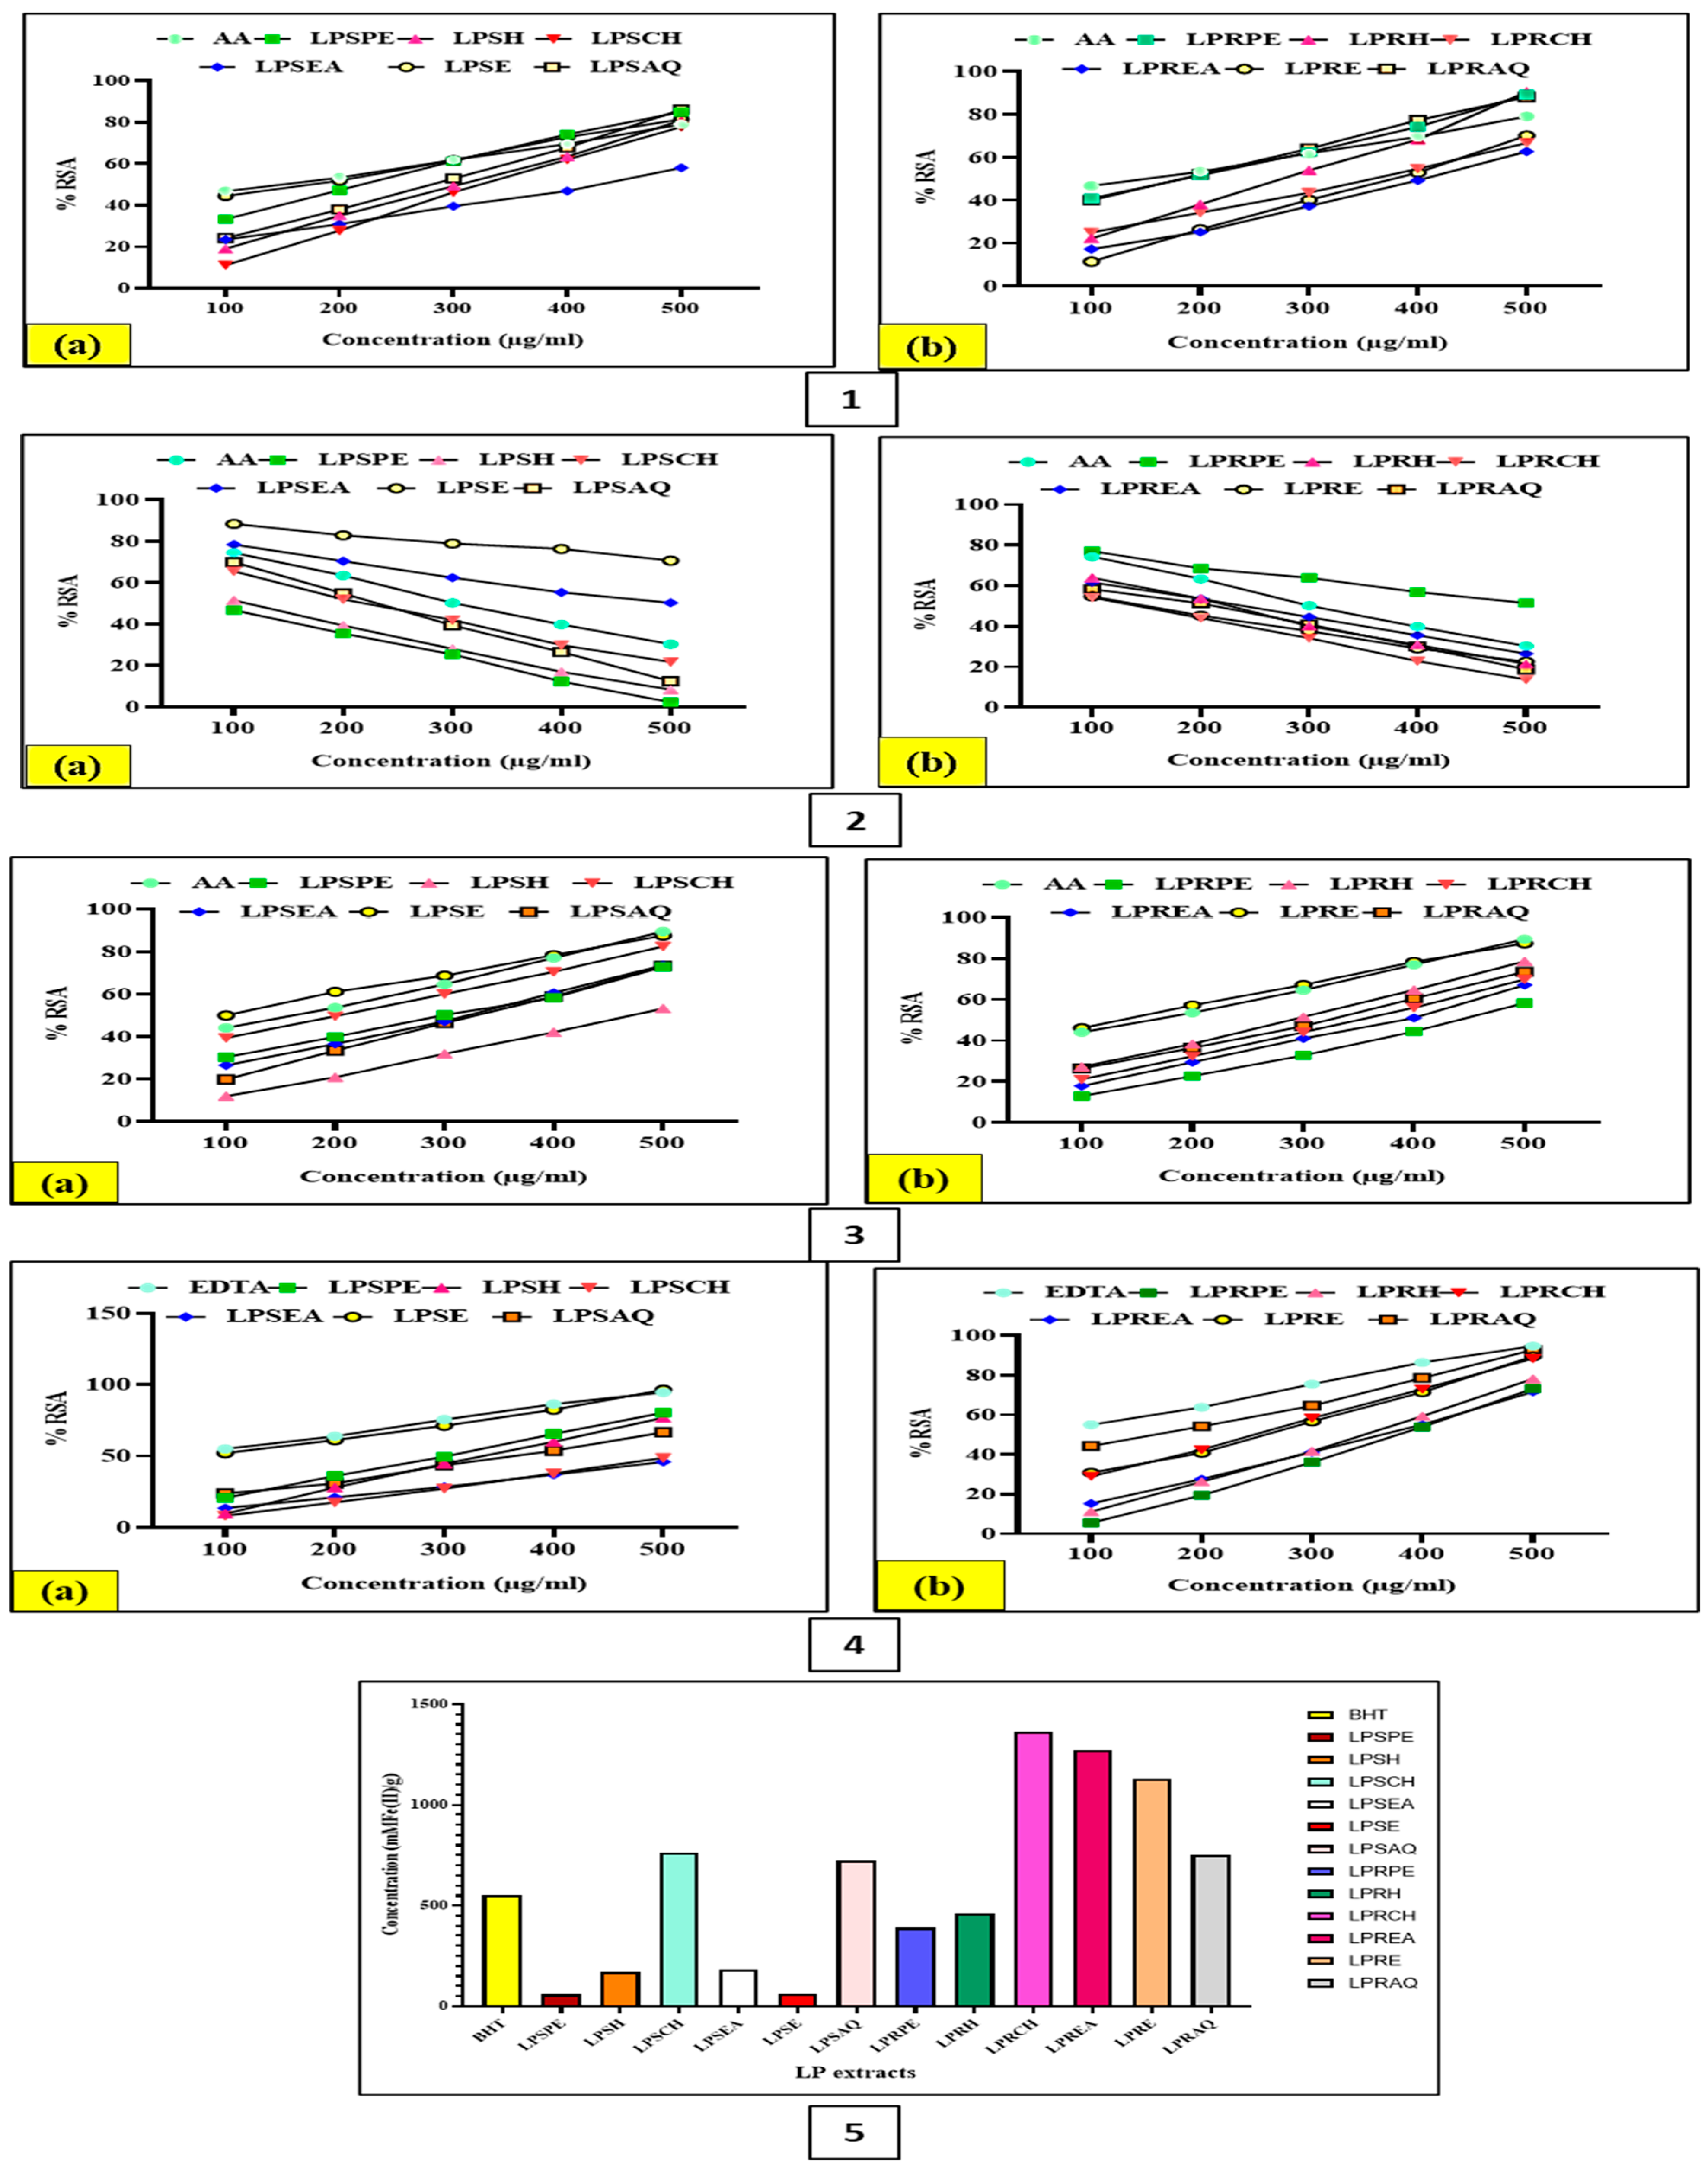
3.5. Assessment of In Vitro Antioxidant Activities of Different LP Extracts

Recent studies on the antioxidant properties of the LP (whole plant), methanol extract and its ethyl acetate, hexane, and aqueous fractions have been utilized for some antioxidant assays, namely, ABTS, DPPH, CUPRAC, FRAP, MC, and total antioxidant (phosphomolybdenum assay). In the DPPH and ABTS scavenging assays, ethyl acetate had the greatest capacity to scavenge free radicals compared to other solvents. Studies have been undertaken on the non-phenolic phytocompounds of LP, showing that these phytocompounds are the most effective chelating agents for metal ions. In addition, multivariate research also suggested that the strong antioxidant capacity of LP was a result of its phenolic and terpenoid composition [50,58].

3.5.1. DPPH Free Radical Scavenging Assay

The antioxidant potential of LP was evaluated by utilizing the DPPH free radical scavenging assay. The absorbance data were recorded against the chosen concentrations (100, 200, 300, 400, 500 µg/mL). The antioxidant potential of the standard and extract is shown by the IC50 values for the standard ascorbic acid (AA) and all of the LP extracts. In this work, the DPPH free radical scavenging activity of LP and the standard AA with 500 µg/mL concentration were observed to be in the following sequence: LPSE > LPRAQ > LPRPE > LPSPE > LPRH > LPSAQ > LPSH > LPSCH > LPRCH > LPRE > LPREA > LPSEA. The highest IC50 values in the case of stem and root extracts were 43.6 ± 95.71 µg/mL and 368.8 ± 47.61 µg/mL, respectively, indicating the lower antioxidant capability of the samples, whereas the lowest IC50 value of the LPSE extract of the stem, i.e., 170.4 ± 19.67 µg/mL, showed maximum antioxidant potency as compared to the standard (AA) (Figure 2 (1)). The LP potency was demonstrated by the results of the DPPH scavenging activity experiment in this investigation. Based on this, the LPSE extracts might have contained substances that may help a free radical to get rid of its odd electron, which makes it reactive.
A study was conducted to determine the antioxidant capacity of the ethanol extract of whole LP plant and its fractions, including petroleum ether, chloroform, ethyl acetate, and methanol fractions, which were evaluated by performing a DPPH free radical scavenging assay in which quercetin and GA were utilized as standards. The ethanol extract and its fractions showed the best antioxidant activity at 100 µg/mL concentration [45]. The methanol extract of the whole LP plant was also investigated by utilizing a DPPH assay for its free radical scavenging activity in vitro. The finding demonstrated that the methanol extract significantly reduced the percentage of free radicals in a dose-dependent manner, i.e., the IC50 value for the DPPH free radical scavenging assay was found to be 152.46 µg/mL due to the activity of the polyphenolic content and other phytocompounds which exist in LP [22].
By employing the DPPH assay, the antioxidant effect of an 80% aqueous-methanol extract of the LP leaves was examined. The IC50 value for the DPPH assay was found to be 991.62 μg/mL [53]. It is interesting to note that, when tested in several assays for its antioxidative impact, the 70% aqueous-ethanol extract of Egyptian green LP fruits showed a good dose-dependent scavenging activity with an IC50 value of 89.3 μg/mL in the DPPH assay [54]. Furthermore, methanol extracts of the roots and aerial parts of LP demonstrated a notable capacity to scavenge free radicals, which increased with concentration when compared to BHA, a common synthetic antioxidant. The investigation assessed this activity using an in vitro test, namely the DPPH assay, which showed that the crude extract of the LP root exhibited stronger activity than that of the aerial portions up to a concentration of 40 µg/mL [57]. The antioxidant effect of the ethanol extract of the Egyptian LP aerial parts was evaluated through DPPH assay using Trolox as a reference, and the results were expressed as Trolox equivalent antioxidant capacity (TEAC). The extract displayed high antioxidant and DPPH radical scavenging activities (1.84 TEAC) [56].

3.5.2. Hydrogen Peroxide (H2O2) Radical Scavenging Activity Analysis

A few enzymes can be immediately inactivated by H2O2, a weak oxidizing agent, typically by the oxidation of crucial thiol (-SH) groups. It can quickly pass across cell membranes. Many of the adverse consequences of H2O2 may originate from its ability to react with Fe2+ and/or Cu2+ ions once it is within the cell, forming hydroxyl radicals. Therefore, it is advantageous for cells biologically to regulate the amount of H2O2 that accumulates. The ability of the plant extract to scavenge H2O2 may be due to its phenolics, which give H2O2 an electron and convert it to water. H2O2 might be scavenged by the extract in a concentration-dependent way [59].
The inhibition data were obtained in relation to the chosen concentrations (100–500 µg/mL). Plots of the standard inhibition curve for the ability of ascorbic acid to scavenge H2O2 radical and for all the plant extracts of LP were constructed. In this work, the H2O2 radical scavenging activity of LP and the standard (AA) with 500 µg/mL concentration was observed to be in the following sequence: LPSE > LPRE > LPRCH > LPRH > LPSPE > LPSEA > LPSAQ > LPRCH > LPREA > LPRAQ > LPRPE > LPSH. Using a regression equation, the IC50 values of ascorbic acid and the percentage (%) inhibition of H2O2 radical scavenging of plant fractions were determined. The highest IC50 values in the case of stem and root extracts were 470.7 ± 56.02 µg/mL and 447.9 ± 43.24 µg/mL, respectively, indicating the lower antioxidant capability of the samples (Figure 2 (3)), whereas the lowest IC50 value of the LPSE extract of stem, i.e., 89.87 + 50.41 µg/mL showed the highest antioxidant activity as compared to the standard (AA).
In a study, the methanol extract of the whole LP plant was investigated by utilizing the H2O2 assay for its free radical scavenging activity in vitro. The finding demonstrated that the methanol extract significantly reduced the percentage of free radicals in a dose-dependent manner, i.e., the IC50 value for the H2O2 free radical scavenging assay was found to be 65.48 µg/mL due to the activity of the polyphenolic content and other phytocompounds that exist in LP [22]. Moreover, when compared to BHA, a well-known synthetic antioxidant, methanol extracts from the roots and aerial sections of LP showed a noteworthy potential to scavenge free radicals that enhanced with concentration. Using an in vitro test called the H2O2 assay, the investigation evaluated this activity and found that, up to a concentration of 40 µg/mL, the crude extract of the LP root exhibited greater activity than that of the aerial sections [57].

3.5.3. Metal Chelation Activity

Here, we checked the chelating capacity of iron in both the stem and root parts of LP. All fractions represented a capacity to chelate the metal ions. The IC50 values of the LP extracts and EDTA (standard) for chelating iron metal with 500 µg/mL concentration were observed to be in the following sequence: LPSE > LPRAQ > LPRE > LPRCH > LPSPE > LPSH > LPRH > LPRPE > LPSAQ > LPREA > LPSEA > LPSH. The findings of the chelating metal iron showed that the LPSE extract of the stem (86.06 ± 42.67 µg/mL) had the highest and appropriate capacity (p < 0.05) to chelate the metal ion, while the LPSCH extract of the stem exhibited the lowest ability, with an IC50 value of 657.1 ± 183.4 µg/mL (Figure 2 (4)). In a recent study, MC activity was examined to study the antioxidant capacity of the methanol extract of the whole LP plant and its ethyl acetate, H, and aqueous fractions by using EDTA as a standard. The sharpest MC effect was found in the hexane fraction (11.57 ± 0.29 mg EDTA/g dry extract) [58].

3.5.4. Nitric Oxide (NO) Scavenging Assay

The NO scavenging assay of the LP test fractions and the standard (AA) with 500 µg/mL concentration was observed to be in the following sequence: LPSE > LPRPE > LPSEA > LPREA > LPRE > LPSCH > LPRH > LPRAQ > LPRCH > LPSAQ > LPSH > LPSPE. The LPSE extract of the stem exhibited the lowest IC50 value (70.9 ± 9.91 µg/mL), followed by other test fractions, indicating strong NO scavenging activity with the lowest concentration to obtain 50% radical scavenging power. In the case of the stem, the IC50 values of LPSPE, LPSH, LPSCH, and LPSAQ extracts were lower than those of the standard (AA) (Figure 2 (2)). In the case of the root, the IC50 values of LPRH, LPRCH, LPREA, LPRE, and LPRAQ extracts were lower when compared to the standard (AA). Therefore, it was indicated that these fractions have greater scavenging power when compared to the AA.
Two categories can be used to classify plant tannins. According to Yoshiki et al. [60], hydrolysed tannins contain remnants of polyol and ellagic tannins that are not entirely degraded. According to Bernard et al. [61], plant tannins are found in a wide range of plant species, particularly in grains, shrubs, herbages, and medicinal resources. Many applications in food production and medical areas make use of tannins’ antioxidant qualities. To determine the pertinent antioxidant activity of tannins, numerous investigations have been carried out in recent years. Tannins have garnered a lot of interest because of their antioxidant properties, which can prevent cancer, heart disease, and osteoporosis. Excellent antibacterial and antioxidant properties of tannins can help to alleviate the symptoms of urinary tract infections. According to reports, the amount of hydroxyl groups in tannins and the hydrogen peroxide production are significant markers for assessing the antibacterial qualities, which are positively associated with antioxidant qualities. Certain studies have suggested that tannins can shield against viruses like norovirus, human immunodeficiency virus (HIV), and bovine adeno-associated virus (BAAV) [62]. A study conducted by Masood et al. [63] determined that the TTC of LP was 0.54 ± 0.01 mg TAE/g dry weight of the extract.

3.5.5. Ferric Reducing Antioxidant Power (FRAP) Assay

The FRAP assay was estimated by the ferric reducing capacity of the standard (BHT) by using the regression equation of the standard curve (y = −0.0849x + 97.32, R2 = 0.9915) and the plant extracts. In this study, the reducing capacity of LP and the standard (BHT) with 500 µg/mL concentration was observed to be in the following sequence: LPRCH > LPREA > LPRE > LPSCH > LPSAQ > LPRAQ > LPRH > LPSH > LPSE > LPRPE > LPSEA > LPSE. The LPSCH extract of the stem (59.36 ± 0.02 μMFe(II)/g) and the root (69.75 ± 0.01 μMFe(II)/g) revealed enhanced antioxidant potential compared to the other extract fractions. The FRAP activity of the LP extracts was lower compared to the BHT, but was significant (p < 0.05). As shown in Figure 2 (5), the LPSEA extract of the stem and the LPRE extract of the root showed lower ferric ion-reducing power ability.
Using EDTA as a reference, a FRAP assay was recently performed in a study to investigate the antioxidant potential of the methanol extract of the entire LP plant, as well as its ethyl acetate, hexane, and aqueous fractions. The extract was used at dosages of 0.5–5 mg/mL. In the FRAP test, it exhibited the maximum activity (117.42 ± 1.28 mg TE/g extract) [58]. Employing the FRAP assay, the antioxidant capacity of the 80% aqueous-methanol extract of the LP leaves was evaluated. The results revealed IC50 1.69 mMol Fe+2/g for the FRAP assay [53]. Furthermore, using the FRAP method, the antioxidant activity of the hexane fraction of the aerial parts was examined. The results were compared to those of the ethanol extract and its ethyl acetate, butanol, and aqueous fractions, which had previously been documented. According to the FRAP assay results, the hexane fraction had the lowest antioxidant capacity (0.049 µmol/mg) [52]. Moreover, the FRAP assay was also used to determine the antioxidant impact of the ethanol extract of LP aerial parts, as well as its ethyl acetate, butanol, and aqueous fractions. The IC50 value of the ethyl acetate fraction displayed the best antioxidant activity (1.2 mmol ascorbic acid equivalent/g in the FRAP) [51].

3.6. Correlation of Phytochemical Contents with Their In Vitro Antioxidant Activities

The coefficients of determination (R2) between antioxidant potential and phytochemical components were evaluated in both the stem and root parts of LP (Figure 3). In the case of the stem, the outcomes showed a strong and significant correlation between TTC and FRAP (R2 = −0.849*) (p < 0.05), but a weak one for TTC and DPPH (R2 = −0.423), TTC and H2O2 (R2 = −0.241), TFC and MC (R2 = 0.158), and TTC and NO (R2 = 0.431). Phenol content showed a strong correlation with NO, a moderate correlation with metal chelation, and a weak correlation with DPPH, H2O2, and FRAP; the saponin content exhibited a strong correlation with FRAP and DPPH, while a moderate correlation with H2O2, MC, and NO; and the alkaloid content exhibited a strong correlation with NO and FRAP, but a moderate correlation with MC and a weak correlation with DPPH and H2O2 in the case of the LP stem. A strong and significant correlation was found between TFC and FRAP for the stem (R2 = −0.746*) (p < 0.05), while a moderate one was found for TTC and NO (R2 = 0.336) and TTC and NO (R2 = 0.38), and a weak one for TFC and DPPH (R2 = 0.079) (p < 0.05) and TFC and H2O2 (R2 = −0.503).
In the case of the root, there was a significant and strong correlation between the antioxidant activity determined by TPC with FRAP (R2 = −0.898*) (p < 0.05), MC (R2 = −0.729) and NO (R2 = 0.694), while a weak one with DPPH (R2 = −0.192) and H2O2 (R2 = 0.128). A moderate as well as non-significant correlation resulted between TSC with H2O2 (R2 = 0.339) and NO (R2 = −0.394), while a weak correlation with DPPH (R2 = 0.111), MC (R2 = 0.220) and FRAP (R2 = 0.294) was found. A strong correlation was shown by TTC with DPPH (R2 = 0.396), MC (R2 = −0.327) and NO (R2 = 0.453), while a moderate one was shown with FRAP (R2 = −0.259), and a weak one with H2O2 (R2 = 0.073). In the case of TFC, a strong correlation was observed with DPPH (R2 = 0.482), H2O2 (R2 = −0.343) and NO (R2 = −0.623), a moderate correlation with MC (R2 = −0.255), and a weak correlation with FRAP (R2 = −0.147). A strong correlation was found between TAC and FRAP (R2 = 0.560), TAC and H2O2 (R2 = −0.341), and TAC and MC (R2 = 0.330), a moderate correlation was observed for TAC and NO (R2 = −0.250), and a weak correlation was shown for TAC and DPPH (R2 = −0.184).

3.7. Elemental Analysis

The elemental analysis was carried out by using the comparator method of the AAS technique in mg/L dry weight of the plant materials. The findings indicated that the LP root section has the highest content of Mg (4.0665 mg/L), compared to Al (0.999 mg/L), Mn (0.3694 mg/L), and Zn (0.1295 mg/L), whereas the stem has the highest concentration of Al (4.7917 mg/L) compared to Mg (4.3314 mg/L), Mn (0.7600 mg/L), and Zn (0.2649 mg/L). A study reported the mineral content analysis, showing the mineral content in the fruits; i.e., the fruits contained 156 mg of calcium, 317 mg of phosphorus, and 3.18 mg of iron and the pulp had 68 calories per 100 g [64].

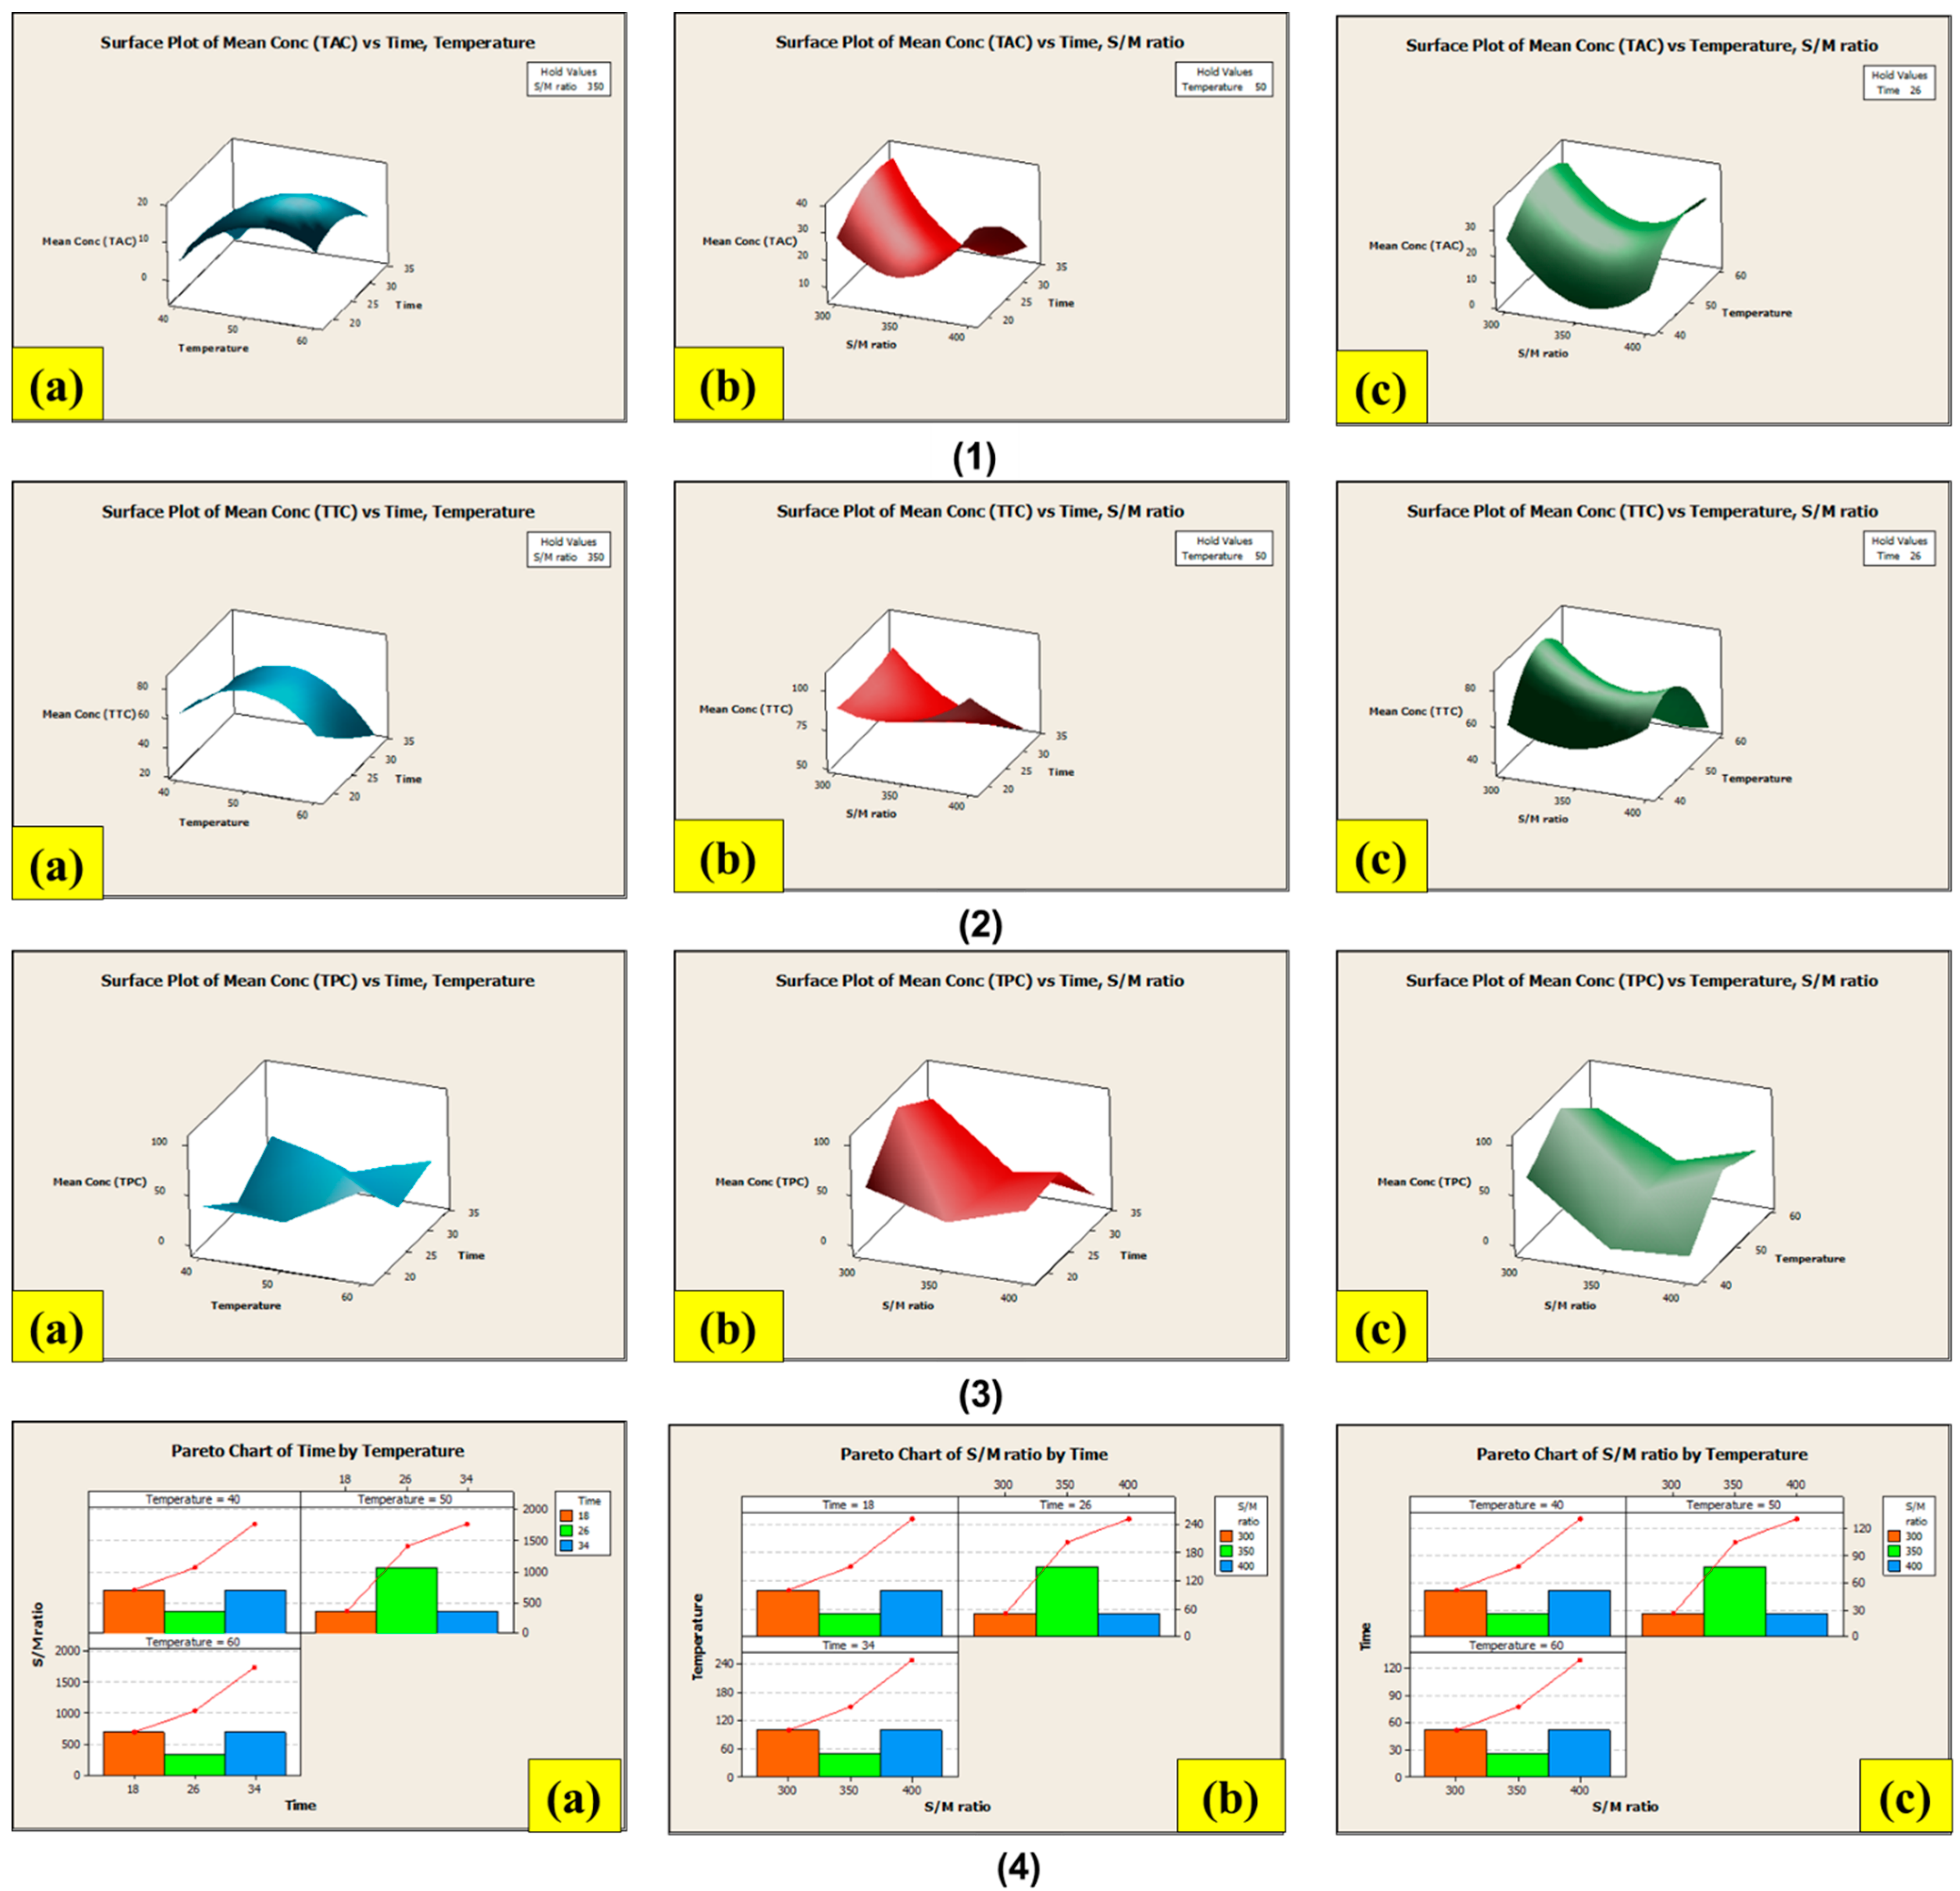
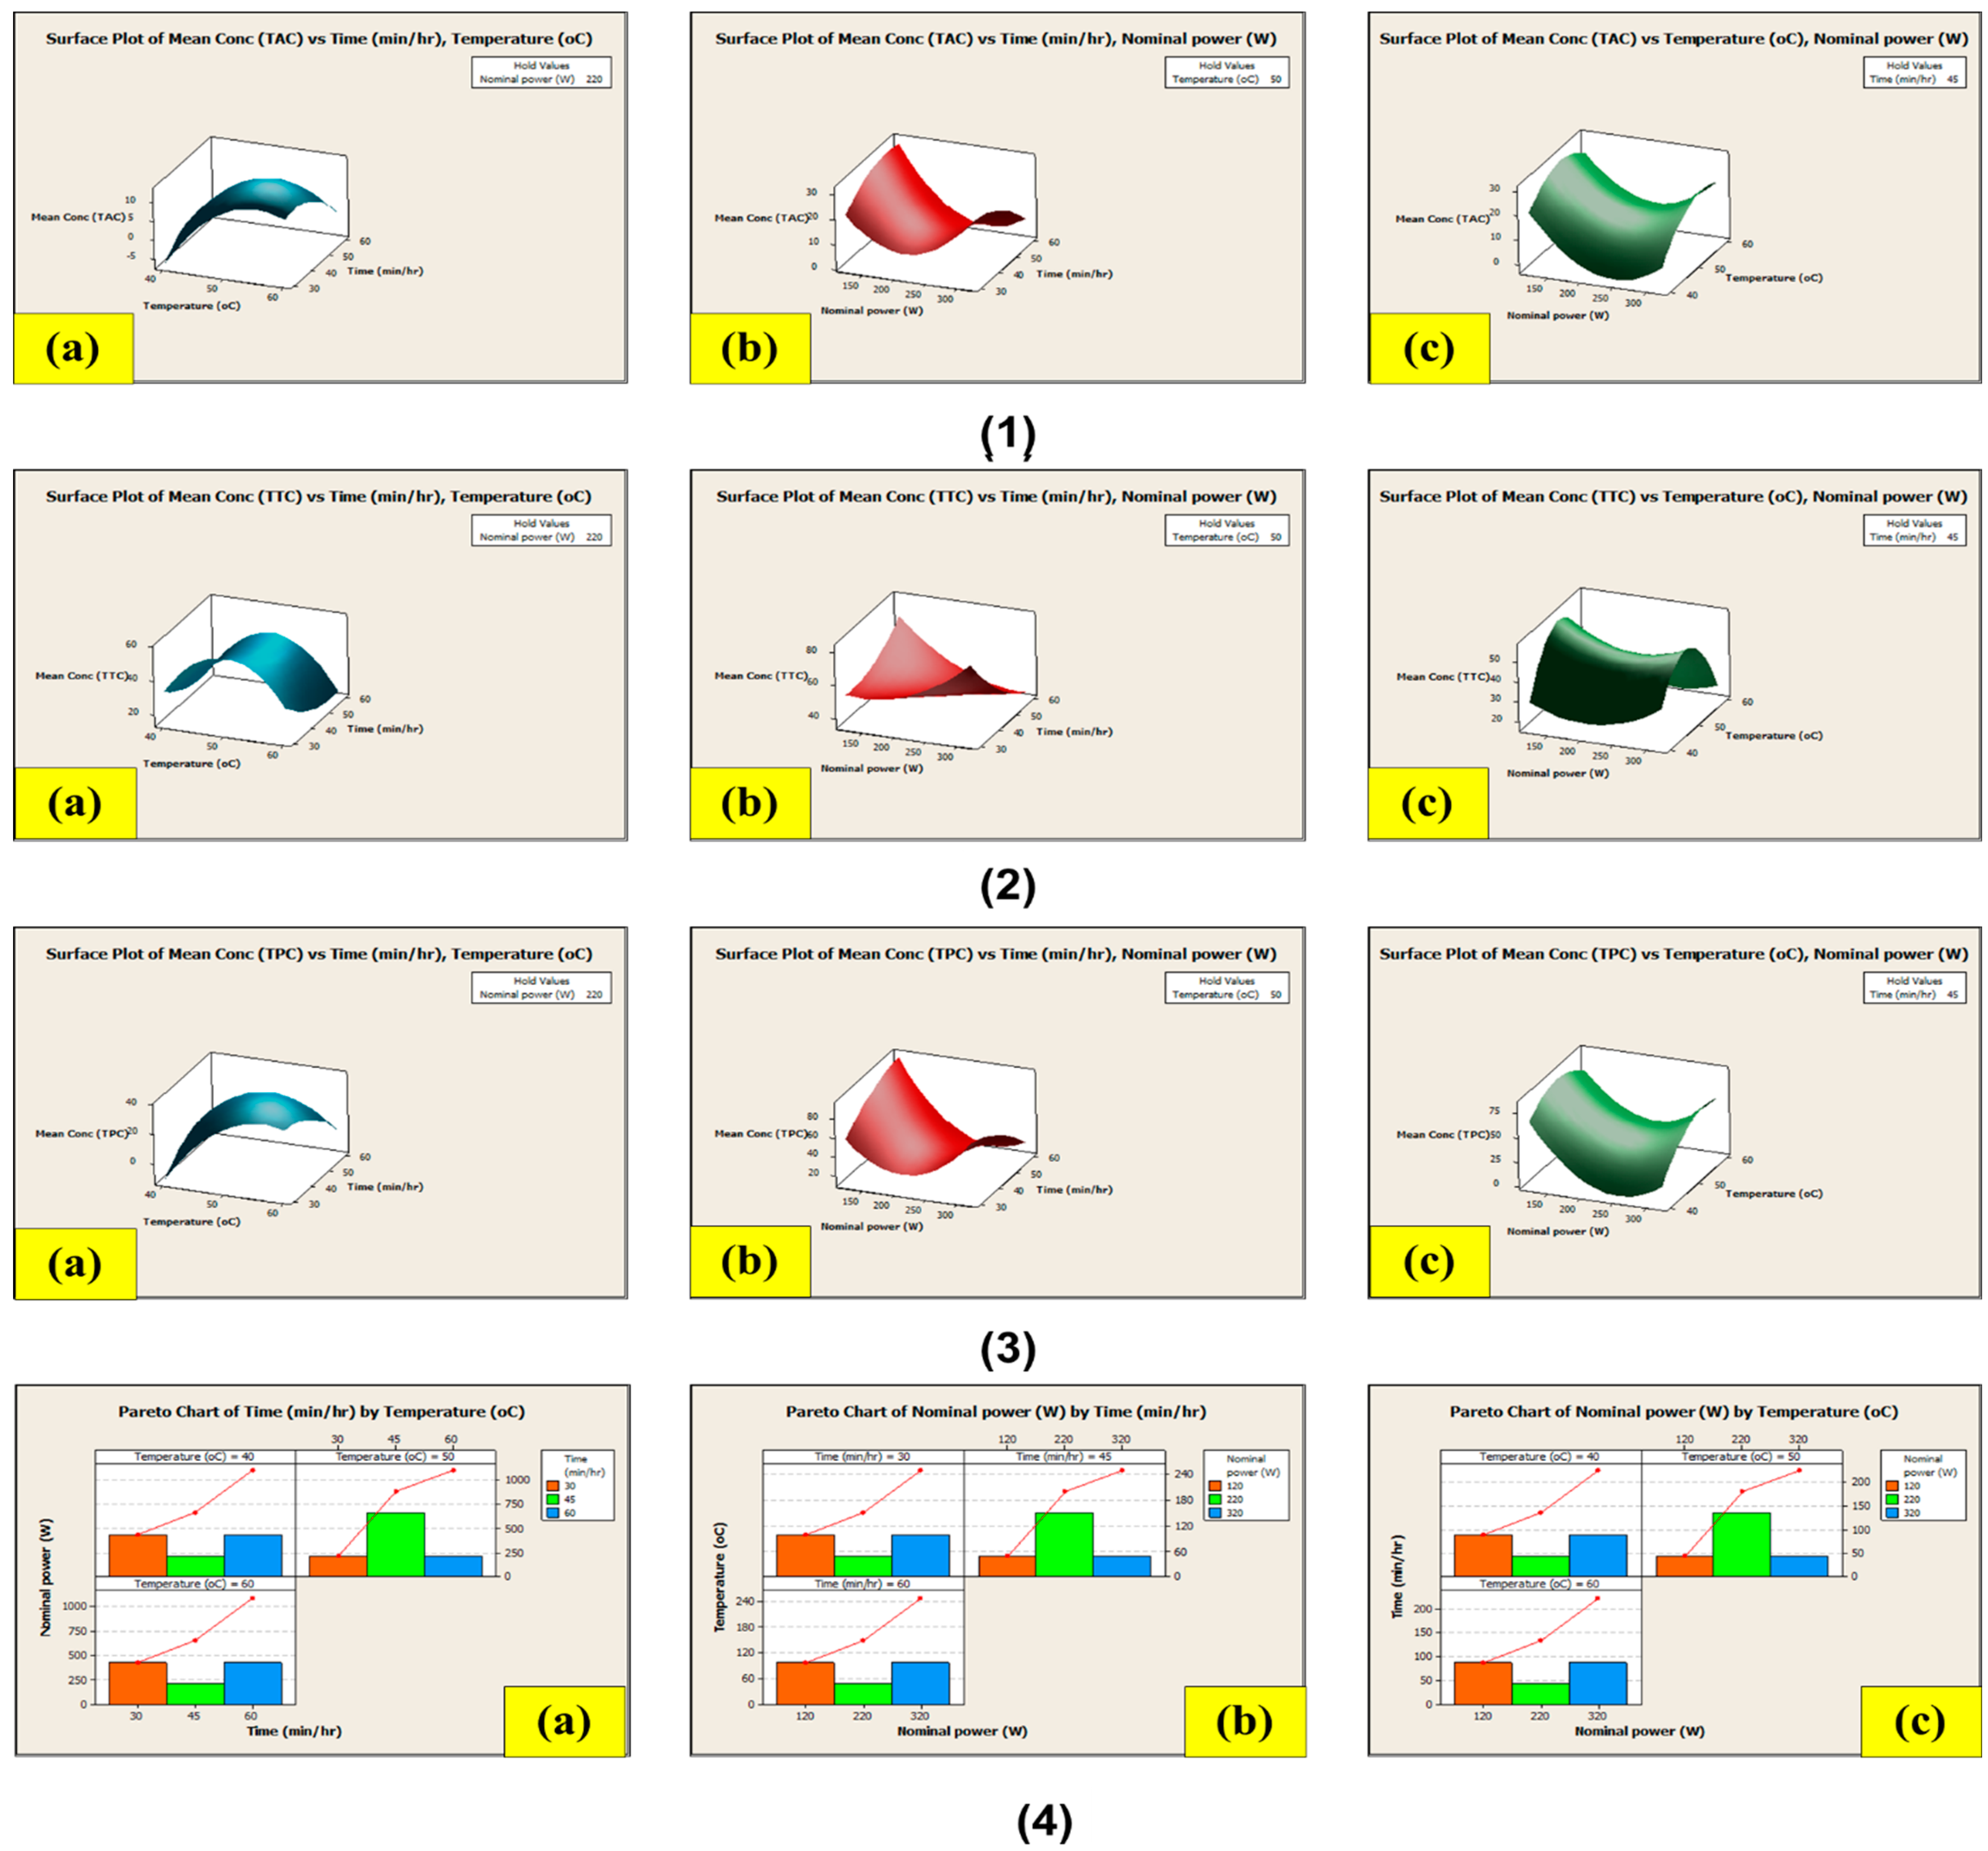
3.8. Extraction Using Conventional Soxhlet Extraction (CSE) and Non-Conventional Ultrasound-Assisted Extraction (NCUSAE) Methods

3.8.1. Extraction Using the Conventional Soxhlet Extraction (CSE) Method

Based on the outcomes of the quantitative estimation of secondary plant metabolites in the stem and root of LP, it was concluded that the total TPC, TTC, and TAC contents of LPSE extract gave better results than the other quantitative assays. Due to this, the optimization of the extraction methodology of these metabolites could be possible by comparing CSE with NCUSAE using LPSE extract. In general, distinct factors like solvent-to-substrate ratio, extraction time, and temperature are involved in the CSE of materials to facilitate the breakdown of cellular tissues and promote mobility (Table 1). The highest amounts of TPC and TTC content were extracted at a 300/10 solvent/material (S/M) ratio, whereas the TAC was extracted best at a 400/10 S/M ratio. From this, it can be concluded that differences in the solvent-to-substrate ratio had a remarkable impact on the extractive yields of bioactive compounds from the LP stem.
Consequently, in association with the findings observed both for enhancing the extractive yields as well as solvent usage, the solvent-to-substrate ratio selected for the CSE method was a 300/10 S/M ratio for TPC and TTC and a 400/10 S/M ratio for TAC. The maximum experimental value achieved for TPC and TTC was found to be 102.71 ± 0.009 µg GA/50 g and 95 ± 0.005 µg TA/50 g, after 26 h at 50 °C. The highest experimental value achieved for TAC was found to be 38.48 ± 0.004 µg Cf/50 g, after 18 h at 60 °C. The highest experimental value obtained for total yield was found to be 21.92%, after 18 h at 40 °C with a 400/10 S/M ratio. As a result, CSE focused on estimating the impact of the differences in time and temperature on the extraction of the metabolites discussed earlier. The model equations for the extraction of these chemicals (Equations (1)–(3)) are provided below, and the associated modelled response surface is shown in Figure 4:
TPC (mg GA/g) = 1392.67 + (−12.60) × S/M + 19.15 × T + 32.42 × t + 0.02 × S/M2 + (−0.21 × T)2 + (−0.21 × t)2 + 0.02 × S/M × T + (−0.05) × S/M × t + (−0.12) × T × t
TTC (mg TA/g) = −586.179 + (−1.565) × S/M + 32.172 × T + 13.813 × t + 0.005 × S/M2 + (−0.236 × T)2 + (−0.033 × t)2 + (−0.020) × S/M × T + (−0.038) × S/M × t + (−0.080) × T × t
TAC (mg Cf/g) = 413.469 + (−4.027) × S/M + 7.149 × T + 10.639 × t + 0.006 × S/M2 + (−0.079 × T)2 + (−0.078 × t)2 + 0.003 × S/M × T + (−0.022) × S/M × t + 0.009 × T × t
where S/M is solvent to material ratio, t is time (h), and T is temperature (°C).

3.8.2. Extraction Using the Non-Conventional Ultrasound-Assisted Extraction (NCUSAE) Method

The second extraction method relied on solid–liquid extraction incorporating ultrasounds, combining the effects of time, temperature, power, and frequency to create a cavitation phenomenon in the biomass and facilitate the extraction of biologically active substances. This method utilized the same S/M ratio (300/10) as all three previously mentioned factors. In this case, the highest extraction values for TPC and TAC from the LP stem were 90.98 ± 0.007 µg GA/50 g and 31.81 ± 0.005 µg Cf/50 g, with the maximum value being achieved after 30 min at 60 °C and 320 W, whereas the highest extraction values for TTC from the LP stem were 60.11 ± 0.003 µg TA/50 g, with the maximum value being achieved after 30 min at 40 °C and 320 W. With a nominal power of 320 W, the highest concentration is anticipated to occur between 30 min and 40 to 60 °C, with time and temperature having an indirect inversely proportional relationship to extraction. The maximal experimental value for total yield was found to be 22.81% after 30 min at 40 °C and 320 W. Hence, the time, water temperature, and nominal power all had an impact on the extraction. The model equation that represents the extraction of these metabolites using NCUSAE is shown in Equations (4)–(6), and the related modelled response surface is shown in Figure 5:
TAC (mg Cf/g) = −222.631 + (−0.591) × W + 8.501 × T + 3.694 × t + 0.001 × W2 + (−0.076 × T)2 + (−0.019 × t)2 + 0.002 × W × T + (−0.004) × W × t + (−0.021) × T × t
TTC (mg TA/g) = −633.602 + 0.286 × W + 26.414 × T + 0.172 × t + 0.001 × W2 + (−0.249 × T)2 + (0.026 × t)2 + (−0.004) × W × T + (−0.011) × W × t + (−0.013) × T × t
TPC (mg GA/g) = −529.345 + (−1.550) × W + 19.928 × T + 10.227 × t + 0.004 × W2 + (−0.174 × T)2 + (−0.036 × t)2 + 0.010 × W × T + (−0.014) × W × t + (−0.081) × T × t
where W is nominal power, t is time (min), and T is temperature (°C).

3.9. Analytical Methods
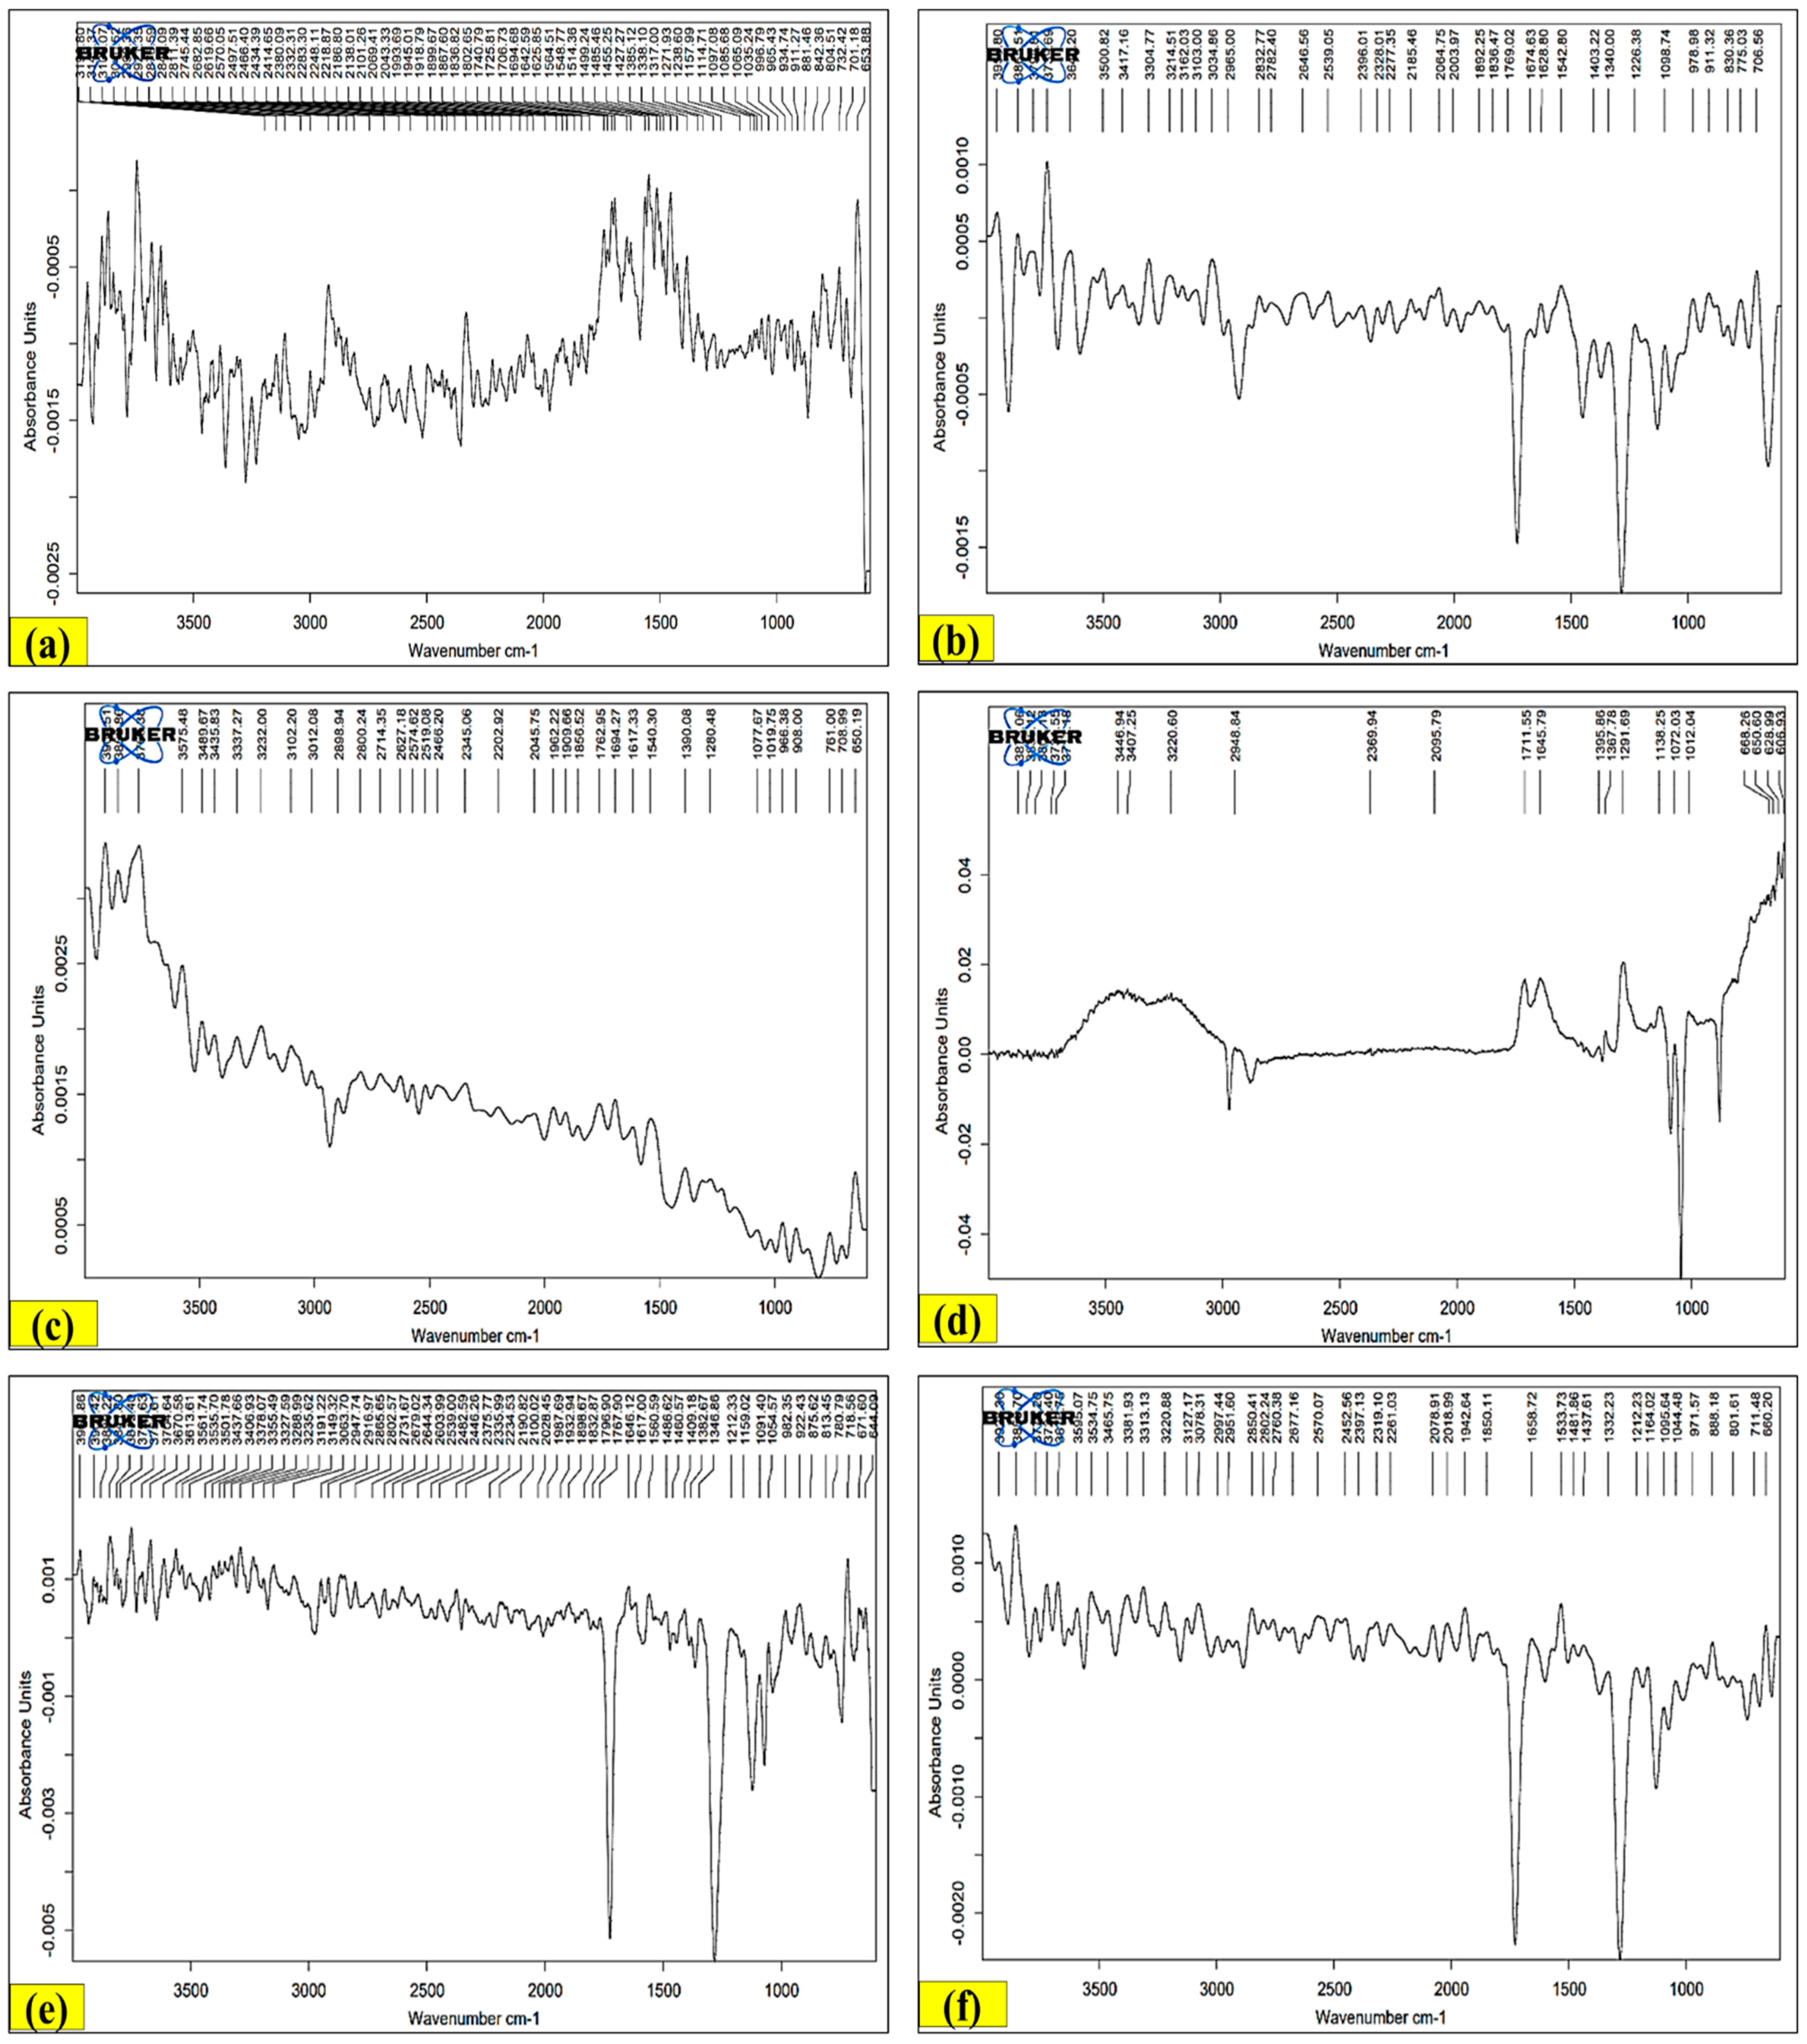
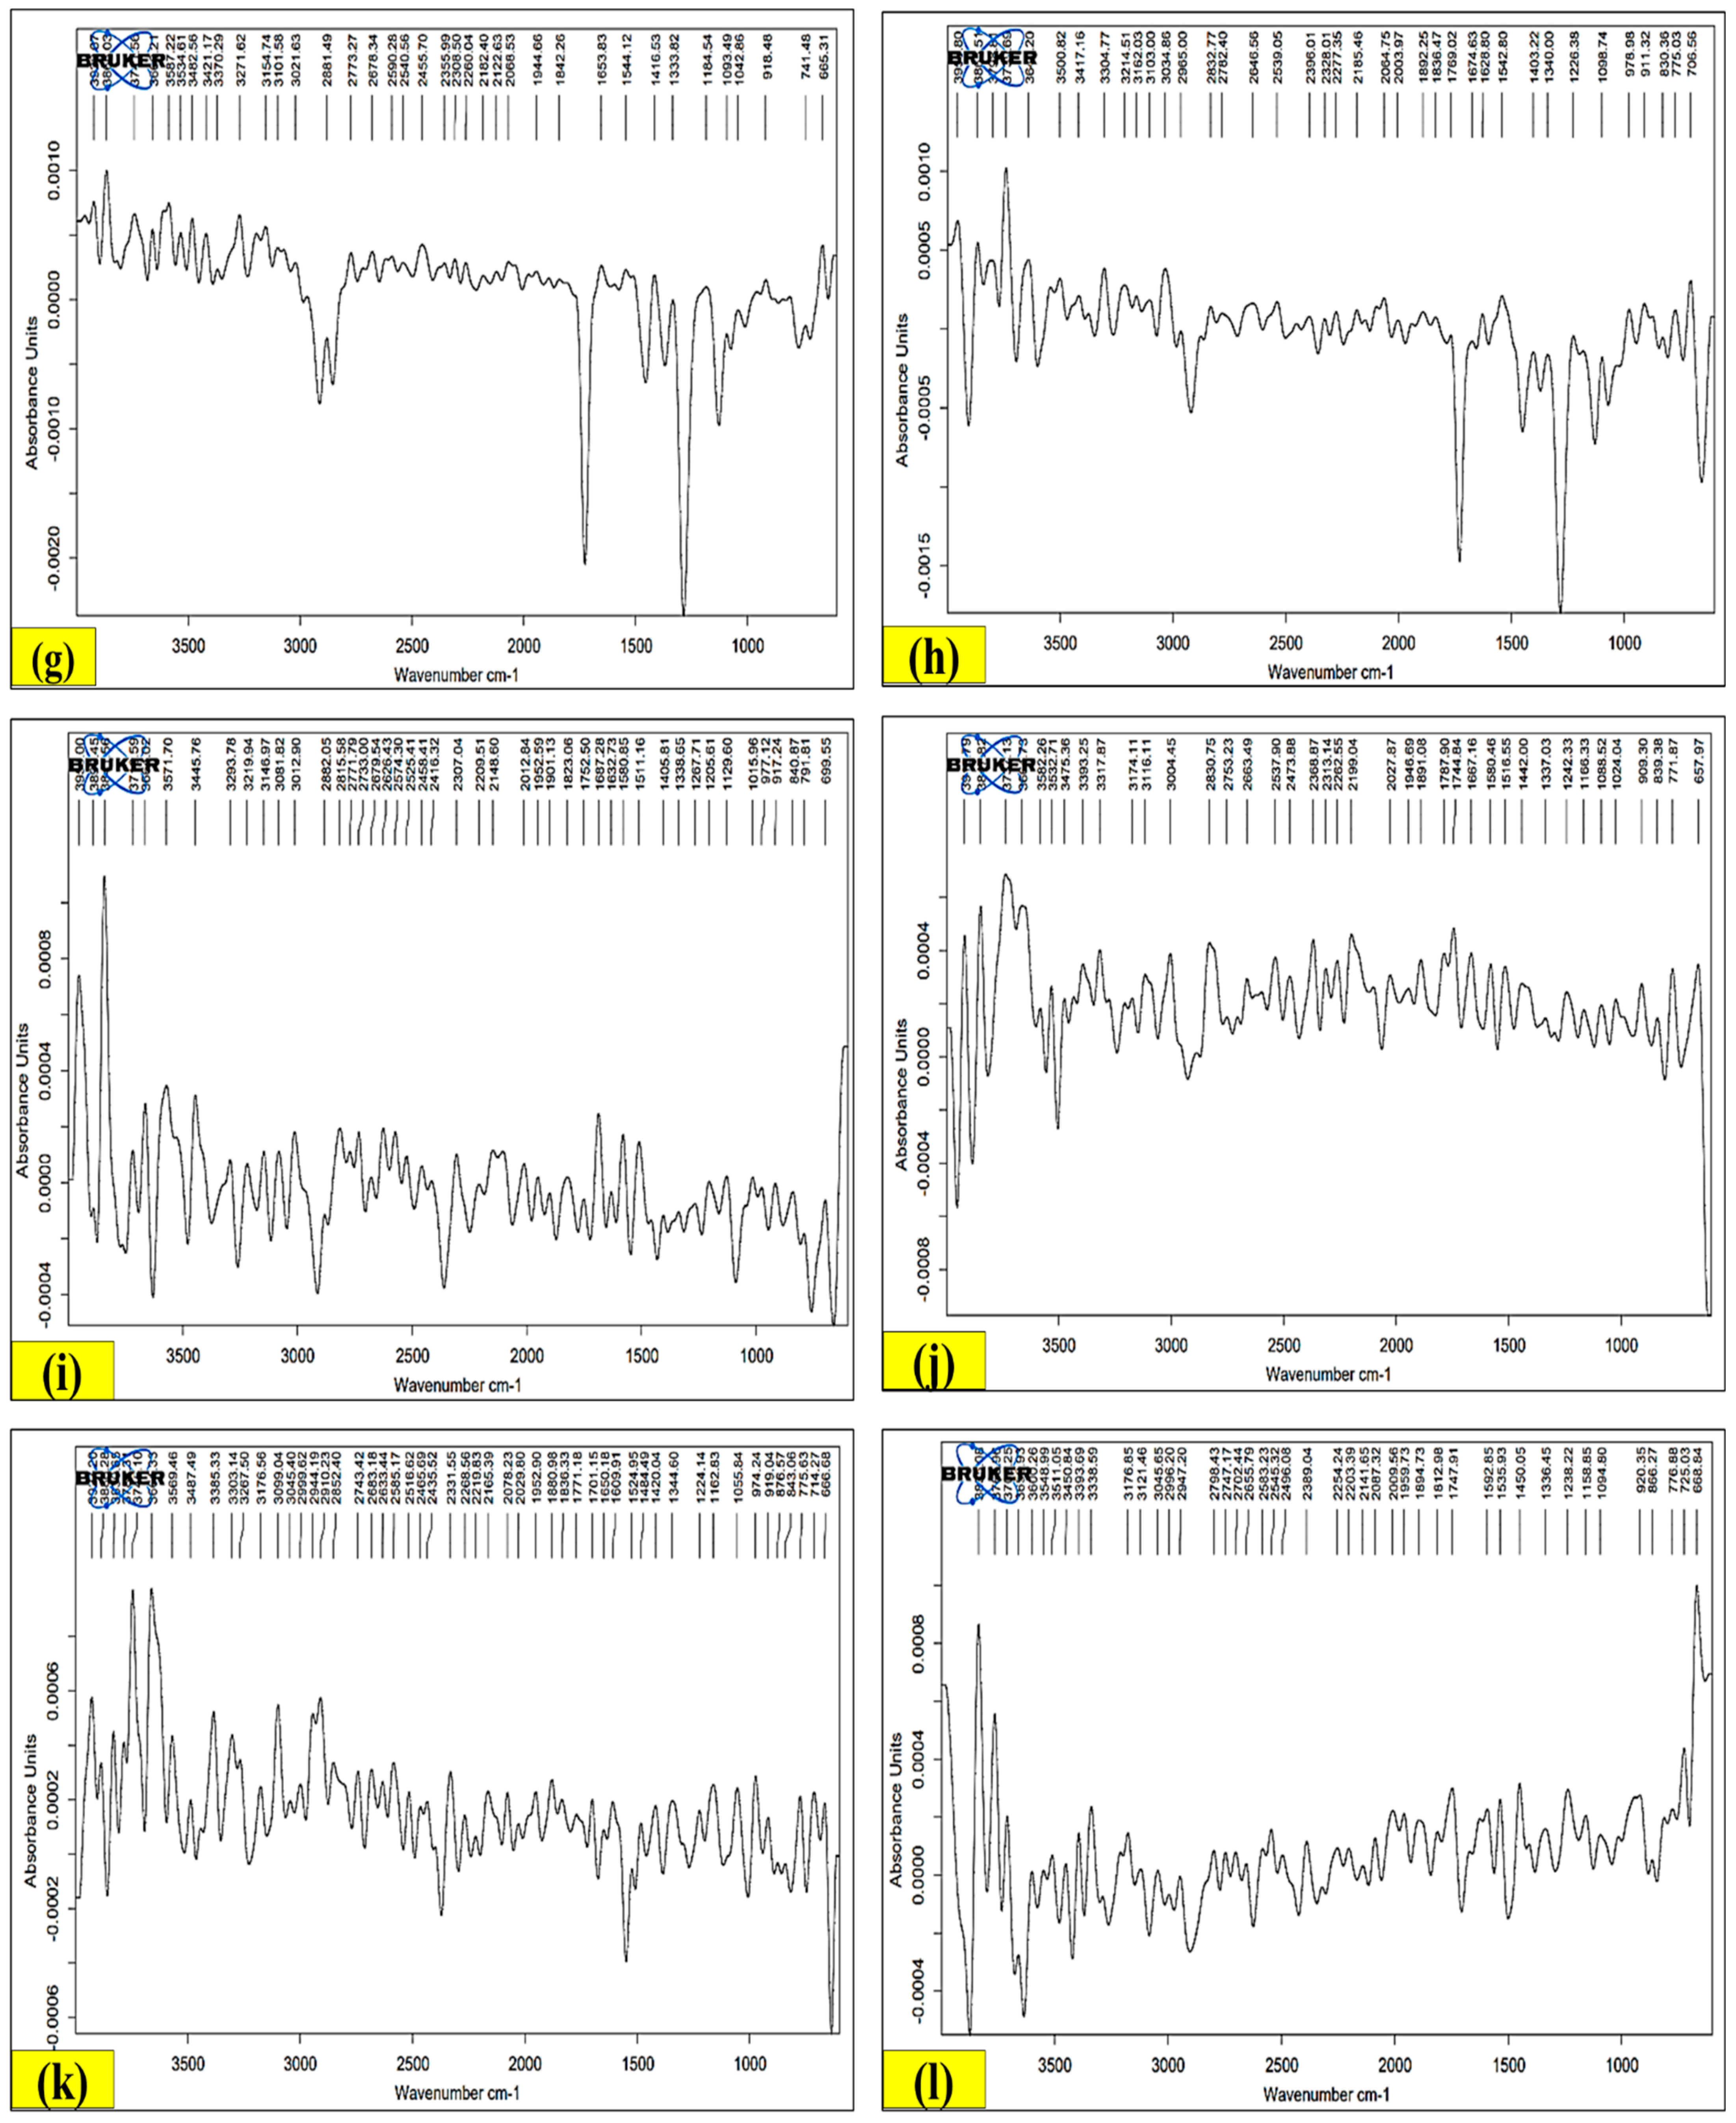
3.9.1. FT-IR

The FTIR profile showed different characteristic peaks that were specifically ascribed to the presence of distinct functional groups or phytochemical compounds i.e., a band which occurred at 1625.85 cm−1 might be attributed to the presence of dienes (C=C); a band which occurred at 1035.34 cm−1 could be attributed to the presence of fluoroalkanes (C-X); a band which occurred at 881.46 cm−1 could be attributed to the presence of aromatic part (meta-substituted benzene) (C=H); a band which occurred at 701.18 cm−1 could be attributed to the presence of chloroalkanes (C-X); a band which occurred at 1322.68 cm−1 could be attributed to the presence of alcohols, carboxylic acids, esters, and ethers (C-O); a band which occurred at 1159.64 cm−1 could be attributed to the presence of tertiary alcohol (C-O); a band which occurred at 710.25 cm−1 could be attributed to the presence of an aromatic ring (Monosubstituted Benzene) (C=H); a band which occurred at 1427.58 cm−1 could be attributed to the presence of organophosphorus compound (aromatic) (P-C); a band which occurred at 805.23 cm−1 could be attributed to the presence of trisubstituted alkenes (C-H); a band which occurred at 1725.29 cm−1 could be attributed to the presence of aldehydes (C=O); a band which occurred at 1274.48 cm−1 could be attributed to the presence of carboxylic acids (C-O); a band which occurred at 1114.28 cm−1 could be attributed to the presence of esters (C-O); a band which occurred at 1066.08 cm−1 could be attributed to the presence of aliphatic amines (C-N); a band which occurred at 1767.90 cm−1 could be attributed to the presence of aliphatic alkynes (C≡C); a band which occurred at 1617.00 cm−1 could be attributed to the presence of primary amines (N-H); a band which occurred at 1091.40 cm−1 could be attributed to the presence of secondary alcohol (C-O); a band which occurred at 2903.37 cm−1 could be attributed to the presence of ammonium ions (N-H); a band which occurred at 1274.48 cm−1 could be attributed to the presence of phosphorus oxide (free) (P-O); and a band which occurred at 2069.79 cm−1 could be attributed to the presence of isothiocyanates (R-N=C=S) (C-N) (Figure 6) [65,66].
IR, MS, and 1H-NMR methods were used in India to identify extracted fatty sterols, acid alcohol, terpene, glycoside, hydrocarbon, and the associated compounds in the butanol and ethanol fractions of LP aerial parts [67,68]. In addition, IR was utilized to identify the amount of lipids in a petroleum ether extract of LP aerial parts in Egypt and to determine phytosterols from LP shoots in India [69,70]. The identification of distinguished fatty acids, alcohols, sterols, glycosides, hydrocarbons, terpenes, and their derivatives in the benzene and ethanol extracts of the aerial parts of LP was the result of further investigations carried out in India employing IR, 1H-NMR, and MS techniques. To evaluate the identification method, comparisons with real samples were also performed [67,68]. Additionally, in India and Egypt, the phytosterol content of the LP shoots was determined by IR analysis of the lipid content in the petroleum ether extract of the LP aerial parts [69,70].

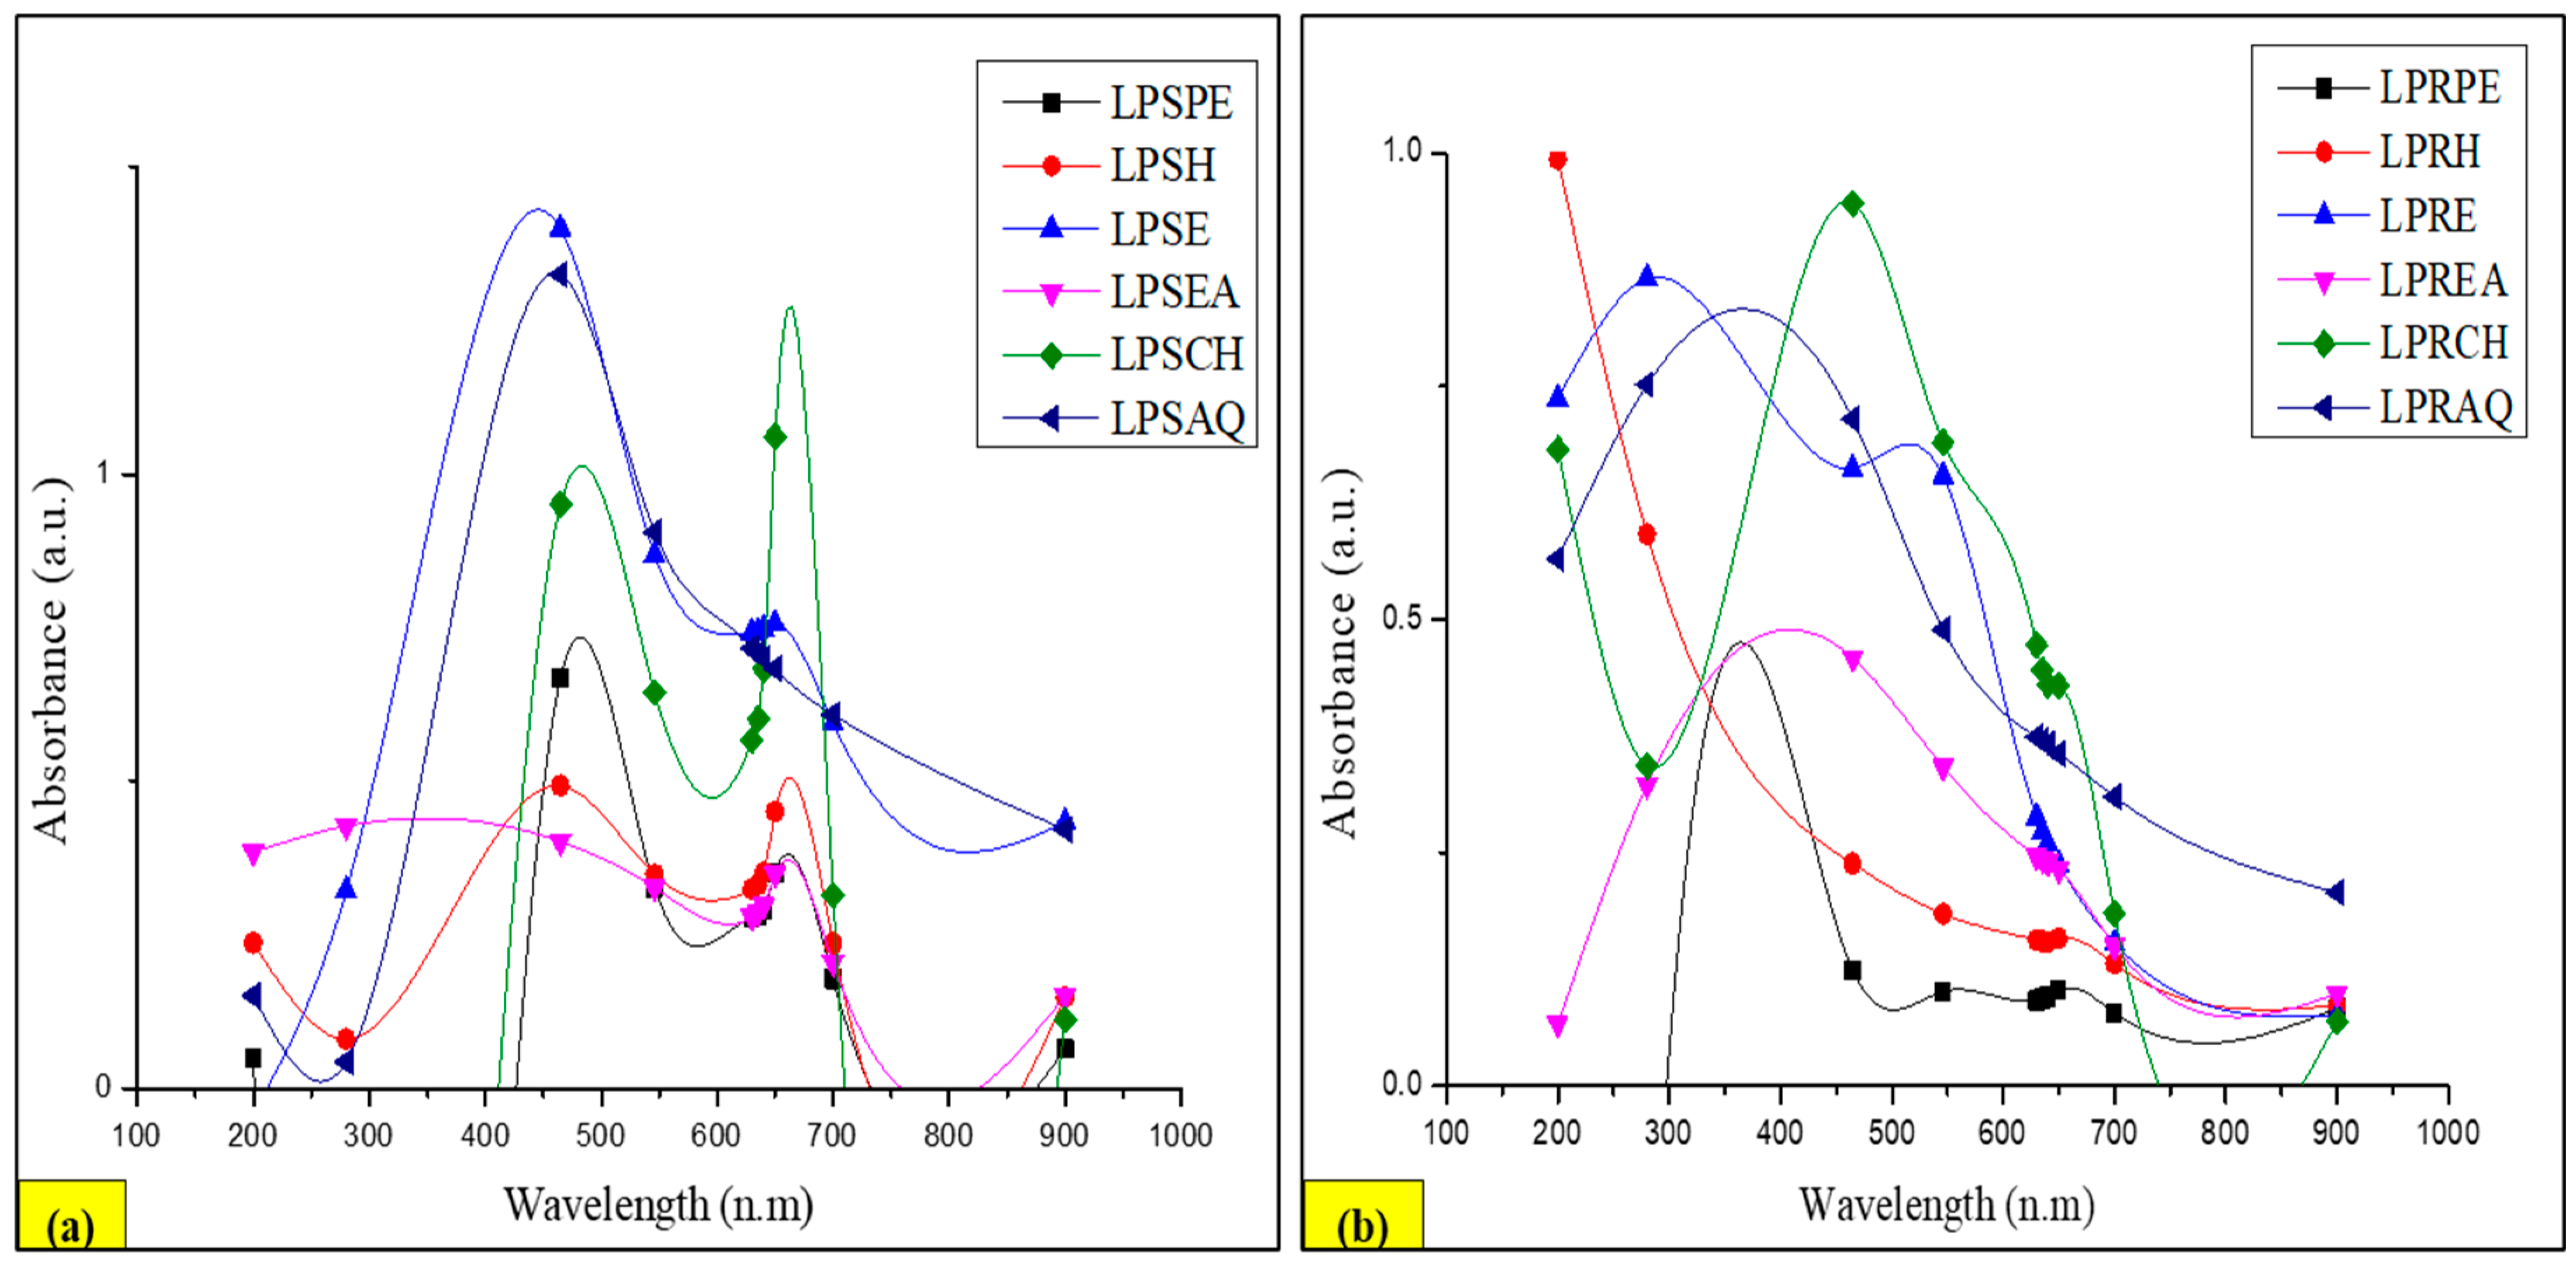
3.9.2. UV–Visible Profile

The UV–visible profile of the LP stem extracts revealed the presence of four peaks at ~465 nm for LPSPE, LPSH, LPSE, and LPSAQ, one peak at 650 nm for LPSCH, and one peak at 280 nm for LPSEA, with absorption ranges from 0 to 1.5 a.u. (Figure 7a). In contrast, the UV–visible profile of the LP root extracts revealed the presence of three peaks at ~465 nm for LPRPE, LPRCH, and LPREA, one peak at 546 nm for LPRH, and two peaks at 280 nm for LPRE and LPRAQ with absorption ranges from 0 to 1 a.u. (Figure 7b). In a study, a UV spectrophotometer was utilized to measure the TPC of ethanol crude extract of the aerial parts of LP, besides its ethyl acetate, butanol, and aqueous fractions, using the Folin–Ciocalteu method at 765 nm, and results were calculated in triplicate and expressed as mg of GA equivalent per g dry weight of plant material [51]. Moreover, it was also used to determine the sugar parts of flavonoids, as it was used in the structural elucidation process of six isolated flavonoids from the ethyl acetate fraction of LP aerial parts [71].
The UV–visible profile of CSE extracts showed the existence of 15 peaks at 465 nm of S1 to S15 with absorption ranges from 0.00 to 1.46 a.u. (Figure 8a), while the UV–visible profile of NCUSAE extracts showed the presence of 15 peaks at 650 nm of U1 to U15 with absorption ranges from 0.00 to 0.78 a.u. (Figure 8b).

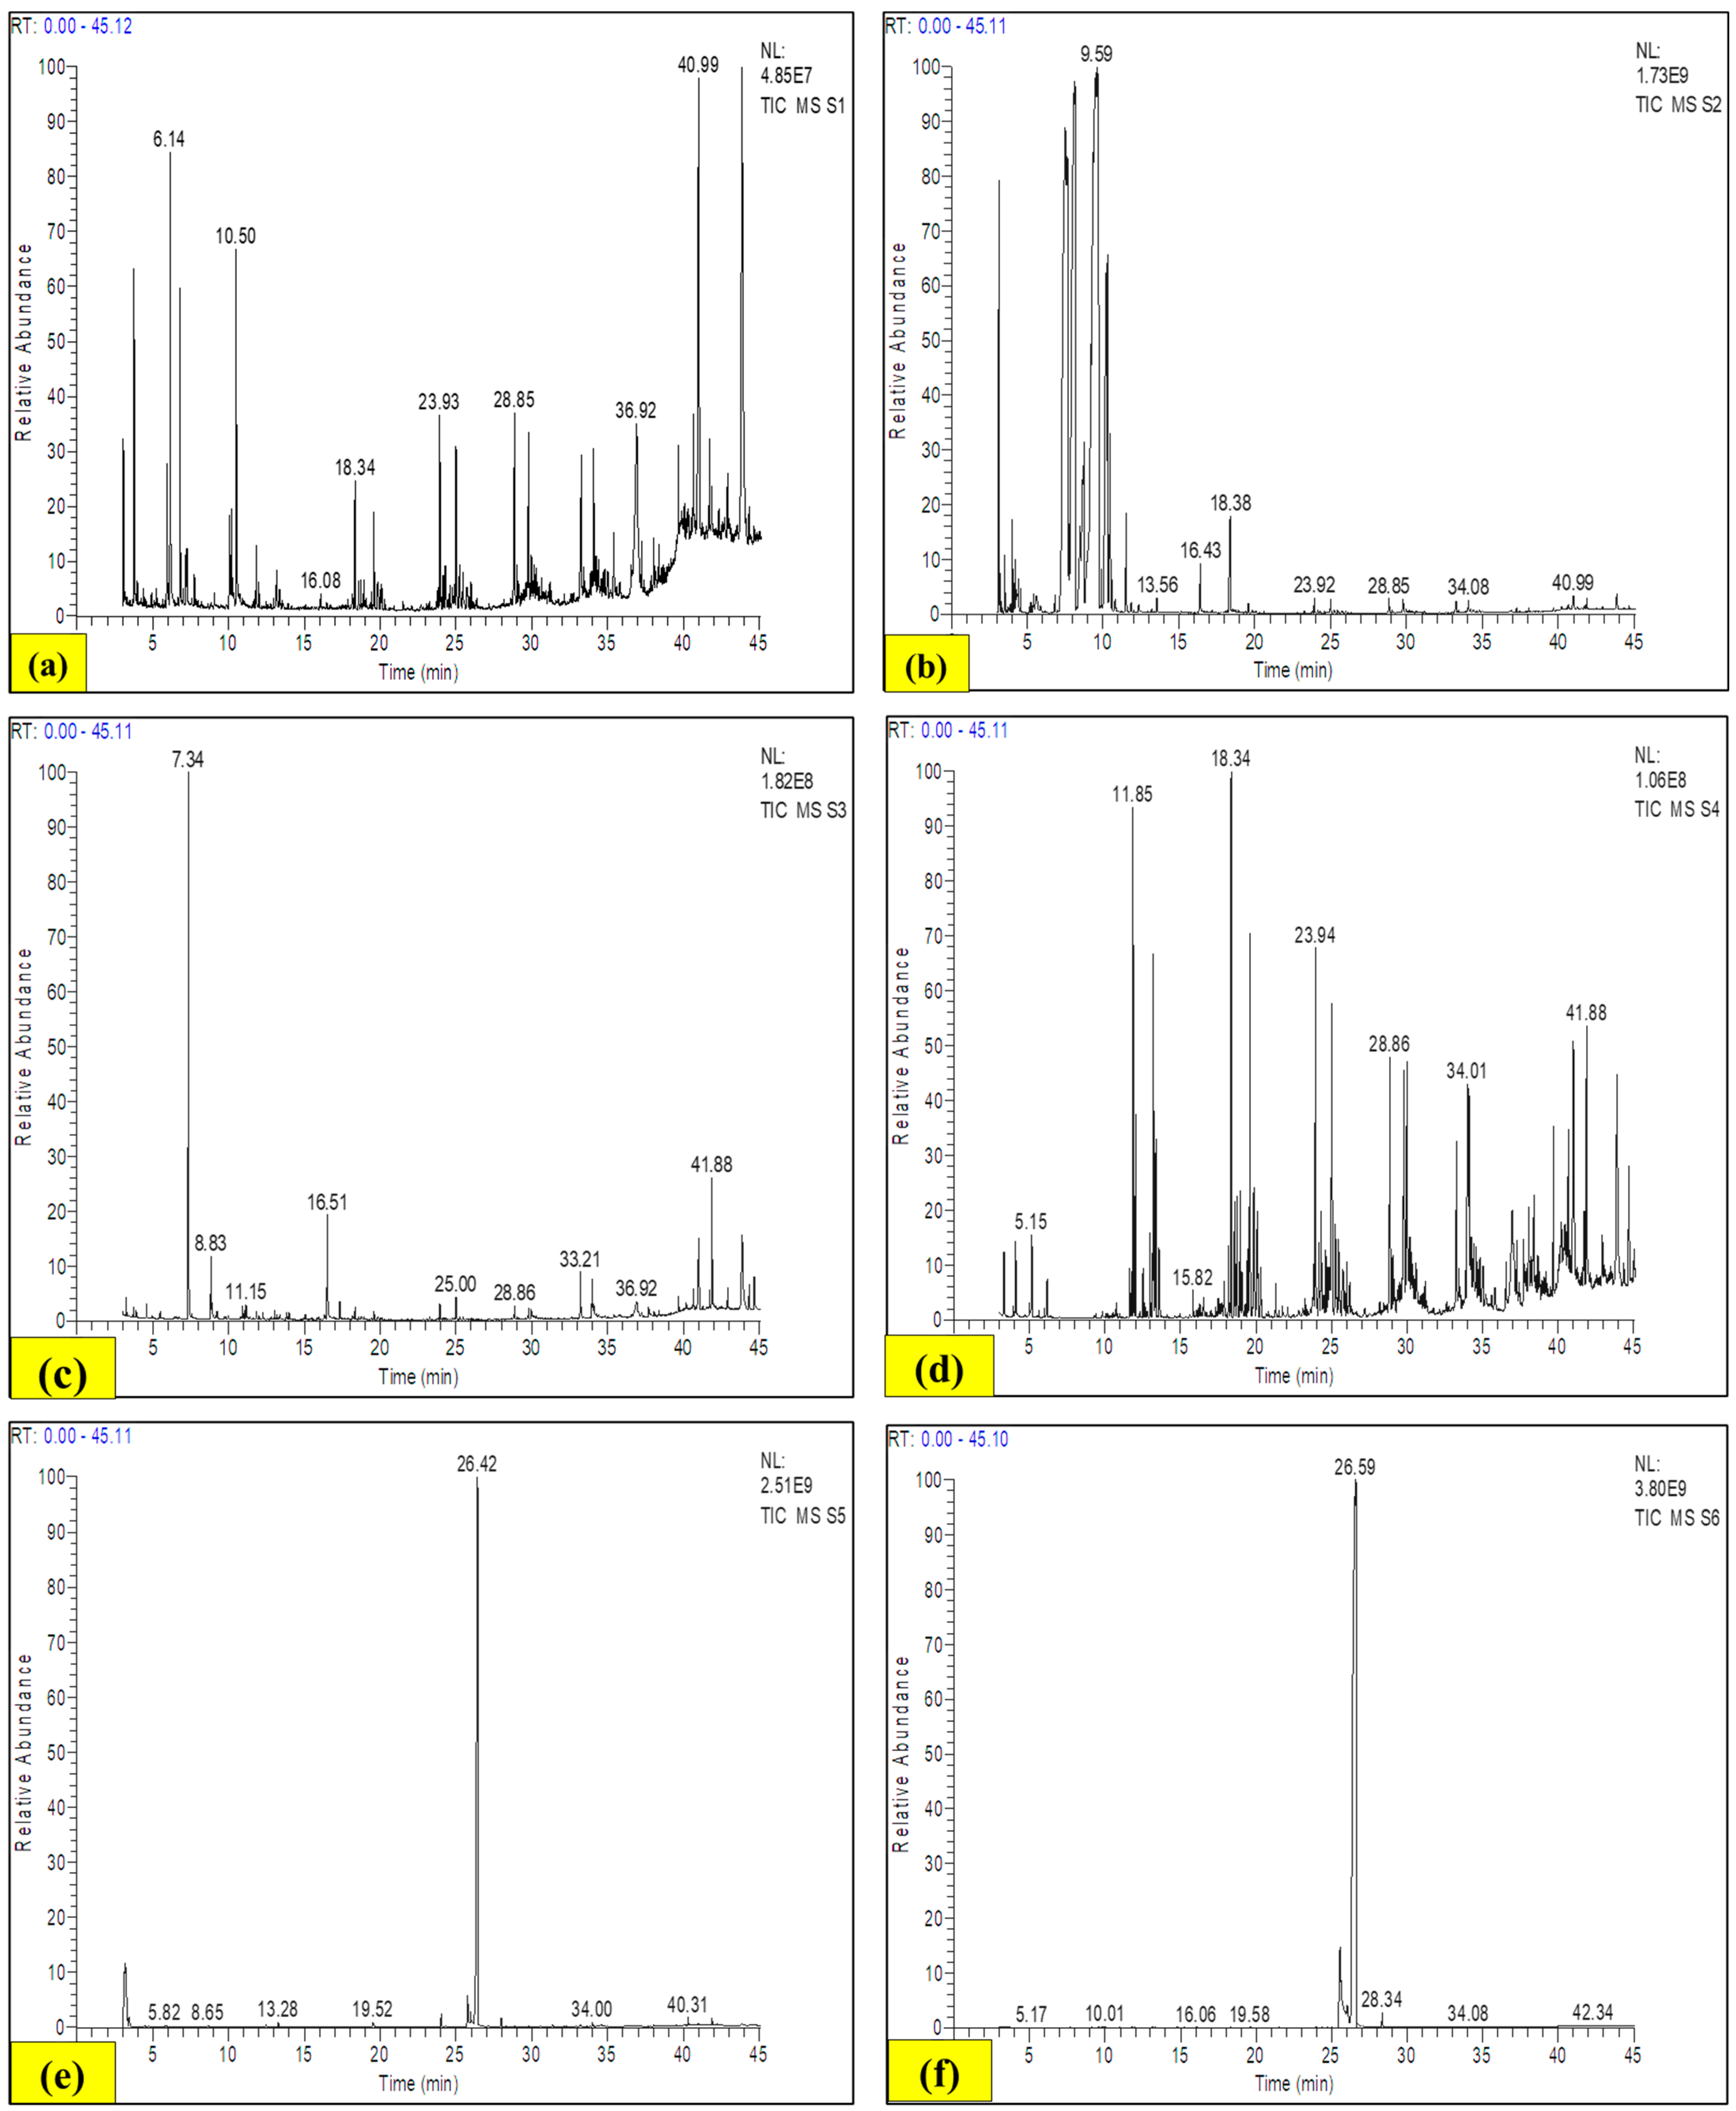
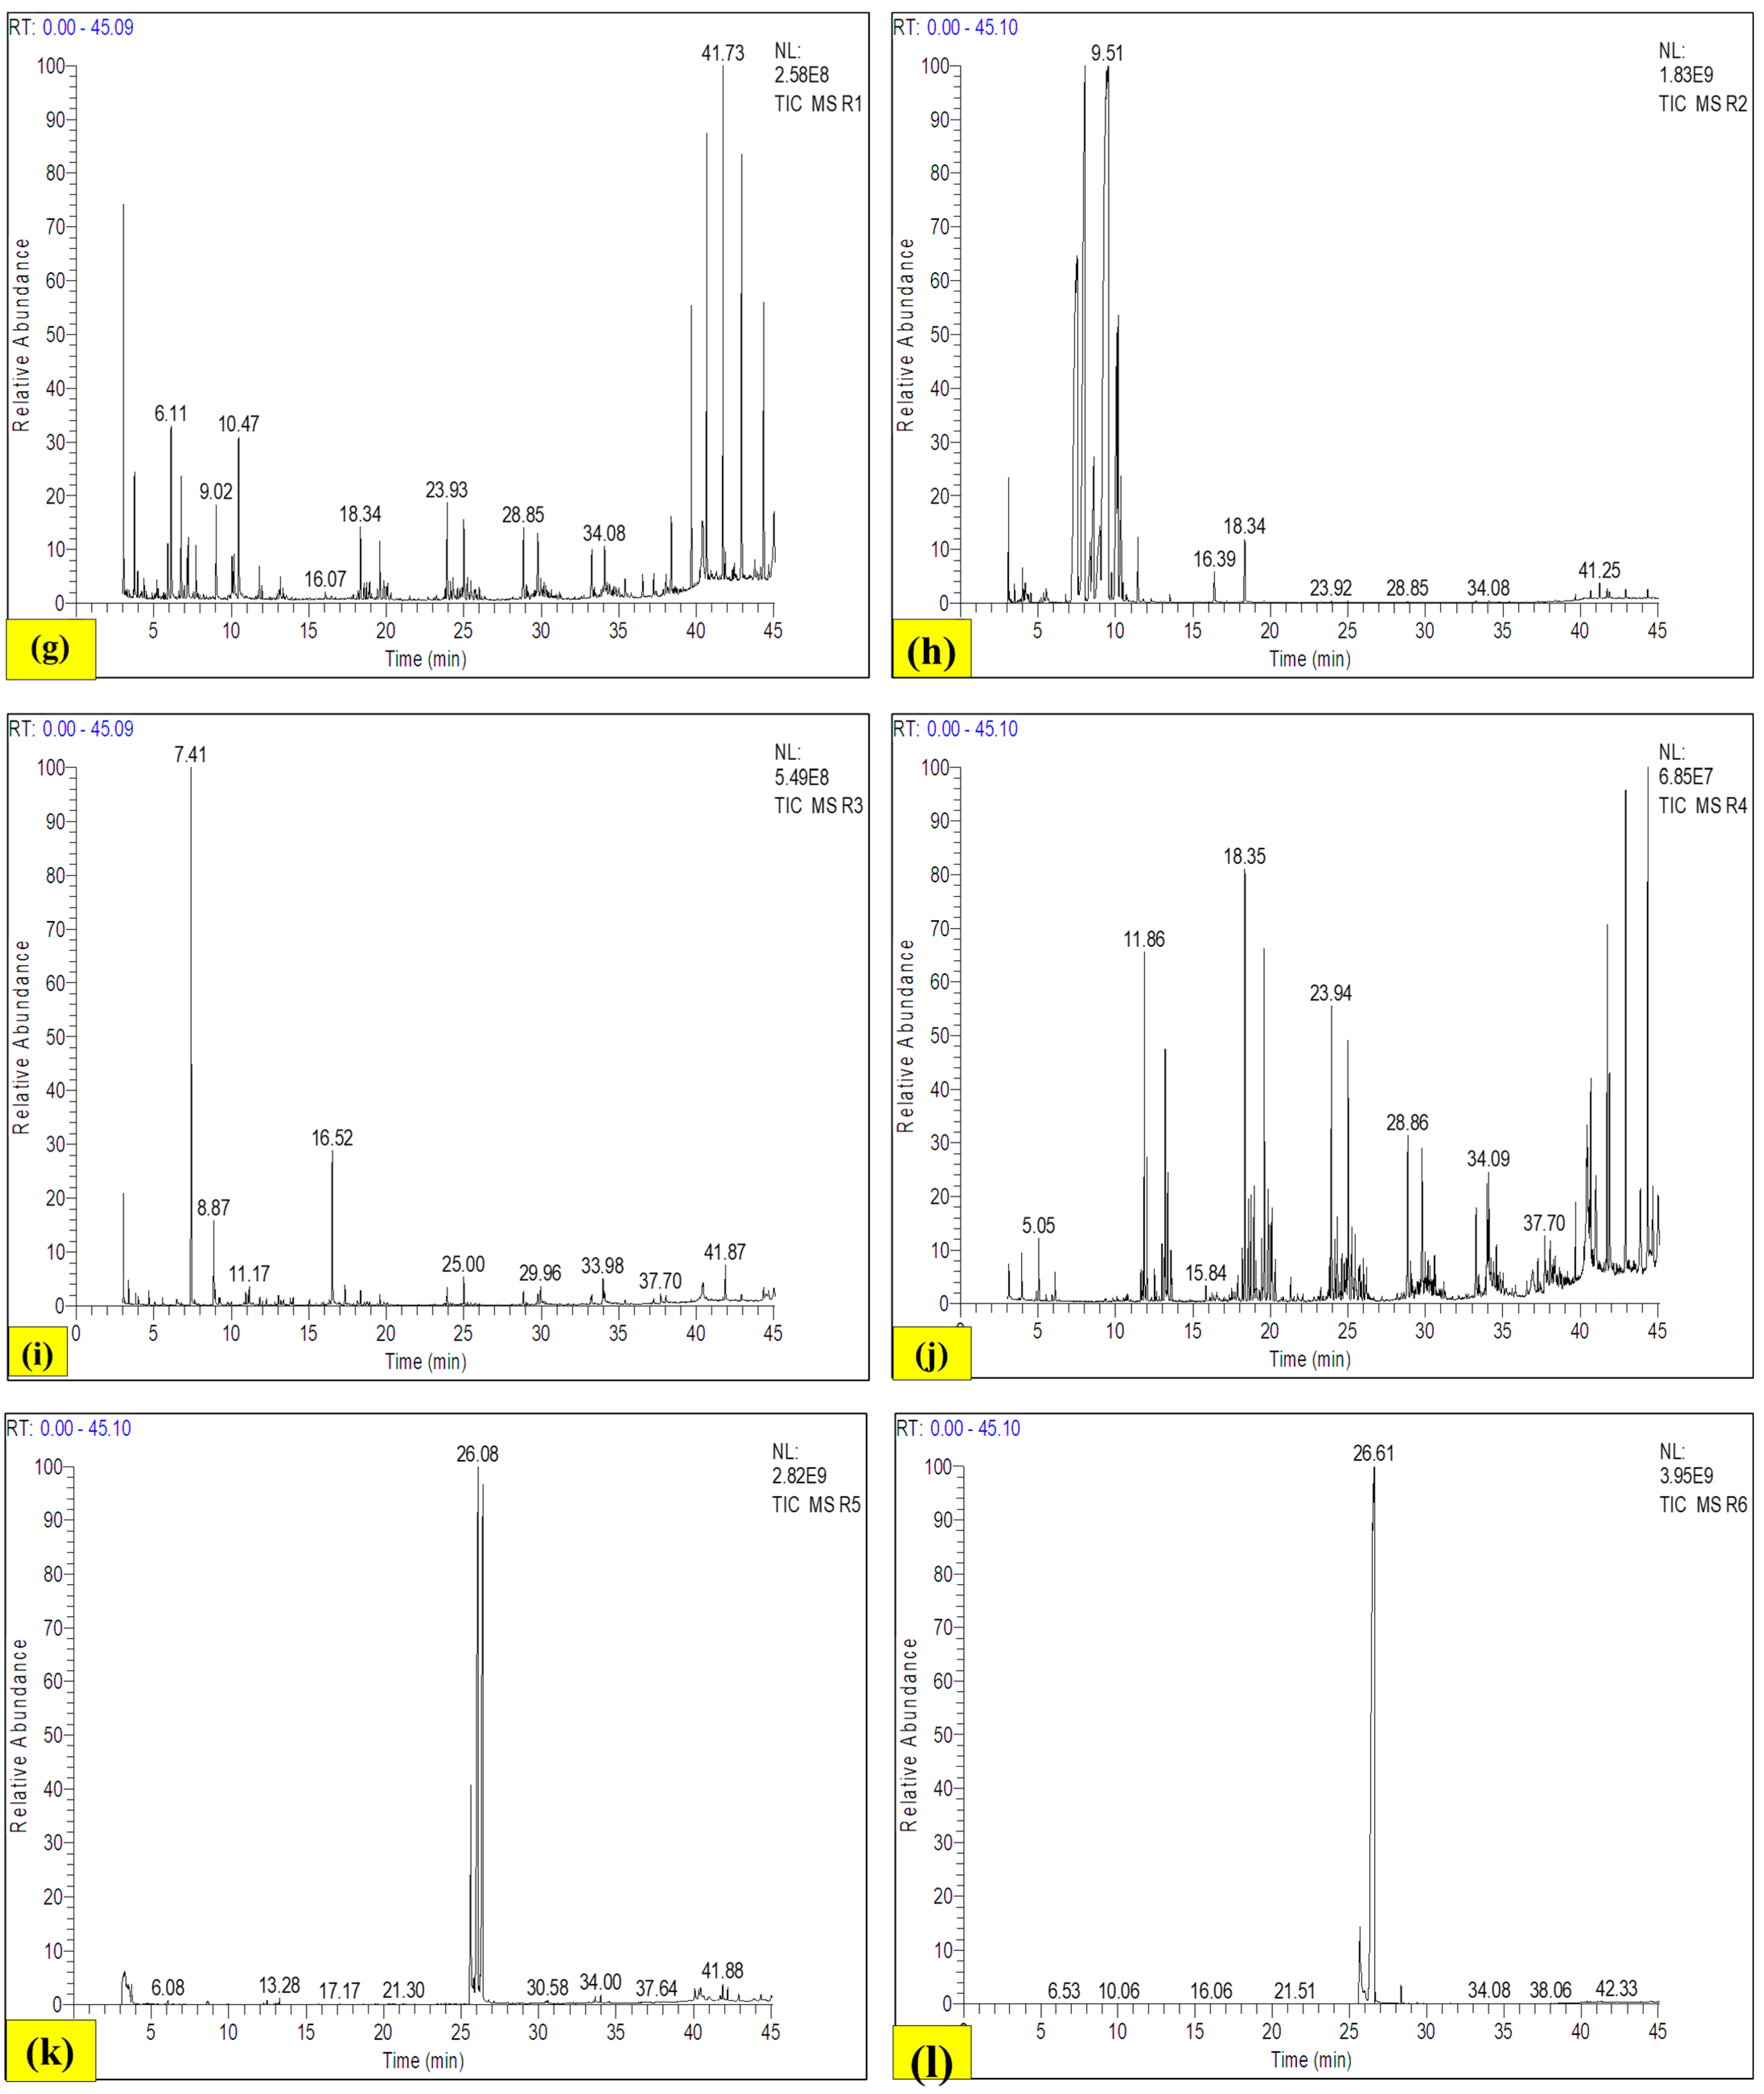
3.9.3. Gas Chromatography–Mass Spectrometry (GC-MS)

In the present study, different extracts of LP stem and root were used for GC-MS analysis. The GC-MS result of the LP stem extracts disclosed about 66 main biologically active compounds (Table 2), whereas the LP root extracts showed the occurrence of 61 main biologically active components (Table 3). In the case of different LP stem extracts, 7,9-Di-tert-butyl-1-oxaspiro (4.5%), deca-6,9-diene-2,8-dione (1.13%), Hexadecane, 2,6,10,14-tetramethyl (3.07%), Ursolic aldehyde (1.13%), 25-Norisopropyl-9,19-cyclolanostan-2 2-en-24-one, 3-acetoxy-24-phenyl-4,4,14-trimethyl- (1.33%), 2,4-Hexanedione, 5,5-dimethyl- (4.44%), Hexanoic acid, 2-oxo-, methyl ester (3.48%), 1,5-Heptadien-4-one, 3,3,6-trimethyl- (28.20%), 2-Pentene, 4,4-dimethyl-, (E)- (5.52%), Carbamic acid, methyl ester (1.28%), n-Hexadecanoic acid (4.28%), 2,4-Di-tert-butylphenol (1.69%), Octadecanoic acid, 2,3-dihydroxypropyl ester (3.56%), and Myristic acid (4.90%) were the phytocompounds present in considerable amounts, and other chemicals were observed in very low amounts. In the case of distinct LP root extracts, Eicosane (5.18%), Oxalic acid, cyclohexyl pentyl ester (40.90%), 2-Propanone, 1,1-dichloro- (1.16%), Acetyl chloride, dichloro- (1.59%), Phenol, 4-chloro-2,6-bis(1,1-dimethylethyl)- (2.45%), Tetradecanoic acid (2.13%), n-Hexadecanoic acid (2.81%), l-(+)-Ascorbic acid 2,6-dihexadecanoate (2.18%), Hexadecanoic acid, 2-hydroxy-1-(hydroxymethyl)ethyl ester (3.69%), Glycerol 1-palmitate (3.69%), Octadecanoic acid, 2,3-dihydroxypropyl ester (2.93%), Octadecanoic acid, 2-hydroxy-1,3-propanediyl ester (2.93%), Hexadecane, 2,6,11,15-tetramethyl (4.63%), Hexadecanoic acid, and 1-(hydroxymethyl)-1,2-ethanediyl ester (3.69%) were the phytocompounds present in considerable amounts, and other compounds were found in lower amounts (Figure 9).
A study carried out on the petroleum ether extracts of LP whole plants cultivated in Qatar identified nine phytocompounds as myristic, lauric, palmitic, linoleic, palmitoleic, alpha-linolenic, oleic, behenic, and arachidic acids [40]. On the other hand, the hexane extract of the LP shoot cultivated in the UAE was found to include linoleic, heptadecanoic, α-linolenic, and n-hexadecanoic acids. In the UAE and Egypt [52], GC-MS analysis was utilized to study the fatty acids and their (methyl and ethyl ester) derivatives in the petroleum ether and hexane extracts of the LP aerial parts [67]. In another study, Campesterol was identified in the hexane extract and non-saponifiable material generated from acetone-soluble portions of petroleum ether extract of LP aerial parts in Egypt, the UAE, and India. In India, Stigmasterol was identified as well as isolated from the LP shoots. Additionally, it was discovered in the hexane and petroleum ether extracts of the LP shoots (Egypt and UAE), respectively [69,70,72].
There were 34 terpene compounds reported in the whole plant, aerial parts, leaves, and stems of LP. In an Indian study, Lupeol was found and measured in the methanol extract of the whole LP plant [73]. In various investigations carried out in India, Pakistan, Egypt, and the UAE, phenolic acids, flavonoids, phenolic aldehydes, coumarins, benzenediol, and phenylpropene were discovered to a large extent in the LP shoots. The methanol extract of the LP shoots included the following acids that were recognized and measured: vanillic acid (0.018%), caffeic acid (3.3%), ferulic acid, p-coumaric acid, cinnamic acid, and veratric acid [74]. The alkaloid portion of the methanol (defatted) extract of the LP aerial parts was analysed using GC-MS, and a total of 24 alkaloids, containing derivatives of pyridine, indole, pyrazine, and pyrrole, were discovered along with 6 other basic amines, notably N-ethyl-N-hydroxyethanamine, 4-aminobenzene-1,3-diol, 2-methylazetidine, N, N′-diphenylcarbodiimide, N-(prop-1-yn-1yl) acetamide, and 1,2-dimethylazetidine [71]. A study reported that the LP stems are a good source of peptides and amino acids. A study was carried out in India that showed the presence of two dipeptides, namely, glycyl-L-alanine and DL-alanyl-L-alanine, as well as six amino acids, namely, L-arginine, L-alanine, L-lysine, L-isoleucine, L-threonine, and L-methionine, in the LP stem by utilizing the GC-MS analytical tool [75].
One more study conducted in the UAE adopted the GC-MS method to examine the hexane extract of LP aerial parts, which led to the discovery of hydrocarbons, sterols, fatty acids, terpenes, and their derivatives [52]. In another investigation, GC-MS was used to determine the qualitative and quantitative amounts of phytosterols in LP shoots in India [70].

4. Conclusions

Biologically active compounds from conventional medicines have recently been used successfully as a targeted therapy to control a variety of health conditions. The results of proximate, qualitative, quantitative, and in vitro antioxidant analysis have made it clear that several phytocompounds (like phenols, saponins, tannins, flavonoids, and alkaloids) present in good amounts within different LP extracts have strong antioxidant efficacy and therapeutic applications, and can be utilized ethnobotanically to treat various illnesses. Different analytics were used, such as AAS for determining elemental composition and FT-IR and GC-MS for the identification of different phytocompounds present in LP that can be relevantly used in pharmaco-medical and agro-food industries. The findings of this research indicated that LPSPE and LPSE extracts of LP might become a source for new pharmaceuticals with potent antioxidant properties. This novel study also reveals the viability of phenol, tannin, and alkaloid extraction from LP stems using more environmentally friendly extraction methods based on the use of ethanol as a sustainable solvent. In terms of the extraction yield of all three biological chemicals, NCUSAE has been proven to be significantly more effective than CSE at a far lower energy cost, as well as being less time-consuming. The evaluated extraction processes were also effectively modelled using surface analysis, which provides an estimation of the best extraction under various experimental settings. To further establish the scientific perspective, our findings strongly recommend that the isolation of a particular phytocompound from the LP extracts (specifically LPSE extract) could be utilized prominently in drug discovery studies.

Supplementary Materials

The following supporting information can be downloaded at: https://www.mdpi.com/article/10.3390/antiox13070794/s1, Table S1: Experimental design for conventional soxhlet extraction (CSE) and non-conventional ultrasound-assisted extraction (NCUSAE); Table S2: Qualitative screening of Leptadenia pyrotechnica (LP) stem and root extracts.

Author Contributions

D.K.: methodology, investigation, resources, data and manuscript compilation, writing original draft. D.S.: investigation, conceptualization, resources, writing draft—review and editing. M.M.: writing draft—review and editing, methodology, investigation, conceptualization, validation, resources, data curation. P.J.: review, editing, investigation, visualization, conceptualization, supervision. M.H.S.: resources and funding. All authors have read and agreed to the published version of the manuscript.

Funding

This research was funded by the Researchers Supporting Project number (RSP2024R347), King Saud University, Riyadh, Saudi Arabia. This research was funded by the funding agency Science and Engineering Research Board (SERB), State University Research Excellence (SURE) (File Number: SUR/2022/005216) and the Ministry of Education and SPD-RUSA Rajasthan through the RUSA-2.0 project.

Institutional Review Board Statement

Not applicable.

Informed Consent Statement

Not applicable.

Data Availability Statement

The datasets used and/or analysed during the current study are available from the corresponding author on reasonable request. The data also presented in this study are available in Supplementary Materials.

Acknowledgments

The Vice-Chancellor of Banasthali Vidyapith in Rajasthan is gratefully acknowledged by the authors for providing an outstanding research infrastructure. The authors also acknowledge the Bioinformatics Centre at Banasthali Vidyapith, which is funded by DBT and DST and supports the FIST and CURIE programs at the Department of Bioscience and Biotechnology there. The authors would like to extend their sincere appreciation to the Researchers Supporting Project number (RSP2024R347), King Saud University, Riyadh, Saudi Arabia. The author M.M. also gratefully acknowledges the financial support provided by the funding agency Science and Engineering Research Board (SERB), State University Research Excellence (SURE) (File Number: SUR/2022/005216) for this study. The author M.M. is very thankful to the Ministry of Education and SPD-RUSA Rajasthan for the financial support received under the RUSA 2.0 project. All the authors acknowledge their host institute for infrastructure support. All the authors read and approved the content of the manuscript for publication.

Conflicts of Interest

The authors declare no conflicts of interest.

Abbreviations

LP: Leptadenia pyrotechnica Forssk. Decne; AAS, atomic absorption spectrophotometer; UV–vis, ultraviolet–visible; FT-IR, Fourier-transform infrared spectroscopy; GC-MS, gas chromatography–mass spectrometry; CSE, conventional soxhlet extraction; NCUSAE, non-conventional ultrasound-assisted extraction; GA, gallic acid; LOD, loss of dryness; µg/mL, micrograms per milliliters; g, gram; nm, nanometers; CCD, central composite design; ANOVA, analysis of variance; RSREG, response surface regression; TAV, total ash value; WSA, water-soluble ash; AIA, acid-insoluble ash; TEAC, trolox-equivalent antioxidant capacity; DPPH, 2,2-diphenyl-1-picryl-hydrazyl-hydrate; MC, metal chelation; M, methanol; NO, nitric oxide; RT, room temperature; RSM, response surface methodology; TPC, total phenolic content; TSC, total saponin content; TTC, total tannin content; TFC, total flavonoid content; TAC, total alkaloid content; WHO, World Health Organization; AQ: aqueous; B, benzene; Bu, butanol; CH, chloroform; EA, ethyl acetate; E, ethanol; FRAP, ferric reducing antioxidant power assay; H, hexane; PE, petroleum ether; H2O2, hydrogen peroxide; S/M, solvent/material.

References

  1. Kumar, R.; Sharma, N.; Rolta, R.; Lal, U.R.; Sourirajan, A.; Dev, K.; Kumar, V. Thalictrum foliolosum DC: An unexplored medicinal herb from the North Western Himalayas with potential against fungal pathogens and scavenger of reactive oxygen species. Biocatal. Agric. Biotechnol. 2020, 26, 101621. [Google Scholar] [CrossRef]
  2. Eddouks, M.; Chattopadhyay, D.; De Feo, V.; Cho, W.C. Medicinal plants in the prevention and treatment of chronic diseases 2013. Evid. Based Complement. Altern. Med. 2014, 2014, 180981. [Google Scholar] [CrossRef]
  3. Zehra, A.; Meena, M.; Jadhav, D.M.; Swapnil, P. Harish Regulatory mechanisms for the conservation of endangered plant species, Chlorophytum tuberosum—Potential medicinal plant species. Sustainability 2023, 15, 6406. [Google Scholar] [CrossRef]
  4. Yadav, G.; Sonigra, P.; Meena, M. A review on pharmaceutical and medicinal importance of Anethum graveolens L. Acta Sci. Nutr. Health 2022, 6, 23–28. [Google Scholar]
  5. Yadav, G.; Meena, M. Bioprospecting of endophytes in medicinal plants of Thar Desert: An attractive resource for biopharmaceuticals. Biotechnol. Rep. 2021, 30, e00629. [Google Scholar] [CrossRef] [PubMed]
  6. Singh, J.; Singh, J.; Sharma, D. Traditional wisdom to treat the most common ailments in Chopal region of Shimla district, Himachal Pradesh, India. Plant Arch. 2018, 18, 2759–2769. [Google Scholar]
  7. Shantabi, L.; Jagetia, G.C.; Vabeiryureilai, M.; Lalrinzuali, K. Phytochemical screening of certain medicinal plants of Mizoram, India and their folklore use. J. Biodivers. Biopros. Dev. 2014, 2, 1. [Google Scholar] [CrossRef]
  8. Meena, M.; Singh, S.K.; Swapnil, P. The role of PGPRs in medicinal plants under abiotic stress. In Medicinal Plants: Their Response to Abiotic Stress; Husen, A., Iqbal, M., Eds.; Springer: Singapore, 2023; pp. 267–285. [Google Scholar] [CrossRef]
  9. El-Fitiany, R.A.; Khasawneh, M.A. Leptadenia pyrotechnica (Forsk.) Decne: From edibility to drug discovery (a comprehensive review). Food Rev. Int. 2023, 39, 6834–6886. [Google Scholar] [CrossRef]
  10. Idrees, S.; Qureshi, R.; Bibi, Y.; Ishfaq, A.; Khalid, N.; Iftikhar, A.; Shabir, A.; Riaz, I.; Ahmad, S.N. Ethnobotanical and biological activities of Leptadenia pyrotechnica (Forssk.) Decne.: A review. Afr. J. Tradit. Complement. Altern. Med. 2016, 13, 88–96. [Google Scholar] [CrossRef] [PubMed]
  11. Abd-ElGawad, A.M.; Assaeed, A.M.; Bonanomi, G.; El-Amier, Y.A. Ecological insight, anatomical features, and fiber characterization of Leptadenia pyrotechnica (Forrsk.) Decne. as a promising resource. Sustainability 2022, 14, 16895. [Google Scholar] [CrossRef]
  12. IPNI (International Plant Names Index). The Royal Botanic Gardens, Kew, Harvard University Herbaria & Libraries and Australian National Herbarium. Available online: http://www.ipni.org (accessed on 1 June 2024).
  13. Sharma, V.; Janmeda, P. Extraction, isolation and identification of flavonoids from Euphorbia neriifolia leaves. Arab. J. Chem. 2014, 10, 509–514. [Google Scholar] [CrossRef]
  14. Pavithra, K.; Vadivukkarasi, S. Evaluation of free radical scavenging activity of various extracts of leaves from Kedrostis foetidissima (Jacq.), Cogn. Food Sci. Hum. Wellness 2015, 4, 42–46. [Google Scholar] [CrossRef]
  15. Sharma, V.; Janmeda, P. Microscopic studies and preliminary pharmacognostical evaluation of Euphorbia neriifolia L. leaves. Indian J. Nat. Prod. Resour. 2013, 4, 348–357. [Google Scholar]
  16. Çetin, N.; Saglam, C. Rapid detection of total phenolics, antioxidant activity and ascorbic acid of dried apples by chemometric algorithms. Food Biosci. 2022, 2022, 101670. [Google Scholar] [CrossRef]
  17. Le, A.V.; Parks, S.E.; Nguyen, M.H.; Roach, P.D. Optimisation of the microwave-assisted ethanol extraction of saponin from Gac (Momordica cochinchinensis Spreng.) seeds. Medicines 2018, 5, 70. [Google Scholar] [CrossRef] [PubMed]
  18. Haile, M.; Kang, W.H. Antioxidant activity, total polyphenol, flavonoid and tannin contents of fermented green coffee beans with selected yeast. Fermentation 2019, 5, 29. [Google Scholar] [CrossRef]
  19. Zhishen, J.; Mengcheng, T.; Jianming, W. The determination of flavonoid contents in mulberry and their scavenging effects on superoxide radicals. Food Chem. 1999, 64, 55–59. [Google Scholar] [CrossRef]
  20. Gan, J.; Feng, Y.; He, Z.; Li, X.; Zhang, H. Correlations between antioxidant activity and alkaloids and phenols of Maca (Lepidium meyenii). J. Food Qual. 2017, 2017, 3185945. [Google Scholar] [CrossRef]
  21. Habibian, M.; Sadeghi, G.; Karimi, A. Phytochemicals and antioxidant properties of solvent extracts from Purslane (Portulaca oleracea L.): A preliminary study. Food Sci. Eng. 2019, 1, 12. [Google Scholar] [CrossRef]
  22. Partap, S.; Tewari, U.; Sharma, K.; Jha, K.K. In vitro antioxidant activity of whole plant of Leptadenia pyrotechnica. J. Drug Deliv. Ther. 2014, 4, 40–44. [Google Scholar] [CrossRef]
  23. Devi, K.R.; Patnaik, K.S.K.R.; Ashok, D.; Bakshi, V.; Bathula, R.; Rani, S.S. Microwave irradiation synthesis and antioxidant activity of isatin-oxadiazole derivatives. Int. J. Adv. Res. 2017, 5, 2329–2336. [Google Scholar] [CrossRef] [PubMed]
  24. Wetchakul, P.; Chonsut, P.; Punsawad, C.; Sanpinit, S. LC-QTOF-MS characterization, antioxidant activity, and in vitro toxicity of medicinal plants from the Tri-Than-Thip Remedy. Evid. Based Complement. Alternat. Med. 2022, 2022, 4477003. [Google Scholar] [CrossRef] [PubMed]
  25. Fernandes, R.P.; Trindade, M.A.; Tonin, F.G.; Lima, C.G.; Pugine, S.M.; Munekata, P.E.; Lorenzo, J.M.; de Melo, M.P. Evaluation of antioxidant capacity of 13 plant extracts by three different methods: Cluster analyses applied for selection of the natural extracts with higher antioxidant capacity to replace synthetic antioxidant in lamb burgers. J. Food Sci. Technol. 2015, 53, 451–460. [Google Scholar] [CrossRef] [PubMed]
  26. Zafar, M.; Khan, M.A.; Ahmad, M.; Jan, G.; Sultana, S.; Ullah, K.; Marwat, S.K.; Ahmad, F.; Jabeen, A.; Nazir, A.; et al. Elemental analysis of some medicinal plants used in traditional medicine by atomic absorption spectrophotometer (AAS). J. Med. Plant Res. 2010, 4, 1987–1990. [Google Scholar] [CrossRef]
  27. de Castro, M.D.L.; García-Ayuso, L.E. Soxhlet extraction of solid materials: An outdated technique with a promising innovative future. Anal. Chim. Acta 1998, 369, 1–10. [Google Scholar] [CrossRef]
  28. Chemat, F.; Tomao, V.; Virot, M. Ultrasound-assisted extraction in food analysis. In Handbook of Food Analysis Instruments; Otles, S., Ed.; CRC Press: Boca Raton, FL, USA, 2008; pp. 85–94. [Google Scholar] [CrossRef]
  29. Kalil, S.J.; Maugeri, F.; Rodrigues, M.I. Response surface analysis and simulation as a tool for bioprocess design and optimization. Proc. Biochem. 2000, 35, 539–550. [Google Scholar] [CrossRef]
  30. Rao, K.J.; Kim, C.H.; Rhee, S.K. Statistical optimization of medium for the production of recombinant hirudin from Saccharomyces cerevisiae using response surface methodology. Proc. Biochem. 2000, 35, 639–647. [Google Scholar] [CrossRef]
  31. Puri, S.; Beg, Q.K.; Gupta, R. Optimization of alkaline protease production from Bacillus sp. by response surface methodology. Curr. Microbiol. 2002, 44, 286–290. [Google Scholar] [CrossRef]
  32. Vohra, A.; Satyanarayana, T. Statistical optimization of the medium components by response surface methodology to enhance phytase production by Pichia anomala. Proc. Biochem. 2002, 37, 999–1004. [Google Scholar] [CrossRef]
  33. Burkert, J.F.; Maugeri, F.; Rodrigues, M.I. Optimization of extracellular lipase production by Geotrichum sp. using factorial design. Bioresour. Technol. 2004, 91, 77–84. [Google Scholar] [CrossRef]
  34. Jain, D.; Meena, M.; Singh, D.; Janmeda, P. Structural characterization of bioactive compounds of Gymnosporia senegalensis (Lam.) Loes. using advanced analytical technique like FT-IR, GC-MS and 1H-NMR spectroscopy. Nat. Prod. Res. 2023, 37, 1–11. [Google Scholar] [CrossRef] [PubMed]
  35. Serna-Jiménez, J.A.; Torres-Valenzuela, L.S.; Sanín Villarreal, A.; Roldan, C.; Martín, M.A.; Siles, J.A.; Chica, A.F. Advanced extraction of caffeine and polyphenols from coffee pulp: Comparison of conventional and ultrasound-assisted methods. LWT 2023, 177, 114571. [Google Scholar] [CrossRef]
  36. Mabasa, X.E.; Mathomu, L.M.; Madala, N.E.; Musie, E.M.; Sigidi, M.T. Molecular spectroscopic (FTIR and UV-Vis) and hyphenated chromatographic (UHPLC-qTOF-MS) analysis and in vitro bioactivities of the Momordica balsamina leaf extract. Biochem. Res. Int. 2021, 2021, 2854217. [Google Scholar] [CrossRef] [PubMed]
  37. Jirvankar, P.S.; Khobragade, D.; Chandewar, S.; Pimpale, A.; Gawali, R.; Lokade, A.; Maske, A.; Agrawal, R. Phytochemical, UV-visible and FTIR assessment along with in vitro antioxidant activity of methanolic extract of Tephrosia purpurea Linn Root. J. Pharm. Res. Int. 2022, 34, 26–33. [Google Scholar] [CrossRef]
  38. Monika, S.; Thirumal, M.; Kumar, P.R. Identification of bioactive phytochemicals by GC-MS profiling, phytochemical screening, and TLC using methanolic extract of Carissa carandas Linn. leaf. J. Pharm. Negat. Results 2022, 13, 4439–4444. [Google Scholar] [CrossRef]
  39. Migahid, A.M.; Batanoun, K.; Abdelwah, A. Eco-physiological studies on desert plants. VII. Water relations of Leptadenia pyrotechnica (Forsk.) Decne. growing in Egyptian desert. Oecologia 1972, 10, 79–91. [Google Scholar] [CrossRef] [PubMed]
  40. Al-Easa, H.S. Fatty acids composition of fifty-one plant species growing in Qatar. Int. J. Chem. 2004, 14, 195–204. [Google Scholar]
  41. Schmelzer, G.H.; Gurib-Fakim, A. Medicinal Plants 2; Prota: Wageningen, The Netherlands, 2008; Volume 11. [Google Scholar]
  42. Javid, S.; Khalil, S.; Munir, I.; Amjad, M.S.; Akbar, K.; Yasmeen, F.; Akhtar, M.S. Plant metabolites and pharmacological activities of Leptadenia pyrotechnica (Forssk.) Decne. In Natural Bio-Active Compounds; Sayeed, M., Swamy, A.M.K., Sinniah, U.R., Eds.; Springer: Singapore, 2019; pp. 551–560. [Google Scholar]
  43. Verma, N.; Jha, K.K.; Chaudhary, S.; Singh, O.; Kumar, A. Phytochemistry, pharmacology and traditional uses of Leptadenia pyrotechnica-An important medicinal plant. Indian J. Pharm. Biol. Res. 2014, 2, 128. [Google Scholar] [CrossRef]
  44. Ullah, F.; Uzair, M.; Chaudhry, B.A.; Zafar, Z.U. Phytochemical and pharmacological studiof Leptadenia pyrotechnica. Pak. J. Pharm. Res. 2015, 1, 78–85. [Google Scholar] [CrossRef]
  45. Purohit, S. Phytochemical screening, free radical scavenging, antimicrobial activity of ethanolic extract of Leptadenia pyrotechnica. Int. J. Green Pharm. 2017, 11, 180–187. [Google Scholar]
  46. Rekha, R.; Singh, S.; Kumar, M.; Kumar, K. In vivo and in vitro comparative study of primary metabolites of Leptadenia pyrotechnia. J. Microbiol. Biotechnol. Res. 2013, 3, 51–54. [Google Scholar]
  47. Tanira, M.; Bashir, A.K.; Dib, R.; Goodwin, C.S.; Wasfi, I.A.; Banna, N.R. Antimicrobial and phytochemical screening of medicinal plants of the United Arab Emirates. J. Ethnopharmacol. 1994, 41, 201–205. [Google Scholar] [CrossRef] [PubMed]
  48. Soliman, G.A.; Donia, A.E.R.M.; Awaad, A.S.; Alqasoumi, S.I.; Yusufoglu, H. Effect of Emex spinosa, Leptadenia pyrotechnica, Haloxylon salicornicum and Ochradenus baccatus extracts on the reproductive organs of adult male rats. Pharm. Biol. 2012, 50, 105–112. [Google Scholar] [CrossRef]
  49. Kumar, D.; Dhayal, K.; Sharma, R.A. Biochemical estimation of primary metabolites and antioxidant activity of Corchorus olitorius L. and Leptadenia pyrotechnica (Forsk) Decne. Int. J. Res. Pharm. Chem. 2018, 8, 183–187. [Google Scholar]
  50. Zubair, M.; Nazir, M.; Saleem, M.; Raiz, N.; Touseef, S.; Khan, S.; Zengin, G.; Mazhar, M.E.; Tousif, M.I. Chemodiversity, biological activities and molecular docking studies of Leptadenia pyrotechnica (Forssk.) Decne: A comprehensive approach to validate its medicinal use. Chem. Biodivers. 2022, 19, e202100884. [Google Scholar] [CrossRef]
  51. Khasawneh, M.A.; Elwy, H.M.; Hamza, A.A.; Fawzi, N.M.; Hassan, A.H. Antioxidant, anti-lipoxygenase and cytotoxic activity of Leptadenia pyrotechnica (Forssk.) Decne polyphenolic constituents. Molecules 2011, 16, 7510–7521. [Google Scholar] [CrossRef] [PubMed]
  52. Khasawneh, M.A.; Koch, A.; Elwy, H.M.; Hamza, A.A.; Schneider-Stock, R. Leptadenia pyrotechnica induces P53-dependent apoptosis in colon cancer cells. Nat. Prod. Chem. Res. 2015, 3, 3. [Google Scholar] [CrossRef]
  53. Qasim, M.; Abideen, Z.; Adnan, M.Y.; Gulzar, S.; Gul, B.; Rasheed, M.; Khan, M.A. Antioxidant properties, phenolic composition, bioactive compounds and nutritive value of medicinal halophytes commonly used as herbal teas. S. Afr. J. Bot. 2017, 110, 240–250. [Google Scholar] [CrossRef]
  54. Hossain, S.; El-Sayed, M.; Aoshima, H. Antioxidative and anti-α-amylase activities of four wild plants consumed by pastoral nomads in Egypt. Orient. Pharm. Exp. Med. 2009, 9, 217–224. [Google Scholar] [CrossRef]
  55. Munazir, M.; Qureshi, R.; Munir, M. Preliminary phytochemical screening of roots and aerial parts of Leptadenia pyrotechnica. Pak. J. Bot. 2015, 47, 659–664. [Google Scholar]
  56. Alqasoumi, S.I.; Soliman, G.A.E.H.; Awaad, A.S.; Donia, A.E.R.M. Anti-inflammatory activity, safety and protective effects of Leptadenia pyrotechnica, Haloxylon salicornicum and Ochradenus baccatus in ulcerative colitis. Phytopharmacology 2012, 2, 58–71. [Google Scholar]
  57. Munazir, M.; Qureshi, R.; Munir, M. In vitro antioxidant activity of methanolic extracts of various parts of Leptadenia pyrotechnica (Forssk.) Decne. Pak. J. Pharm. Sci. 2015, 28, 535–539. [Google Scholar] [PubMed]
  58. Yadav, S.S.; Rao, A.S.; Sheoran, A.; Singh, N.; Nandal, A.; Bhandoria, M.S.; Ganaie, S.A.; Bansal, P. An ethnomedicinal survey of traditionally used medicinal plants from Charkhi Dadri District, Haryana: An attempt towards documentation and preservation of ethnic knowledge. Indian J. Tradit. Knowl. IJTK 2021, 20, 436–450. [Google Scholar]
  59. Halliwell, B.; Gutteridge, J.M.C. Formation of a thiobarbituric-acid-reactive substance from deoxyribose in the presence of iron salts. The role of superoxide and hydroxyl radicals. FEBS Lett. 1981, 128, 347–352. [Google Scholar] [CrossRef] [PubMed]
  60. Yoshiki, K.; Nonaka, G.; Nishioka, I.; Chang, J.J.; Lee, K.H. Antitumor agents, 129. Tannins and related compounds as selective cytotoxic agents. J. Nat. Prod. 1992, 55, 1033–1043. [Google Scholar] [CrossRef]
  61. Berard, N.C.; Wang, Y.; Wittenberg, K.M.; Krause, D.O.; Coulman, B.E.; Mcallister, T.A.; Ominski, K.H. Condensed tannin concentrations found in vegetative and mature forage legumes grown in western Canada. Can. J Plant Sci. 2015, 91, 669–675. [Google Scholar] [CrossRef]
  62. Tong, Z.; He, W.; Fan, X.; Guo, A. Biological function of plant tannin and its application in animal health. Front. Vet. Sci. 2021, 8, 803657. [Google Scholar] [CrossRef] [PubMed]
  63. Masood, N.; Jamil, Q.; Aslam, M.I.; Masood, M.I.; Shirazi, J.H.; Jamil, Q.A.; Jan, M.S.; Alsuwayt, B.; Ahmad, A.; Abdullah Alnasser, S.M.; et al. Antioxidant, carbonic anhydrase inhibition and diuretic activity of Leptadenia pyrotechnica Forssk. Decne. Heliyon 2023, 9, e22485. [Google Scholar] [CrossRef] [PubMed]
  64. Nandal, U.; Bhardwaj, R.L. The role of underutilized fruits in nutritional and economic security of tribals: A review. Crit. Rev. Food Sci. Nutr. 2014, 54, 880–890. [Google Scholar] [CrossRef]
  65. NSRDS-NBS: National Standard Reference Data Series, National Bureau of Standards (PDF); U.S. Government Printing Office: Washington, DC, USA, 1972.
  66. Jacox, M.E. Vibrational and electronic energy levels of polyatomic transient molecules. Supplement B. J. Phys. Chem. Ref. Data 2003, 32, 1–441. [Google Scholar] [CrossRef]
  67. Joshi, B.; Agrawal, V.; Kishore, D. Chemical investigation of Leptadenia spartium Part II. Herba Pol. 1988, 34, 85–86. [Google Scholar]
  68. Manavalan, R.; Mithal, B. Constituents of the aerial parts of Leptadenia pyrotechnica. Planta Med. 1980, 39, 95. [Google Scholar] [CrossRef]
  69. Moustafa, A.M.Y.; Khodair, A.; Saleh, M. Phytochemical investigation and toxicological studies of lipid constituents isolated from Leptadenia pyrotechnica. J. Pharmacol. Toxicol. 2007, 2, 681–697. [Google Scholar] [CrossRef]
  70. Kumar, D.D.; Dhayal, K.; Shrama, R.A. Phytosterols from Leptadenia pyrotechnica (Forsk) Decne. Elixir Int. J. 2017, 48714–48716. [Google Scholar]
  71. Moustafa, A.M.Y.; Khodair, A.I.; Saleh, M.A. GC-MS investigation and toxicological evaluation of alkaloids from Leptadenia pyrotechnica. Pharm. Biol. 2009, 47, 994–1003. [Google Scholar] [CrossRef]
  72. Iyer, A.; Bhasin, V.; Joshi, B.C. Chemical investigation of Leptadenia Spartium. I. Herba Pol. 1974, 20, 321–324. [Google Scholar]
  73. Preet, R.; Gupta, R.C.; Pradhan, S.K. Chromatographic determination of β-sitosterol, lupeol, and oleanolic acid in Leptadenia pyrotechnica (Forsk.) Decne.—A botanical source of the ayurvedic drug Jivanti. J. Planar Chromatogr. Mod. TLC 2018, 31, 150–154. [Google Scholar] [CrossRef]
  74. Preet, R.; Gupta, R.C. Simultaneous determination of phenolic compounds in Leptadenia pyrotechnica (Forssk.) Decne. by using high-performance liquid chromatography (HPLC-DAD-UV). Adv. Pharmacol. Sci. 2018, 2018, 9604972. [Google Scholar] [CrossRef]
  75. Dhawan, A.K.; Singh, H. Free pools of amino acids and sugars in Leptadaenia pyrotechnica F. Curr. Sci. 1976, 45, 198. [Google Scholar]
Figure 1. Comparative graph of the quantitative analysis between two parts of LP (stem and root): (a) TPC, (b) TSC, (c) TTC, (d) TFC, (e) TAC. (LPSPE, L. pyrotechnica stem petroleum ether; LPSH, L. pyrotechnica stem hexane; LPSCH, L. pyrotechnica stem chloroform; LPSEA, L. pyrotechnica stem ethyl acetate; LPSE, L. pyrotechnica stem ethanolic; LPSAQ, L. pyrotechnica stem aqueous; LPRPE, L. pyrotechnica root petroleum-ether; LPRH, L. pyrotechnica root hexane; LPRCH, L. pyrotechnica root chloroform; LPREA, L. pyrotechnica root ethyl-acetate; LPRE, L. pyrotechnica root ethanolic; LPRAQ, L. pyrotechnica root aqueous.) Note: values with * (0.01); ** (0.001); *** (0.0001) superscripts were significant (p < 0.05).
Antioxidants 13 00794 g001
Figure 2. In vitro antioxidant assays of both parts of LP: (1) DPPH scavenging assay, (2) NO scavenging assay, (3) H2O2 scavenging assay, (4) MC assay, (5) FRAP assay. Note: (a) LPSPE, LPSSH, LPSCH, LPSEA, LPSE, and LPSAQ extracts of LP stem; (b) LPRPE, LPRH, LPRCH, LPREA, LPRE, and LPRAQ extracts of LP root.
Antioxidants 13 00794 g002
Figure 3. Heat map showing the correlation of phytochemicals with their in vitro antioxidant activities. Note: for stem (STPC, STSC, STTC, STFC, STAC) and root (RTPC, RTSC, RTTC, RTFC, RTAC).
Antioxidants 13 00794 g003
Figure 4. Response surface contour of the central composite design for CSE of (1) TAC, (2) TTC, (3) TPC; (4) pareto chart of central composite design for the CSE of extraction yield. Note: (a) time (h) vs. temperature (°C) (b) time (h) vs. S/M ratio (mL/g), (c) temperature (°C) vs. S/M ratio (mL/g).
Antioxidants 13 00794 g004
Figure 5. Response surface contour of the central composite design for NCUSAE of (1) TAC, (2) TTC, (3) TPC; (4) pareto chart of central composite design for NCUSAE of extraction yield. Note: (a) time (h) vs. temperature (°C); (b) time (h) vs. nominal power (W); (c) temperature (°C) vs. nominal power (W).
Antioxidants 13 00794 g005
Figure 6. FT-IR spectra of all LP extracts: (a) LPSPE, (b) LPSH, (c) LPSCH, (d) LPSEA, (e) LPSE, (f) LPSAQ, (g) LPRPE, (h) LPRH, (i) LPRCH, (j) LPREA, (k) LPSE, (l) LPSAQ extracts.
Antioxidants 13 00794 g006aAntioxidants 13 00794 g006b
Figure 7. UV–visible spectra of both parts of LP: (a) stem, (b) root.
Antioxidants 13 00794 g007
Figure 8. UV–visible spectra of both extraction methods of LP: (a) CSE extracts, (b) NCUSAE extracts.
Antioxidants 13 00794 g008
Figure 9. GC-MS spectra of all LP extracts: (a) LPSPE, (b) LPSH, (c) LPSCH, (d) LPSEA, (e) LPSE, (f) LPSAQ, (g) LPRPE, (h) LPRH, (i) LPRCH, (j) LPREA, (k) LPSE, (l) LPSAQ extracts.
Antioxidants 13 00794 g009aAntioxidants 13 00794 g009b
Table 1. Analysis of variance for the determination of all models of CSE and NCUSAE.
CSENCUSAE
Sources of VariationTPCTACTTC% YieldTPCTACTTC% Yield
R99.90%91.33%96.24%99.25%98.72%95.15%99.79%99.04%
Predicted R99.29%0.00%67.22%92.07%70.89%0.00%97.04%86.88%
Adjusted R99.73%75.73%89.47%97.91%96.40%86.42%99.41%97.32%
PRESS103.4093814.422330.3925.16123582.921782.86129.97241.0171
S1.681215.922747.310870.6885185.622583.981301.355560.773193
Table 2. GC-MS analysis of LP stem extracts.
S. No.Phytochemical CompoundsRT
(min)
Molecular
Formulae
Molecular WeightPeak Area (%)Category
LPSPELPSHLPSCHLPSEALPSELPSAQ
1.1-Propanol, 2-(2-hydroxypropoxy)-10.19C6H14O31341.72-----Glycol ether
2.Hexadecane, 2,6,10,14-tetramethyl25.00C20H422823.07-----Phytane (diterpenoid hydrocarbon)
3.Heptacosane23.93C27H563803.330.140.974.350.14-Alkane
4.Heneicosane28.85C21H442963.47-1.134.35--Alkane
5.7,9-Di-tert-butyl-1-oxaspiro(4,5)deca-6,9-diene-2,8-dione33.21C17H24O32761.13-----Flavonoid
6.Ursolic aldehyde33.21C30H48O24401.13-----Triterpenoid
7.Propanoic acid, 2-methyl-, (dodecahydro-6a-hydroxy-9a-methyl-3-methylene-2,9-dioxoazuleno[4,5-b]fu ran-6-yl)methyl ester33.21C19H26O63501.13-----Sesquiterpenoid
8.Dihydromorphine, 2TMS derivative39.78C23H37NO3Si24311.00-----Morphinane alkaloid
9.à-D-Glucopyranosiduronic acid, 3-(5-ethylhexahydro-2,4,6-trioxo-5-py rimidinyl)-1,1-dimethylpropyl 2,3,4-tris-O-(trimethylsilyl)-, methyl ester39.78C27H52N2O10Si36481.00-----Alpha-D-glucuronic acid (Steroid)
10.1,2-Propanediol, 3-(hexadecyloxy)-, diacetate39.78C23H44O54001.00-----Phenol
11.25-Norisopropyl-9,19-cyclolanostan-2 2-en-24-one, 3-acetoxy-24-phenyl-4,4,14-trimethyl-39.89C35H48O35161.33-----Steroid
12.2,2,4-Trimethyl-3-pentanol3.53C8H18O130-0.38----Terpenoid
13.Cyclohexane, 1,4-dimethyl-4.03C8H16112-0.62----Cycloalkane
14.2-Octanol4.42C8H18O130-0.45----Fatty alcohol
15.3-Hexene, 2-methyl-, (Z)-5.62C7H1498-0.33----Terpenoid
16.3-Methyl-3-hexene5.62C7H1498-0.33----Alkene
17.2,4-Hexanedione, 5,5-dimethyl-7.64C8H14O2142-4.44----Keto-enol tautomer of pivaloylacetone
18.1-Butene-3-ethoxy8.16C6H12O100-21.47----Dialkyl ether
19.Hexanoic acid, 2-oxo-, methyl ester8.75C7H12O3144-3.48----Oxo fatty acid
20.Pentanoic acid, 2-propenyl ester8.90C8H14O2142-0.20----Fatty acid
21.Oxirane, [(hexyloxy)methyl]9.20C9H18O2158-0.42----Hexyl glycidyl ether
22.6,6-Dimethyl-1,3-heptadien-5-ol9.20C9H16O140-0.42----Terpenoid
23.3-Ethyl-3-methyl-2-pentanol9.20C8H18O130-0.42----Terpenoid
24.Hexane, 1,1′-oxybis9.20C12H26O186-0.42----Ether
25.1,5-Heptadien-4-one, 3,3,6-trimethyl-9.69C10H16O152-28.20----Terpenoid
26.Butane, 2,2,3,3-tetramethyl-9.89C8H18144-0.22----Terpenoid
27.Cyclopropane, 1,1,2,2-tetramethyl-10.23C7H1498-5.52----Terpenoid
28.1-Butene, 2,3,3-trimethyl-10.23C7H1498-5.52----Terpene
29.2-Pentene, 4,4-dimethyl-, (E)-10.23C7H1498-5.52----Acyclic olefin
30.Oxalic acid, cyclohexyl pentyl ester10.23C13H22O4242-5.52----Ester of oxalic acid
31.1-Hexanol, 2,2-dimethyl-10.59C8H18O130-0.16----Tertiary alcohol
32.3-Heptanone, 5-methyl-10.59C8H16O128-0.16----Ketone
33.N-Formylglycine18.37C3H5NO3103-1.28----Carbohydrate derivative
34.Carbamic acid, methyl ester18.37C2H5NO275-1.28----Ester of Carbamic acid
35.Hexadecane, 2,6,11,15-tetramethyl28.86C20H42282--0.975.51--Isoprenoid hydrocarbon
36.Tetradecanoic acid29.94C14H28O2228--1.174.90--Saturated fatty acid
37.n-Hexadecanoic acid33.98C16H32O2256--2.964.28--Palmitic acid
38.Octadecanoic acid37.71C18H36O2284--0.93---Saturated fatty acid
39.4,4,5,7,8-Pentamethyl-6-chromanol33.21C14H20O2220--3.59---Vitamin E
40.Benzo[e]isobenzofuran-1,4-dione,1,3,4,5,5a,6,7,8,9,9a-decahydro-6,6,9a-trimethyl33.21C15H20O3248--3.59---Terpenoid
41.l-(+)-Ascorbic acid 2,6-dihexadecanoate33.98C38H68O8652--2.964.28--Vitamin C
42.10-Acetoxy-2-hydroxy-1,2,6a,6b,9,9,1 2a-heptamethyl-1,3,4,5,6,6a,6b,7,8,8a, 9,10,11,12,12a,12b,13,14b-octadecahy dro-2H-picene-4a-carboxylic acid,40.19C33H52O5528--0.62---Terpenoid
43.2,4-Di-tert-butylphenol24.31C14H22O206---1.690.15-Phenol
44.Phenol, 3,5-bis(1,1-dimethylethyl)-24.31C14H22O206---1.690.15-Phenol
45.2,6,10-Trimethyltridecane25.46C16H34226---1.55--Terpenoid
46.Tridecane, 2-methyl-25.46C14H30198---1.55--Terpenoid
47.Hexadecanoic acid, 2-hydroxy-1-(hydroxymethyl)ethyl ester41.88C19H38O4330---3.56--Fatty acid ester
48.Glycerol 1-palmitate41.88C19H38O4330---3.56--Monoacylglycerols
49.Octadecanoic acid, 2,3-dihydroxypropyl ester41.88C21H42O4358---3.56--Stearic acid
50.Benzoic acid, 2-benzoyl27.12C14H10O3226----0.10-Aromatic carboxylic acid
51.Myristic acid29.99C14H28O2228----4.90-Fatty acid
52.Phosphonoacetic Acid, 3TMS derivative19.52C11H29O5Psi3356----0.83-Phosphonic acid
53.1,1-Diphenyl-2-phenylthiobut-3-en-1-ol27.12C22H20OS332----0.10-Thioether
54.Benzophenone27.12C13H10O182----0.10-Flavonoid
55.Propanoic acid, 2-methyl-, (dodecahydro-6a-hydroxy-9a-methyl-3-methylene-2,9-dioxoazuleno[4,5-b] furan-6-yl) methyl ester, [3aS-(3aà,6á,6aà,9aá,9bà)]-33.20C19H26O6350----0.22-Terpenoid
56.1,2-Benzenedicarboxylic acid, butyl octyl ester34.00C20H30O4334----0.33-Phthalic acid ester
57.Erucic acid34.58C22H42O2338----0.22-Fatty acid
58.18,19-Secoyohimban-19-oic acid, 16,17,20,21-tetradehydro-16-(hydroxy methyl)-, methyl ester, (15á,16E)-34.58C21H24N2O3352----0.22-Alkaloid (Yohimbine, an indole alkaloid)
59.13-Docosenamide, (Z)34.58C22H43NO337----0.22-Fatty acid amide
60.Oxalic acid, mono-(5-[(2-bromophenyl)(2,2-dimeth ylpropionyloxy)methyl]-7,8-dihydro-5 H-[1,3]dioxolo[4,5-g]isoquinolin-6-yl) ester42.20C24H26BrNO8535----0.14-Dicarboxylic acid
61.5-Benzofuranacetic acid, 6-ethenyl-2,4,5,6,7,7a-hexahydro-3,6-d imethyl-à-methylene-2-oxo-, methyl ester42.20C16H20O4276----0.14-Flavonoid
62.2,6-Dihydroxybenzoic acid, 3TMS derivative14.80C16H30O4Si3370-----0.01Hydroxybenzoic acid
63.2,6-Dihydroxyacetophenone, 2TMS derivative24.01C14H24O3Si2296-----0.01Phenol
64.3,3a-Epoxydicyclopenta[a,d]cyclooctan-4á-ol, 9,10a-dimethyl-6-methylene-3á-isopropyl-33.22C20H32O2304-----0.01Sesquiterpene
65.25-Norisopropyl-9,19-cyclolanostan-22-en-24-one, 3-acetoxy-24-phenyl-4,4,14-trimethyl-40.15C35H48O3516-----0.06Triterpenoid
66.24,25-Dihydroxycholecalciferol40.15C27H44O3416-----0.06Vitamin D
Table 3. GC-MS analysis of LP root extracts.
S. No.Phytochemical CompoundRT
(min)
Molecular
Formulae
Molecular WeightPeak Area (%)Category
LPRPELPRHLPRCHLPREALPRELPRAQ
1.1,5-Heptadien-4-one, 3,3,6-trimethyl-9.02C10H16O1522.18-----Ketone
2.Hexadecane, 2,6,10,14-tetramethyl-33.26C20H422821.74-1.123.02--Phytane
3.Tetratetracontane34.08C44H906181.44-0.88---Alkane
4.Eicosane39.68C20H422825.18--2.90--Alkane
5.Heptacosane28.85C21H442962.16-0.87-0.31-Alkane
6.2-Hexanone4.18C6H12O100-0.26----Ketone
7.(R)-(+)-3-Methylcyclopentanone 85.52C6H10O98-0.24----Cyclic ketone
8.Oxalic acid, cyclohexyl pentyl ester9.51C13H22O4242-40.90----Ester of oxalic acid and cyclohexyl pentanol
9.2,2,4-Trimethyl-3-pentanol3.48C8H18O130-0.20----Phenol
10.2-Hexanol, 2,5-dimethyl-, (S)-13.51C8H18O130-0.10----Terpenoid
11.2-Heptanol, 2-methyl-13.51C8H18O130-0.10----Alcohol
12.3-Allyloxy-1,2 propanediol16.38C6H12O3132-0.47----Glycerol 1-allyl ether
13.1,2,3-Butanetriol16.38C4H10O3106-0.47----Polyol
14.Heptacosane40.66C27H56380-0.080.702.680.760.02Alkane
15.Tetratetracontane40.66C44H90618-0.081.334.000.76-Hydrocarbon compound
16.N-Formylglycine18.34C3H5NO3103-0.93----Carbohydrate derivative
17.(2,3-Diphenylcyclopropyl) methyl phenyl sulfoxide, trans41.24C22H20OS332-0.23----Sulfoxide
18.3-Benzyl-2-phenyl-2,3,4,5-tetrahydro-1H-benzo[d]azepin41.24C23H23N313-0.23----Benzodiazepine derivative
19.Carbamic acid, methyl ester18.34C2H5NO275-0.93----Ester of Carbamic acid
20.1,1′,1″-[5-methyl-1-pentene-1,3,5-triyl] tris-41.24C24H24312-0.23----Terpenoids
21.2-Propanone, 1,1-dichloro-3.38C3H4Cl2O126--1.16---Dichloroacetone
22.Propane, 1,1,3,3-tetrachloro-2-methyl-54.69C4H6Cl4194--0.90---Chloroalkane
23.Acetyl chloride, dichloro-11.16C2HCl3O146--1.59---Acetic acid
24.Phenol, 4-chloro-2,6-bis(1,1-dimethylethyl)-25.00C14H21ClO240--2.45---Phenol
25.Tetradecanoic acid29.96C14H28O2228--2.13---Fatty acid
26.n-Hexadecanoic acid33.99C16H32O2256--2.812.14--Palmitic acid
27.l-(+)-Ascorbic acid 2,6-dihexadecanoate33.99C38H68O8652--2.812.14--Vitamin C
28.Octadecanoic acid37.70C18H36O2284--1.04---Stearic acid
29.Hexadecanoic acid, 2-hydroxy-1-(hydroxymethyl)ethyl ester41.87C19H38O4330--2.933.69--Fatty acid ether
30.Glycerol 1-palmitate41.87C19H38O4330--2.933.69--Monoacylglycerol
31.Octadecanoic acid, 2,3-dihydroxypropyl ester41.87C21H24O4358--2.93---Glycerol ester of stearic acid
32.Octadecanoic acid, 2-hydroxy-1,3-propanediyl ester41.87C39H76O5624--2.93---Stearic acid
33.Tetrapentacontane, 1,54-dibromo-42.92C54H108Br2914--0.70---Alkane
34.Octadecanoic acid, 2-hydroxy-1-(hydroxymethyl)ethyl ester44.67C21H24O4358--0.961.63--Fatty acid ester
35.Phenol, 3,5-bis(1,1-dimethylethyl)24.31C14H22O206---1.58--Butylated hydroxytoluene (BHT)
36.2,4-Di-tert-butylphenol24.31C14H22O206---1.58--Phenol
37.Hexadecane, 2,6,11,15-tetramethyl25.01C20H42282---4.63--Crocetane
38.Hexadecanoic acid, 1-(hydroxymethyl)-1,2-ethanediyl ester41.88C35H68O5568---3.69--Palmitic acid
39.Octadecanoic acid,
2-hydroxy-1-(hydroxymethyl)ethyl
ester
44.68C21H42O4358---1.63--Fatty acid ester
40.3-Buten-1-ol, TMS derivative13.04C7H16OSi144----0.11-Homoallyl alcohol
41.1,1-Diphenyl-2-phenylthiobut-3-en-1-ol26.76C22H20OS332----0.15-Thioether (phenylpropanoid)
42.Benzophenone26.76C13H10O182----0.15-Flavonoid
43.Benzoic acid, 2-benzoyl26.76C14H10O3226----0.15-Aromatic carboxylic acid
44.Heptacos-1-ene30.48C27H54378----0.18-Alkene
45.1-Hexadecanol, 2-methyl30.48C17H36O256----0.18-Fatty alcohol
46.1,2-Benzenedicarboxylic acid, butyl 8-methylnonyl ester33.65C22H34O4362----0.280.01Phthalate
47.Phthalic acid, butyl nonyl ester33.65C21H32O4348----0.28-Phthalic acid ester
48.Tetrapentacontane, 1,54-dibromo-40.65C54H108Br2914----0.16-Fatty acid
49.Ethanol, 2-(octadecyloxy)40.65C20H42O2314----0.16-Glycol ether
50.1,2-Propanediol, 3-(octadecyloxy)-, diacetate41.00C25H48O5428----0.420.02Fatty acid ester
51.Oxalic acid,
mono-(5-[(2 bromophenyl) (2,2-dimeth yl propionyloxy) methyl]-7,8-dihydro-5 H-[1,3] dioxolo[4,5-g] isoquinolin-6-yl) ester
41.88C24H26BrNO8535----0.61-Dicarboxylic acid
52.Oleic acid, 3-(octadecyloxy)propyl ester43.90C39H76O3592----0.220.02Fatty acid ester
53.Ethanol, 2-(octadecyloxy)-628.85C20H42O2314-----0.02Fatty alcohol
54.1,2-Benzenedicarboxylic acid, butyl
8-methylnonyl ester
32.16C22H34O4362-----0.01Phthalate
55.7,9-Di-tert-butyl-1-oxaspiro (4,5) deca-6,9-diene-2,8-dione33.20C17H24O3276-----0.02Flavonoid
56.Propanoic acid, 2-methyl-, (dodecahydro-6a-hydroxy-9a-methyl-3-methylene-2,9-dioxoazuleno [4,5-b] furan-6-yl)methyl ester, [3aS-(3aà,6á,6aà,9aá,9bà)]-33.20C19H26O6350-----0.02Sesquiterpenoid
57.Betulinaldehyde33.20C30H48O2440-----0.02Triterpenoid
58.9,10-Secocholesta-5,7,10(19)-triene-3, 24,25-triol, (3á,5Z,7E)-38.06C27H44O3416-----0.02Steroid
59.24,25-Dihydroxycholecalciferol38.06C27H44O3416-----0.02Vitamin D3 derivative
60.Dodecyl cis-9,10-epoxyoctadecanoate39.02C30H58O3466-----0.01Epoxy fatty acid
61.Spirost-8-en-11-one, 3-hydroxy-,
(3á,5à,14á,20á,22á,25R)-
40.61C27H40O4428-----0.02Steroid
Disclaimer/Publisher’s Note: The statements, opinions and data contained in all publications are solely those of the individual author(s) and contributor(s) and not of MDPI and/or the editor(s). MDPI and/or the editor(s) disclaim responsibility for any injury to people or property resulting from any ideas, methods, instructions or products referred to in the content.

