
Bioactivated Glucoraphanin Modulates Genes Involved in Necroptosis on Motor-Neuron-like Nsc-34: A Transcriptomic Study

 , , , ,
Abstract
:1. Introduction
2. Materials and Methods
2.1. Synthesis, Extraction, Purification, and Bioactivation of GRA
2.2. NSC-34 Cell Culture and Treatment
2.3. Cell Differentiation and Treatment
2.4. MTT Assay
2.5. RNA Extraction and cDNA Library Preparation
2.6. Transcriptomic Analysis
2.7. Statistical Analysis
2.8. DEGs Filtering Process
2.9. Bioinformatic Analyses
2.10. Western Blot Analyses
3. Results
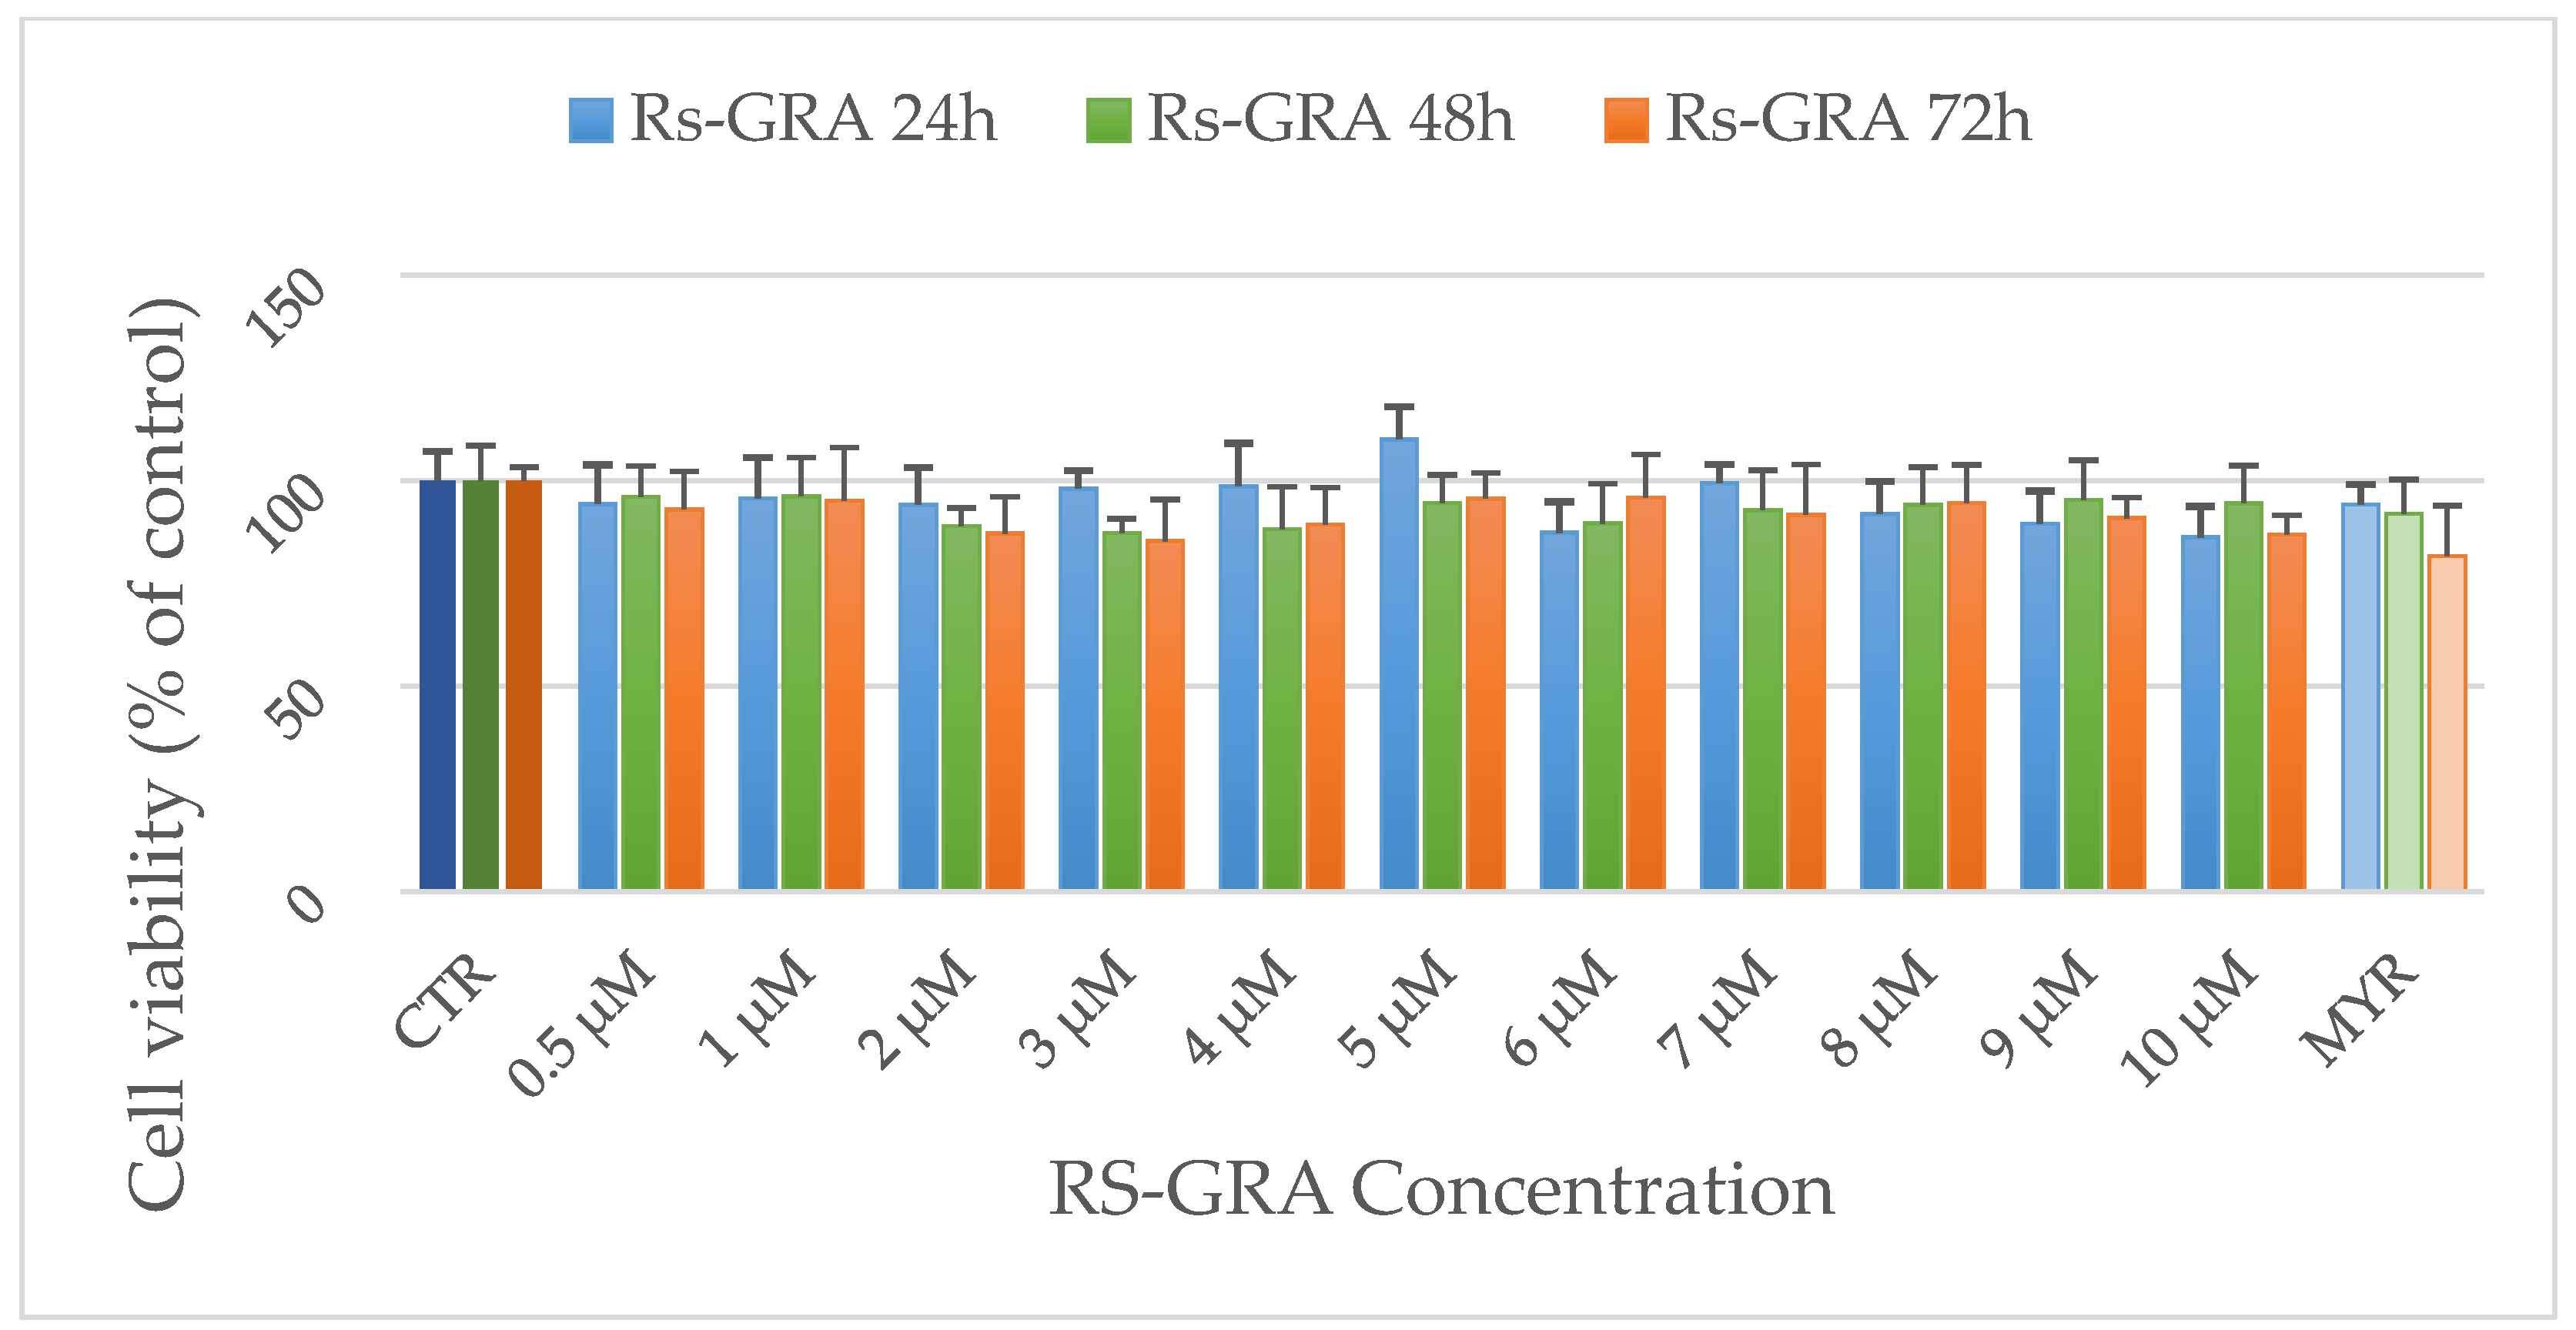
3.1. MTT Assay
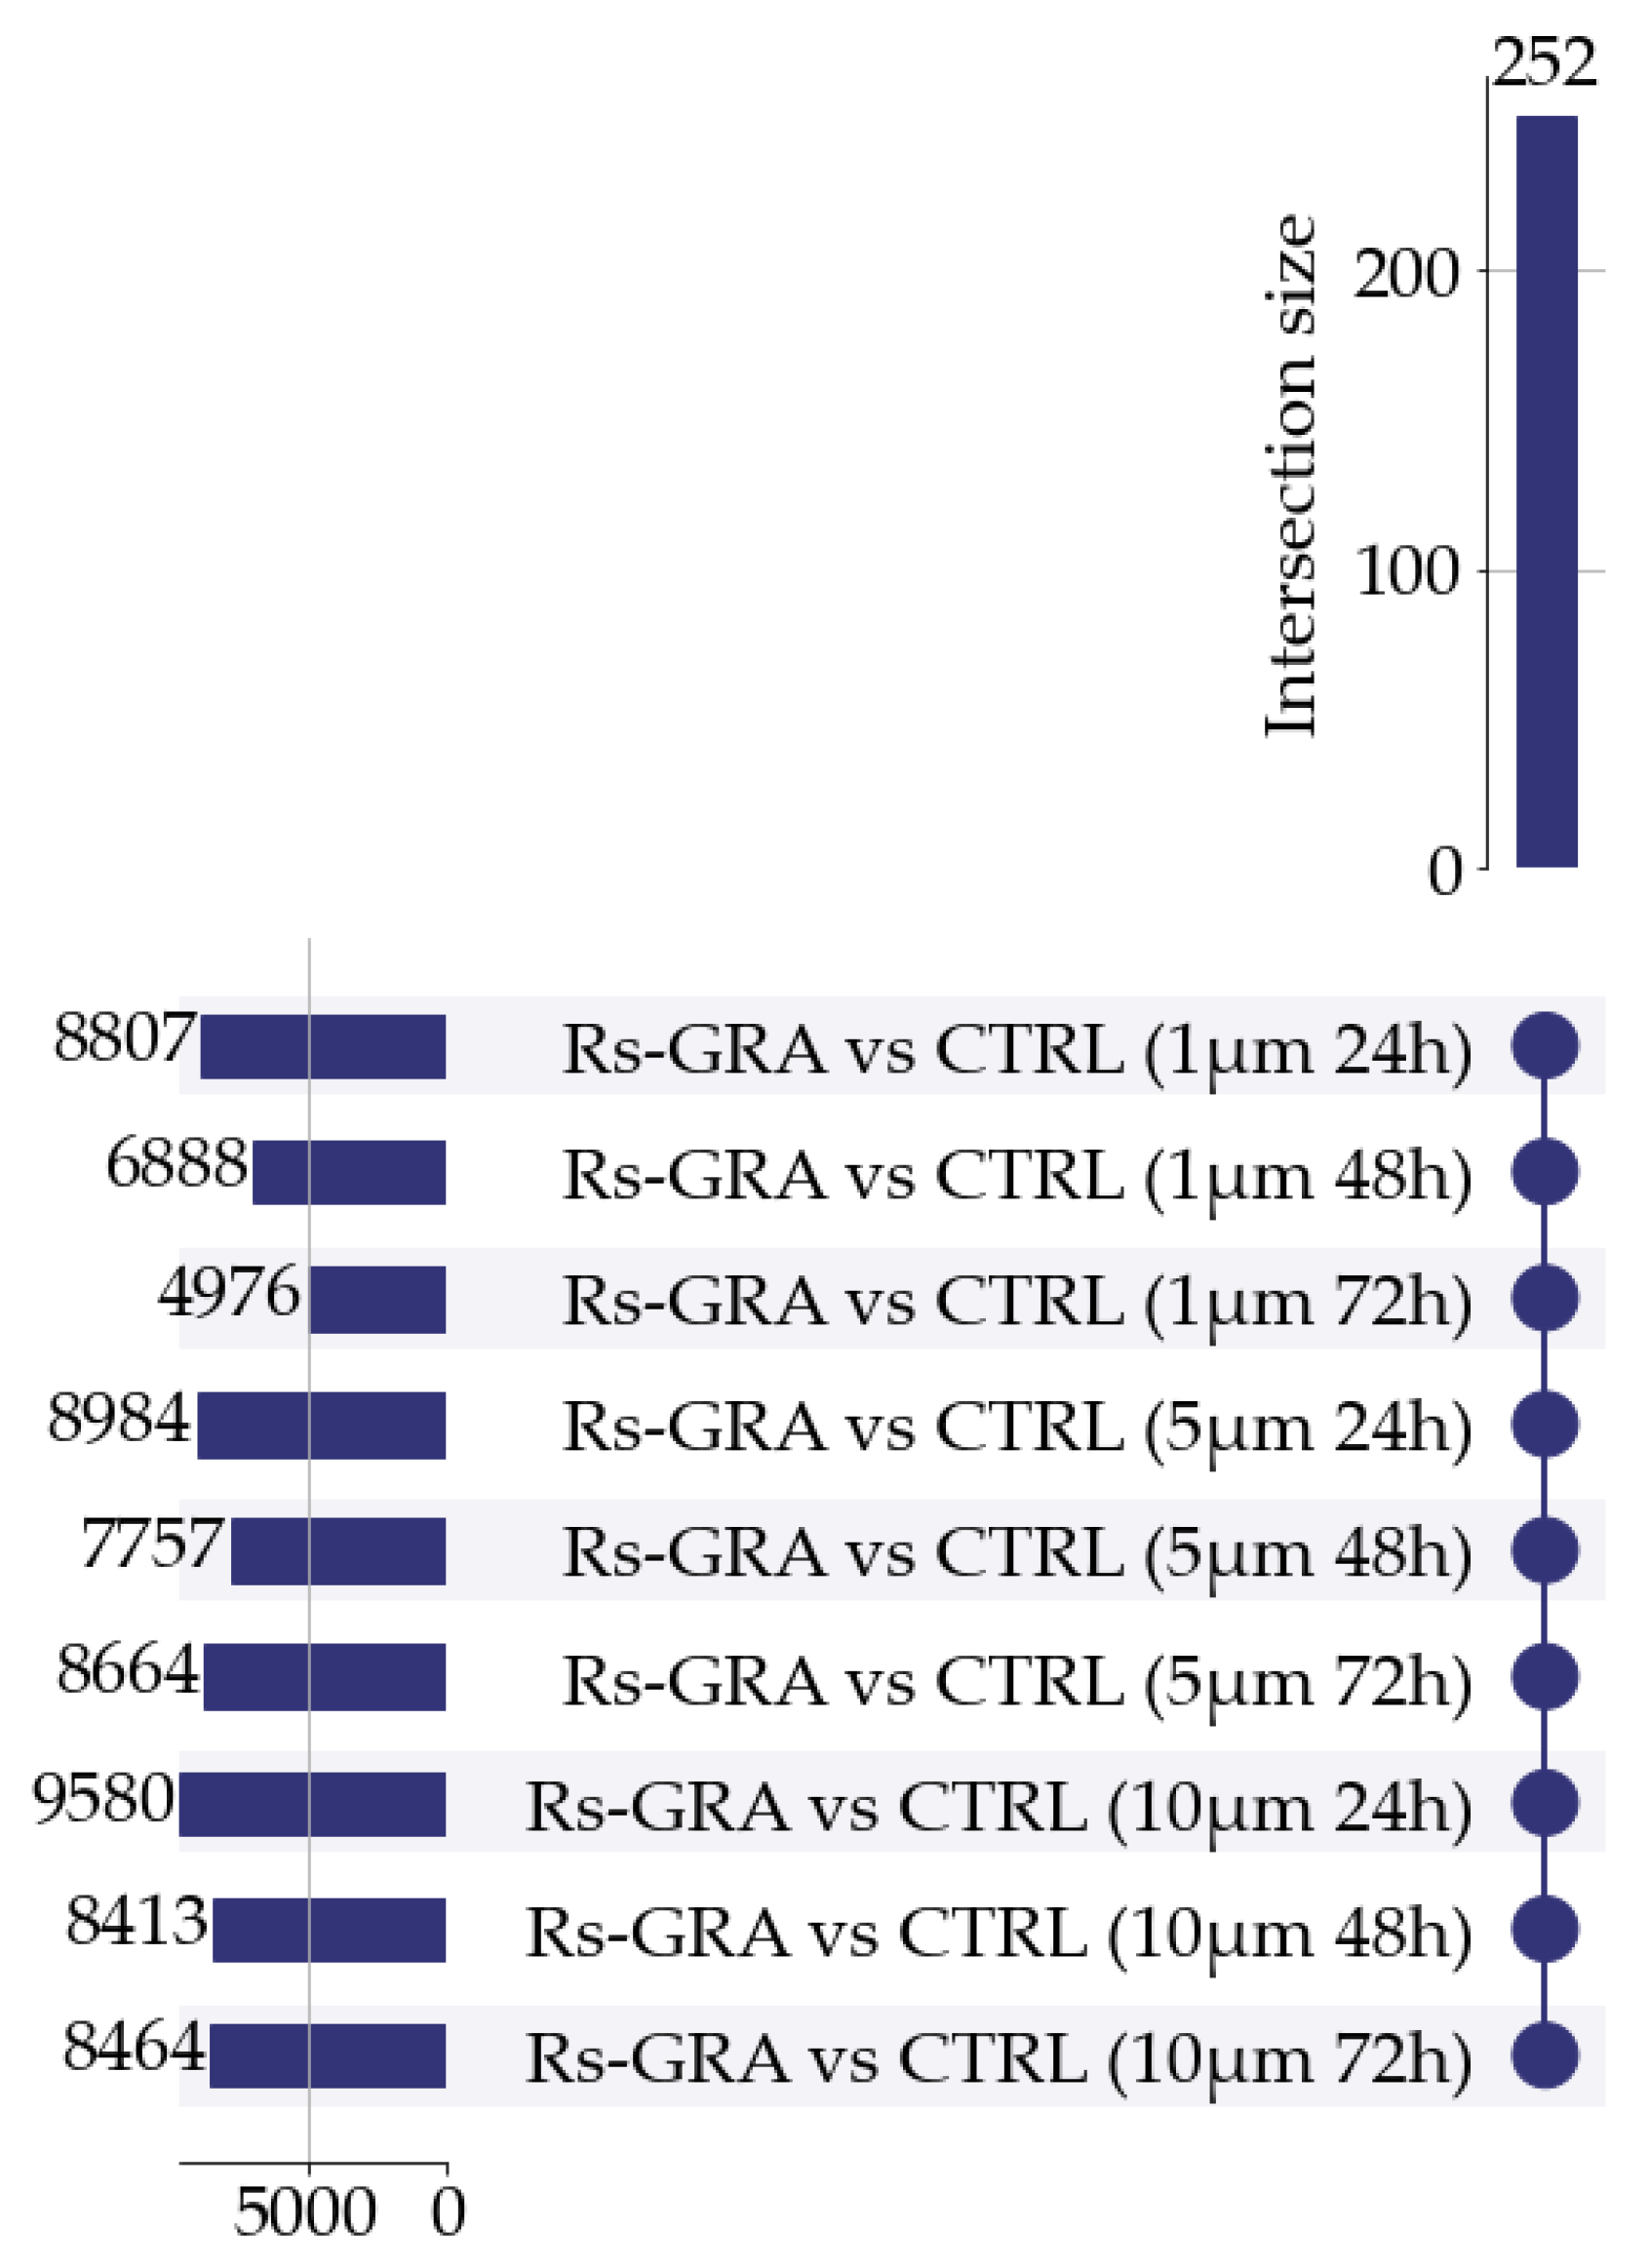
3.2. Differential Expression Analysis (DEA)
3.3. DEGs Filtering and Selection
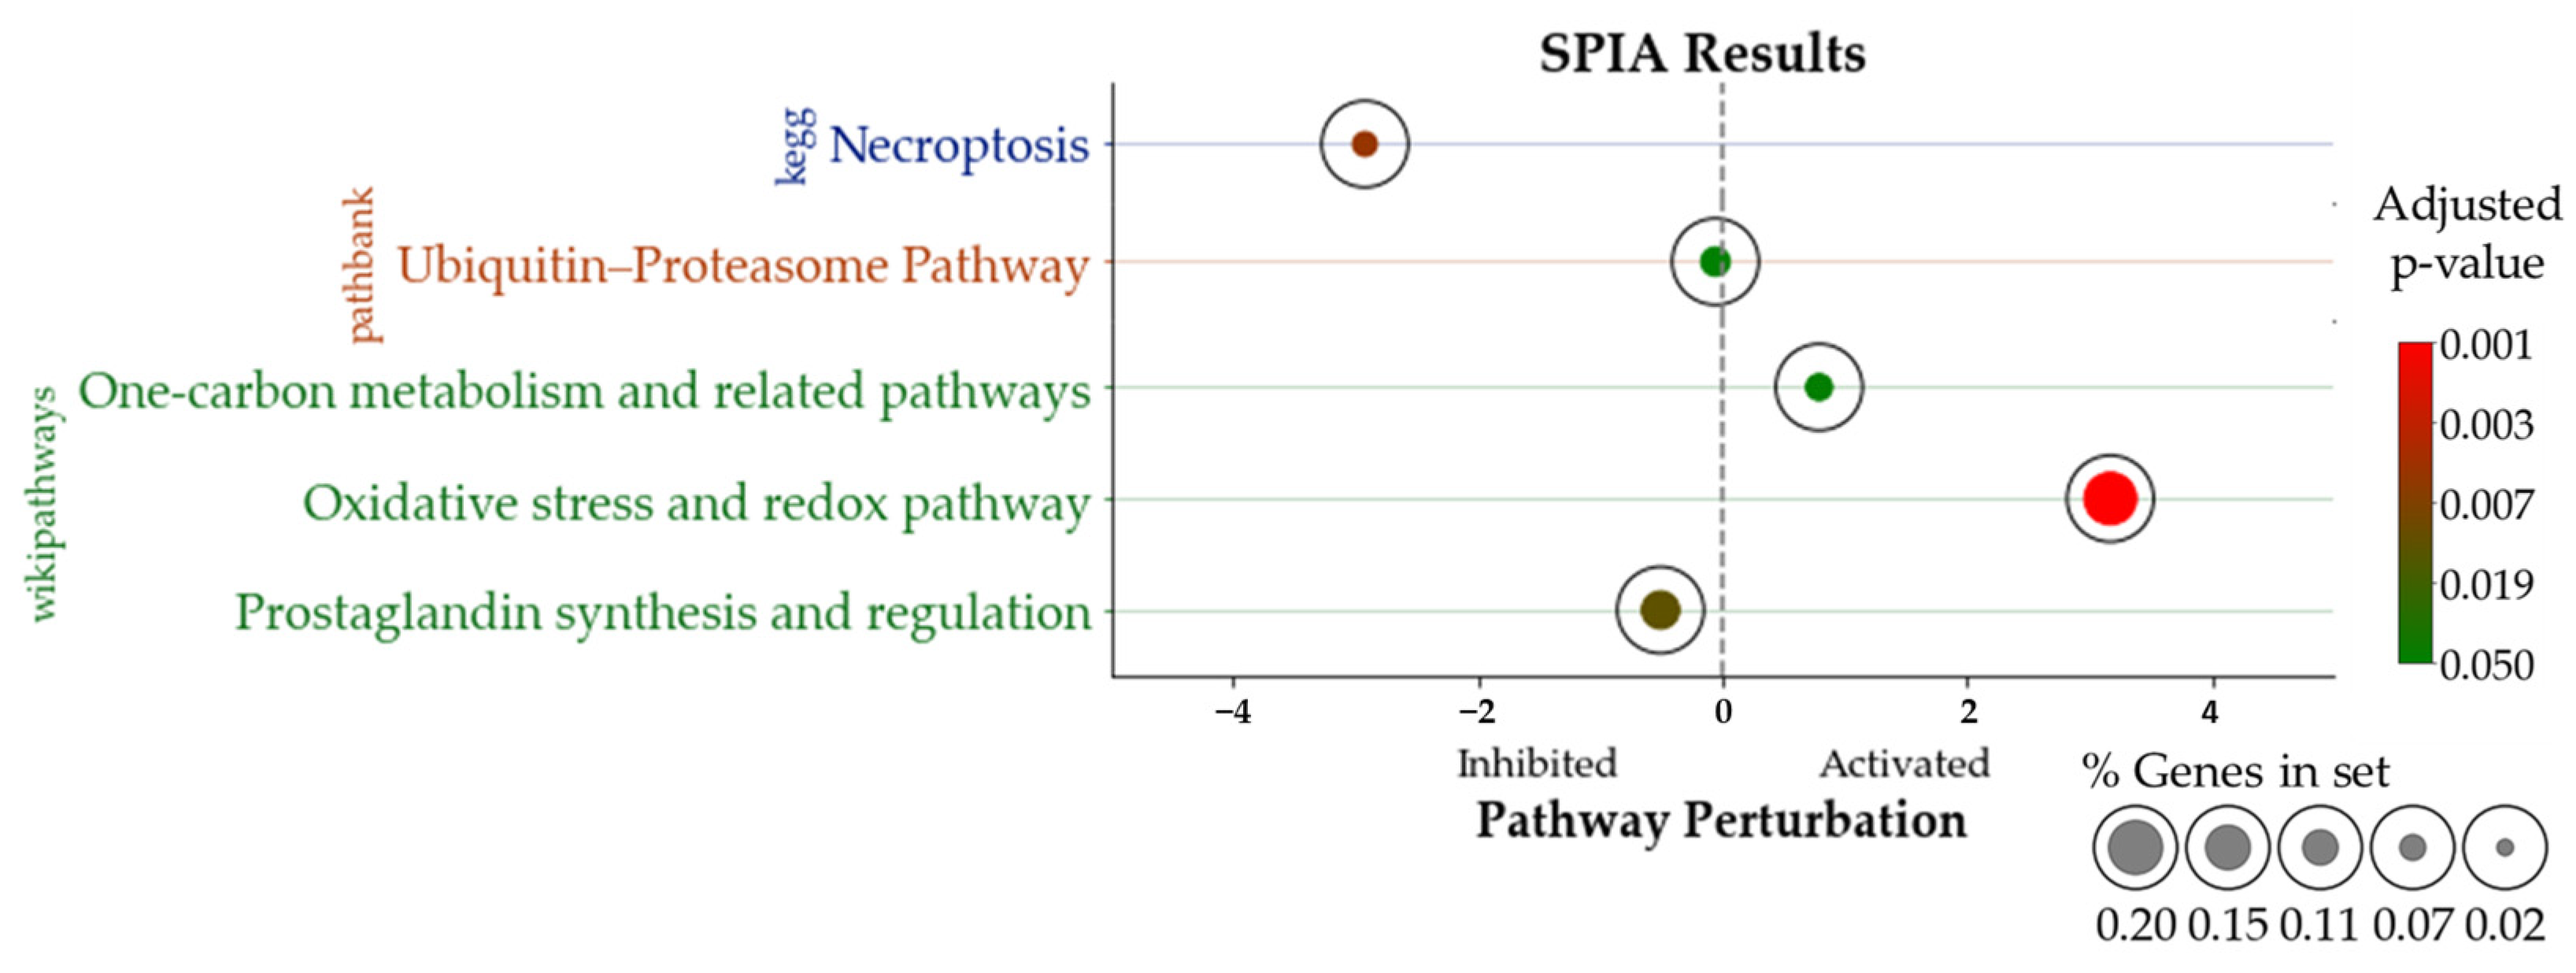
3.4. Signaling Pathway Impact Analysis (SPIA)
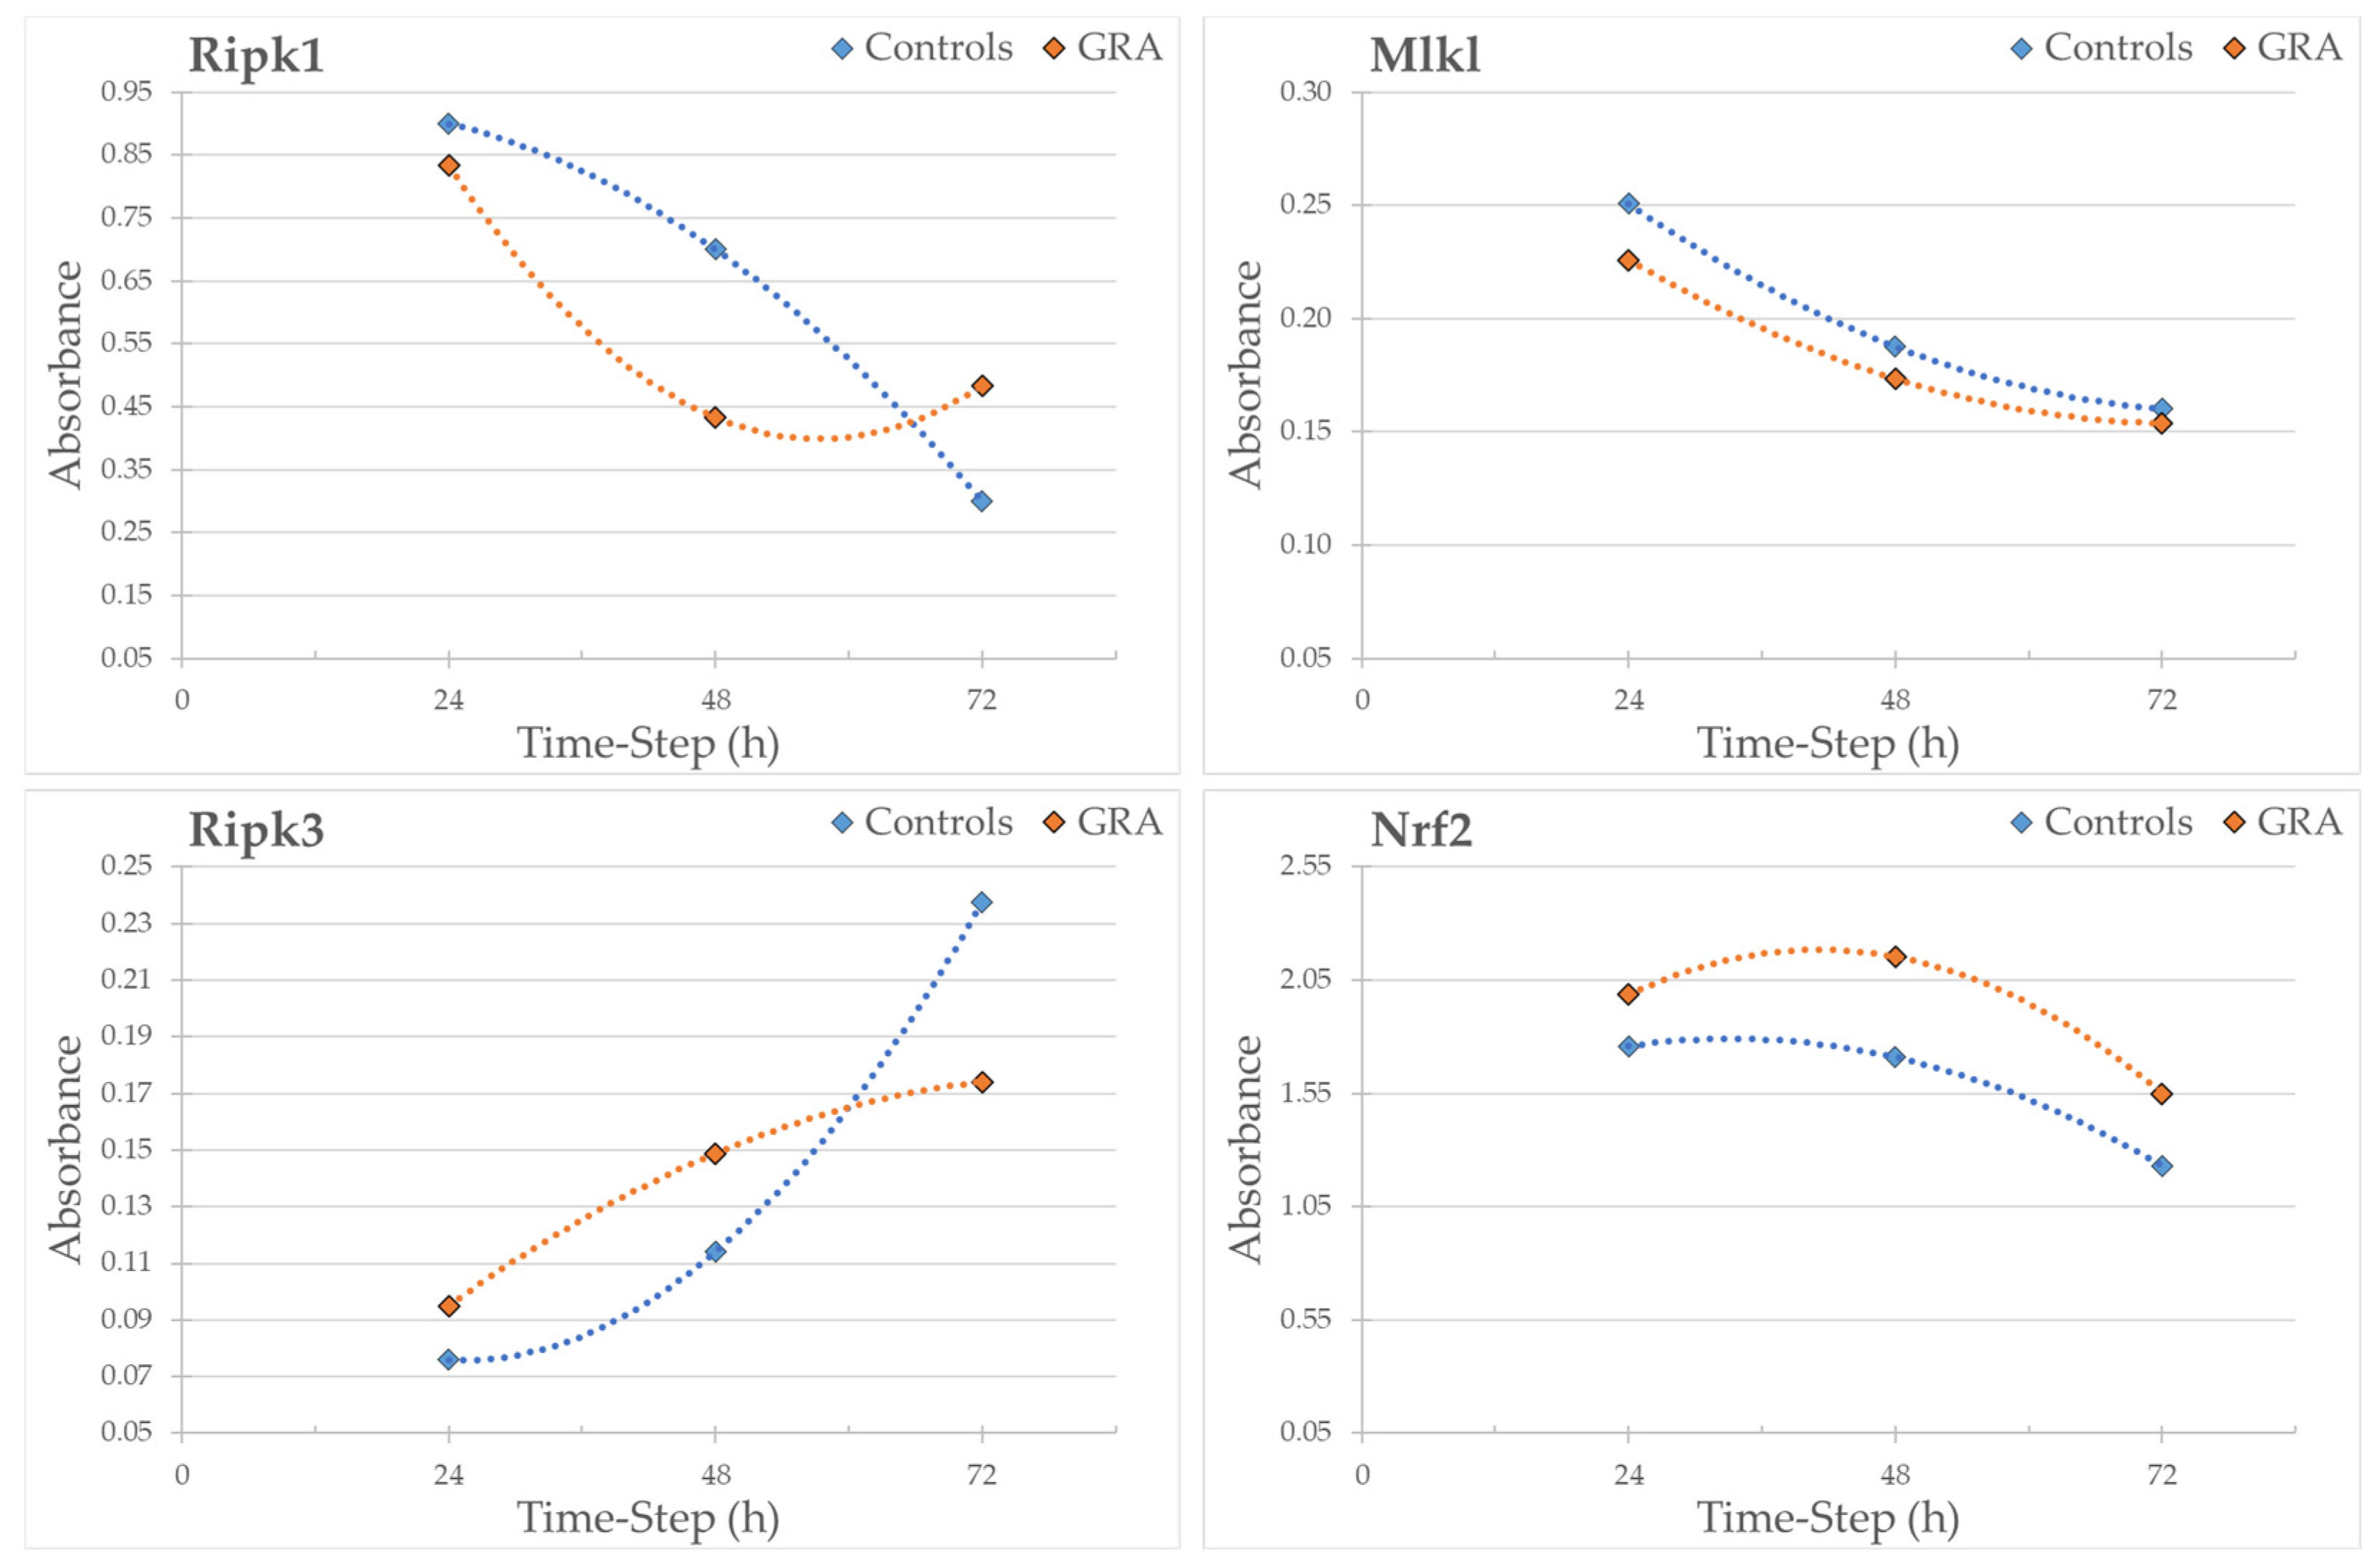
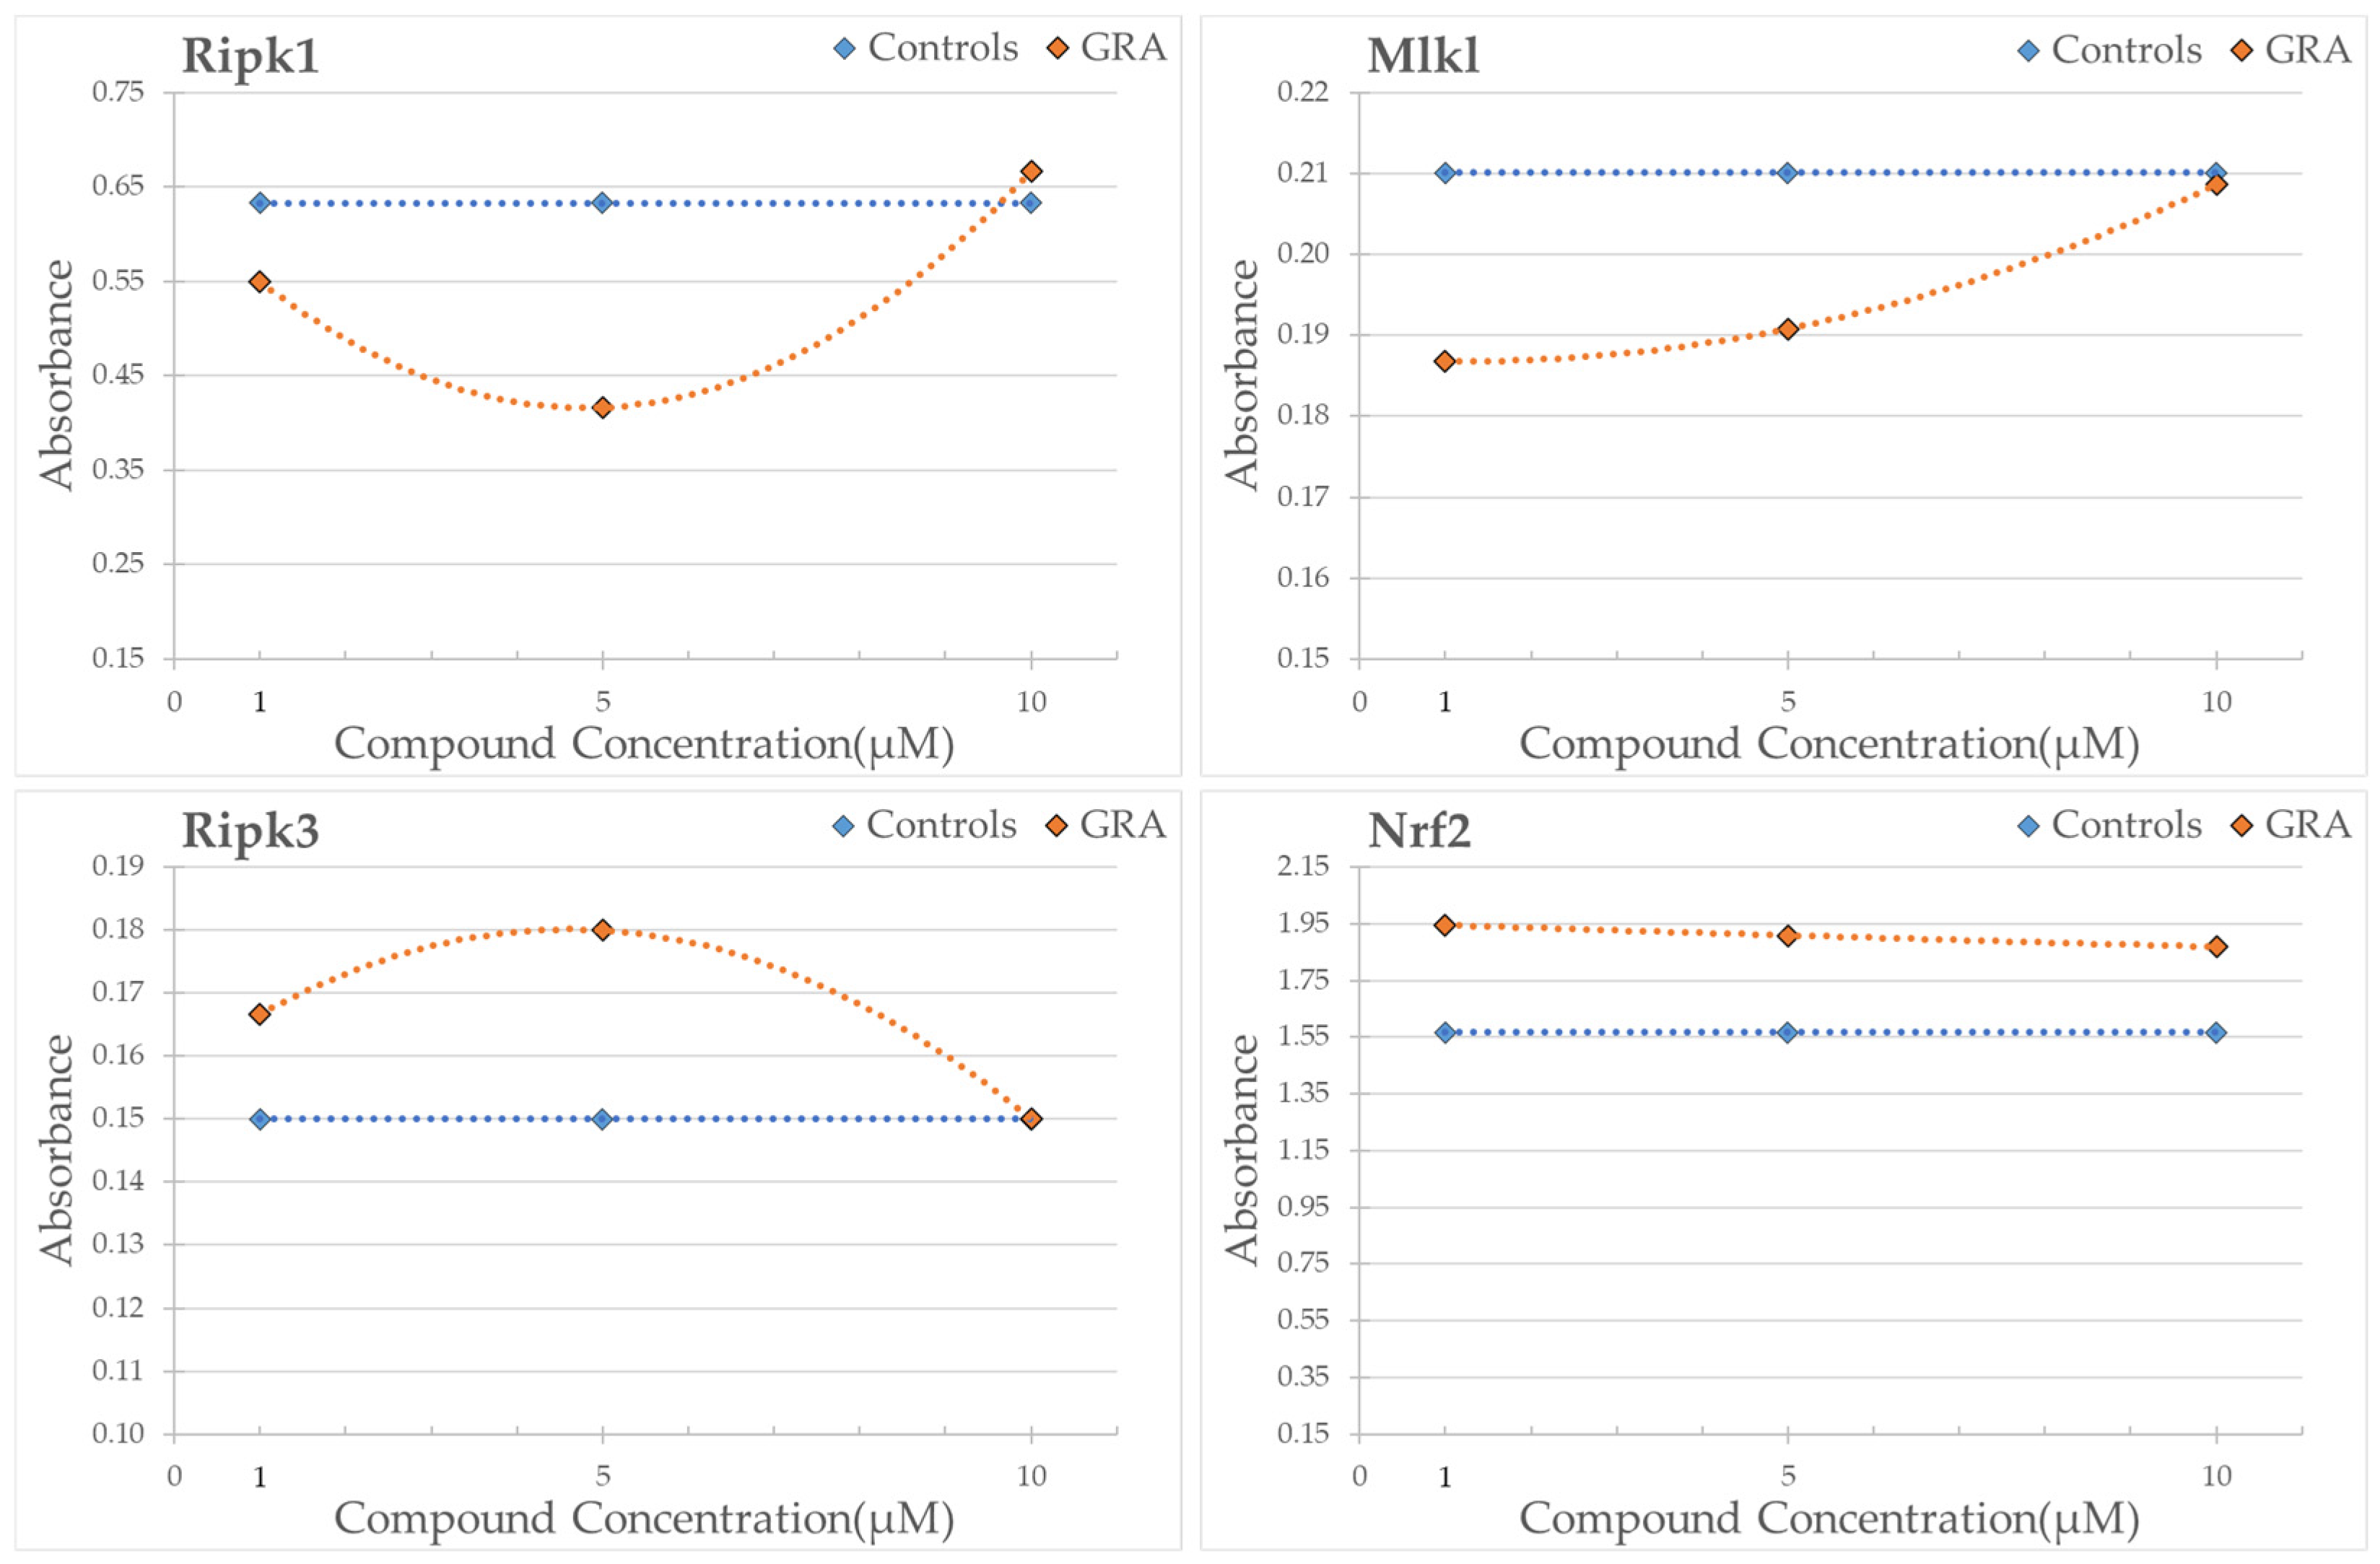
3.5. Western Blot Analysis
4. Discussion
Strenghts and Limits
5. Conclusions
Supplementary Materials
Author Contributions
Funding
Institutional Review Board Statement
Informed Consent Statement
Data Availability Statement
Conflicts of Interest
References
- Samtiya, M.; Aluko, R.E.; Dhewa, T.; Moreno-Rojas, J.M. Potential Health Benefits of Plant Food-Derived Bioactive Components: An Overview. Foods 2021, 10, 839. [Google Scholar] [CrossRef] [PubMed]
- Singh, B.; Singh, J.P.; Kaur, A.; Singh, N. Bioactive compounds in banana and their associated health benefits—A review. Food Chem. 2016, 206, 1–11. [Google Scholar] [CrossRef] [PubMed]
- Liu, R.H. Health-promoting components of fruits and vegetables in the diet. Adv. Nutr. 2013, 4, 384S–392S. [Google Scholar] [CrossRef] [PubMed]
- Zhu, Y.; Lao, F.; Pan, X.; Wu, J. Food Protein-Derived Antioxidant Peptides: Molecular Mechanism, Stability and Bioavailability. Biomolecules 2022, 12, 1622. [Google Scholar] [CrossRef]
- Marino, A.; Battaglini, M.; Moles, N.; Ciofani, G. Natural Antioxidant Compounds as Potential Pharmaceutical Tools against Neurodegenerative Diseases. ACS Omega 2022, 7, 25974–25990. [Google Scholar] [CrossRef]
- Sies, H. Oxidative Stress: Concept and Some Practical Aspects. Antioxidants 2020, 9, 852. [Google Scholar] [CrossRef]
- Pizzino, G.; Irrera, N.; Cucinotta, M.; Pallio, G.; Mannino, F.; Arcoraci, V.; Squadrito, F.; Altavilla, D.; Bitto, A. Oxidative Stress: Harms and Benefits for Human Health. Oxidative Med. Cell. Longev. 2017, 2017, 8416763. [Google Scholar] [CrossRef]
- Rani, V.; Deep, G.; Singh, R.K.; Palle, K.; Yadav, U.C. Oxidative stress and metabolic disorders: Pathogenesis and therapeutic strategies. Life Sci. 2016, 148, 183–193. [Google Scholar] [CrossRef] [PubMed]
- Sharifi-Rad, M.; Anil Kumar, N.V.; Zucca, P.; Varoni, E.M.; Dini, L.; Panzarini, E.; Rajkovic, J.; Tsouh Fokou, P.V.; Azzini, E.; Peluso, I.; et al. Lifestyle, Oxidative Stress, and Antioxidants: Back and Forth in the Pathophysiology of Chronic Diseases. Front. Physiol. 2020, 11, 694. [Google Scholar] [CrossRef]
- Masci, A.; Mattioli, R.; Costantino, P.; Baima, S.; Morelli, G.; Punzi, P.; Giordano, C.; Pinto, A.; Donini, L.M.; d’Erme, M.; et al. Neuroprotective Effect of Brassica oleracea Sprouts Crude Juice in a Cellular Model of Alzheimer’s Disease. Oxidative Med. Cell. Longev. 2015, 2015, 781938. [Google Scholar] [CrossRef]
- Zhou, Q.; Chen, B.; Wang, X.; Wu, L.; Yang, Y.; Cheng, X.; Hu, Z.; Cai, X.; Yang, J.; Sun, X.; et al. Sulforaphane protects against rotenone-induced neurotoxicity in vivo: Involvement of the mTOR, Nrf2, and autophagy pathways. Sci. Rep. 2016, 6, 32206. [Google Scholar] [CrossRef] [PubMed]
- Andrade, S.; Ramalho, M.J.; Loureiro, J.A.; Pereira, M.D.C. Natural Compounds for Alzheimer’s Disease Therapy: A Systematic Review of Preclinical and Clinical Studies. Int. J. Mol. Sci. 2019, 20, 2313. [Google Scholar] [CrossRef] [PubMed]
- Miękus, N.; Marszałek, K.; Podlacha, M.; Iqbal, A.; Puchalski, C.; Świergiel, A.H. Health Benefits of Plant-Derived Sulfur Compounds, Glucosinolates, and Organosulfur Compounds. Molecules 2020, 25, 3804. [Google Scholar] [CrossRef] [PubMed]
- Kim, S.; Chen, J.; Cheng, T.; Gindulyte, A.; He, J.; He, S.; Li, Q.; Shoemaker, B.A.; Thiessen, P.A.; Yu, B.; et al. PubChem 2023 update. Nucleic Acids Res. 2023, 51, D1373–D1380. [Google Scholar] [CrossRef] [PubMed]
- Jaafaru, M.S.; Abd Karim, N.A.; Enas, M.E.; Rollin, P.; Mazzon, E.; Abdull Razis, A.F. Protective Effect of Glucosinolates Hydrolytic Products in Neurodegenerative Diseases (NDDs). Nutrients 2018, 10, 580. [Google Scholar] [CrossRef]
- Esteve, M. Mechanisms Underlying Biological Effects of Cruciferous Glucosinolate-Derived Isothiocyanates/Indoles: A Focus on Metabolic Syndrome. Front. Nutr. 2020, 7, 111. [Google Scholar] [CrossRef]
- Trio, P.Z.; Fujisaki, S.; Tanigawa, S.; Hisanaga, A.; Sakao, K.; Hou, D.X. DNA Microarray Highlights Nrf2-Mediated Neuron Protection Targeted by Wasabi-Derived Isothiocyanates in IMR-32 Cells. Gene Regul. Syst. Biol. 2016, 10, 73–83. [Google Scholar] [CrossRef]
- Steele, M.L.; Fuller, S.; Patel, M.; Kersaitis, C.; Ooi, L.; Münch, G. Effect of Nrf2 activators on release of glutathione, cysteinylglycine and homocysteine by human U373 astroglial cells. Redox Biol. 2013, 1, 441–445. [Google Scholar] [CrossRef]
- Ruhee, R.T.; Suzuki, K. The Integrative Role of Sulforaphane in Preventing Inflammation, Oxidative Stress and Fatigue: A Review of a Potential Protective Phytochemical. Antioxidants 2020, 9, 521. [Google Scholar] [CrossRef]
- Lee, C.; Park, G.H.; Lee, S.R.; Jang, J.H. Attenuation of β-amyloid-induced oxidative cell death by sulforaphane via activation of NF-E2-related factor 2. Oxidative Med. Cell. Longev. 2013, 2013, 313510. [Google Scholar] [CrossRef]
- Padmakumar, S.; Taha, M.S.; Kadakia, E.; Bleier, B.S.; Amiji, M.M. Delivery of neurotrophic factors in the treatment of age-related chronic neurodegenerative diseases. Expert Opin. Drug Deliv. 2020, 17, 323–340. [Google Scholar] [CrossRef] [PubMed]
- Otoo, R.A.; Allen, A.R. Sulforaphane’s Multifaceted Potential: From Neuroprotection to Anticancer Action. Molecules 2023, 28, 6902. [Google Scholar] [CrossRef] [PubMed]
- Morroni, F.; Sita, G.; Djemil, A.; D’Amico, M.; Pruccoli, L.; Cantelli-Forti, G.; Hrelia, P.; Tarozzi, A. Comparison of Adaptive Neuroprotective Mechanisms of Sulforaphane and its Interconversion Product Erucin in in Vitro and in Vivo Models of Parkinson’s Disease. J. Agric. Food Chem. 2018, 66, 856–865. [Google Scholar] [CrossRef]
- Jang, M.; Cho, I.H. Sulforaphane Ameliorates 3-Nitropropionic Acid-Induced Striatal Toxicity by Activating the Keap1-Nrf2-ARE Pathway and Inhibiting the MAPKs and NF-κB Pathways. Mol. Neurobiol. 2016, 53, 2619–2635. [Google Scholar] [CrossRef]
- Abdull Razis, A.F.; Bagatta, M.; De Nicola, G.R.; Iori, R.; Ioannides, C. Intact glucosinolates modulate hepatic cytochrome P450 and phase II conjugation activities and may contribute directly to the chemopreventive activity of cruciferous vegetables. Toxicology 2010, 277, 74–85. [Google Scholar] [CrossRef]
- ISO 9167:2019; Rapeseed—Determination of Glucosinolates Content—Part 1: Method Using High-Performance Liquid Chromatography. Amendment 1. Geneva, Switzerland, 2013. Available online: https://www.iso.org/standard/61350.html (accessed on 1 September 2013).
- Wagner, A.E.; Ernst, I.; Iori, R.; Desel, C.; Rimbach, G. Sulforaphane but not ascorbigen, indole-3-carbinole and ascorbic acid activates the transcription factor Nrf2 and induces phase-2 and antioxidant enzymes in human keratinocytes in culture. Exp. Dermatol. 2010, 19, 137–144. [Google Scholar] [CrossRef] [PubMed]
- Pessina, A.; Thomas, R.M.; Palmieri, S.; Luisi, P.L. An improved method for the purification of myrosinase and its physicochemical characterization. Arch. Biochem. Biophys. 1990, 280, 383–389. [Google Scholar] [CrossRef]
- Rajan, T.S.; De Nicola, G.R.; Iori, R.; Rollin, P.; Bramanti, P.; Mazzon, E. Anticancer activity of glucomoringin isothiocyanate in human malignant astrocytoma cells. Fitoterapia 2016, 110, 1–7. [Google Scholar] [CrossRef]
- Bolger, A.M.; Lohse, M.; Usadel, B. Trimmomatic: A flexible trimmer for Illumina sequence data. Bioinformatics 2014, 30, 2114–2120. [Google Scholar] [CrossRef]
- Dobin, A.; Davis, C.A.; Schlesinger, F.; Drenkow, J.; Zaleski, C.; Jha, S.; Batut, P.; Chaisson, M.; Gingeras, T.R. STAR: Ultrafast universal RNA-seq aligner. Bioinformatics 2013, 29, 15–21. [Google Scholar] [CrossRef]
- Anders, S.; Pyl, P.T.; Huber, W. HTSeq—A Python framework to work with high-throughput sequencing data. Bioinformatics 2015, 31, 166–169. [Google Scholar] [CrossRef] [PubMed]
- Love, M.I.; Huber, W.; Anders, S. Moderated estimation of fold change and dispersion for RNA-seq data with DESeq2. Genome Biol. 2014, 15, 550. [Google Scholar] [CrossRef] [PubMed]
- Tarca, A.L.; Draghici, S.; Khatri, P.; Hassan, S.S.; Mittal, P.; Kim, J.S.; Kim, C.J.; Kusanovic, J.P.; Romero, R. A novel signaling pathway impact analysis. Bioinformatics 2009, 25, 75–82. [Google Scholar] [CrossRef]
- Sales, G.; Calura, E.; Cavalieri, D.; Romualdi, C. graphite—A Bioconductor package to convert pathway topology to gene network. BMC Bioinform. 2012, 13, 20. [Google Scholar] [CrossRef]
- Sales, G.; Calura, E.; Romualdi, C. metaGraphite-a new layer of pathway annotation to get metabolite networks. Bioinformatics 2019, 35, 1258–1260. [Google Scholar] [CrossRef] [PubMed]
- Hunter, J.D. Matplotlib: A 2D Graphics Environment. Comput. Sci. Eng. 2007, 9, 90–95. [Google Scholar] [CrossRef]
- Waskom, M.L. seaborn: Statistical data visualization. J. Open Source Softw. 2021, 6, 3021. [Google Scholar] [CrossRef]
- Denzer, I.; Münch, G.; Pischetsrieder, M.; Friedland, K. S-allyl-L-cysteine and isoliquiritigenin improve mitochondrial function in cellular models of oxidative and nitrosative stress. Food Chem. 2016, 194, 843–848. [Google Scholar] [CrossRef]
- Morroni, F.; Tarozzi, A.; Sita, G.; Bolondi, C.; Zolezzi Moraga, J.M.; Cantelli-Forti, G.; Hrelia, P. Neuroprotective effect of sulforaphane in 6-hydroxydopamine-lesioned mouse model of Parkinson’s disease. Neurotoxicology 2013, 36, 63–71. [Google Scholar] [CrossRef]
- Klomparens, E.A.; Ding, Y. The neuroprotective mechanisms and effects of sulforaphane. Brain Circ. 2019, 5, 74–83. [Google Scholar] [CrossRef]
- Cashman, N.R.; Durham, H.D.; Blusztajn, J.K.; Oda, K.; Tabira, T.; Shaw, I.T.; Dahrouge, S.; Antel, J.P. Neuroblastoma × spinal cord (NSC) hybrid cell lines resemble developing motor neurons. Dev. Dyn. Off. Publ. Am. Assoc. Anat. 1992, 194, 209–221. [Google Scholar] [CrossRef] [PubMed]
- Kupershmidt, L.; Youdim, M.B.H. The Neuroprotective Activities of the Novel Multi-Target Iron-Chelators in Models of Alzheimer’s Disease, Amyotrophic Lateral Sclerosis and Aging. Cells 2023, 12, 763. [Google Scholar] [CrossRef]
- Taguchi, K.; Yamamoto, M. The KEAP1-NRF2 System in Cancer. Front. Oncol. 2017, 7, 85. [Google Scholar] [CrossRef] [PubMed]
- Ahmed, S.M.; Luo, L.; Namani, A.; Wang, X.J.; Tang, X. Nrf2 signaling pathway: Pivotal roles in inflammation. Biochim. Biophys. Acta. Mol. Basis Dis. 2017, 1863, 585–597. [Google Scholar] [CrossRef]
- Muri, J.; Heer, S.; Matsushita, M.; Pohlmeier, L.; Tortola, L.; Fuhrer, T.; Conrad, M.; Zamboni, N.; Kisielow, J.; Kopf, M. The thioredoxin-1 system is essential for fueling DNA synthesis during T-cell metabolic reprogramming and proliferation. Nat. Commun. 2018, 9, 1851. [Google Scholar] [CrossRef]
- Hashimoto, S.; Matsuba, Y.; Takahashi, M.; Kamano, N.; Watamura, N.; Sasaguri, H.; Takado, Y.; Yoshihara, Y.; Saito, T.; Saido, T.C. Neuronal glutathione loss leads to neurodegeneration involving gasdermin activation. Sci. Rep. 2023, 13, 1109. [Google Scholar] [CrossRef] [PubMed]
- Min, Y.; Kim, M.J.; Lee, S.; Chun, E.; Lee, K.Y. Inhibition of TRAF6 ubiquitin-ligase activity by PRDX1 leads to inhibition of NFKB activation and autophagy activation. Autophagy 2018, 14, 1347–1358. [Google Scholar] [CrossRef] [PubMed]
- Fiore, A.; Zeitler, L.; Russier, M.; Groß, A.; Hiller, M.K.; Parker, J.L.; Stier, L.; Köcher, T.; Newstead, S.; Murray, P.J. Kynurenine importation by SLC7A11 propagates anti-ferroptotic signaling. Mol. Cell 2022, 82, 920–932.e7. [Google Scholar] [CrossRef] [PubMed]
- van der Pol, A.; Gil, A.; Tromp, J.; Silljé, H.H.W.; van Veldhuisen, D.J.; Voors, A.A.; Hoendermis, E.S.; Grote Beverborg, N.; Schouten, E.M.; de Boer, R.A.; et al. OPLAH ablation leads to accumulation of 5-oxoproline, oxidative stress, fibrosis, and elevated fillings pressures: A murine model for heart failure with a preserved ejection fraction. Cardiovasc. Res. 2018, 114, 1871–1882. [Google Scholar] [CrossRef]
- van der Pol, A.; Gil, A.; Silljé, H.H.W.; Tromp, J.; Ovchinnikova, E.S.; Vreeswijk-Baudoin, I.; Hoes, M.; Domian, I.J.; van de Sluis, B.; van Deursen, J.M.; et al. Accumulation of 5-oxoproline in myocardial dysfunction and the protective effects of OPLAH. Sci. Transl. Med. 2017, 9, eaam8574. [Google Scholar] [CrossRef]
- Pederzolli, C.D.; Mescka, C.P.; Zandoná, B.R.; de Moura Coelho, D.; Sgaravatti, A.M.; Sgarbi, M.B.; de Souza Wyse, A.T.; Duval Wannmacher, C.M.; Wajner, M.; Vargas, C.R.; et al. Acute administration of 5-oxoproline induces oxidative damage to lipids and proteins and impairs antioxidant defenses in cerebral cortex and cerebellum of young rats. Metab. Brain Dis. 2010, 25, 145–154. [Google Scholar] [CrossRef] [PubMed]
- Pederzolli, C.D.; Sgaravatti, A.M.; Braum, C.A.; Prestes, C.C.; Zorzi, G.K.; Sgarbi, M.B.; Wyse, A.T.; Wannmacher, C.M.; Wajner, M.; Dutra-Filho, C.S. 5-Oxoproline reduces non-enzymatic antioxidant defenses in vitro in rat brain. Metab. Brain Dis. 2007, 22, 51–65. [Google Scholar] [CrossRef]
- Chidambaram, S.B.; Anand, N.; Varma, S.R.; Ramamurthy, S.; Vichitra, C.; Sharma, A.; Mahalakshmi, A.M.; Essa, M.M. Superoxide dismutase and neurological disorders. IBRO Neurosci. Rep. 2024, 16, 373–394. [Google Scholar] [CrossRef] [PubMed]
- Xue, Q.; Yan, D.; Chen, X.; Li, X.; Kang, R.; Klionsky, D.J.; Kroemer, G.; Chen, X.; Tang, D.; Liu, J. Copper-dependent autophagic degradation of GPX4 drives ferroptosis. Autophagy 2023, 19, 1982–1996. [Google Scholar] [CrossRef] [PubMed]
- Vandenabeele, P.; Galluzzi, L.; Vanden Berghe, T.; Kroemer, G. Molecular mechanisms of necroptosis: An ordered cellular explosion. Nat. Rev. Mol. Cell Biol. 2010, 11, 700–714. [Google Scholar] [CrossRef]
- Cho, Y.S.; Challa, S.; Moquin, D.; Genga, R.; Ray, T.D.; Guildford, M.; Chan, F.K. Phosphorylation-driven assembly of the RIP1-RIP3 complex regulates programmed necrosis and virus-induced inflammation. Cell 2009, 137, 1112–1123. [Google Scholar] [CrossRef]
- Laurien, L.; Nagata, M.; Schünke, H.; Delanghe, T.; Wiederstein, J.L.; Kumari, S.; Schwarzer, R.; Corona, T.; Krüger, M.; Bertrand, M.J.M.; et al. Autophosphorylation at serine 166 regulates RIP kinase 1-mediated cell death and inflammation. Nat. Commun. 2020, 11, 1747. [Google Scholar] [CrossRef]
- Sun, L.; Wang, H.; Wang, Z.; He, S.; Chen, S.; Liao, D.; Wang, L.; Yan, J.; Liu, W.; Lei, X.; et al. Mixed lineage kinase domain-like protein mediates necrosis signaling downstream of RIP3 kinase. Cell 2012, 148, 213–227. [Google Scholar] [CrossRef]
- Murphy, J.M.; Czabotar, P.E.; Hildebrand, J.M.; Lucet, I.S.; Zhang, J.G.; Alvarez-Diaz, S.; Lewis, R.; Lalaoui, N.; Metcalf, D.; Webb, A.I.; et al. The pseudokinase MLKL mediates necroptosis via a molecular switch mechanism. Immunity 2013, 39, 443–453. [Google Scholar] [CrossRef]
- Ju, E.; Park, K.A.; Shen, H.M.; Hur, G.M. The resurrection of RIP kinase 1 as an early cell death checkpoint regulator-a potential target for therapy in the necroptosis era. Exp. Mol. Med. 2022, 54, 1401–1411. [Google Scholar] [CrossRef]
- Jantas, D.; Lason, W. Preclinical Evidence for the Interplay between Oxidative Stress and RIP1-Dependent Cell Death in Neurodegeneration: State of the Art and Possible Therapeutic Implications. Antioxidants 2021, 10, 1518. [Google Scholar] [CrossRef] [PubMed]
- Saleem, S. Apoptosis, Autophagy, Necrosis and Their Multi Galore Crosstalk in Neurodegeneration. Neuroscience 2021, 469, 162–174. [Google Scholar] [CrossRef] [PubMed]
- Wang, T.; Perera, N.D.; Chiam, M.D.F.; Cuic, B.; Wanniarachchillage, N.; Tomas, D.; Samson, A.L.; Cawthorne, W.; Valor, E.N.; Murphy, J.M.; et al. Necroptosis is dispensable for motor neuron degeneration in a mouse model of ALS. Cell Death Differ. 2020, 27, 1728–1739. [Google Scholar] [CrossRef] [PubMed]
- Yang, S.H.; Lee, D.K.; Shin, J.; Lee, S.; Baek, S.; Kim, J.; Jung, H.; Hah, J.M.; Kim, Y. Nec-1 alleviates cognitive impairment with reduction of Aβ and tau abnormalities in APP/PS1 mice. EMBO Mol. Med. 2017, 9, 61–77. [Google Scholar] [CrossRef] [PubMed]
- Caccamo, A.; Branca, C.; Piras, I.S.; Ferreira, E.; Huentelman, M.J.; Liang, W.S.; Readhead, B.; Dudley, J.T.; Spangenberg, E.E.; Green, K.N.; et al. Necroptosis activation in Alzheimer’s disease. Nat. Neurosci. 2017, 20, 1236–1246. [Google Scholar] [CrossRef]
- Oñate, M.; Catenaccio, A.; Salvadores, N.; Saquel, C.; Martinez, A.; Moreno-Gonzalez, I.; Gamez, N.; Soto, P.; Soto, C.; Hetz, C.; et al. The necroptosis machinery mediates axonal degeneration in a model of Parkinson disease. Cell Death Differ. 2020, 27, 1169–1185. [Google Scholar] [CrossRef]
- Hennig, P.; Fenini, G.; Di Filippo, M.; Karakaya, T.; Beer, H.D. The Pathways Underlying the Multiple Roles of p62 in Inflammation and Cancer. Biomedicines 2021, 9, 707. [Google Scholar] [CrossRef]
- Ma, S.; Attarwala, I.Y.; Xie, X.Q. SQSTM1/p62: A Potential Target for Neurodegenerative Disease. ACS Chem. Neurosci. 2019, 10, 2094–2114. [Google Scholar] [CrossRef]
- Ganjam, G.K.; Terpolilli, N.A.; Diemert, S.; Eisenbach, I.; Hoffmann, L.; Reuther, C.; Herden, C.; Roth, J.; Plesnila, N.; Culmsee, C. Cylindromatosis mediates neuronal cell death in vitro and in vivo. Cell Death Differ. 2018, 25, 1394–1407. [Google Scholar] [CrossRef]
- Pirooznia, S.K.; Wang, H.; Panicker, N.; Kumar, M.; Neifert, S.; Dar, M.A.; Lau, E.; Kang, B.G.; Redding-Ochoa, J.; Troncoso, J.C.; et al. Deubiquitinase CYLD acts as a negative regulator of dopamine neuron survival in Parkinson’s disease. Sci. Adv. 2022, 8, eabh1824. [Google Scholar] [CrossRef]
- Swanson, K.V.; Deng, M.; Ting, J.P. The NLRP3 inflammasome: Molecular activation and regulation to therapeutics. Nat. Rev. Immunol. 2019, 19, 477–489. [Google Scholar] [CrossRef] [PubMed]
- Al-Nasser, M.N.; Mellor, I.R.; Carter, W.G. Is L-Glutamate Toxic to Neurons and Thereby Contributes to Neuronal Loss and Neurodegeneration? A Systematic Review. Brain Sci. 2022, 12, 577. [Google Scholar] [CrossRef] [PubMed]
- Liu, Z.; Zhou, T.; Ziegler, A.C.; Dimitrion, P.; Zuo, L. Oxidative Stress in Neurodegenerative Diseases: From Molecular Mechanisms to Clinical Applications. Oxidative Med. Cell. Longev. 2017, 2017, 2525967. [Google Scholar] [CrossRef] [PubMed]
- Mukherjee, A.; Ghosh, K.K.; Chakrabortty, S.; Gulyás, B.; Padmanabhan, P.; Ball, W.B. Mitochondrial Reactive Oxygen Species in Infection and Immunity. Biomolecules 2024, 14, 670. [Google Scholar] [CrossRef] [PubMed]
- Nikseresht, S.; Khodagholi, F.; Nategh, M.; Dargahi, L. RIP1 Inhibition Rescues from LPS-Induced RIP3-Mediated Programmed Cell Death, Distributed Energy Metabolism and Spatial Memory Impairment. J. Mol. Neurosci. MN 2015, 57, 219–230. [Google Scholar] [CrossRef]
- Wu, Y.; Xu, Y.; Sun, J.; Dai, K.; Wang, Z.; Zhang, J. Inhibiting RIPK1-driven neuroinflammation and neuronal apoptosis mitigates brain injury following experimental subarachnoid hemorrhage. Exp. Neurol. 2024, 374, 114705. [Google Scholar] [CrossRef]


| Pathway. | pSize | NDE | pNDE | tA | pPERT | pG | pGFDR | pGFWER | Status |
|---|---|---|---|---|---|---|---|---|---|
| KEGG | |||||||||
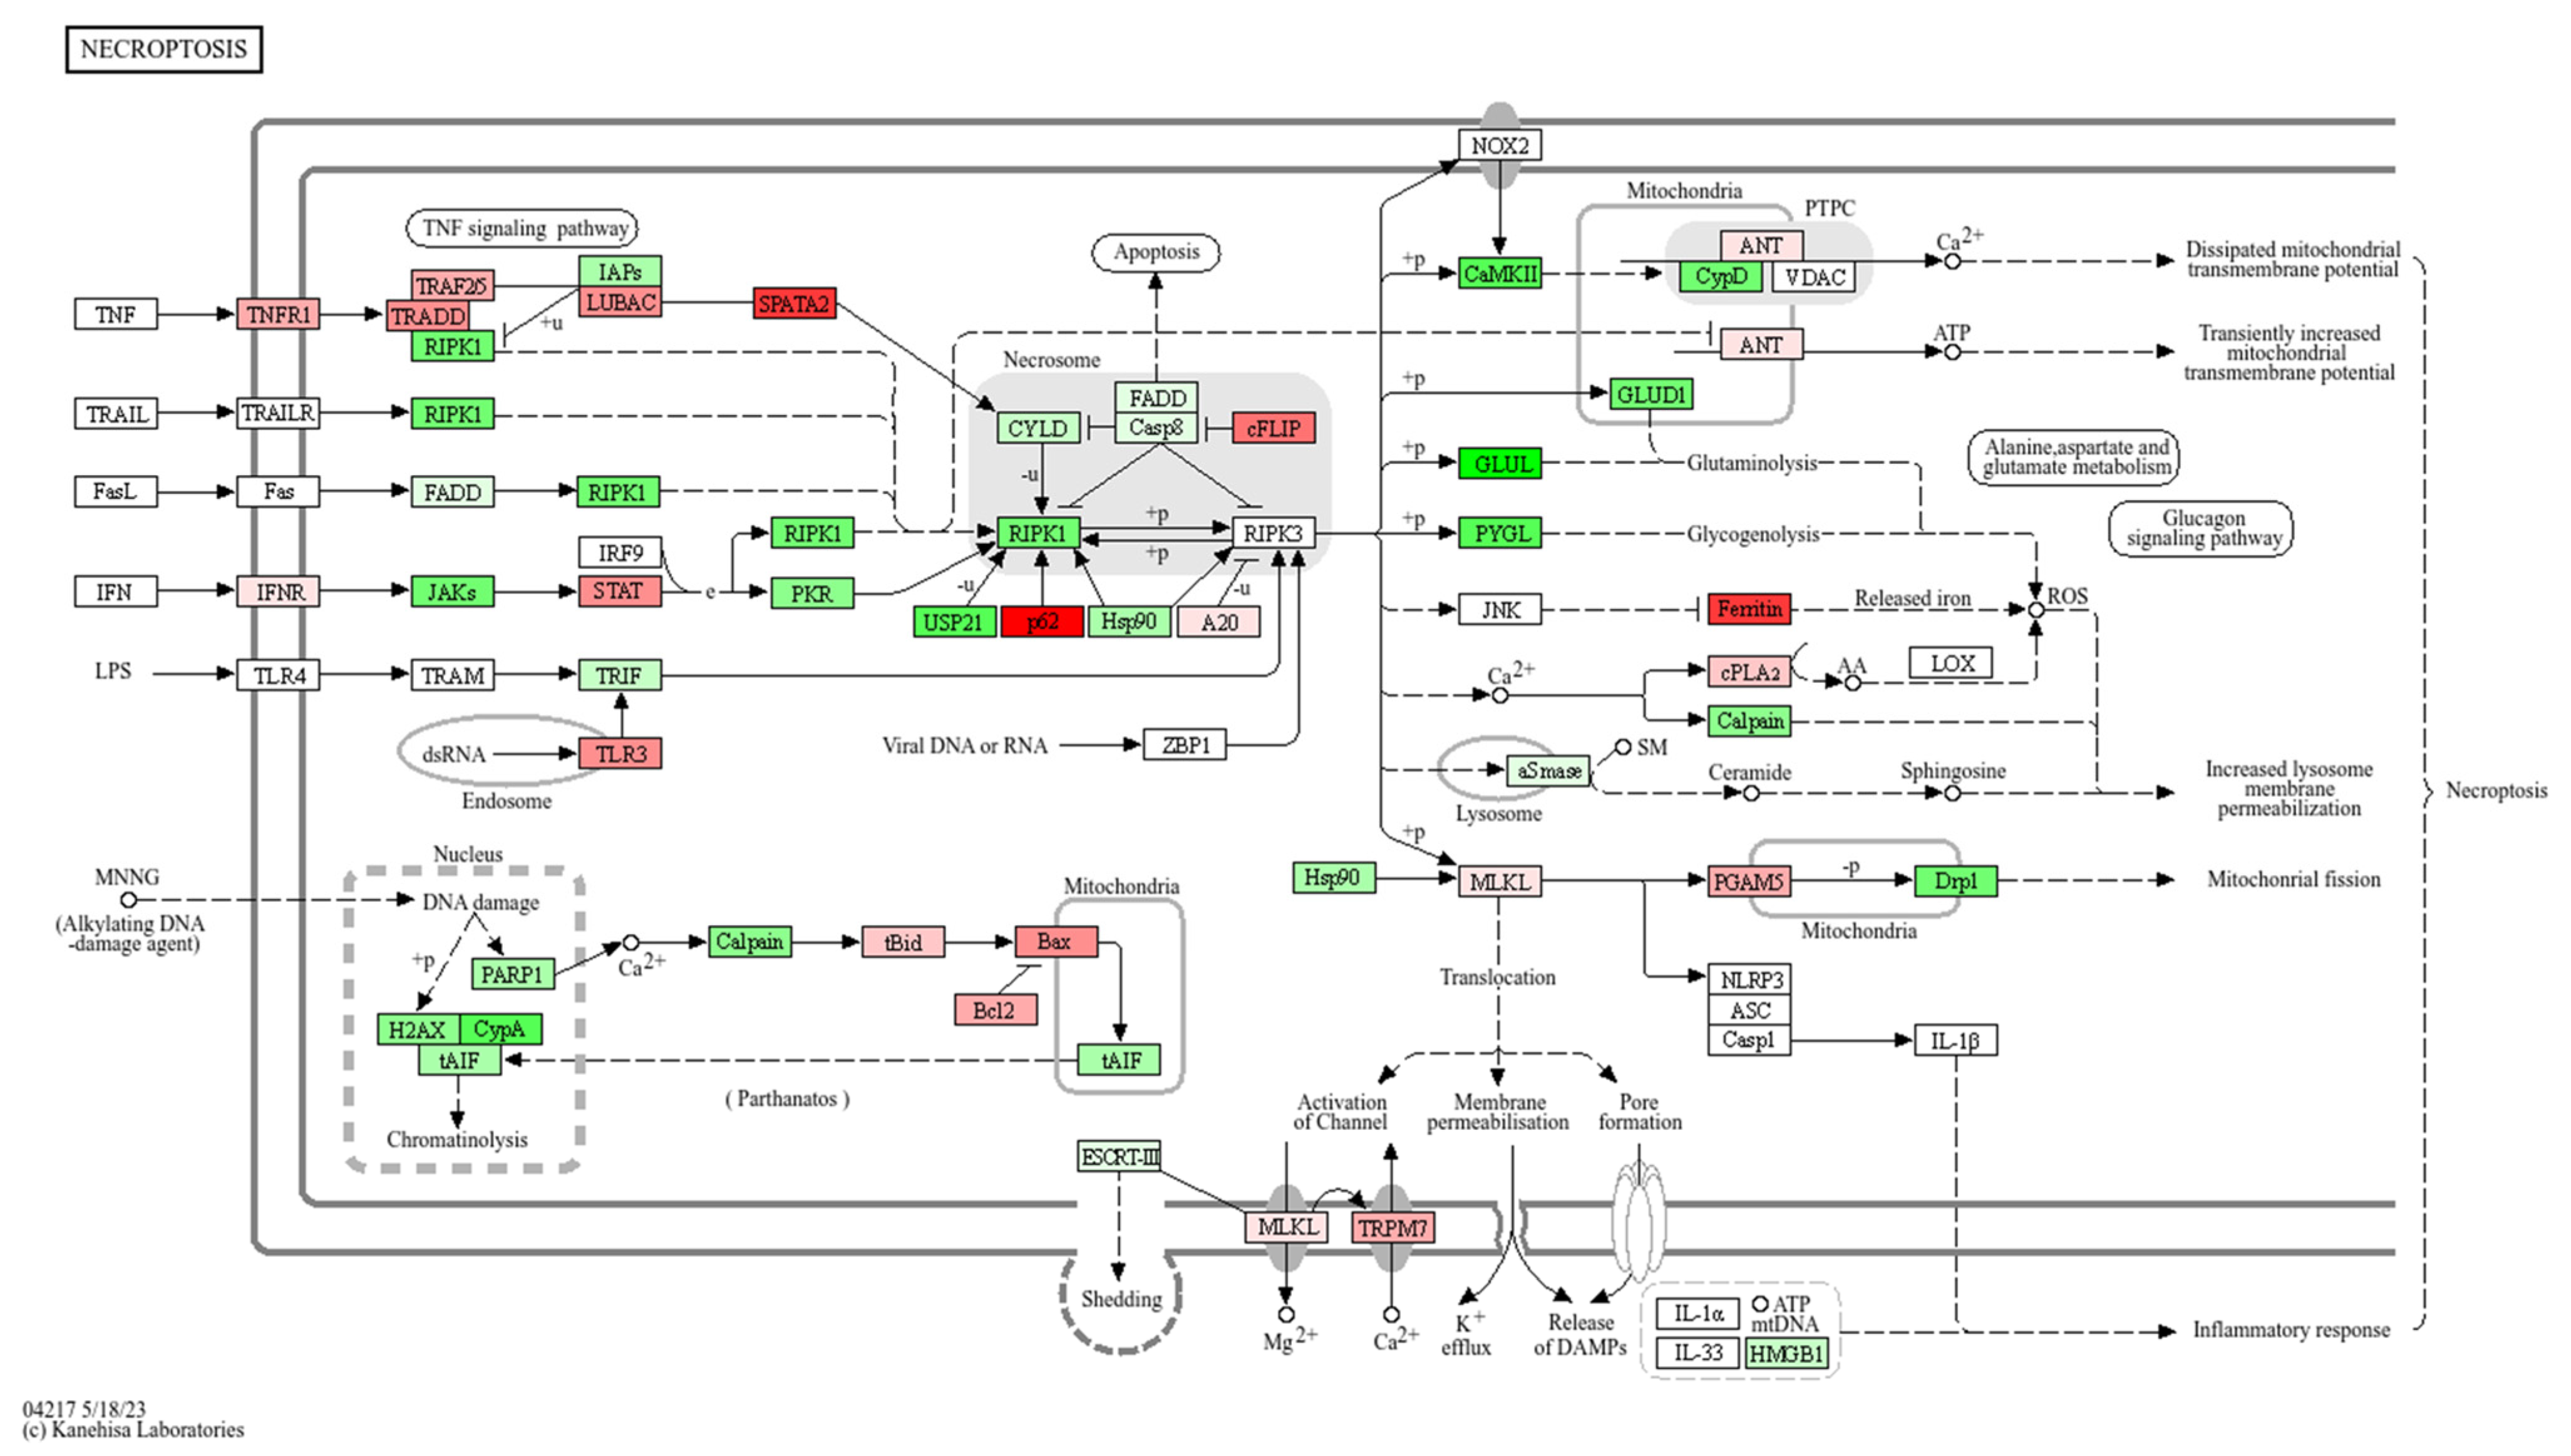
| Necroptosis | 111 | 3 | 2.07 × 10⁻³ | −2.95 | 1.20 × 10⁻² | 1.45 × 10⁻⁴ | 4.64 × 10⁻³ | 4.64 × 10⁻³ | Inhibited |
| PathBank | |||||||||
| Ubiquitin–proteasome pathway | 27 | 1 | 6.00 × 10⁻² | −5.65 × 10⁻² | 1.58 × 10⁻¹ | 3.54 × 10⁻² | 3.54 × 10⁻² | 3.54 × 10⁻² | Inhibited |
| WikiPathways | |||||||||
| Oxidative stress and redox pathway | 65 | 2 | 9.68 × 10⁻³ | 3.17 | 1.60 × 10⁻³ | 9.28 × 10⁻⁵ | 1.11 × 10⁻³ | 1.11 × 10⁻³ | Activated |
| Prostaglandin synthesis and regulation | 11 | 2 | 2.77 × 10⁻⁴ | −5.05 × 10⁻¹ | 1.59 × 10⁻¹ | 8.23 × 10⁻⁴ | 4.94 × 10⁻³ | 9.88 × 10⁻³ | Inhibited |
| One-carbon metabolism and related pathways | 32 | 1 | 7.07 × 10⁻² | 7.92 × 10⁻¹ | 7.20 × 10⁻³ | 2.80 × 10⁻³ | 1.12 × 10⁻² | 3.36 × 10⁻² | Activated |
Disclaimer/Publisher’s Note: The statements, opinions and data contained in all publications are solely those of the individual author(s) and contributor(s) and not of MDPI and/or the editor(s). MDPI and/or the editor(s) disclaim responsibility for any injury to people or property resulting from any ideas, methods, instructions or products referred to in the content. |
© 2024 by the authors. Licensee MDPI, Basel, Switzerland. This article is an open access article distributed under the terms and conditions of the Creative Commons Attribution (CC BY) license (https://creativecommons.org/licenses/by/4.0/).
Share and Cite
Minuti, A.; Trainito, A.; Gugliandolo, A.; Anchesi, I.; Chiricosta, L.; Iori, R.; Mazzon, E.; Calabrò, M. Bioactivated Glucoraphanin Modulates Genes Involved in Necroptosis on Motor-Neuron-like Nsc-34: A Transcriptomic Study. Antioxidants 2024, 13, 1111. https://doi.org/10.3390/antiox13091111
Minuti A, Trainito A, Gugliandolo A, Anchesi I, Chiricosta L, Iori R, Mazzon E, Calabrò M. Bioactivated Glucoraphanin Modulates Genes Involved in Necroptosis on Motor-Neuron-like Nsc-34: A Transcriptomic Study. Antioxidants. 2024; 13(9):1111. https://doi.org/10.3390/antiox13091111
Chicago/Turabian StyleMinuti, Aurelio, Alessandra Trainito, Agnese Gugliandolo, Ivan Anchesi, Luigi Chiricosta, Renato Iori, Emanuela Mazzon, and Marco Calabrò. 2024. "Bioactivated Glucoraphanin Modulates Genes Involved in Necroptosis on Motor-Neuron-like Nsc-34: A Transcriptomic Study" Antioxidants 13, no. 9: 1111. https://doi.org/10.3390/antiox13091111