Untargeted Analysis for Mycosporines and Mycosporine-Like Amino Acids by Hydrophilic Interaction Liquid Chromatography (HILIC)—Electrospray Orbitrap MS2/MS3


Abstract
:1. Introduction
2. Materials and Methods
2.1. Biological Materials, Chemicals and Reagents
Instrumentation
2.2. Methods
2.2.1. Chromatographic Conditions
2.2.2. Untargeted Screening of MAAs
2.2.3. Validation by Targeted Screening of MAAs
2.2.4. Identification of Novel MAAs
2.2.5. Quantitative Analysis of MAAs
3. Results and Discussion
3.1. Extraction of MAAs in Fresh Algal Samples
3.2. Chromatographic Conditions
3.3. Identification of Cancidate-MAAs in Untargeted Analysis
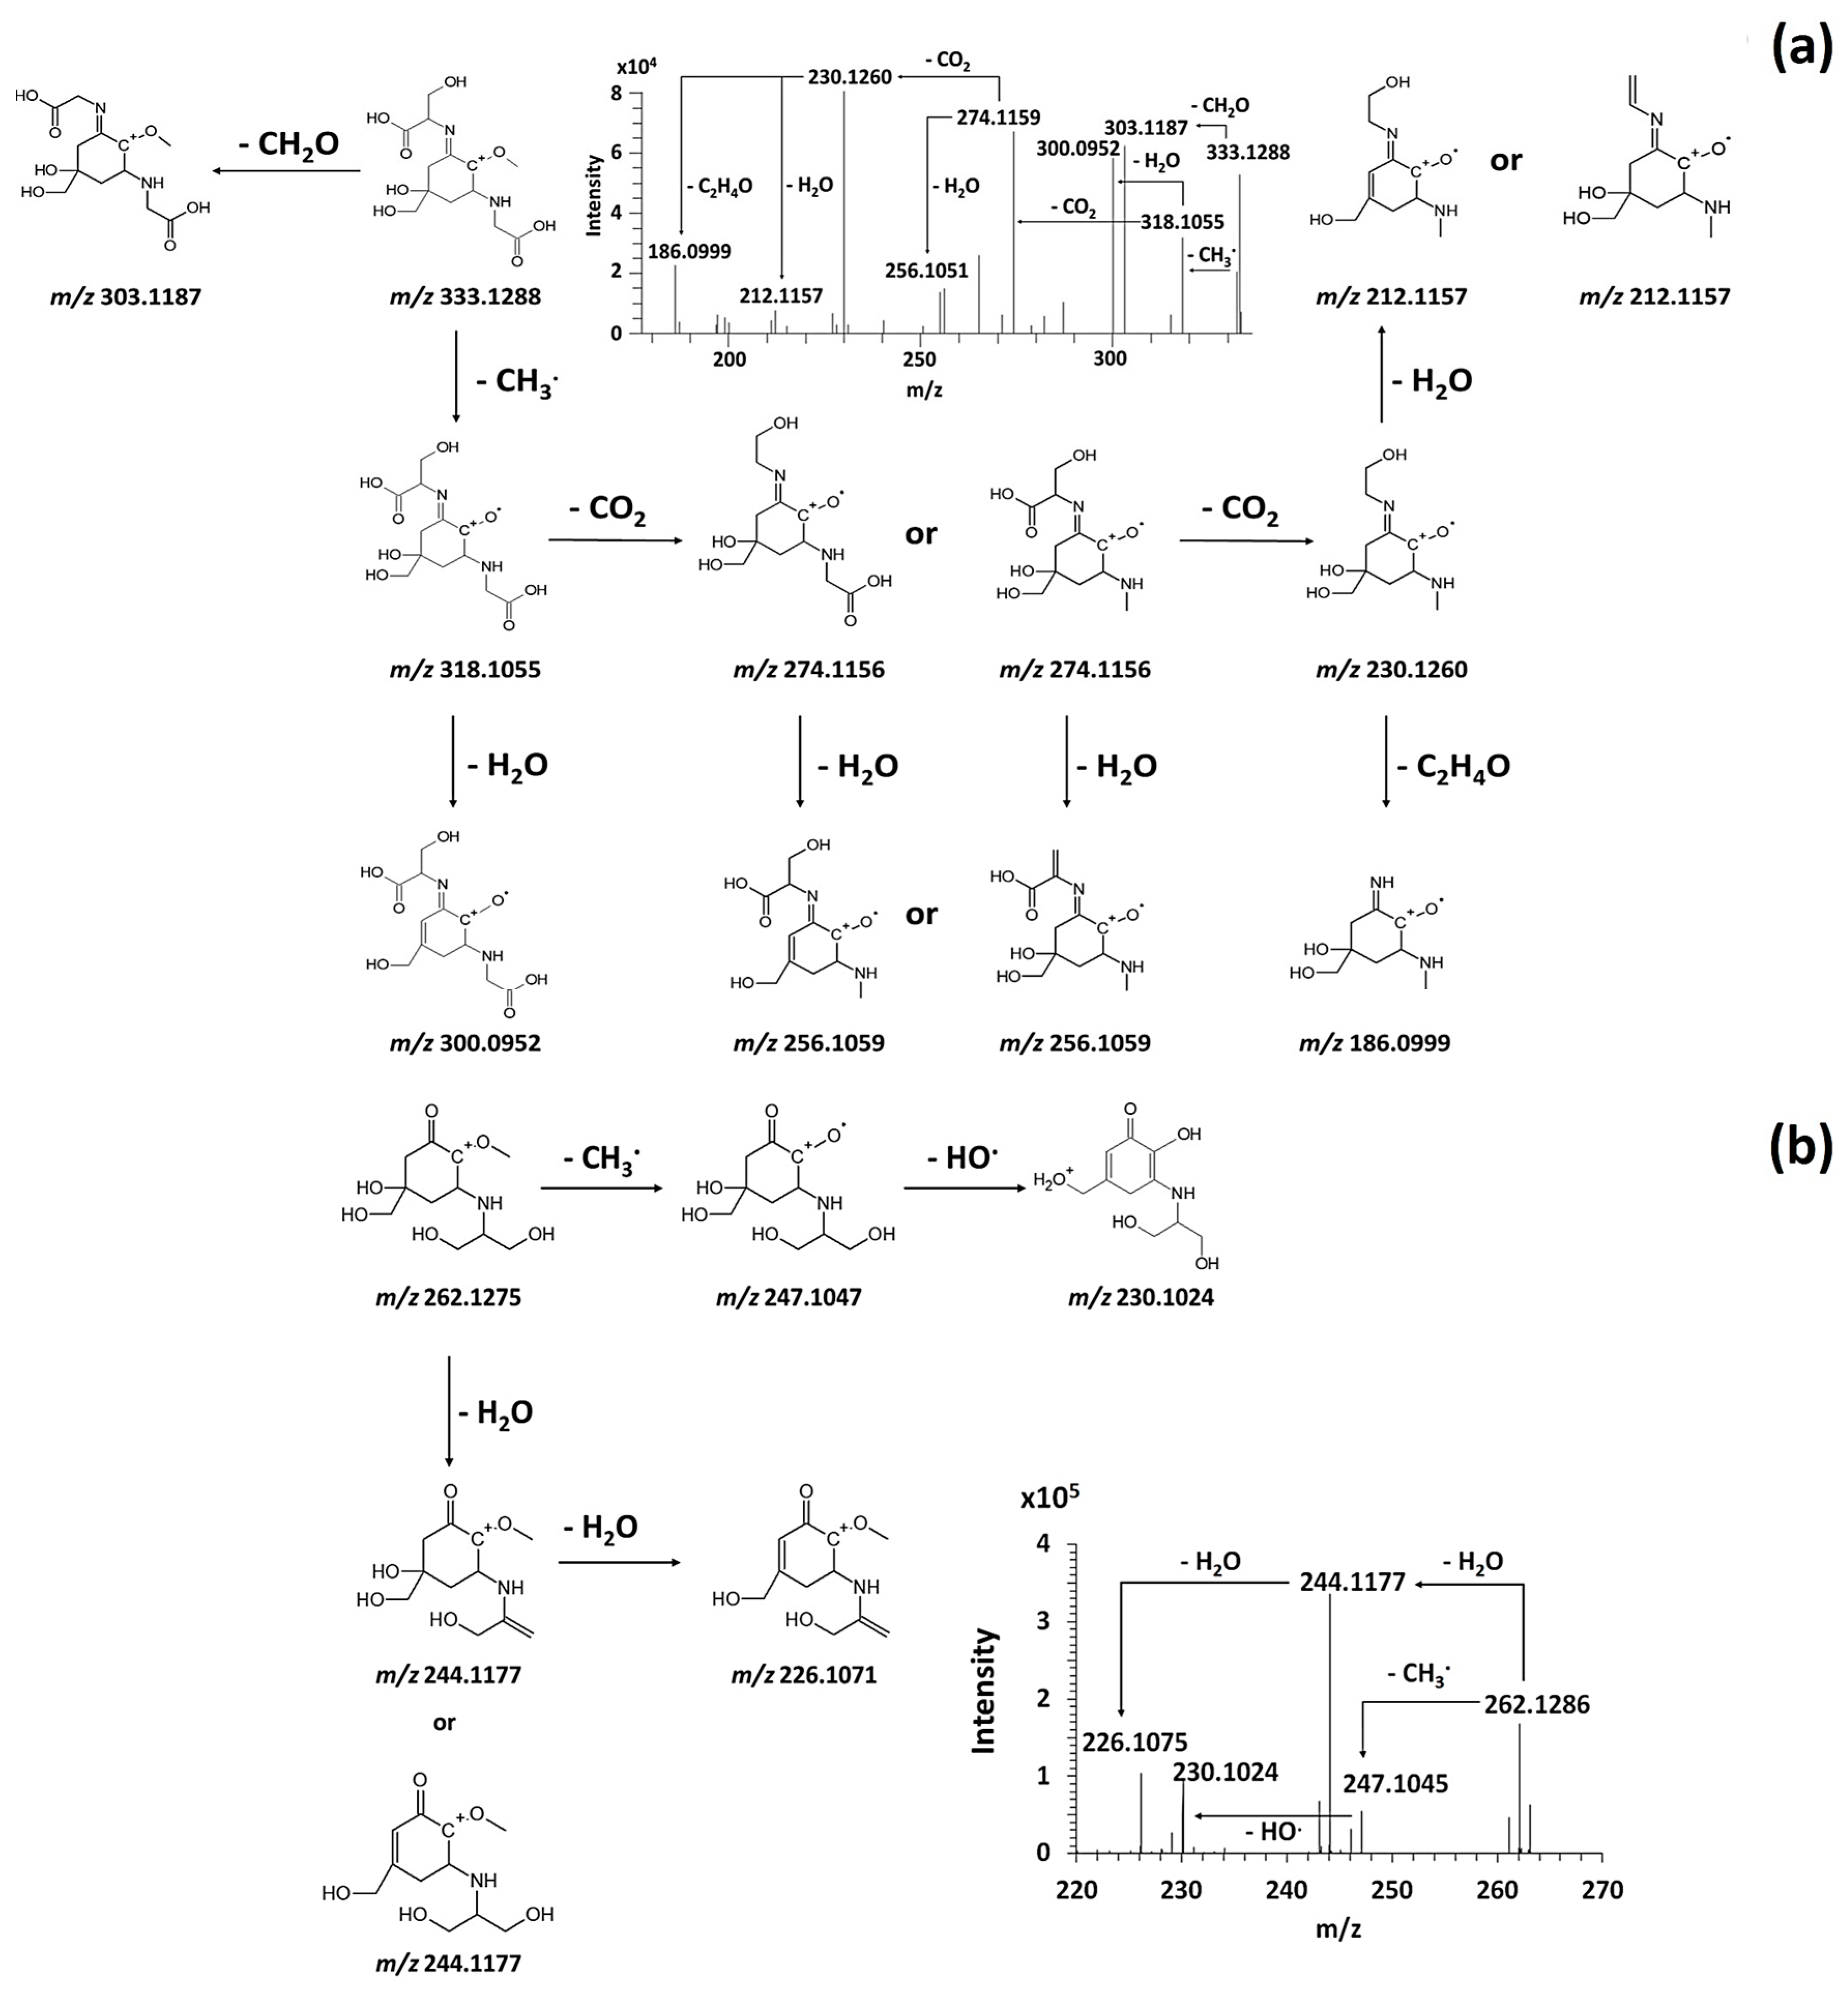
3.3.1. Fragmentation Pathways of MAAs
3.3.2. Mining and Annotation of MAAs in Algal Model Extract
3.4. Method Validation by Targeted Analysis
3.5. Discovery of Novel MAAs
3.6. Quantification
4. Applications
5. Conclusions
Supplementary Materials
Author Contributions
Funding
Acknowledgments
Conflicts of Interest
References
- Bedoux, G.; Hardouin, K.; Burlot, A.S.; Bourgougnon, N. Chapter Twelve—Bioactive Components from Seaweeds: Cosmetic Applications and Future Development. In Advances in Botanical Research; Bourgougnon, N., Ed.; Sea Plants; Academic Press: Cambridge, MA, USA, 2014; Volume 71, pp. 345–378. [Google Scholar]
- Navarro, N.; Lopez Figueroa, F.; Korbee, N.; Bonomi Barufi, J.; Álvarez Gómez, F.; Coba, F. Mycosporine-like amino acids from red algae to develop natural uv sunscreens. In Sunscreens: Source, Formulations, Efficacy and Recommendations; Nova Science Publisher: Hauppauge, NY, USA, 2018; pp. 99–129. [Google Scholar]
- Shick, J.M.; Dunlap, W.C. Mycosporine-Like Amino Acids and Related Gadusols: Biosynthesis, Accumulation, and UV-Protective Functions in Aquatic Organisms. Annu. Rev. Physiol. 2002, 64, 223–262. [Google Scholar] [CrossRef] [Green Version]
- Bhatia, S.; Garg, A.; Sharma, K.; Kumar, S.; Sharma, A.; Purohit, A.P. Mycosporine and mycosporine-like amino acids: A paramount tool against ultra violet irradiation. Pharm. Rev. 2011, 5, 138–146. [Google Scholar] [CrossRef] [PubMed] [Green Version]
- De la Coba, F.; Aguilera, J.; Korbee, N.; de Gálvez, M.V.; Herrera-Ceballos, E.; Álvarez-Gómez, F.; Figueroa, F.L. UVA and UVB Photoprotective Capabilities of Topical Formulations Containing Mycosporine-like Amino Acids (MAAs) through Different Biological Effective Protection Factors (BEPFs). Mar. Drugs 2019, 17, 55. [Google Scholar] [CrossRef] [PubMed] [Green Version]
- Chrapusta, E.; Kaminski, A.; Duchnik, K.; Bober, B.; Adamski, M.; Bialczyk, J. Mycosporine-Like Amino Acids: Potential Health and Beauty Ingredients. Mar. Drugs 2017, 15, 326. [Google Scholar] [CrossRef] [PubMed] [Green Version]
- Claverie, M.; McReynolds, C.; Petitpas, A.; Thomas, M.; Fernandes, S.C.M. Marine-Derived Polymeric Materials and Biomimetics: An Overview. Polymers 2020, 12, 1002. [Google Scholar] [CrossRef]
- Fernandes, S.C.M.; Alonso-Varona, A.; Palomares, T.; Zubillaga, V.; Labidi, J.; Bulone, V. Exploiting Mycosporines as Natural Molecular Sunscreens for the Fabrication of UV-Absorbing Green Materials. ACS Appl. Mater. Interfaces 2015, 7, 16558–16564. [Google Scholar] [CrossRef]
- Wada, N.; Sakamoto, T.; Matsugo, S. Mycosporine-Like Amino Acids and Their Derivatives as Natural Antioxidants. Antioxidants 2015, 4, 603–646. [Google Scholar] [CrossRef]
- Carreto, J.I.; Carignan, M.O. Mycosporine-Like Amino Acids: Relevant Secondary Metabolites. Chemical and Ecological Aspects. Mar. Drugs 2011, 9, 387–446. [Google Scholar] [CrossRef]
- Rastogi, R.; Sonani, R.; Madamwar, D. UV Photoprotectants from Algae—Synthesis and Bio-Functionalities. In Algal Green Chemistry: Recent Progress in Biotechnology; Elsevier: Amsterdam, The Netherlands, 2017; pp. 17–38. ISBN 978-0-444-63784-0. [Google Scholar]
- Carreto, J.I.; Carignan, M.O.; Montoya, N.G. A high-resolution reverse-phase liquid chromatography method for the analysis of mycosporine-like amino acids (MAAs) in marine organisms. Mar. Biol. 2005, 146, 237–252. [Google Scholar] [CrossRef]
- Llewellyn, C.A.; Airs, R.L. Distribution and Abundance of MAAs in 33 Species of Microalgae across 13 Classes. Mar. Drugs 2010, 8, 1273–1291. [Google Scholar] [CrossRef] [Green Version]
- Hartmann, A.; Murauer, A.; Ganzera, M. Quantitative analysis of mycosporine-like amino acids in marine algae by capillary electrophoresis with diode-array detection. J. Pharm. Biomed. Anal. 2017, 138, 153–157. [Google Scholar] [CrossRef] [PubMed]
- Hartmann, A.; Becker, K.; Karsten, U.; Remias, D.; Ganzera, M. Analysis of Mycosporine-Like Amino Acids in Selected Algae and Cyanobacteria by Hydrophilic Interaction Liquid Chromatography and a Novel MAA from the Red Alga Catenella repens. Mar. Drugs 2015, 13, 6291–6305. [Google Scholar] [CrossRef] [PubMed]
- Orfanoudaki, M.; Hartmann, A.; Miladinovic, H.; Nguyen Ngoc, H.; Karsten, U.; Ganzera, M. Bostrychines A–F, Six Novel Mycosporine-Like Amino-Acids and a Novel Betaine from the Red Alga Bostrychia scorpioides. Mar. Drugs 2019, 17, 356. [Google Scholar] [CrossRef] [PubMed] [Green Version]
- Cardozo, K.H.M.; Carvalho, V.M.; Pinto, E.; Colepicolo, P. Fragmentation of mycosporine-like amino acids by hydrogen/deuterium exchange and electrospray ionisation tandem mass spectrometry. Rapid Commun. Mass Spectrom. 2006, 20, 253–258. [Google Scholar] [CrossRef]
- Carignan, M.O.; Cardozo, K.H.M.; Oliveira-Silva, D.; Colepicolo, P.; Carreto, J.I. Palythine–threonine, a major novel mycosporine-like amino acid (MAA) isolated from the hermatypic coral Pocillopora capitata. J. Photochem. Photobiol. B Biol. 2009, 94, 191–200. [Google Scholar] [CrossRef] [PubMed]
- Sinha, R.P.; Klisch, M.; Gröniger, A.; Häder, D.-P. Mycosporine-like amino acids in the marine red alga Gracilaria cornea—Effects of UV and heat. Environ. Exp. Bot. 2000, 43, 33–43. [Google Scholar] [CrossRef]
- De la Coba, F.; Aguilera, J.; Lopez Figueroa, F.; de Gálvez, M.; Herrera-Ceballos, E. Antioxidant activity of mycosporine-like amino acids isolated from three red macroalgae and one marine lichen. J. Appl. Phycol. 2008, 21, 161–169. [Google Scholar] [CrossRef]
- Yuan, Y.V.; Westcott, N.D.; Hu, C.; Kitts, D.D. Mycosporine-like amino acid composition of the edible red alga, Palmaria palmata (dulse) harvested from the west and east coasts of Grand Manan Island, New Brunswick. Food Chem. 2009, 112, 321–328. [Google Scholar] [CrossRef]
- Lalegerie, F.; Lajili, S.; Bedoux, G.; Taupin, L.; Stiger-Pouvreau, V.; Connan, S. Photo-protective compounds in red macroalgae from Brittany: Considerable diversity in mycosporine-like amino acids (MAAs). Mar. Environ. Res. 2019. [Google Scholar] [CrossRef] [Green Version]
- Geraldes, V.; Jacinavicius, F.R.; Genuário, D.B.; Pinto, E. Identification and distribution of mycosporine-like amino acids in Brazilian cyanobacteria using ultrahigh-performance liquid chromatography with diode array detection coupled to quadrupole time-of-flight mass spectrometry. Rapid Commun. Mass Spectrom. 2020, e8634. [Google Scholar] [CrossRef]
- Pliego-Cortés, H.; Bedoux, G.; Boulho, R.; Taupin, L.; Freile-Pelegrín, Y.; Bourgougnon, N.; Robledo, D. Stress tolerance and photoadaptation to solar radiation in Rhodymenia pseudopalmata (Rhodophyta) through mycosporine-like amino acids, phenolic compounds, and pigments in an Integrated Multi-Trophic Aquaculture system. Algal Res. 2019, 41, 101542. [Google Scholar] [CrossRef]
- Álvarez-Gómez, F.; Korbee, N.; Casas-Arrojo, V.; Abdala-Díaz, R.T.; Figueroa, F.L. UV Photoprotection, Cytotoxicity and Immunology Capacity of Red Algae Extracts. Molecules 2019, 24, 341. [Google Scholar] [CrossRef] [PubMed] [Green Version]
- Whitehead, K.; Hedges, J.I. Analysis of mycosporine-like amino acids in plankton by liquid chromatography electrospray ionization mass spectrometry. Mar. Chem. 2002, 80, 27–39. [Google Scholar] [CrossRef]
- Demarque, D.P.; Crotti, A.E.; Vessecchi, R.; Lopes, J.L.; Lopes, N.P. Fragmentation reactions using electrospray ionization mass spectrometry: An important tool for the structural elucidation and characterization of synthetic and natural products. Nat. Prod. Rep. 2016, 33, 432–455. [Google Scholar] [CrossRef] [PubMed] [Green Version]
- Cardozo, K.H.M.; Vessecchi, R.; Carvalho, V.M.; Pinto, E.; Gates, P.J.; Colepicolo, P.; Galembeck, S.E.; Lopes, N.P. A theoretical and mass spectrometry study of the fragmentation of mycosporine-like amino acids. Int. J. Mass Spectrom. 2008, 273, 11–19. [Google Scholar] [CrossRef]
- Cardozo, K.H.M.; Vessecchi, R.; Galembeck, S.E.; Guaratini, T.; Gates, P.J.; Pinto, E.; Lopes, N.P.; Colepicolo, P. A Fragmentation study of di-acidic mycosporine-like amino acids in electrospray and nanospray mass spectrometry. J. Braz. Chem. Soc. 2009, 20, 1625–1631. [Google Scholar] [CrossRef] [Green Version]
- Whitehead, K.; Hedges, J.I. Electrospray ionization tandem mass spectrometric and electron impact mass spectrometric characterization of mycosporine-like amino acids. Rapid Commun. Mass Spectrom. 2003, 17, 2133–2138. [Google Scholar] [CrossRef]
- Teixeira, J.; Tiritan, M.E.; Pinto, M.M.M.; Fernandes, C. Chiral Stationary Phases for Liquid Chromatography: Recent Developments. Molecules 2019, 24, 865. [Google Scholar] [CrossRef] [Green Version]
- Evans, S.E.; Kasprzyk-Hordern, B. Applications of chiral chromatography coupled with mass spectrometry in the analysis of chiral pharmaceuticals in the environment. Trends Environ. Anal. Chem. 2014, 1, e34–e51. [Google Scholar] [CrossRef]
- Camacho-Muñoz, D.; Petrie, B.; Castrignanò, E.; Kasprzyk-Hordern, B. Enantiomeric Profiling of Chiral Pharmacologically Active Compounds in the Environment with the Usage of Chiral Liquid Chromatography Coupled with Tandem Mass Spectrometry. Curr. Anal. Chem. 2016, 12, 303–314. [Google Scholar] [CrossRef] [Green Version]
- Cardozo, K.; Marques, L.; Carvalho, V.; Carignan, M.; Pinto, E.; Marinho-Soriano, E.; Colepicolo, P. Analyses of photoprotective compounds in red algae from the Brazilian coast. Rev. Bras. Farmacogn. Braz. J. Pharmacogn. 2011, 21, 202–208. [Google Scholar] [CrossRef] [Green Version]
- Boedeker, C.; Karsten, U. The occurrence of mycosporine-like amino acids in the gametophytic and sporophytic stages of Bangia (Bangiales, Rhodophyta). Phycologia 2005, 44, 403–408. [Google Scholar] [CrossRef]


| MAA Family | Precursor | Serine Family | Glutamine Family | Palythine Family | Glutamic Acid Family |
|---|---|---|---|---|---|
| Name | 4-deoxygadusol (4-DG) | Mycosporine-serinol (M-SerOH) | Mycosporine-glutamine (M-Gln) | Palythine (PNE. M-NH2:Gly ) | Mycosporine-glutamic acid (M-Glu) |
| Structure | 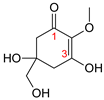 | 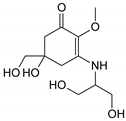 | 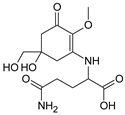 |  | 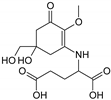 |
| Monoisotopic mass (Da) | 188.0685 | 261.1212 | 316.1271 | 244.1059 | 317.1111 |
| Structural relationships | Reduction of Gadusol | Reduction of M-Ser | 4-DG + Gln→ M-Gln + H2O | 4-DG + NH2 + Gly → M-NH2:Gly + H2O | 4-DG + Glu → M-Glu + H2O |
| MAA Family | Glycine Family | ||||
| Subfamily | Glycine Subfamily | Serine Subfamily | Valine Subfamily | Threonine Subfamily | Alanine Subfamily |
| Name | Asterina-330 (Ast. M-Gly:Gly(OH)) | Shinorine (SH) (M-Gly:Ser) | Mycosporine-glycine-valine (M-Gly:Val) | Porphyra-334 (P-334. M-Gly:Thr) | Palythinol (Pinol) (M-Gly:Ala(OH)) |
| Structure | 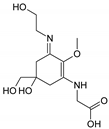 | 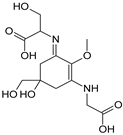 | 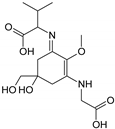 |  | 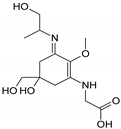 |
| Monoisotopic mass (Da) | 288.1321 | 332.1219 | 344.1583 | 346.1376 | 302.1478 |
| Structural relationships | Reduction of M-2Gly | M-Gly + Ser→ M-Gly:Ser + H2O | M-Gly + Val→ M-Gly:Val + H2O | M-Gly + Thr→ M-Gly:Thr + H2O | M-Gly + Ala→ M-Gly:Ala + H2O (2) Reduction of M-Gly:Ala |
| Marine Organisms | Number of MAAs | MAAs | HPLC Conditions | MS Analysis | Literature |
|---|---|---|---|---|---|
| Brostrychia scorpioides. Porphyra dioica. Gracilaria vermiculophylla. Vertebrata lanosa (Red Algae) | 6 | Shinorine. palythine. asterina-330. porphyra-334. usijirene. palythene. | Reversed-phase chromatography ACE C18 column (150 × 4.6 mm; 3 μm) | Q-TOF Resolution 20.000 FWHM Full MS scan range: m/z 50–1000 | Lalegerie et al. (2019) [22] |
| Rhodymenia pseudopalmata (Red Alga) | 8 | Deoxygadusol. porphyra-334. shinorine. palythine. asterina-330. palythinol. usijirene. palythene. | Reversed-phase chromatography Luna Omega C18 (250 × 4.6 mm; 5 µm) | Q-TOF Resolution 20.000 FWHM Full MS scan range: m/z 100–1000 | Pliego-Cortès et al. (2019) [24] |
| Oscilatoria sp. (Cyanobacteria) | 13 | Palythine. shinorine. porphyra-334. palythine-serine. palythine threonine. mycosporine-glycine. mycosporine-taurine. mycosporine-ornithine. hexose-bond palythine-serine and hexose-bond palythine-threonine. | Reversed-phase chromatography Synergi Hydro-RP 80A column (150 × 2.0 mm; 4 μm) | Q-TOF Resolution 20.000 FWHM Full MS scan range: m/z 50–500 MS/MS: Top3 MS2 | Geraldes et al. (2019) [23] |
| Catenella repens. (Red Alga) | 1 | Catenelline | HILIC chromatography Sequant ZIC-HILIC (250 mm × 4.6 mm; 5 μm) | Q-TOF Ion-trap Full MS scan range: m/z 100–1500 | Hartmann et al. (2015) [15] |
| Microalgae | 5 | Palythene. palythine. mycosporine-glycine. palythenic-acid. porphyra-334. shinorine. | Normal-phase chromatography Luna NH2 column (250 × 4.6 mm; 5 μm) | Ion-trap MS3 scans | Llewellyn and Airs (2010) [13] |
| Palmaria palmata (Red Alga) | 6 | Palythine. shinorine. asterina-330. palythinol. porphyra-334. Usujirene | Reversed-phase chromatography Inertsil ODS-3 column (250 mm × 4.6µm; 5 µm) | Ion-trap MS scan: m/z 50-600 | Yuan et al. (2009) [21] |
| Pocillopora capitata (Coral) | 12 | Palythine-serine-sulfate. mycosporine sulfate. shinorine. mycosporine-2-glycine. palythine-serine. palythine. porphyra-334. mycosporine-methylamine-serine. mycosporine-glycine. palythine-threonine. palythinol. mycosporine-methylamine-threonine. | Reversed-phase chromatography C18 column (4.6 × 150 mm; 3 µm) | Ion-trap. TOF Resolution 10.000 MS2/MS3 scans | Carignan et al. (2009) [18] |
| MAAs | In Source Fragmentation | Formula | Monoisotopic Mass (Da) | [M+H]+ (m/z) | Area Max (105) | RT [min] | Number of Fragment Ions (/8) |
|---|---|---|---|---|---|---|---|
| Porphyra-334 | - | C14 H22 O8 N2 | 346.1372 | 347.1444 | 693 | 10.14 | 8 |
| Unknown | - | C14 H28 O3 N2 | 272.2099 | 273.2170 | 0.15 | 8.86 | 8 |
| Unknown | - | C10 H17 O6 N | 247.1053 | 248.1126 | 0.18 | 11.03 | 8 |
| Unknown | - | C10 H19 O4 N3 | 245.1374 | 246.1447 | 0.19 | 10.93 | 8 |
| Asterina-330 | [(M+H)-(CH3; CO2)] | C10 H17 O4 N2 | 229.1187 | 230.1259 | 0.59 | 11.02 | 8 |
| Asterina-330 | [(M+H)-CH3] | C11 H17 O6 N2 | 273.1084 | 274.1157 | 1.23 | 11.03 | 8 |
| Unknown | - | C14 H22 O9 N2 | 362.1320 | 363.1389 | 1.25 | 10.84 | 8 |
| Palythine | [(M+H)-(CH3; CO2)] | C8 H13 O3 N2 | 185.0924 | 186.0999 | 1.02 | 11.15 | 8 |
| Unknown | - | C12 H19 O3 N3 S | 285.1142 | 286.1215 | 0.10 | 8.11 | 8 |
| Aplysiapalythine-B | - | C12 H20 O5 N2 | 272.1367 | 273.1436 | 76.5 | 9.00 | 8 |
| Shinorine | - | C13 H20 O8 N2 | 332.1214 | 333.1292 | 85.2 | 10.52 | 8 |
| Palythinol | - | C13 H22 O6 N2 | 302.1475 | 303.1551 | 11.3 | 10.20 | 8 |
| Mycosporine-2-glycine | - | C12 H18 O7 N2 | 302.1112 | 303.1185 | 3.55 | 10.15 | 8 |
| Palythine | - | C10 H16 O5 N2 | 244.1051 | 245.1124 | 122 | 11.14 | 8 |
| Unknown | - | C15 H24 O10 N2 S | 424.1146 | 425.1218 | 4.73 | 10.16 | 8 |
| Mycosporine methyl-amine threonine | - | C13 H22 O6 N2 | 302.1475 | 303.1551 | 2.43 | 8.48 | 8 |
| Asterina-330 | - | C12 H20 O6 N2 | 288.1316 | 289.1394 | 187 | 11.03 | 8 |
| Palythene/Usujirene | - | C13 H20 O5 N2 | 284.1368 | 285.1445 | 137 | 7.81 | 8 |
| Palythene/Usujirene | [(M+H)-(CH3; CO2)] | C11 H17 O3 N2 | 225.1237 | 226.1311 | 0.39 | 7.81 | 7 |
| Unknown | - | C13 H22 O7 N2 | 318.1425 | 319.1493 | 1.63 | 10.17 | 7 |
| Unknown | - | C13 H20 O6 N2 | 300.1320 | 301.1392 | 1.99 | 10.15 | 7 |
| Unknown | - | C11 H18 O7 N2 S | 322.0827 | 323.0899 | 0.58 | 11.15 | 7 |
| Unknown | - | C11 H18 O5 N2 | 258.1217 | 259.1289 | 1.07 | 10.05 | 7 |
| Mycosporine-glycine-valine | - | C15 H24 O7 N2 | 344.1579 | 345.1652 | 1.20 | 9.01 | 7 |
| Unknown | - | C14 H22 O7 N2 | 330.1420 | 331.1491 | 1.07 | 9.43 | 7 |
| Palythine glutamic-acid | - | C13 H20 O7 N2 | 316.1266 | 317.1338 | 6.26 | 9.86 | 7 |
| Unknown | - | C20 H30 O10 N2 | 458.1903 | 459.1975 | 2.77 | 10.04 | 6 |
| Unknown | - | C13 H22 O8 N2 S | 366.1092 | 367.1164 | 0.49 | 11.02 | 6 |
| Palythine-serine | - | C11 H18 O6 N2 | 274.1158 | 275.1231 | 0.47 | 11.54 | 6 |
| Unknown | - | C16 H26 O8 N4 | 402.1751 | 403.1816 | 0.44 | 10.69 | 6 |
| Unknown | - | C15 H24 O8 N2 | 360.1522 | 361.1602 | 0.28 | 9.52 | 6 |
| Unknown | - | C13 H23 O6 N5 | 345.1647 | 346.1722 | 0.22 | 11.91 | 5 |
| Unknown | - | C15 H24 O8 N2 | 360.1522 | 361.1598 | 0.21 | 9.96 | 5 |
| Unknown | - | C13 H22 O5 N2 | 286.1525 | 287.1240 | 0.17 | 8.05 | 5 |
| Unknown | - | C15 H23 O8 N3 | 373.1484 | 374.1557 | 0.53 | 10.50 | 5 |
| Unknown | - | C18 H22 O8 N2 | 394.1369 | 395.1441 | 0.46 | 8.28 | 5 |
| Unknown | - | C14 H22 O10 N2 S | 410.0990 | 411.1060 | 0.50 | 10.53 | 5 |
| Unknown | - | C13 H20 O6 N2 | 300.1320 | 301.1392 | 2.66 | 9.28 | 5 |
| Aplysiapalythine-A | - | C13 H22 O6 N2 | 302.1475 | 303.1551 | 2.07 | 9.72 | 5 |
| Unknown | - | C14 H22 O7 N2 S | 362.1143 | 363.1215 | 0.28 | 7.81 | 5 |
| Mycosporine-glycine | - | C10 H15 O6 N | 245.0899 | 246.0972 | 0.93 | 8.56 | 5 |
| MAAs | [M+H]+ | Retention Time (min) | FISh Coverage (%) | Number of Characteristic Fragment Ions of MAAs (/8) | Neutral and Radical Losses |
|---|---|---|---|---|---|
| Palythine | 245.1123 | 11.14 | 42 | 8 | CH3; CO2; H2O |
| Mycosporine-glycine * | 246.0971 | 8.56 | 69 | 5 | CH3; CO2; H2O |
| Aplysiapalythine B | 273.1436 | 9.01 | 52 | 8 | CH3; CO2; H2O |
| Palythine-serine | 275.1234 | 11.54 | 67 | 5 | CH3; CO2; H2O |
| Palythene /Usujirene | 285.1440 | 7.81 | 48 | 8 | CH3; CO2; H2O |
| Asterina-330 | 289.1389 | 11.03 | 59 | 8 | CH3; CO2; H2O CH3O; C2H4O |
| Mycosporine-2-glycine | 303.1185 | 10.15 | 50 | 8 | CH3; CO2; H2O |
| Aplysiapalythine A | 303.1542 | 9.72 | 38 | 4 | CH3; CO2; H2O |
| Palythinol | 303.1548 | 10.20 | 57 | 8 | CH3; CO2; H2O |
| Mycosporine-methyl amine threonine | 303.1549 | 8.48 | 64 | 8 | CH3; CO2; H2O |
| Palythine-glutamic acid | 317.1338 | 9.86 | 45 | 8 | CH3; CO2; H2O |
| Shinorine | 333.1286 | 10.52 | 48 | 8 | CH3; CO2; H2O; CH2O; C2H4O |
| Mycosporine-glycine-valine | 345.1653 | 9.03 | 63 | 7 | CH3; CO2; H2O |
| Porphyra-334 | 347.1444 | 10.14 | 67 | 8 | CH3; CO2; H2O; C2H4O; C3H6O |
| Compound | [M+H]+ (m/z) | Formula [M+H]+ | Fragment Ions (m/z) | ||
|---|---|---|---|---|---|
| MS2 | MS3 | MS4 | |||
| A | 301.1393 | C13 H21 O6 N2 | 286.1158 C12 H18 O6 N2 (−2.11 ppm) 283.1279 C13 H19 O5 N2 (−3.13 ppm) 257.1152 C11 H17 O5 N2 (−2.9 ppm) 243.0974 C10 H15 O5 N2 (−3.4 ppm) 242.1260 C11 H18 O4 N2 (−2.67 ppm) 225.0865 C10 H13 O4 N2 (−4.63 ppm) 211.1078 C10 H15 O3 N2 (−1.08 ppm) 199.1077 C9 H15 O3 N2 (−0.54 ppm) | 265.1186 C13 H17 O4 N2 (−1.52 ppm) 239.1482 C12 H19 O3 N2 (−0.63 ppm) 221.1377 C12 H17 O2 N2 (−0.29 ppm) | |
| B | 319.1495 | C13 H23 O7 N2 | 304.1265 C12 H20 O7 N2 (1.88 ppm) 301.1392 C13 H21 O6 N2 (−2.46 ppm) 289.1394 C12 H21 O6 N2 (−2.46 ppm) 275.1237 C11 H19 O6 N2 (−2.15 ppm) 245.1132 C10 H17 O5 N2 (−2.60 ppm) | 257.1237 C11 H17 O5 N2 (−2.40 ppm) 230.0897 C9 H14 O5 N2 (−3.94 ppm) 227.1023 C10 H15 O4 N2 (−1.02 ppm) 209.0917 C10 H13 O3 N2 (−0.98 ppm) 199.1076 C9 H15 O3 N2 (−0.95 ppm) 197.0919 C9 H13 O3 N2 (−0.95 ppm) 186.0996 C8 H14 O3 N2 (−0.89 ppm) | |
| C | 331.1499 | C14 H23 O7 N2 | 316.1264 C13 H20 O7 N2 (−1.96 ppm) 313.1393 C14 H21 O6 N2 (−0.71 ppm) 301.1035 C12 H17 O7 N2 (−0.09 ppm) 295.1289 C14 H19 O5 N2 (−0.74 ppm) 272.1367 C12 H20 O5 N2 (−2.17 ppm) 241.1182 C11 H17 O4 N2 (−0.64 ppm) 228.1468 C11 H20 O3 N2 (−2.64 ppm) 213.1234 C10 H17 O3 N2 (−1.73 ppm) 197.1286 C10 H17 O2 N2 (−0.4 ppm) | ||
| D | 361.1601 | C15 H25 O8 N2 | 346.1361 C14 H22 O8 N2 (−4.35 ppm) 317.1346 C13 H21 O7 N2 (−0.27 ppm) 315.1192 C13 H19 O7 N2 (0.01 ppm) 302.1472 C13 H22 O6 N2 (−1.97 ppm) 271.1288 C12 H19 O5 N2 (−0.54 ppm) 258.1574 C12 H22 O4 N2 (−2.04 ppm) 227.1388 C11 H19 O3 N2 (−3.72 ppm) | ||
| E | 363.1398 | C14 H23 O9 N2 | 348.1166 C13 H20 O9 N2 (−0.8 ppm) 345.1292 C14 H21 O8 N2 (−1.68 ppm) 330.1161 C13 H18 O8 N2 (−0.62 ppm) 319.1134 C12 H19 O8 N2 (−2.04 ppm) 304.1263 C12 H20 O7 N2 (−2.6 ppm) 286.1160 C12 H18 O6 N2 (−1.8 ppm) 283.0923 C12 H15 O6 N2 (−2.9 ppm) 239.1022 C11 H15 O4 N2 (−4.27 ppm) | 309.1081 C14 H17 O6 N2 (−1.39 ppm) 301.1029 C12 H17 O7 N2 (−0.76 ppm) | |
| F | 367.1169 | C13 H23 O8 N2 S | 352.0928 C12 H20 O8 N2 S (-2.38 ppm) 349.1851 C13 H21 O7 N2 S 323.1699 C12 H23 O6 N2 S 321.0742 C11 H17 O7 N2 S 308.0671 C10 H16 O7 N2 S (−2.5 ppm) | 334.0822 C12 H18 O7 N2 S 331.1648 C13 H19 O6 N2 S 305.1586 C11 H17 O6 N2 S 303.1796 C11 H15 O6 N2 S 287.1890 C12 H19 O4 N2 S | 290.093 C11 H18 O5 N2 S (-2.7 ppm) 277.0484 C9 H13 O6 N2 S 228.1101 C11 H20 O3 N2 |
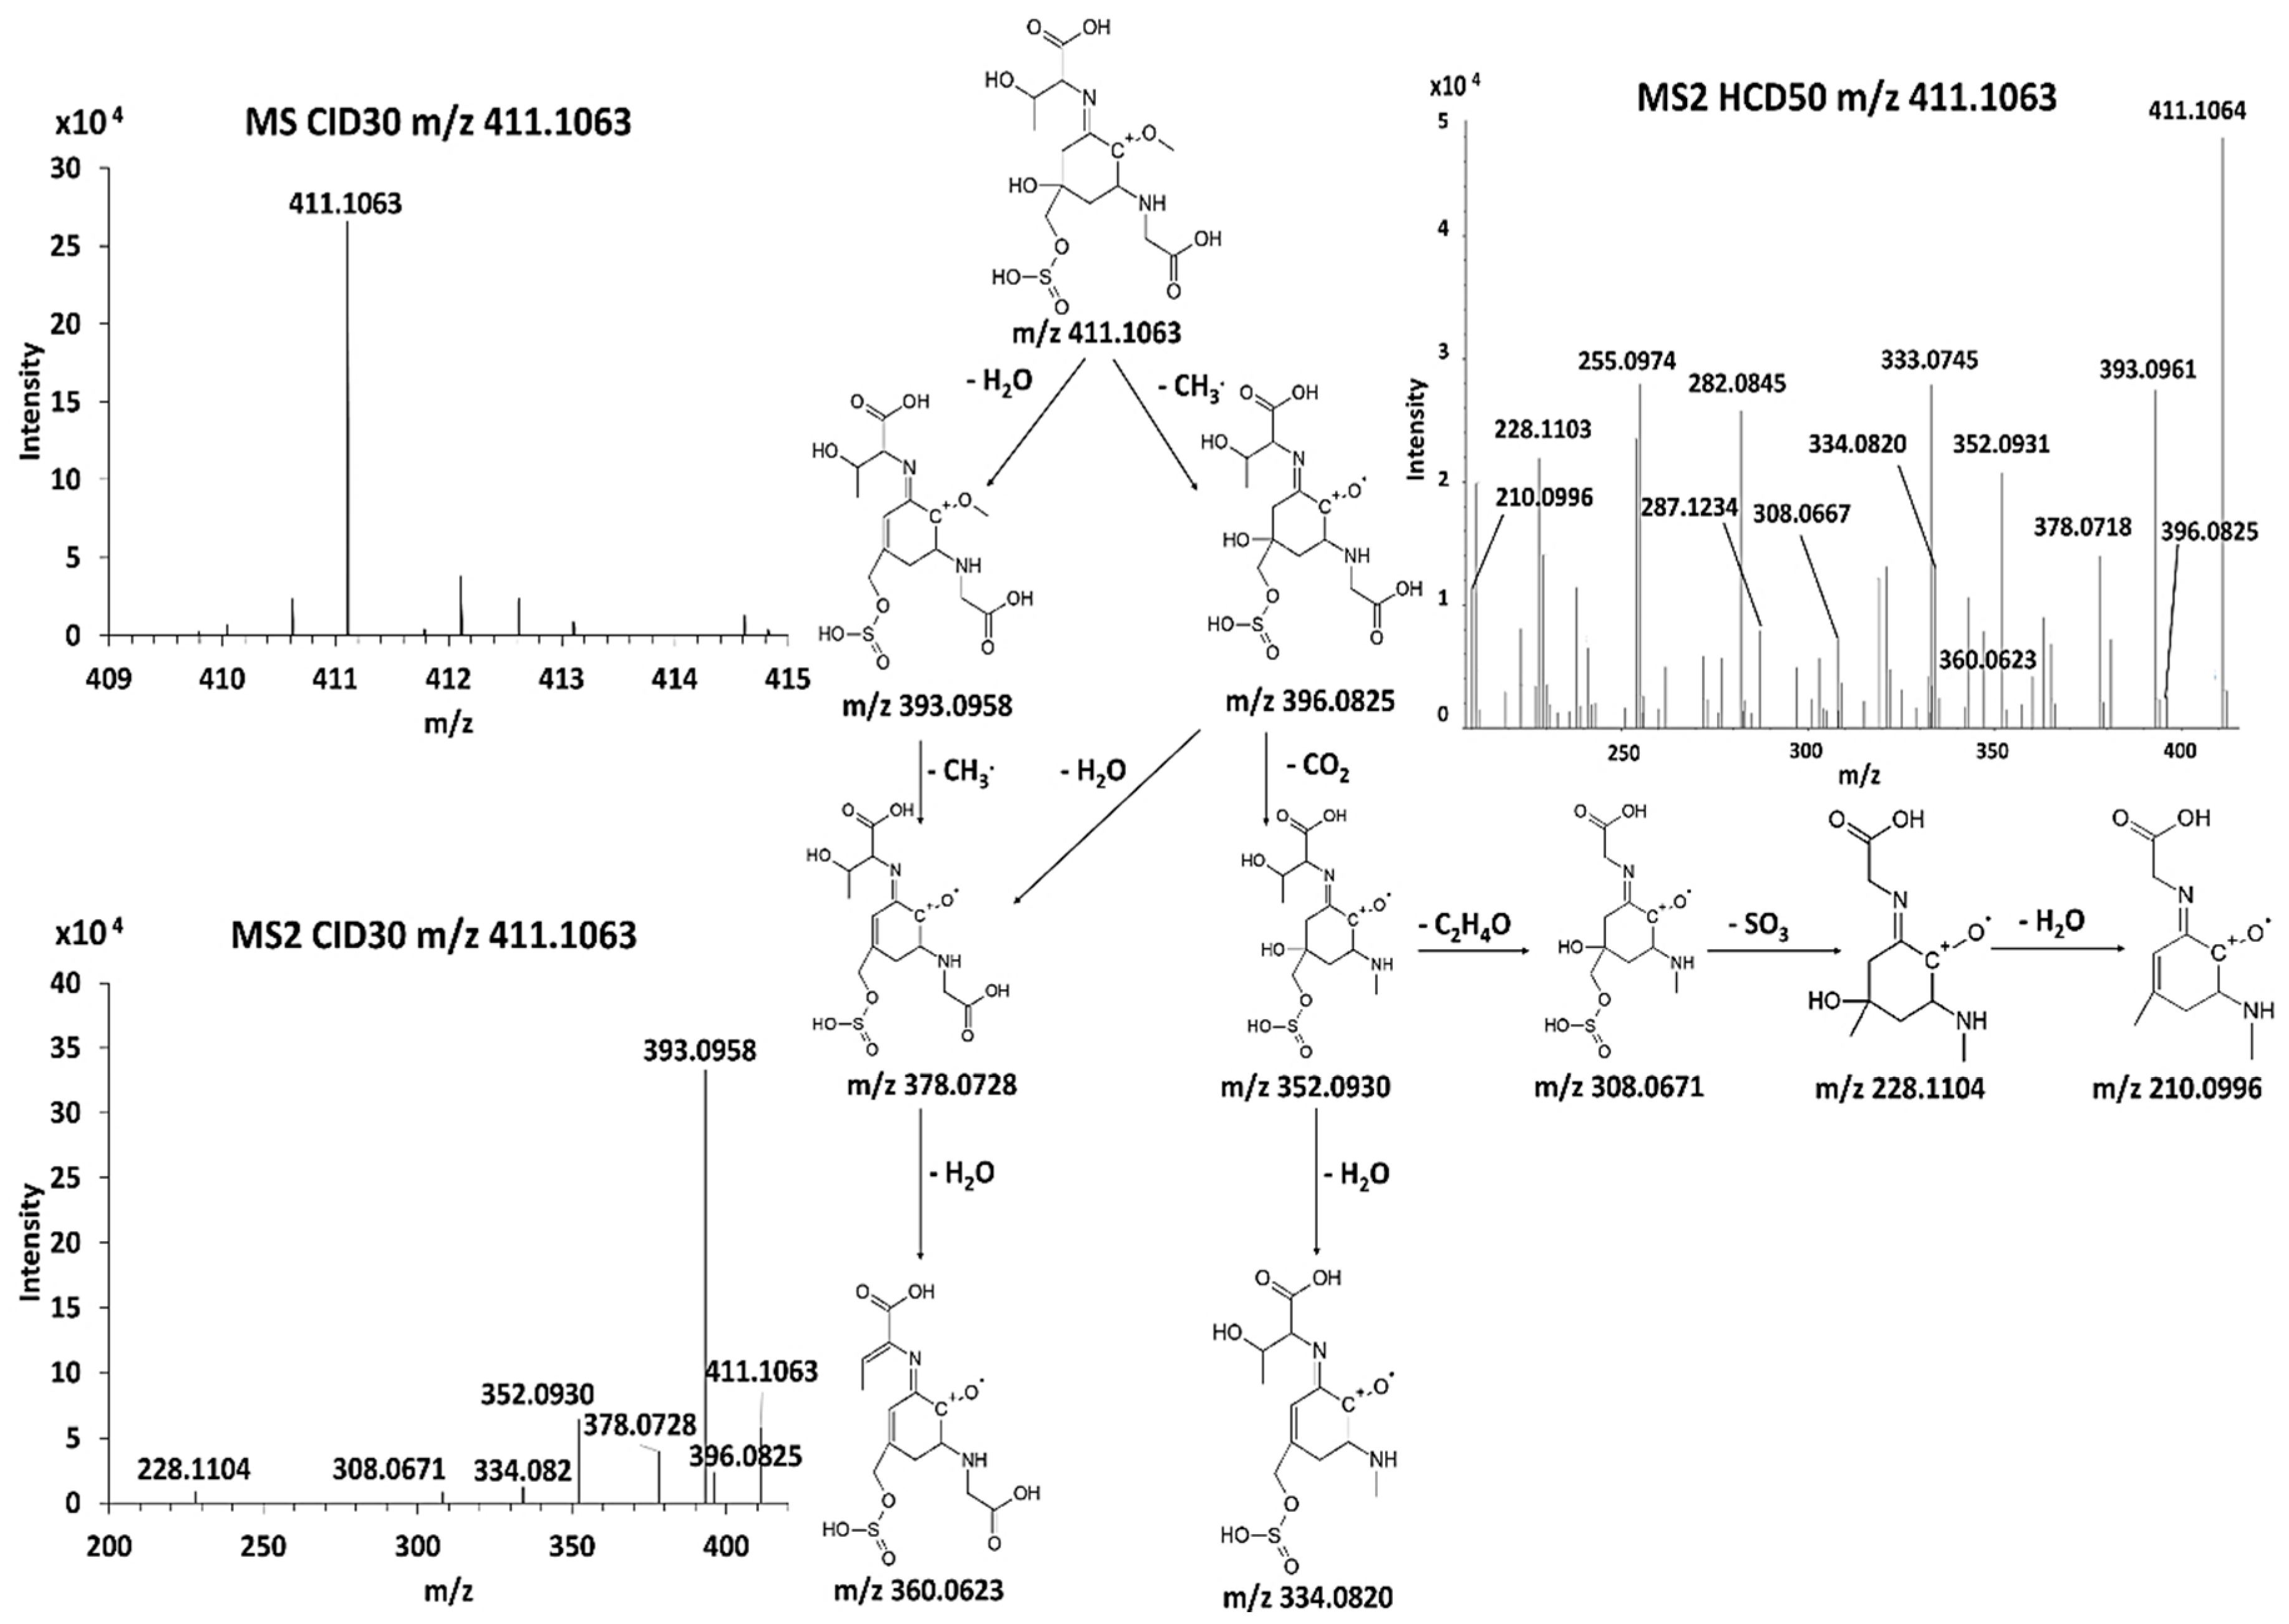
| G | 411.1063 | C14 H23 O10 N2 S | 396.083 C13 H20 O10 N2 S (-1.48 ppm) 393.096 C14 H21 O9 N2 S (−1.64 ppm) 378.072 C13 H18 O9 N2 S 360.0623 C13 H16 O8 N2 S 352.0931 C12 H20 O8 N2 S 334.082 C12 H18 O7 N2 S 308.067 C10 H16 O7 N2 S 228.1104 C10 H16 O4 N2 210.0996 C10 H14 O3 N2 | ||
| Compound A | Compound B | |
|---|---|---|
| Name | 2-{[(3Z)-5-hydroxy-3-[(1-hydroxyethyl)imino]-5-(hydroxymethyl)-2-methoxycyclohex-1-en-1-yl]amino}prop-2-enoic acid | 3-hydroxy-2-({(3E)-5-hydroxy-5-(hydroxymethyl)-3-[(hydroxymethyl)imino]-2-methoxycyclohex-1-en-1-yl}amino)butanoic acid |
| Structure |  | 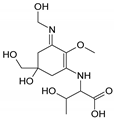 |
| Monoisotopic mass (Da) | 300.1321 | 318.1425 |
| FISh score (%) | 62 | 53 |
| Compound C | Compound D | |
| Name | 2-[(E)-{3-[(1-carboxyethyl)amino]-5-hydroxy-5-(hydroxymethyl)-2-methoxycyclohex-2-en-1-ylidene}amino]propanoic acid | 2-{[(3E)-3-[(1-carboxyethyl)imino]-5-hydroxy-5-(hydroxymethyl)-2-methoxycyclohex-1-en-1-yl]amino}-3-hydroxybutanoic acid |
| Structure | 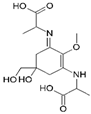 | 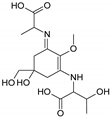 |
| Monoisotopic mass (Da) | 330.1420 | 360.1522 |
| FISh score (%) | 59 | 54 |
| Compound E | Compound F | |
| Name | 2-{(E)-[3-{[carboxy(hydroxy)methyl]amino}-5-hydroxy-5-(hydroxymethyl)-2-methoxycyclohex-2-en-1-ylidene]amino}-3-hydroxybutanoic acid | {[(3E)-5-(hydroxymethyl)-3-[(2-hydroxypropyl)imino]-2-methoxy-5-(sulfinooxy)cyclohex-1-en-1-yl]amino}acetic acid |
| Structure | 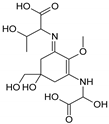 | 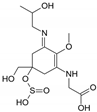 |
| Monoisotopic mass (Da) | 362.1320 | 366.1096 |
| FISh score (%) | 52 | 60 |
| Compound G | ||
| Name | 2-[(E)-{3-[(carboxymethyl)amino]-5-hydroxy-2-methoxy-5-[(sulfinooxy)methyl]cyclohex-2-en-1-ylidene}amino]-3-hydroxybutanoic acid | |
| Structure | 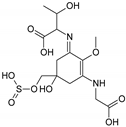 | |
| Monoisotopic mass (Da) | 410.0995 | |
| FISh score (%) | 54 |
| MAAs | Monoisotopic Mass (Da) | Area Max (105) | Amounts (µg.g−1 DW) | Error (µg.g−1 DW) |
|---|---|---|---|---|
| Porphyra-334 | 346.1372 | 693 | 2100 | 0 |
| Shinorine | 332.1214 | 85.2 | 430 | 0 |
| Palythine | 244.1051 | 122 | 1530 | 0 |
| Compound E | 362.1320 | 1.3 | 4 | 0.40 |
| Aplysiapalythine-B | 272.1367 | 76.5 | 243 | 24.3 |
| Palythinol | 302.1475 | 11.3 | 35.8 | 3.6 |
| Mycosporine-2-glycine | 302.1112 | 3.6 | 11.3 | 1.1 |
| Mycosporine methyl-amine threonine | 302.1475 | 2.4 | 7.7 | 0.8 |
| Asterina-330 | 288.1316 | 187 | 593 | 59.3 |
| Palythene/Usujirene | 284.1368 | 137 | 434 | 43.4 |
| Compound B | 318.1425 | 1.6 | 5.2 | 0.5 |
| Compound D | 360.1522 | 0.28 | 0.9 | 0.1 |
| Mycosporine-glycine-valine | 344.1579 | 1.2 | 3.8 | 0.4 |
| Compound C | 330.1420 | 1 | 3.4 | 0.3 |
| Palythine glutamic-acid | 316.1266 | 6.3 | 19.8 | 2 |
| Compound F | 366.1092 | 0.5 | 1.5 | 0.2 |
| Palythine-serine | 274.1158 | 0.5 | 1.5 | 0.2 |
| Compound G | 410.0990 | 0.5 | 1.6 | 0.2 |
| Compound A | 300.1320 | 2.7 | 8.4 | 0.8 |
| Aplysiapalythine-A | 302.1475 | 2 | 6.6 | 0.7 |
| Mycosporine-glycine | 245.0899 | 0.9 | 2.9 | 0.3 |
| MAAs | Formula | MW (Da) | [M+H]+ (m/z) | Retention Time (min) | Number of Fragment Ions (/8) | |||
|---|---|---|---|---|---|---|---|---|
| Porphyra rosengurtii | Gelidium sesquipedale | Halopithys incurva | Cystoseira tamariscifolia | |||||
| Palythine | C10 H16 O5 N2 | 244.1051 | 245.1124 | 11.16 | 8 | 8 | 6 | 7 |
| Unknown | C12 H24 O3 N2 | 244.1786 | 245.1858 | 11.30 | 8 | |||
| Mycosporine-glycine | C10 H15 O6 N | 245.0891 | 246.0963 | 8.56 | 5 | |||
| Unknown | C10 H17 O6 N | 247.1051 | 248.1124 | 11.04 | 8 | |||
| Aplysiapalythine-B | C12 H20 O5 N2 | 272.1364 | 273.1437 | 9.01 | 5 | |||
| Palythine-serine | C11 H18 O6 N2 | 274.1157 | 275.1230 | 11.54 | 8 | 5 | ||
| Palythene/Usujirene | C13 H20 O5 N2 | 284.1369 | 285.1438 | 7.82 | 8 | |||
| Unknown | C12 H18 O6 N2 | 286.1163 | 287.1236 | 10.54 | 7 | |||
| Asterina-330 | C12 H20 O6 N2 | 288.1315 | 289.1387 | 11.05 | 7 | 8 | 7 | |
| Palythine-threonine | C12 H20 O6 N2 | 288.1321 | 289.1394 | 10.48 | 7 | |||
| Palythinol | C13 H22 O6 N2 | 302.1471 | 303.1544 | 10.20 | 6 | |||
| Palythine glutamic-acid | C13 H20 O7 N2 | 316.1266 | 317.1341 | 9.87 | 7 | |||
| Compound B | C13 H22 O7 N2 | 318.1424 | 319.1492 | 10.24 | 6 | |||
| Shinorine | C13 H20 O8 N2 | 332.1214 | 333.1286 | 10.53 | 8 | 8 | 5 | 7 |
| Porphyra-334 | C14 H22 O8 N2 | 346.1371 | 347.1447 | 10.16 | 7 | 7 | 6 | |
| Unknown | C14 H22 O8 N2 | 346.1370 | 347.1437 | 9.48 | 5 | |||
| Compound F | C13 H22 O8 N2 S | 366.1088 | 367.1161 | 11.03 | 5 | |||
| Compound G | C14 H22 O10 N2 S | 410.0991 | 411.1064 | 10.53 | 8 | |||
Publisher’s Note: MDPI stays neutral with regard to jurisdictional claims in published maps and institutional affiliations. |
© 2020 by the authors. Licensee MDPI, Basel, Switzerland. This article is an open access article distributed under the terms and conditions of the Creative Commons Attribution (CC BY) license (http://creativecommons.org/licenses/by/4.0/).
Share and Cite
Parailloux, M.; Godin, S.; Fernandes, S.C.M.; Lobinski, R. Untargeted Analysis for Mycosporines and Mycosporine-Like Amino Acids by Hydrophilic Interaction Liquid Chromatography (HILIC)—Electrospray Orbitrap MS2/MS3. Antioxidants 2020, 9, 1185. https://doi.org/10.3390/antiox9121185
Parailloux M, Godin S, Fernandes SCM, Lobinski R. Untargeted Analysis for Mycosporines and Mycosporine-Like Amino Acids by Hydrophilic Interaction Liquid Chromatography (HILIC)—Electrospray Orbitrap MS2/MS3. Antioxidants. 2020; 9(12):1185. https://doi.org/10.3390/antiox9121185
Chicago/Turabian StyleParailloux, Maroussia, Simon Godin, Susana C. M. Fernandes, and Ryszard Lobinski. 2020. "Untargeted Analysis for Mycosporines and Mycosporine-Like Amino Acids by Hydrophilic Interaction Liquid Chromatography (HILIC)—Electrospray Orbitrap MS2/MS3" Antioxidants 9, no. 12: 1185. https://doi.org/10.3390/antiox9121185