
The Role of Neutrophil-to-Lymphocyte Ratio in Risk Stratification and Prognostication of COVID-19: A Systematic Review and Meta-Analysis

 , , , ,
Abstract
:1. Introduction
2. Materials and Methods
2.1. Protocol and Registration
2.2. Inclusion and Exclusion Criteria
2.3. Data Extraction and Risk of Bias Assessment
- Title/abstract screening: Authors CB, SA, SP, and AP independently screened all the articles as per the pre-agreed criteria and consulted with PAM if there was disagreement.
- Full-text screening: Articles identified in Step 1 were moved to full-text screening. Authors SP, RKP, and AP screened all articles independently. Articles eligible for final inclusion included a sensitivity and specificity analysis of NLR in predicting the severity and mortality of COVID-19. PAM was consulted for clarification and if there was disagreement between operators.
- The surname of first author, year and month of publication, sample size, study location, basic demographic data—i.e., mean age, gender, and comorbidities—and outcomes, i.e., disease severity and mortality.
- NLR values were recorded, along with their standard deviation, and categorized based on mild or severe cases.
- Sensitivity, specificity, area under the curve (AUC) data, ‘cut-off’ data for each outcome.
2.4. Synthesis of Evidence
3. Results
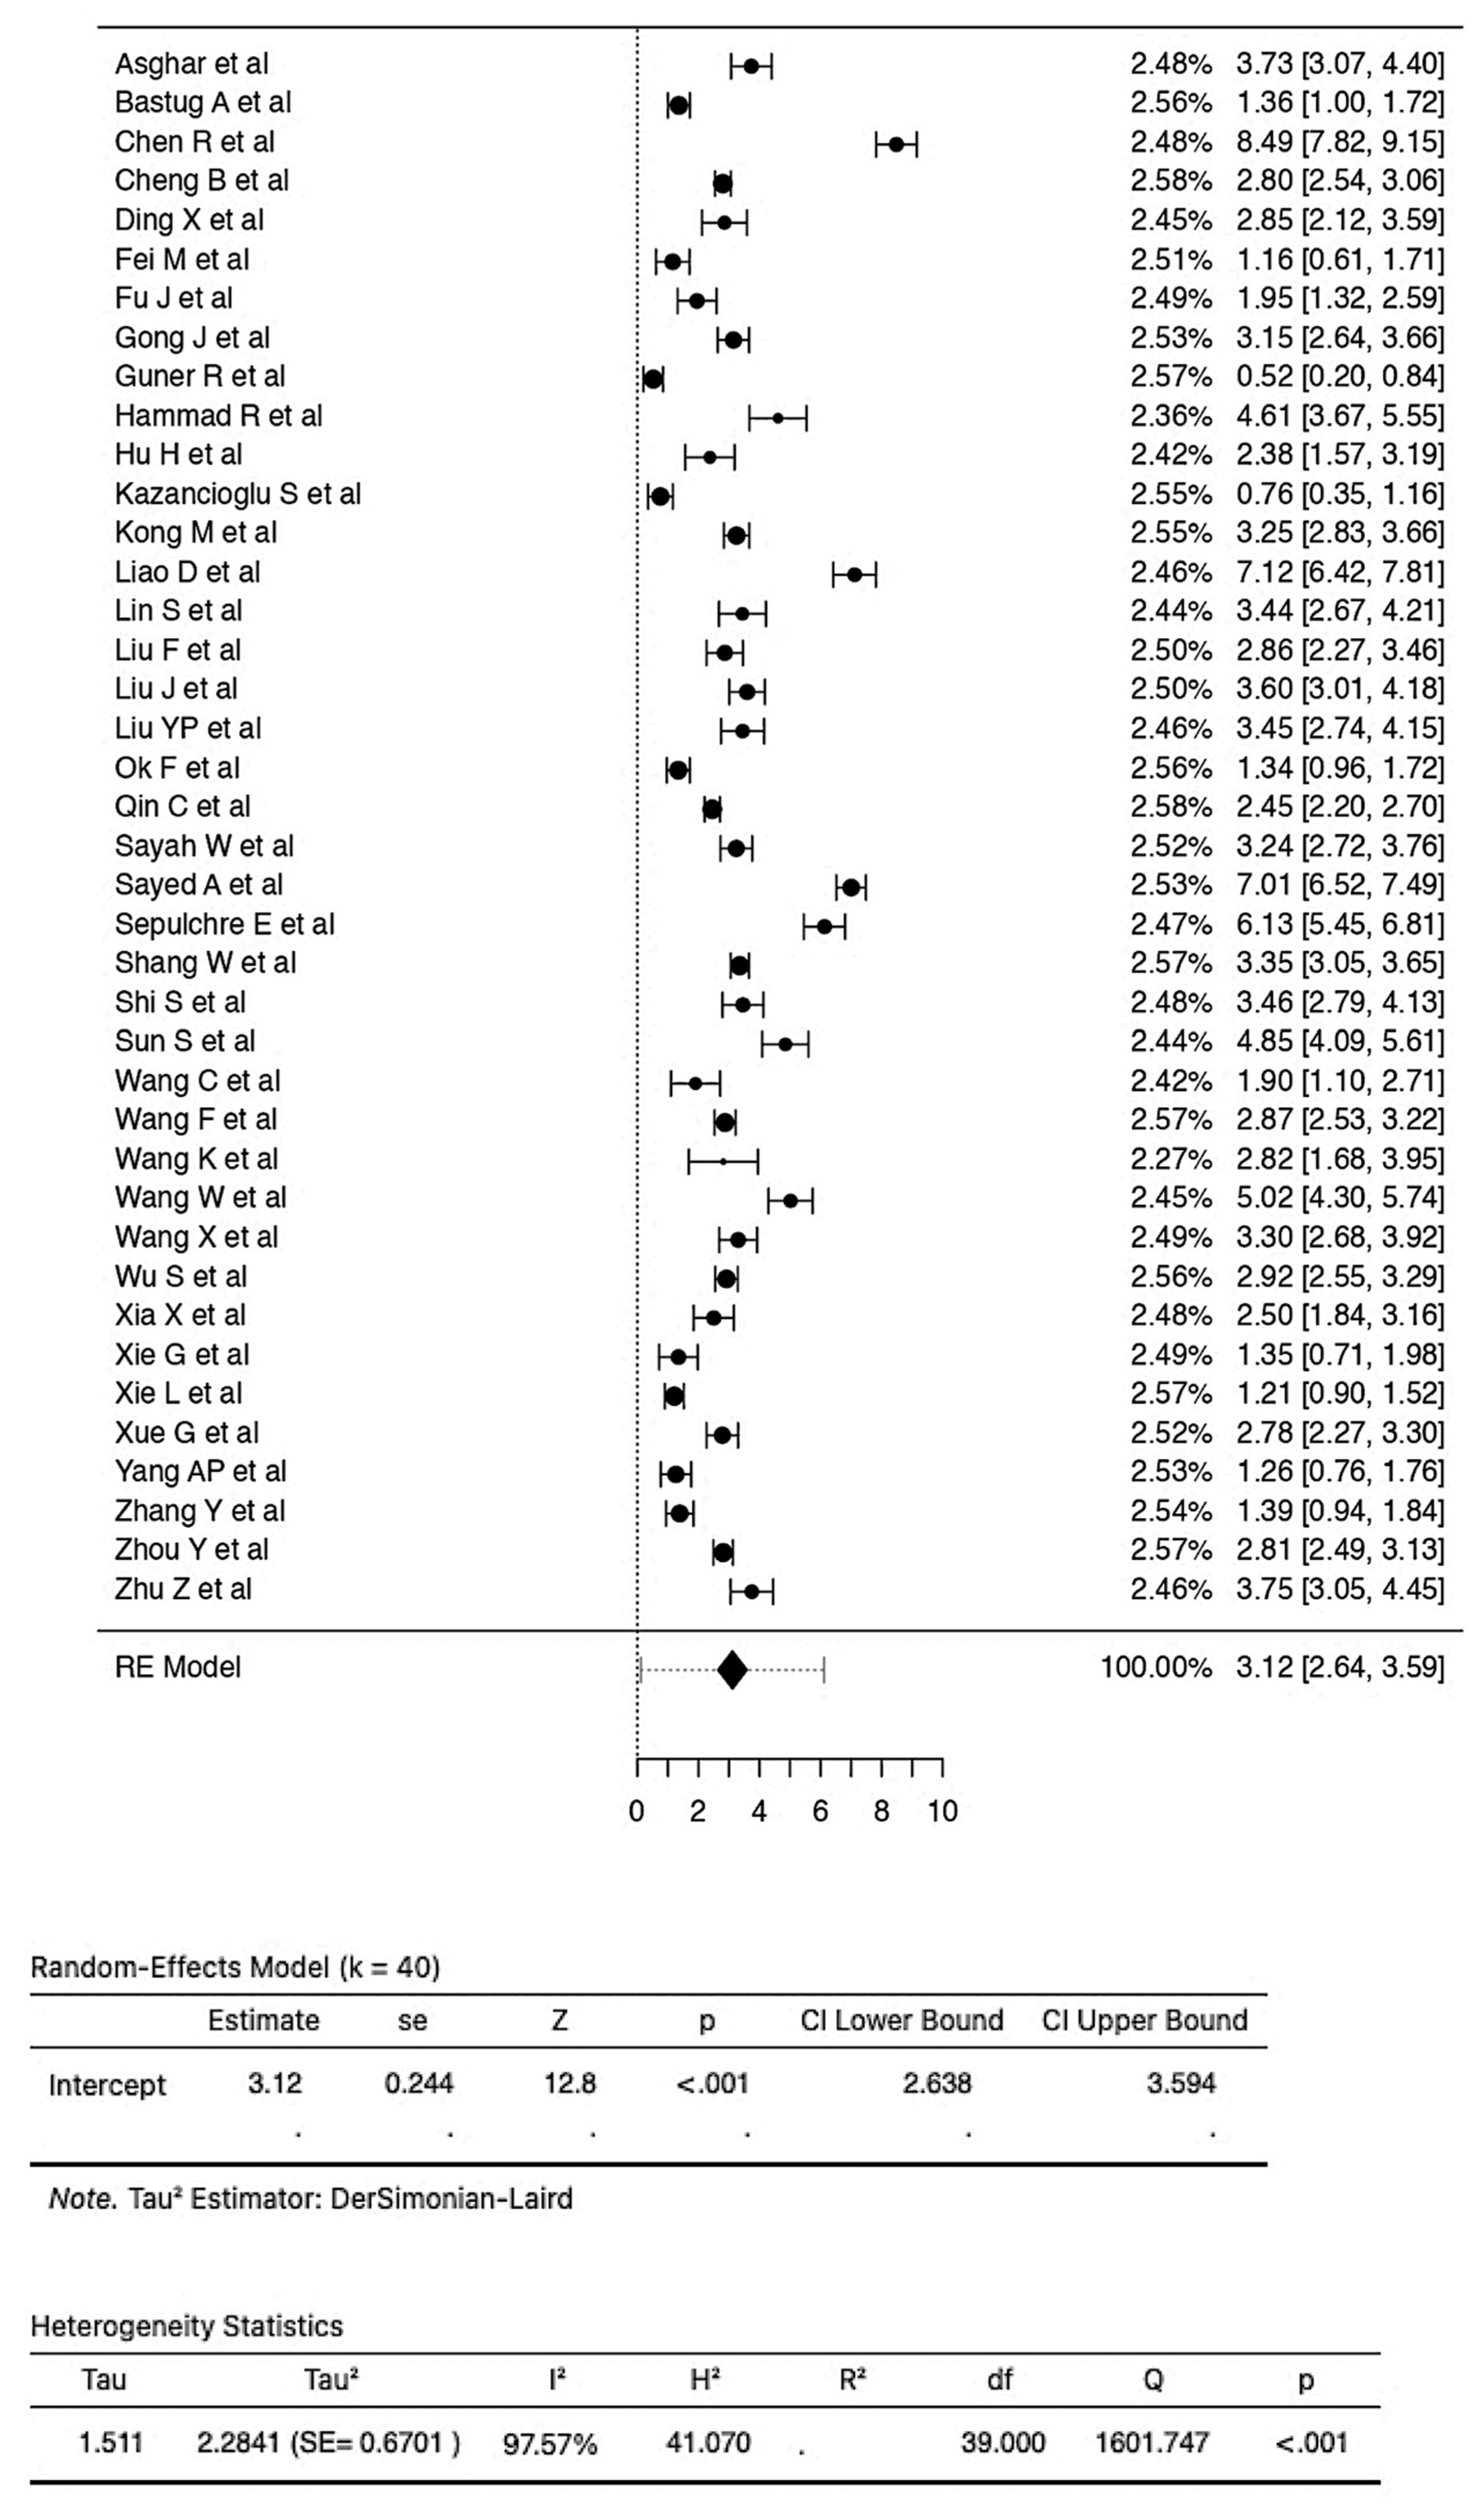
3.1. Examination of the Relationship between NLR Values and COVID-19 Severity
3.2. Examination of the Relationship between NLR Values and COVID-19 Mortality
4. Discussion
5. Conclusions
Supplementary Materials
Author Contributions
Funding
Institutional Review Board Statement
Informed Consent Statement
Data Availability Statement
Conflicts of Interest
References
- Zhou, G.; Chen, S.; Chen, Z. Back to the Spring of 2020: Facts and Hope of COVID-19 Outbreak. Front. Med. 2020, 14, 113–116. [Google Scholar] [CrossRef] [PubMed] [Green Version]
- WHO. WHO’s Global Health Observatory. Available online: https://www.who.int/data/gho (accessed on 12 October 2021).
- COVID-19 Coronavirus Pandemic. Available online: https://www.worldometers.info/coronavirus/ (accessed on 20 June 2021).
- Feng, W.; Zong, W.; Wang, F.; Ju, S. Severe Acute Respiratory Syndrome Coronavirus 2 (SARS-CoV-2): A Review. Mol. Cancer 2020, 19, 100. [Google Scholar] [CrossRef] [PubMed]
- Tabata, S.; Imai, K.; Kawano, S.; Ikeda, M.; Kodama, T.; Miyoshi, K.; Obinata, H.; Mimura, S.; Kodera, T.; Kitagaki, M.; et al. Clinical Characteristics of COVID-19 in 104 People with SARS-CoV-2 Infection on the Diamond Princess Cruise Ship: A Retrospective Analysis. Lancet Infect. Dis. 2020, 20, 1043–1050. [Google Scholar] [CrossRef]
- Wu, C.; Chen, X.; Cai, Y.; Xia, J.; Zhou, X.; Xu, S.; Huang, H.; Zhang, L.; Zhou, X.; Du, C.; et al. Risk Factors Associated With Acute Respiratory Distress Syndrome and Death in Patients With Coronavirus Disease 2019 Pneumonia in Wuhan, China. JAMA Intern. Med. 2020, 180, 934. [Google Scholar] [CrossRef] [PubMed] [Green Version]
- Ferrando, C.; Suarez-Sipmann, F.; Mellado-Artigas, R.; Hernández, M.; Gea, A.; Arruti, E.; Aldecoa, C.; Martínez-Pallí, G.; Martínez-González, M.A.; Slutsky, A.S.; et al. Clinical Features, Ventilatory Management, and Outcome of ARDS Caused by COVID-19 Are Similar to Other Causes of ARDS. Intensive Care Med. 2020, 46, 2200–2211. [Google Scholar] [CrossRef] [PubMed]
- Chen, N.; Zhou, M.; Dong, X.; Qu, J.; Gong, F.; Han, Y.; Qiu, Y.; Wang, J.; Liu, Y.; Wei, Y.; et al. Epidemiological and Clinical Characteristics of 99 Cases of 2019 Novel Coronavirus Pneumonia in Wuhan, China: A Descriptive Study. Lancet Lond. Engl. 2020, 395, 507–513. [Google Scholar] [CrossRef] [Green Version]
- Johansson, C.; Kirsebom, F.C.M. Neutrophils in Respiratory Viral Infections. Mucosal Immunol. 2021, 14, 815–827. [Google Scholar] [CrossRef]
- Menges, T.; Engel, J.; Welters, I.; Wagner, R.M.; Little, S.; Ruwoldt, R.; Wollbrueck, M.; Hempelmann, G. Changes in Blood Lymphocyte Populations after Multiple Trauma: Association with Posttraumatic Complications. Crit. Care Med. 1999, 27, 733–740. [Google Scholar] [CrossRef]
- Russell, C.D.; Parajuli, A.; Gale, H.J.; Bulteel, N.S.; Schuetz, P.; de Jager, C.P.C.; Loonen, A.J.M.; Merekoulias, G.I.; Baillie, J.K. The Utility of Peripheral Blood Leucocyte Ratios as Biomarkers in Infectious Diseases: A Systematic Review and Meta-Analysis. J. Infect. 2019, 78, 339–348. [Google Scholar] [CrossRef] [Green Version]
- WHO Middle East Respiratory Syndrome Coronavirus 2021. Available online: https://www.who.int/health-topics/middle-east-respiratory-syndrome-coronavirus-mers#tab=tab_1 (accessed on 18 June 2021).
- Kumar, A.; Sarkar, P.G.; Pant, P.; Kumar, J. Does Neutrophil-to-Lymphocyte Ratio at Admission Predict Severity and Mortality in COVID-19 Patients? A Systematic Review and Meta-Analysis. Indian J. Crit. Care Med. 2022, 26, 361–375. [Google Scholar] [CrossRef]
- Simadibrata, D.M.; Calvin, J.; Wijaya, A.D.; Ibrahim, N.A.A. Neutrophil-to-Lymphocyte Ratio on Admission to Predict the Severity and Mortality of COVID-19 Patients: A Meta-Analysis. Am. J. Emerg. Med. 2021, 42, 60–69. [Google Scholar] [CrossRef]
- Wang, Y.; Zhao, J.; Yang, L.; Hu, J.; Yao, Y. Value of the Neutrophil-Lymphocyte Ratio in Predicting COVID-19 Severity: A Meta-Analysis. Dis. Markers 2021, 2021, 2571912. [Google Scholar] [CrossRef] [PubMed]
- Li, X.; Liu, C.; Mao, Z.; Xiao, M.; Wang, L.; Qi, S.; Zhou, F. Predictive Values of Neutrophil-to-Lymphocyte Ratio on Disease Severity and Mortality in COVID-19 Patients: A Systematic Review and Meta-Analysis. Crit. Care 2020, 24, 647. [Google Scholar] [CrossRef] [PubMed]
- Azab, B.; Camacho-Rivera, M.; Taioli, E. Average Values and Racial Differences of Neutrophil Lymphocyte Ratio among a Nationally Representative Sample of United States Subjects. PLoS ONE 2014, 9, e112361. [Google Scholar] [CrossRef] [PubMed] [Green Version]
- Higgins, J.; Sterne, J.; Savović, J.; Chandler, J.; McKenzie, J.; Boutron, I.; Welch, V. Cochrane Methods. Cochrane Database Syst. Rev. 2016, 10. [Google Scholar]
- Whiting, P.F.; Rutjes, A.W.S.; Westwood, M.E.; Mallett, S.; Deeks, J.J.; Reitsma, J.B.; Leeflang, M.M.G.; Sterne, J.A.C.; Bossuyt, P.M.M. QUADAS-2 Group QUADAS-2: A Revised Tool for the Quality Assessment of Diagnostic Accuracy Studies. Ann. Intern. Med. 2011, 155, 529–536. [Google Scholar] [CrossRef]
- Wallace, B.C.; Issa, J.; Dahabreh, T.A.; Trikalinos, J.; Lau, P.T.; Christopher, H. OpenMetaAnalyst. Available online: http://www.cebm.brown.edu/openmeta/download.html (accessed on 15 June 2021).
- Hozo, S.P.; Djulbegovic, B.; Hozo, I. Estimating the Mean and Variance from the Median, Range, and the Size of a Sample. BMC Med. Res. Methodol. 2005, 5, 13. [Google Scholar] [CrossRef] [PubMed] [Green Version]
- Abrishami, A.; Eslami, V.; Baharvand, Z.; Khalili, N.; Saghamanesh, S.; Zarei, E.; Sanei-Taheri, M. Epicardial Adipose Tissue, Inflammatory Biomarkers and COVID-19: Is There a Possible Relationship? Int. Immunopharmacol. 2021, 90, 107174. [Google Scholar] [CrossRef] [PubMed]
- Acar, E.; Demir, A.; Yıldırım, B.; Kaya, M.G.; Gökçek, K. The Role of Hemogram Parameters and C-Reactive Protein in Predicting Mortality in COVID-19 Infection. Int. J. Clin. Pract. 2021, e14256. [Google Scholar] [CrossRef] [PubMed]
- Asghar, M.S.; Haider Kazmi, S.J.; Ahmed Khan, N.; Akram, M.; Ahmed Khan, S.; Rasheed, U.; Hassan, M.; Memon, G.M. Clinical Profiles, Characteristics, and Outcomes of the First 100 Admitted COVID-19 Patients in Pakistan: A Single-Center Retrospective Study in a Tertiary Care Hospital of Karachi. Cureus 2020, 12, 8712. [Google Scholar] [CrossRef]
- Bastug, A.; Bodur, H.; Erdogan, S.; Gokcinar, D.; Kazancioglu, S.; Kosovali, B.D.; Ozbay, B.O.; Gok, G.; Turan, I.O.; Yilmaz, G.; et al. Clinical and Laboratory Features of COVID-19: Predictors of Severe Prognosis. Int. Immunopharmacol. 2020, 88, 106950. [Google Scholar] [CrossRef] [PubMed]
- Bg, S.; Gosavi, S.; Ananda Rao, A.; Shastry, S.; Raj, S.C.; Sharma, A.; Suresh, A.; Noubade, R. Neutrophil-to-Lymphocyte, Lymphocyte-to-Monocyte, and Platelet-to-Lymphocyte Ratios: Prognostic Significance in COVID-19. Cureus 2021, 13, 12622. [Google Scholar] [CrossRef] [PubMed]
- Chen, F.-F.; Zhong, M.; Liu, Y.; Zhang, Y.; Zhang, K.; Su, D.-Z.; Meng, X.; Zhang, Y. The Characteristics and Outcomes of 681 Severe Cases with COVID-19 in China. J. Crit. Care 2020, 60, 32–37. [Google Scholar] [CrossRef]
- Chen, L.; Yu, J.; He, W.; Chen, L.; Yuan, G.; Dong, F.; Chen, W.; Cao, Y.; Yang, J.; Cai, L.; et al. Risk Factors for Death in 1859 Subjects with COVID-19. Leukemia 2020, 34, 2173–2183. [Google Scholar] [CrossRef] [PubMed]
- Chen, R.; Sang, L.; Jiang, M.; Yang, Z.; Jia, N.; Fu, W.; Xie, J.; Guan, W.; Liang, W.; Ni, Z.; et al. Longitudinal Hematologic and Immunologic Variations Associated with the Progression of COVID-19 Patients in China. J. Allergy Clin. Immunol. 2020, 146, 89–100. [Google Scholar] [CrossRef] [PubMed]
- Cheng, B.; Hu, J.; Zuo, X.; Chen, J.; Li, X.; Chen, Y.; Yang, G.; Shi, X.; Deng, A. Predictors of Progression from Moderate to Severe Coronavirus Disease 2019: A Retrospective Cohort. Clin. Microbiol. Infect. 2020, 26, 1400–1405. [Google Scholar] [CrossRef]
- Ding, X.; Yu, Y.; Lu, B.; Huo, J.; Chen, M.; Kang, Y.; Lou, J.; Liu, Z. Dynamic Profile and Clinical Implications of Hematological Parameters in Hospitalized Patients with Coronavirus Disease 2019. Clin. Chem. Lab. Med. 2020, 58, 1365–1371. [Google Scholar] [CrossRef] [PubMed]
- Fei, M.; Tong, F.; Tao, X.; Wang, J. Value of neutrophil-to-lymphocyte ratio in the classification diagnosis of coronavirus disease 2019. Zhonghua Wei Zhong Bing Ji Jiu Yi Xue 2020, 32, 554–558. [Google Scholar] [CrossRef] [PubMed]
- Fu, J.; Kong, J.; Wang, W.; Wu, M.; Yao, L.; Wang, Z.; Jin, J.; Wu, D.; Yu, X. The Clinical Implication of Dynamic Neutrophil to Lymphocyte Ratio and D-Dimer in COVID-19: A Retrospective Study in Suzhou China. Thromb. Res. 2020, 192, 3–8. [Google Scholar] [CrossRef]
- Ghazanfari, T.; Salehi, M.R.; Namaki, S.; Arabkheradmand, J.; Rostamian, A.; Rajabnia Chenary, M.; Ghaffarpour, S.; Kaboudanian Ardestani, S.; Edalatifard, M.; Naghizadeh, M.M.; et al. Interpretation of Hematological, Biochemical, and Immunological Findings of COVID-19 Disease: Biomarkers Associated with Severity and Mortality. Iran. J. Allergy Asthma Immunol. 2021. [Google Scholar] [CrossRef]
- Gong, J.; Ou, J.; Qiu, X.; Jie, Y.; Chen, Y.; Yuan, L.; Cao, J.; Tan, M.; Xu, W.; Zheng, F.; et al. A Tool for Early Prediction of Severe Coronavirus Disease 2019 (COVID-19): A Multicenter Study Using the Risk Nomogram in Wuhan and Guangdong, China. Clin. Infect. Dis. 2020, 71, 833–840. [Google Scholar] [CrossRef] [PubMed] [Green Version]
- Goya, R.L.R.; Utrero-Rico, A.; Talayero, P.; Lasa-Lazaro, M.; Ramirez-Fernandez, A.; Naranjo, L.; Segura-Tudela, A.; Cabrera-Marante, O.; Rodriguez de Frias, E.; Garcia-Garcia, R.; et al. IL-6-Based Mortality Risk Model for Hospitalized Patients with COVID-19. J. Allergy Clin. Immunol. 2020, 146, 799–807.e9. [Google Scholar] [CrossRef] [PubMed]
- Güner, R.; Hasanoğlu, İ.; Kayaaslan, B.; Aypak, A.; Kaya Kalem, A.; Eser, F.; Özdemir, B.; Sarıcaoğlu, E.M.; Ayhan, M.; Aybar Bilir, Y.; et al. COVID-19 Experience of the Major Pandemic Response Center in the Capital: Results of the Pandemic’s First Month in Turkey. Turk. J. Med. Sci. 2020, 50, 1801–1809. [Google Scholar] [CrossRef]
- Güneysu, F.; Guner, N.G.; Erdem, A.F.; Durmus, E.; Durgun, Y.; Yurumez, Y. Can COVID-19 Mortality Be Predicted in the Emergency Room? J. Coll. Physicians Surg.-Pak. 2020, 30, 928–932. [Google Scholar] [CrossRef] [PubMed]
- Hammad, R.; Eldosoky, M.A.E.R.; Fouad, S.H.; Elgendy, A.; Tawfeik, A.M.; Alboraie, M.; Abdelmaksoud, M.F. Circulating Cell-Free DNA, Peripheral Lymphocyte Subsets Alterations and Neutrophil Lymphocyte Ratio in Assessment of COVID-19 Severity. Innate Immun. 2021, 27, 240–250. [Google Scholar] [CrossRef]
- Hu, H.; Du, H.; Li, J.; Wang, Y.; Wu, X.; Wang, C.; Zhang, Y.; Zhang, G.; Zhao, Y.; Kang, W.; et al. Early Prediction and Identification for Severe Patients during the Pandemic of COVID-19: A Severe COVID-19 Risk Model Constructed by Multivariate Logistic Regression Analysis. J. Glob. Health 2020, 10, 020510. [Google Scholar] [CrossRef] [PubMed]
- Huang, J.; Cheng, A.; Kumar, R.; Fang, Y.; Chen, G.; Zhu, Y.; Lin, S. Hypoalbuminemia Predicts the Outcome of COVID-19 Independent of Age and Co-morbidity. J. Med. Virol. 2020, 92, 2152–2158. [Google Scholar] [CrossRef] [PubMed]
- Kazancioglu, S.; Bastug, A.; Ozbay, B.O.; Kemirtlek, N.; Bodur, H. The Role of Haematological Parameters in Patients with COVID-19 and Influenza Virus Infection. Epidemiol. Infect. 2020, 148, e272. [Google Scholar] [CrossRef]
- Kong, M.; Zhang, H.; Cao, X.; Mao, X.; Lu, Z. Higher Level of Neutrophil-to-Lymphocyte Is Associated with Severe COVID-19. Epidemiol. Infect. 2020, 148, e139. [Google Scholar] [CrossRef]
- Li, L.; Yang, L.; Gui, S.; Pan, F.; Ye, T.; Liang, B.; Hu, Y.; Zheng, C. Association of Clinical and Radiographic Findings with the Outcomes of 93 Patients with COVID-19 in Wuhan, China. Theranostics 2020, 10, 6113–6121. [Google Scholar] [CrossRef] [PubMed]
- Liao, D.; Zhou, F.; Luo, L.; Xu, M.; Wang, H.; Xia, J.; Gao, Y.; Cai, L.; Wang, Z.; Yin, P.; et al. Haematological Characteristics and Risk Factors in the Classification and Prognosis Evaluation of COVID-19: A Retrospective Cohort Study. Lancet Haematol. 2020, 7, e671–e678. [Google Scholar] [CrossRef]
- Lin, S.; Mao, W.; Zou, Q.; Lu, S.; Zheng, S. Associations between Hematological Parameters and Disease Severity in Patients with SARS-CoV-2 Infection. J. Clin. Lab. Anal. 2021, 35, 23604. [Google Scholar] [CrossRef] [PubMed]
- Liu, F.; Zhang, Q.; Huang, C.; Shi, C.; Wang, L.; Shi, N.; Fang, C.; Shan, F.; Mei, X.; Shi, J.; et al. CT Quantification of Pneumonia Lesions in Early Days Predicts Progression to Severe Illness in a Cohort of COVID-19 Patients. Theranostics 2020, 10, 5613–5622. [Google Scholar] [CrossRef] [PubMed]
- Liu, J.; Liu, Y.; Xiang, P.; Pu, L.; Xiong, H.; Li, C.; Zhang, M.; Tan, J.; Xu, Y.; Song, R.; et al. Neutrophil-to-Lymphocyte Ratio Predicts Critical Illness Patients with 2019 Coronavirus Disease in the Early Stage. J. Transl. Med. 2020, 18, 206. [Google Scholar] [CrossRef]
- Liu, Y.-P.; Li, G.-M.; He, J.; Liu, Y.; Li, M.; Zhang, R.; Li, Y.-L.; Wu, Y.-Z.; Diao, B. Combined Use of the Neutrophil-to-Lymphocyte Ratio and CRP to Predict 7-Day Disease Severity in 84 Hospitalized Patients with COVID-19 Pneumonia: A Retrospective Cohort Study. Ann. Transl. Med. 2020, 8, 635. [Google Scholar] [CrossRef]
- Liu, Y.; Du, X.; Chen, J.; Jin, Y.; Peng, L.; Wang, H.H.X.; Luo, M.; Chen, L.; Zhao, Y. Neutrophil-to-Lymphocyte Ratio as an Independent Risk Factor for Mortality in Hospitalized Patients with COVID-19. J. Infect. 2020, 81, e6–e12. [Google Scholar] [CrossRef]
- Luo, X.; Zhou, W.; Yan, X.; Guo, T.; Wang, B.; Xia, H.; Ye, L.; Xiong, J.; Jiang, Z.; Liu, Y.; et al. Prognostic Value of C-Reactive Protein in Patients With Coronavirus 2019. Clin. Infect. Dis. 2020, 71, 2174–2179. [Google Scholar] [CrossRef]
- Ok, F.; Erdogan, O.; Durmus, E.; Carkci, S.; Canik, A. Predictive Values of Blood Urea Nitrogen/Creatinine Ratio and Other Routine Blood Parameters on Disease Severity and Survival of COVID-19 Patients. J. Med. Virol. 2021, 93, 786–793. [Google Scholar] [CrossRef]
- Qin, C.; Zhou, L.; Hu, Z.; Zhang, S.; Yang, S.; Tao, Y.; Xie, C.; Ma, K.; Shang, K.; Wang, W.; et al. Dysregulation of Immune Response in Patients With Coronavirus 2019 (COVID-19) in Wuhan, China. Clin. Infect. Dis. 2020, 71, 762–768. [Google Scholar] [CrossRef] [PubMed]
- Ramesh, J.; Reddy, S.L.S.; Rajesh, M.; Varghese, J. Evaluation of Simple and Cost-Effective Immuno-Haematological Markers to Predict Outcome in Hospitalized Severe COVID-19 Patients, with a Focus on Diabetes Mellitus—A Retrospective Study in Andhra Pradesh, India. Diabetes Metab. Syndr. Clin. Res. Rev. 2021, 15, 739–745. [Google Scholar] [CrossRef]
- Sanchez, A.A.; Gonzalez-Rios, R.D.; Alberti-Minutti, P.; Noyola-Garcia, M.E.; Contreras-Garcia, C.E.; Anda-Garay, J.C.; Martinez-Ascencio, L.E.; Castillo-Lopez, D.J.; Reyes-Naranjo, L.A.; Guizar-Garcia, L.A.; et al. Association of Neutrophil-to-Lymphocyte and Lymphocyte-to-C-Reactive Protein Ratios with COVID-19-Related Mortality. Gac. Med. Mex. 2020, 156, 553–558. [Google Scholar] [CrossRef]
- Sayah, W.; Berkane, I.; Guermache, I.; Sabri, M.; Lakhal, F.Z.; Rahali, S.Y.; Djidjeli, A.; Mahammed, L.L.; Merah, F.; Belaid, B.; et al. Interleukin-6, Procalcitonin and Neutrophil-to-Lymphocyte Ratio: Potential Immune-Inflammatory Parameters to Identify Severe and Fatal Forms of COVID-19. Cytokine 2021, 141, 155428. [Google Scholar] [CrossRef] [PubMed]
- Sayed, A.A.; Allam, A.A.; Sayed, A.I.; Alraey, M.A.; Joseph, M.V. The Use of Neutrophil-to-Lymphocyte Ratio (NLR) as a Marker for COVID-19 Infection in Saudi Arabia: A Case-Control Retrospective Multicenter Study. Saudi Med. J. 2021, 42, 370. [Google Scholar] [CrossRef] [PubMed]
- Seo, J.-W.; Kim, S.E.; Choi, E.Y.; Hong, K.S.; Oh, T.H.; Kim, U.J.; Kang, S.-J.; Park, K.-H.; Jung, S.-I.; Kim, D.Y.; et al. Risk Factors and a Scoring System to Predict ARDS in Patients with COVID-19 Pneumonia in Korea: A Multicenter Cohort Study. Markers 2021, 2021, 8821697. [Google Scholar] [CrossRef] [PubMed]
- Sepulchre, E.; Pittie, G.; Stojkovic, V.; Haesbroek, G.; Crama, Y.; Schyns, M.; Paridaens, H.; de Marchin, J.; Degesves, S.; Biemar, C.; et al. COVID-19: Contribution of Clinical Characteristics and Laboratory Features for Early Detection of Patients with High Risk of Severe Evolution. Acta Clin. Belg. 2022, 77, 261–267. [Google Scholar] [CrossRef] [PubMed]
- Shang, W.; Dong, J.; Ren, Y.; Tian, M.; Li, W.; Hu, J.; Li, Y. The Value of Clinical Parameters in Predicting the Severity of COVID-19. J. Med. Virol. 2020, 92, 2188–2192. [Google Scholar] [CrossRef] [PubMed]
- Shi, S.; Liu, X.; Xiao, J.; Wang, H.; Chen, L.; Li, J.; Han, K. Prediction of Adverse Clinical Outcomes in Patients with Coronavirus Disease 2019. J. Clin. Lab. Anal. 2021, 35, e23598. [Google Scholar] [CrossRef]
- Sun, S.; Cai, X.; Wang, H.; He, G.; Lin, Y.; Lu, B.; Chen, C.; Pan, Y.; Hu, X. Abnormalities of Peripheral Blood System in Patients with COVID-19 in Wenzhou, China. Clin. Chim. Acta 2020, 507, 174–180. [Google Scholar] [CrossRef]
- Tatum, D.; Taghavi, S.; Houghton, A.; Stover, J.; Toraih, E.; Duchesne, J. Neutrophil-to-Lymphocyte Ratio and Outcomes in Louisiana COVID-19 Patients. Shock Augusta Ga 2020, 54, 652–658. [Google Scholar] [CrossRef]
- Ullah, W.; Basyal, B.; Tariq, S.; Almas, T.; Saeed, R.; Roomi, S.; Haq, S.; Madara, J.; Boigon, M.; Haas, D.C.; et al. Lymphocyte-to-C-Reactive Protein Ratio: A Novel Predictor of Adverse Outcomes in COVID-19. J. Clin. Med. Res. 2020, 12, 415–422. [Google Scholar] [CrossRef]
- Wang, C.; Deng, R.; Gou, L.; Fu, Z.; Zhang, X.; Shao, F.; Wang, G.; Fu, W.; Xiao, J.; Ding, X.; et al. Preliminary Study to Identify Severe from Moderate Cases of COVID-19 Using Combined Hematology Parameters. Ann. Transl. Med. 2020, 8, 593. [Google Scholar] [CrossRef] [PubMed]
- Wang, F.; Qu, M.; Zhou, X.; Zhao, K.; Lai, C.; Tang, Q.; Xian, W.; Chen, R.; Li, X.; Li, Z.; et al. The Timeline and Risk Factors of Clinical Progression of COVID-19 in Shenzhen, China. J. Transl. Med. 2020, 18, 270. [Google Scholar] [CrossRef]
- Wang, K.; Wang, X.; Du, J.; Liu, C.; Jiang, Y.; Zhang, H.; Jiang, H.; Fu, Q. Relationship between Changes in the Course of COVID-19 and Ratio of Neutrophils-to-Lymphocytes and Related Parameters in Patients with Severe vs. Common Disease. Epidemiol. Infect. 2021, 149, e81. [Google Scholar] [CrossRef] [PubMed]
- Wang, W.; Zhao, Z.; Liu, X.; Liu, G.; Xie, D.; Xu, Z.; Zhao, J.; Zhang, J. Clinical Features and Potential Risk Factors for Discerning the Critical Cases and Predicting the Outcome of Patients with COVID-19. J. Clin. Lab. Anal. 2020, 34, e23557. [Google Scholar] [CrossRef] [PubMed]
- Wang, X.; Li, X.; Shang, Y.; Wang, J.; Zhang, X.; Su, D.; Zhao, S.; Wang, Q.; Liu, L.; Li, Y.; et al. Ratios of Neutrophil-to-Lymphocyte and Platelet-to-Lymphocyte Predict All-Cause Mortality in Inpatients with Coronavirus Disease 2019 (COVID-19): A Retrospective Cohort Study in a Single Medical Centre. Epidemiol. Infect. 2020, 148, e211. [Google Scholar] [CrossRef] [PubMed]
- Wu, S.; Du, Z.; Shen, S.; Zhang, B.; Yang, H.; Li, X.; Cui, W.; Cheng, F.; Huang, J. Identification and Validation of a Novel Clinical Signature to Predict the Prognosis in Confirmed Coronavirus Disease 2019 Patients. Clin. Infect. Dis. 2020, 71, 3154–3162. [Google Scholar] [CrossRef] [PubMed]
- Xia, X.; Wen, M.; Zhan, S.; He, J.; Chen, W. An increased neutrophil/lymphocyte ratio is an early warning signal of severe COVID-19. Nan Fang Yi Ke Da Xue Xue Bao 2020, 40, 333–336. [Google Scholar] [CrossRef]
- Xie, G.; Ding, F.; Han, L.; Yin, D.; Lu, H.; Zhang, M. The Role of Peripheral Blood Eosinophil Counts in COVID-19 Patients. Allergy 2021, 76, 471–482. [Google Scholar] [CrossRef]
- Xie, L.; Wu, Q.; Lin, Q.; Liu, X.; Lin, W.; Hao, S.; Hu, W.; Xiang, G.; Lu, H.; Li, S. Dysfunction of Adaptive Immunity Is Related to Severity of COVID-19: A Retrospective Study. Ther. Adv. Respir. Dis. 2020, 14, 175346662094212. [Google Scholar] [CrossRef]
- Xu, J.; Xu, C.; Zhang, R.; Wu, M.; Pan, C.; Li, X.; Wang, Q.; Zeng, F.; Zhu, S. Associations of Procalcitonin, C-Reaction Protein and Neutrophil-to-Lymphocyte Ratio with Mortality in Hospitalized COVID-19 Patients in China. Sci. Rep. 2020, 10, 15058. [Google Scholar] [CrossRef]
- Xue, G.; Gan, X.; Wu, Z.; Xie, D.; Xiong, Y.; Hua, L.; Zhou, B.; Zhou, N.; Xiang, J.; Li, J. Novel Serological Biomarkers for Inflammation in Predicting Disease Severity in Patients with COVID-19. Int. Immunopharmacol. 2020, 89, 107065. [Google Scholar] [CrossRef]
- Yan, X.; Li, F.; Wang, X.; Yan, J.; Zhu, F.; Tang, S.; Deng, Y.; Wang, H.; Chen, R.; Yu, Z.; et al. Neutrophil to Lymphocyte Ratio as Prognostic and Predictive Factor in Patients with Coronavirus Disease 2019: A Retrospective Cross-Sectional Study. J. Med. Virol. 2020, 92, 2573–2581. [Google Scholar] [CrossRef]
- Yang, A.-P.; Liu, J.; Tao, W.; Li, H. The Diagnostic and Predictive Role of NLR, d-NLR and PLR in COVID-19 Patients. Int. Immunopharmacol. 2020, 84, 106504. [Google Scholar] [CrossRef]
- Yang, Q.; Zhou, Y.; Wang, X.; Gao, S.; Xiao, Y.; Zhang, W.; Hu, Y.; Wang, Y. Effect of Hypertension on Outcomes of Adult Inpatients with COVID-19 in Wuhan, China: A Propensity Score–Matching Analysis. Respir. Res. 2020, 21, 172. [Google Scholar] [CrossRef]
- Yavuz, B.G.; Colak, S.; Guven, R.; Altundag, İ.; Seyhan, A.U.; Gunay Inanc, R. Clinical Features of the 60 Years and Older Patients Infected with 2019 Novel Coronavirus: Can We Predict Mortality Earlier? Gerontology 2021, 67, 433–440. [Google Scholar] [CrossRef]
- Ye, W.; Chen, G.; Li, X.; Lan, X.; Ji, C.; Hou, M.; Zhang, D.; Zeng, G.; Wang, Y.; Xu, C.; et al. Dynamic Changes of D-Dimer and Neutrophil-Lymphocyte Count Ratio as Prognostic Biomarkers in COVID-19. Respir. Res. 2020, 21, 169. [Google Scholar] [CrossRef]
- Zhang, N.; Xu, X.; Zhou, L.-Y.; Chen, G.; Li, Y.; Yin, H.; Sun, Z. Clinical Characteristics and Chest CT Imaging Features of Critically Ill COVID-19 Patients. Eur. Radiol. 2020, 30, 6151–6160. [Google Scholar] [CrossRef]
- Zhang, S.; Guo, M.; Duan, L.; Wu, F.; Hu, G.; Wang, Z.; Huang, Q.; Liao, T.; Xu, J.; Ma, Y.; et al. Development and Validation of a Risk Factor-Based System to Predict Short-Term Survival in Adult Hospitalized Patients with COVID-19: A Multicenter, Retrospective, Cohort Study. Crit. Care 2020, 24, 438. [Google Scholar] [CrossRef]
- Zhang, Y.; Zheng, L.; Liu, L.; Zhao, M.; Xiao, J.; Zhao, Q. Liver Impairment in COVID-19 Patients: A Retrospective Analysis of 115 Cases from a Single Centre in Wuhan City, China. Liver Int. 2020, 40, 2095–2103. [Google Scholar] [CrossRef] [Green Version]
- Zhou, Y.; Guo, S.; He, Y.; Zuo, Q.; Liu, D.; Xiao, M.; Fan, J.; Li, X. COVID-19 Is Distinct From SARS-CoV-2-Negative Community-Acquired Pneumonia. Front. Cell. Infect. Microbiol. 2020, 10, 322. [Google Scholar] [CrossRef]
- Zhu, Z.; Cai, T.; Fan, L.; Lou, K.; Hua, X.; Huang, Z.; Gao, G. Clinical Value of Immune-Inflammatory Parameters to Assess the Severity of Coronavirus Disease 2019. Int. J. Infect. Dis. 2020, 95, 332–339. [Google Scholar] [CrossRef] [PubMed]
- Channappanavar, R.; Perlman, S. Pathogenic Human Coronavirus Infections: Causes and Consequences of Cytokine Storm and Immunopathology. Semin. Immunopathol. 2017, 39, 529–539. [Google Scholar] [CrossRef] [PubMed]
- Wang, F.; Nie, J.; Wang, H.; Zhao, Q.; Xiong, Y.; Deng, L.; Song, S.; Ma, Z.; Mo, P.; Zhang, Y. Characteristics of Peripheral Lymphocyte Subset Alteration in COVID-19 Pneumonia. J. Infect. Dis. 2020, 221, 1762–1769. [Google Scholar] [CrossRef] [Green Version]
- Zahorec, R. Ratio of Neutrophil to Lymphocyte Counts-Rapid and Simple Parameter of Systemic Inflammation and Stress in Critically Ill. Bratisl. Lek. Listy 2001, 102, 5–14. [Google Scholar]
- Pimentel, G.D.; Dela Vega, M.C.M.; Laviano, A. High Neutrophil to Lymphocyte Ratio as a Prognostic Marker in COVID-19 Patients. Clin. Nutr. ESPEN 2020, 40, 101–102. [Google Scholar] [CrossRef]
- Ponti, G.; Maccaferri, M.; Ruini, C.; Tomasi, A.; Ozben, T. Biomarkers Associated with COVID-19 Disease Progression. Crit. Rev. Clin. Lab. Sci. 2020, 57, 389–399. [Google Scholar] [CrossRef]
- Simadibrata, D.M.; Lubis, A.M. D-Dimer Levels on Admission and All-Cause Mortality Risk in COVID-19 Patients: A Meta-Analysis. Epidemiol. Infect. 2020, 148, e202. [Google Scholar] [CrossRef]
- Guo, J.; Fang, J.; Huang, X.; Liu, Y.; Yuan, Y.; Zhang, X.; Zou, C.; Xiao, K.; Wang, J. Prognostic Role of Neutrophil to Lymphocyte Ratio and Platelet to Lymphocyte Ratio in Prostate Cancer: A Meta-Analysis of Results from Multivariate Analysis. Int. J. Surg. 2018, 60, 216–223. [Google Scholar] [CrossRef]
- Gumus, F.; Solak, I.; Eryilmaz, M.A. The Effects of Smoking on Neutrophil/Lymphocyte, Platelet//Lymphocyte Ratios. Bratisl. Med. J. 2018, 119, 116–119. [Google Scholar] [CrossRef] [Green Version]
- Lee, J.S.; Kim, N.Y.; Na, S.H.; Youn, Y.H.; Shin, C.S. Reference Values of Neutrophil-Lymphocyte Ratio, Lymphocyte-Monocyte Ratio, Platelet-Lymphocyte Ratio, and Mean Platelet Volume in Healthy Adults in South Korea. Medicine 2018, 97, e11138. [Google Scholar] [CrossRef]
- Wu, L.; Zou, S.; Wang, C.; Tan, X.; Yu, M. Neutrophil-to-Lymphocyte and Platelet-to-Lymphocyte Ratio in Chinese Han Population from Chaoshan Region in South China. BMC Cardiovasc. Disord. 2019, 19, 125. [Google Scholar] [CrossRef] [PubMed] [Green Version]
- Parthasarathi, A.; Basavaraja, C.K.; Arunachala, S.; Chandran, S.; Venkataraman, H.; Satheesh, A.; Mahesh, P.A. Comorbidities Influence the Predictive Power of Hematological Markers for Mortality in Hospitalized COVID-19 Patients. Adv. Respir. Med. 2022, 90, 49–59. [Google Scholar] [CrossRef] [PubMed]
- Han, X.; Xu, P.; Ye, Q. Analysis of COVID-19 Vaccines: Types, Thoughts, and Application. J. Clin. Lab. Anal. 2021, 35, e23937. [Google Scholar] [CrossRef] [PubMed]
- Watson, O.J.; Barnsley, G.; Toor, J.; Hogan, A.B.; Winskill, P.; Ghani, A.C. Global Impact of the First Year of COVID-19 Vaccination: A Mathematical Modelling Study. Lancet Infect. Dis. 2022, S1473309922003206. [Google Scholar] [CrossRef]
- Parthasarathi, A.; Puvvada, R.K.; Basappa, S.; Krishna, M.T.; Mahesh, P.A. Global Intention of the General Public to Undergo COVID-19 Vaccination: Time Trends and Risk Factors for Vaccine Refusal, a Systematic Review and Meta-Analysis. Wellcome Open Res. 2022, 7, 17. [Google Scholar] [CrossRef]
- Mediu, R.; Rama, A.; Puca, E. Evaluation of Neutrophil-to-Lymphocyte Ratio and Immune Response in Patients Vaccinated with Pfizer-Biontech Vaccine. J. Infect. Dev. Ctries. 2022, 16, 745–751. [Google Scholar] [CrossRef] [PubMed]
- Gambardella, C.; Pagliuca, R.; Pomilla, G.; Gambardella, A. COVID-19 Risk Contagion: Organization and Procedures in a South Italy Geriatric Oncology Ward. J. Geriatr. Oncol. 2020, 11, 1187–1188. [Google Scholar] [CrossRef]


| Sl. No. | Study | Country | Study Design | Year | N | Outcome Measured | NOS Score |
|---|---|---|---|---|---|---|---|
| 1 | Abrishami A et al. [22] | Iran | Prospective | 2021 | 100 | Mortality | 7 |
| ROC analysis | |||||||
| 2 | Acar et al. [23] | Turkey | Prospective | 2021 | 148 | Mortality | 7 |
| ROC analysis | |||||||
| 3 | Asghar et al. [24] | Pakistan | Retrospective | 2020 | 100 | Severity | 7 |
| Mortality | |||||||
| ROC analysis | |||||||
| 4 | Bastug A et al. [25] | Turkey | Retrospective | 2020 | 191 | Severity | 7 |
| ROC analysis | |||||||
| 5 | BG et al. [26] | India | Retrospective | 2021 | 100 | Mortality | 7 |
| ROC analysis | |||||||
| 6 | Chen F et al. [27] | China | Retrospective | 2020 | 681 | Mortality | 7 |
| ROC analysis | |||||||
| 7 | Chen L et al. [28] | China | Prospective | 2020 | 1859 | Mortality | 9 |
| 8 | Chen R et al. [29] | China | Retrospective | 2020 | 548 | Severity | 9 |
| Mortality | |||||||
| 9 | Cheng B et al. [30] | China | Retrospective | 2020 | 456 | severity | 8 |
| Mortality | |||||||
| ROC analysis | |||||||
| 10 | Ding X et al. [31] | China | Retrospective | 2020 | 72 | Severity | 8 |
| 11 | Fei M et al. [32] | China | Retrospective | 2020 | 72 | Severity | 5 |
| ROC analysis | |||||||
| 12 | Fu J et al. [33] | China | Retrospective | 2020 | 75 | Severity | 6 |
| ROC analysis | |||||||
| 13 | Ghazanfari T et al. [34] | Turkey | Prospective | 2021 | 93 | ROC analysis | 7 |
| 14 | Gong J et al. [35] | China | Retrospective | 2020 | 372 | Severity | 7 |
| ROC analysis | |||||||
| 15 | Goya R L et al. [36] | Spain | Prospective | 2020 | 501 | Mortality | 6 |
| ROC analysis | |||||||
| 16 | Guner R et al. [37] | Turkey | Prospective | 2020 | 222 | Severity | 6 |
| 17 | Güneysu F et al. [38] | Turkey | Retrospective | 2020 | 169 | Mortality | 7 |
| ROC analysis | |||||||
| 18 | Hammad R et al. [39] | Egypt | Prospective | 2021 | 64 | Severity | 7 |
| ROC analysis | |||||||
| 19 | Hu H et al. [40] | China | Retrospective | 2020 | 40 | Severity | 6 |
| ROC analysis | |||||||
| 20 | Huang J et al. [41] | China | Retrospective | 2020 | 299 | Mortality | 8 |
| 21 | Kazancioglu S et al. [42] | China | Retrospective | 2020 | 181 | Severity | 8 |
| 22 | Kong M et al. [43] | China | Retrospective | 2020 | 210 | Severity | 7 |
| 23 | Li L et al. [44] | China | Retrospective | 2020 | 93 | Mortality | 7 |
| 24 | Liao D et al. [45] | China | Retrospective | 2020 | 466 | Severity | 7 |
| 25 | Lin S et al. [46] | China | Retrospective | 2021 | 68 | Severity | 7 |
| ROC analysis | |||||||
| 26 | Liu F et al. [47] | China | Retrospective | 2020 | 134 | Severity | 8 |
| ROC analysis | |||||||
| 27 | Liu J et al. [48] | China | Prospective | 2020 | 115 | Severity | 7 |
| ROC analysis | |||||||
| 28 | Liu YP et al. [49] | China | Retrospective | 2020 | 84 | Severity | 8 |
| ROC analysis | |||||||
| 29 | Liu Y [50] | China | Retrospective | 2020 | 245 | Mortality | 7 |
| 30 | Luo X et al. [51] | China | Retrospective | 2020 | 298 | Mortality | 8 |
| ROC analysis | |||||||
| 31 | Ok F et al. [52] | Turkey | Prospective | 2021 | 139 | Severity | 7 |
| ROC analysis | |||||||
| 32 | Qin C et al. [53] | China | Retrospective | 2020 | 452 | Severity | 5 |
| 33 | Ramesh J et al. [54] | India | Retrospective | 2021 | 154 | ROC analysis | 8 |
| 34 | Sanchez A et al. [55] | Mexico | Prospective | 2020 | 242 | Mortality | 6 |
| ROC analysis | |||||||
| 35 | Sayah W et al. [56] | Algeria | Prospective | 2021 | 153 | Severity | 8 |
| ROC analysis | |||||||
| 36 | Sayed A et al. [57] | Saudi Arabia | Retrospective | 2021 | 951 | Severity | 7 |
| ROC analysis | |||||||
| 37 | Seo J et al. [58] | Korea | Retrospective | 2021 | 166 | ROC analysis | 7 |
| 38 | Sepulchre E et al. [59] | Belgium | Retrospective | 2020 | 198 | Severity | 7 |
| Mortality | |||||||
| ROC analysis | |||||||
| 39 | Shang W et al. [60] | China | Retrospective | 2020 | 443 | Severity | 7 |
| ROC analysis | |||||||
| 40 | Shi S et al. [61] | China | Prospective | 2021 | 87 | Severity | 6 |
| ROC analysis | |||||||
| 41 | Sun S et al. [62] | China | Prospective | 2020 | 116 | Severity | 5 |
| ROC analysis | |||||||
| 42 | Tatum et al. [63] | USA | Prospective | 2020 | 125 | Mortality | 6 |
| ROC analysis | |||||||
| 43 | Ullah [64] | USA | Retrospective | 2020 | 176 | Mortality | 6 |
| 44 | Wang C et al. [65] | China | Retrospective | 2020 | 45 | Severity | 7 |
| ROC analysis | |||||||
| 45 | Wang F et al. [66] | China | Retrospective | 2020 | 333 | Severity | 8 |
| 46 | Wang K et al. [67] | China | Retrospective | 2021 | 38 | Severity | 7 |
| ROC analysis | |||||||
| 47 | Wang W et al. [68] | China | Retrospective | 2020 | 123 | Severity | 7 |
| ROC analysis | |||||||
| 48 | Wang X et al. [69] | China | Retrospective | 2020 | 131 | Mortality | 7 |
| Severity | |||||||
| ROC analysis | |||||||
| 49 | Wu S et al. [70] | China | Retrospective | 2020 | 270 | Severity | 7 |
| ROC analysis | |||||||
| 50 | Xia X et al. [71] | China | Retrospective | 2020 | 63 | Severity | 8 |
| ROC analysis | |||||||
| 51 | Xie G et al. [72] | China | Retrospective | 2020 | 324 | Severity | |
| ROC analysis | 5 | ||||||
| 52 | Xie L et al. [73] | China | Retrospective | 2020 | 373 | Severity | 5 |
| 53 | Xu J et al. [74] | China | Retrospective | 2020 | 76 | ROC analysis | 5 |
| 54 | Xue G et al. [75] | China | Retrospective | 2020 | 114 | Severity | 7 |
| ROC analysis | |||||||
| 55 | Yan X et al. [76] | China | Retrospective | 2020 | 1004 | Mortality | 8 |
| ROC analysis | |||||||
| 56 | Yang AP et al. [77] | China | Retrospective | 2020 | 93 | Severity | 7 |
| ROC analysis | |||||||
| 57 | Yang Q et al. [78] | China | Retrospective | 2020 | 226 | Mortality | 8 |
| 58 | Yavuz B et al. [79] | Turkey | Retrospective | 2021 | 113 | Mortality | 9 |
| ROC analysis | |||||||
| 59 | Ye W et al. [80] | China | Retrospective | 2020 | 349 | Mortality | 8 |
| ROC analysis | |||||||
| 60 | Zhang N et al. [81] | China | Retrospective | 2020 | 60 | Mortality | 6 |
| 61 | Zhang S et al. [82] | China | Retrospective | 2020 | 115 | Mortality | 7 |
| 62 | Zhang Y et al. [83] | China | Retrospective | 2020 | 115 | Severity | 7 |
| 63 | Zhou Y et al. [84] | China | Retrospective | 2020 | 442 | Severity | 7 |
| 64 | Zhu Z et al. [85] | China | Retrospective | 2020 | 127 | Severity | 5 |
| Categories | No. of Studies | p-Value | Estimates | AUC | DOR |
|---|---|---|---|---|---|
| NLR for predicting disease mortality | |||||
| Sensitivity | 19 | 0.013 | 78.8% (95% CI: 73.5–83.2) | 0.820 | 11.483 |
| Specificity | <0.001 | 73.0% (95% CI: 68.4–77.1) | |||
| NLR for predicting disease severity | |||||
| Sensitivity | 21 | <0.001 | 80.2% (95% CI: 74.0–85.2) | 0.833 | 13.63 |
| Specificity | <0.001 | 75.8% (95% CI 71.3–79.9) | |||
| Categories | No. of Studies | Sensitivity | Specificity | AUC | OR |
|---|---|---|---|---|---|
| Severity | |||||
| Subgroup A (NLR cut off < 4.5) | 13 | 81.9% | 74.1% | 0.834 | 13.032 |
| Subgroup B (NLR cut off > 4.5) | 8 | 80.0% | 75.9% | 0.833 | 13.511 |
| Mortality | |||||
| Subgroup A (NLR cut off < 6.5) | 10 | 79.8% | 65.6% | 0.800 | 7.585 |
| Subgroup B (NLR cut off > 6.5) | 9 | 78.6% | 73.4% | 0.854 | 15.581 |
Publisher’s Note: MDPI stays neutral with regard to jurisdictional claims in published maps and institutional affiliations. |
© 2022 by the authors. Licensee MDPI, Basel, Switzerland. This article is an open access article distributed under the terms and conditions of the Creative Commons Attribution (CC BY) license (https://creativecommons.org/licenses/by/4.0/).
Share and Cite
Parthasarathi, A.; Padukudru, S.; Arunachal, S.; Basavaraj, C.K.; Krishna, M.T.; Ganguly, K.; Upadhyay, S.; Anand, M.P. The Role of Neutrophil-to-Lymphocyte Ratio in Risk Stratification and Prognostication of COVID-19: A Systematic Review and Meta-Analysis. Vaccines 2022, 10, 1233. https://doi.org/10.3390/vaccines10081233
Parthasarathi A, Padukudru S, Arunachal S, Basavaraj CK, Krishna MT, Ganguly K, Upadhyay S, Anand MP. The Role of Neutrophil-to-Lymphocyte Ratio in Risk Stratification and Prognostication of COVID-19: A Systematic Review and Meta-Analysis. Vaccines. 2022; 10(8):1233. https://doi.org/10.3390/vaccines10081233
Chicago/Turabian StyleParthasarathi, Ashwaghosha, Sunag Padukudru, Sumalata Arunachal, Chetak Kadabasal Basavaraj, Mamidipudi Thirumala Krishna, Koustav Ganguly, Swapna Upadhyay, and Mahesh Padukudru Anand. 2022. "The Role of Neutrophil-to-Lymphocyte Ratio in Risk Stratification and Prognostication of COVID-19: A Systematic Review and Meta-Analysis" Vaccines 10, no. 8: 1233. https://doi.org/10.3390/vaccines10081233