Article

Changes in the Transcriptome Profile in Young Chickens after Infection with LaSota Newcastle Disease Virus

1
Department of Pathobiology, College of Veterinary Medicine, Auburn University, Auburn, AL 36849, USA
2
Department of Poultry Science, College of Agriculture, Auburn University, Auburn, AL 36849, USA
*
Author to whom correspondence should be addressed.
Vaccines 2024, 12(6), 592; https://doi.org/10.3390/vaccines12060592
Submission received: 3 April 2024 / Revised: 16 May 2024 / Accepted: 27 May 2024 / Published: 30 May 2024
(This article belongs to the Special Issue Animal Diseases: Immune Response and Vaccines)

Abstract

:
Understanding gene expression changes in chicks after vaccination against Newcastle Disease (ND) can reveal vaccine biomarkers. There are limited data on chicks’ early immune response after ND vaccination. Two trials focused on this knowledge gap. In experiment one, 42 13-day-old specific-pathogen-free (SPF) chicks were used. Harderian glands (Hgs) and tracheas (Tcs) from five birds per group were sampled at 12, 24, and 48 h post-vaccination (hpv) to evaluate the gene transcription levels by RNA sequencing (RNA-seq) and RT-qPCR. The results of RNA-seq were compared by glmFTest, while results of RT-qPCR were compared by t-test. With RNA-seq, a significant up-regulation of interferon-related genes along with JAK-STAT signaling pathway regulation was observed in the Hgs at 24 hpv. None of the differentially expressed genes (DEGs) identified by RNA-seq were positive for RT-qPCR. Experiment 2 used 112 SPF and commercial chickens that were 1 day old and 14 days old. Only the commercial birds had maternal antibodies for Newcastle Disease virus (NDV). By RNA-seq, 20 core DEGs associated with innate immunity and viral genome replication inhibition were identified. Genes previously unlinked to NDV response, such as USP41, were identified. This research present genes with potential as immunity biomarkers for vaccines, yet further investigation is needed to correlate the core gene expression with viral shedding post-vaccination.

1. Introduction

Newcastle disease (ND) is a respiratory or systemic disease caused by avian orthoavulavirus serotype 1, commonly referred to as Newcastle Disease virus (NDV) [1]. ND has caused financial losses due to increases in bird mortality in poultry flocks, expenses related to outbreak eradication, and trade restrictions during outbreaks [2,3]. Current ND vaccines do not prevent NDV infection and shedding and thus might mask outbreaks [4]. Improved vaccines would be helpful to avoid production and economic losses. Understanding the avian immune response after infection or vaccination with NDV live vaccines is necessary for the rational design and testing of vaccines.
Understanding early gene expression changes in chickens after vaccination against ND can identify immune-related genes linked to clinical disease prevention and virus shedding that could be used as immunity biomarkers. Transcriptome analysis allows for in-depth analysis of gene expression [5] and permits identifying changes in the expression of immune-related genes after viral exposure with high sensitivity [6], without the need to pre-select certain genes and thus bias the results. Previous studies have identified differentially expressed genes in the Bursa, Harderian glands (Hgs), lungs, spleen and thymus at 2, 3, 6, and 10 days post-infection (dpi) in birds at 21 to 42 days of age [7,8,9,10,11,12,13]. However, there is little information about even earlier innate immune response in the first few hours after vaccination. To understand the early innate immune response, it is necessary to identify transcriptomic changes in tissues that are considered NDV entry sites. In this sense, lymphoid-associated tissues and upper respiratory tract elements such as Hgs and tracheas (Tcs) have a key role.
Knowing the early innate immune response in day-old chicks after ND vaccination is also important because, in the field, birds are frequently vaccinated right after hatching. Considering that the immune system of chickens is only fully mature after four to seven weeks of age [14], results obtained in older birds might not be applicable for hatchling chicks. Furthermore, due to the widespread use of vaccines, chicks are likely to have maternal antibodies against NDV, and there is no consensus if its presence can alter the immune response to ND vaccine [15,16].
In the current study, two experiments investigated the early innate immune response by transcriptome analysis in chicks upon vaccination with the NDV LaSota strain. In experiment 1, 13-day-old specific-pathogen-free (SPF) chickens were vaccinated. Changes in gene transcription 12, 24 and 48 h post-vaccination (hpv) were investigated by transcriptome analysis using RNA sequencing (RNA-seq) and RT-qPCR. The innate immune genes identified by both methods were compared. Experiment 2 studied the transcriptome 24 and 48 hpv of 1-day-old and 14-day-old chickens with or without maternal antibodies against NDV. The main objective was to identify target innate immune genes expressed shortly after vaccination and recognize potential candidates to be further tested as immunity biomarkers for ND vaccines.

2. Materials and Methods

Birds were kept in Horsfall-type isolators in biosafety level 2 facilities. All birds in both experiments were fed a standard commercial chicken feed that met the National Research Council’s recommended minimum nutrient requirements for laying hens [17]. Feed and water were provided ad libitum. The housing temperature and humidity were set following the breed rearing manual. Birds were randomly selected from each isolator and euthanized with carbon dioxide for sample collection.
Experimental design of experiment 1. A total of 42 white leghorn specific-pathogen-free (SPF) fertile eggs (AVS Bio, Catskill, NY, USA) were hatched and randomly distributed in 2 groups of 21 birds each. At 13 days of age, each bird of one group received 107 of a 50 percent embryo infectious dose (EID50) of a commercial NDV LaSota vaccine of 100 µL via the ocular route (50 µL in each eye). The other group served as an unvaccinated control and was mock-vaccinated with phosphate-buffered saline solution. Moreover, 12, 24, and 48 hpv, five birds per group were euthanized for sampling collection. Both Hgs and the whole Tc from the same bird were collected, wrapped in individual aluminum foils, and flash-frozen on dry ice immediately after collection. Samples were then stored at −80 °C until further processing.
RNA extraction and RNA-seq. Total RNA was extracted from Hgs using the RNeasy kit (Qiagen, Hilden, Germany) in a QIAcube automated extraction system (Qiagen) accordingly to the manufacturer’s protocol. For the Tcs, total RNA was extracted using the Quick RNA Miniprep kit (Zymo Research, Irvine, CA, USA) following the manufacturer’s instructions.
The RNA concentration of each sample was measured by spectrophotometry (Nanodrop 2000, Thermo Scientific, Waltham, MA, USA). Three replicates with the highest RNA concentration and A260:A280 and A260:A230 ratios in the 2.0 to 2.2 range were selected. mRNA library preparation was performed by poly A enrichment and sequencing on a NovaSeq PE150 system (Novogene Corporation Inc., Sacramento, CA, USA). The sequencing data were uploaded to the Sequence Read Archive database (SRA accession number SAMN40643659).
Differential expression of genes, gene ontology, Kyoto Encyclopedia of Genes pathway enrichment, and protein–protein interaction analysis. The index for the chicken reference genome (NCBI GenBank accession number GCF_016699485.2) was generated using HISAT2 v2.0.5 [18] with default parameters. Raw reads were quality trimmed using Trimmomatic v0.39 [19] with standard settings prior to downstream analysis. Trimmed reads were aligned to the reference genome using HISAT2, and the read counts for gene expression were obtained using HTSeq v1.13 [20]. Counted mapped reads were further analyzed using the edgeR package v4.0 [21] in R v4.3.1 [22]. The reads were filtered to exclude genes with low counts and normalized by the trimmed mean of M-values method (TMM) [23]. For each organ and timepoint, the expression levels from the vaccinated groups were compared to unvaccinated groups, considering three replicates per group, by Fishers’ exact test. The differential gene expression analysis results were considered significant with an adjusted p-value < 0.05 for the false discovery rate (FDR) and logarithm of fold change (logFC) > ±0.5.
The top-50 differentially expressed genes (DEGs) from each comparison were selected based on their p-value. They were used as input for mapping gene ontology (GO) pathways related to each gene based on the genome-wide annotation from the chicken package (org.Gg.eg.db) by Bioconductor v3.18 [24]. For GO and Kyoto Encyclopedia of Genes (KEGG) pathway enrichment analysis, limma v4.3 [25] was used to identify up- and down-regulated pathways. The GO terms and KEGG pathways with p-values < 0.05 were considered significant. In case the output result showed more than 50 significantly regulated pathways, only the top 50, based on their p-value, were considered.
In addition, the top-ranked DEGs were used as input into the STRING database [26] for protein–protein analysis (PPI). The “multiple proteins” function was used with Gallus gallus as the target organism. The program standard settings were used to determine the PPI network, with a minimum required interaction score of 0.400, excluding non-experimentally determined protein interactions. The PPI network for each significant contrast was imported to CytoScape, v3.10.1 [27]. The String Enrichment plugin and the String: protein query database from STRINGapp v2.0.1 [28] were used to retrieve the functionality enrichment map. The genome was used as the background. The connectivity cutoff (Jaccard similarity) was 0.8, and the node cutoff p-value was < 0.05. CytoCluster app v2.1.0 [29] with the ClusterONE algorithm [30] was used to identify protein clusters. Minimum size = 5, minimum density = 0.05, edge weights = combined_score, EnrichmenMap: similarity_coefficient, similarity = Jaccard similarity, and overlap threshold = 0.8 were the settings used to identify clusters linked to immune-related pathways.
Differential expression of genes associated with immune response by RT-qPCR. cDNA was synthesized from three samples per group, and total RNA was obtained using random hexamers and oligo-DT primers with the RT2 First Strand Kit (Qiagen) following the manufacturer’s instructions. The quantity and quality of the resulting cDNA were measured by spectrophotometry. All samples were normalized to a concentration of 0.5 µg of total RNA followed by dilution to a total volume of 111 µL with RNAse-free water and 2× RT2 SYBR green master mix and stored at −20 °C until further analysis. For the RT-qPCR, the RT2 Profiler™ PCR array chicken innate and adaptive immune responses kit (Qiagen) was used following the manufacturer’s instructions. Each well contained specific immune related primers to detect cDNA of mRNA from genes associated with immune responses against viruses. The tested genes and the five housekeeping genes used can be found in Supplementary Table S1. Threshold cycles (Ct) calculated by the qPCRsoft software v 4.1 (Analytik-Jena AG, Jena, Germany) for each sample were loaded into a Microsoft® Excel 2007 file provided by Qiagen [31]. Ct values were normalized against the housekeeping genes, and the relative expression of each gene in vaccinated and unvaccinated birds was calculated by t-test [31]. A genomic contamination control, reverse transcription controls, and positive PCR controls included in each plate for each sample were used to validate the results. Gene expression levels presenting at least a twofold difference with a significant p-value < 0.05 were considered relevant.
Experimental design of experiment 2. In the second experiment, fertile SPF (AVS Bio) and white leghorn eggs, obtained from a commercial hatchery, were hatched in the same conditions as in experiment 1. The commercial laying hens’ breeders were vaccinated repeatedly against ND and other diseases using live as well as inactivated vaccines. Maternal antibodies against NDV were detected by ELISA in commercial birds but not SPF birds [32]. After hatch, 56 birds of each type were split in 2 groups of 28 birds each, to be vaccinated when 1 day old or 14 days old. Each group of 28 birds was split into vaccinated or unvaccinated groups (n = 14). The experiment followed a completely randomized design in a 2 × 2 × 2 factorial arrangement, with bird type (SPF or commercial), age at vaccination (1 day or 14 days old) and vaccination status (vaccinated or control) as factors.
Vaccinated birds received the NDV LaSota strain following the same procedure as in experiment 1. Tissue sampling followed the experiment 1 protocol, and samples were collected 24 and 48 hpv and stored in DNA/RNA Shield (Zymo Research) for 24 h at 4 °C. After that, the protective reagent was discarded, and samples were stored at −80 °C.
Sample processing and data analysis in experiment 2. Total RNA from seven Hgs and Tcs of each group were extracted as in experiment 1, and five samples were used for all analyses based on the same quality criteria as the previous experiment. The sequencing data were uploaded to the Sequence Read Archive database (SRA accession number SAMN40632518).
Analyses of DEGs, GO, KEGG pathways and PPI were conducted as described for experiment 1 with the following modifications in the data analysis:
The DEGs analysis was performed for Hgs 24 hpv (hg24), Hgs 48 hpv (hg48), Tcs 24 hpv (tc24) and Tcs 48 hpv (tc48), comparing all vaccinated groups against all controls using the glmQLFTest for multivariate analysis using the edgeR package. Statistical analysis with edgeR requires the reference level of a factor to set a baseline for coefficient comparison. The commercial 1d control group was set as the reference level. The four lists of DEGs with an adjusted p-value < 0.05 for the false discovery rate (FDR) and logarithm of fold change (logFC) > ±1.5 were used to generate an upset plot with UpSetR v.1.4 [33]. This technique allowed us to visualize the number of common genes between the analyses performed. The DEGs identified in all four analyses were used to obtain the PPI and enrichment pathway map analysis, performed, as mentioned, for experiment 1. The pathways were obtained similarly to in experiment 1, and the common pathways were obtained by the same method as the one used for common DEGs. In addition, genes and pathways that were differentially expressed when considering bird types and age at infection as well as the interactions between the three main effects—vaccination, bird type and age at infection—were identified.

3. Results

3.1. Experiment 1

3.1.1. Differential Expression of Genes Associated Immune Response, GO, KEGG Pathways by RNA-Seq

Due to the RNA yields and integrity achieved, not all samples of each organ, group and timepoint could be analyzed. The numbers of samples that were included are shown in Table 1. On average, each sample yielded 25 million raw read pairs with 95.5% clean reads/raw reads ratio (effective %). No DEGs were detected in the Hgs collected 12 hpv comparing vaccinated group to the control. Because of the lack of DEGs, pathways were not analyzed. At 24 hpv, 22 up- and 112 down-regulated DEGs were identified in the Hgs of vaccinated birds compared to the control group (Supplementary Table S2). The interferon-induced gene (IFI), deltex gene (DXT) (a gene that encodes for E3 ubiquitin–protein ligase present on ubiquitin–proteasome degradation pathway [34]), and tumor necrose factor receptor-associated factor (TRAF) were the innate-immune related genes up-regulated. No down-regulated genes were identified to be immune-related. The pathway enrichment analysis identified more than 50 up- and 17 down-regulated pathways. The top-fifteen significant pathways, based on their p-values, from vaccinated birds are shown in Supplementary Table S3. Several JAK-STAT-related pathways were up-regulated (Supplementary Table S3). The PPI did not identify protein clusters linked to immune response. For Tcs at 12 hpv, there were no up- or down-regulated DEGs on the vaccinated birds compared to the unvaccinated group.

3.1.2. Differential Expression of Genes Associated with Immune Response by RT-qPCR

Samples from Hgs at 12 and 24 hpv and from Tcs at 24 hpv were compromised due to low-quality samples or not enough tissue available to perform the analysis. None of the tested genes were found to be positive in Hgs and Tcs 24 hpv by RT-qPCR. None of the genes tested in the RT-qPCR analysis were identified as being up- or down-regulated by the transcriptome analysis.

3.2. Experiment 2

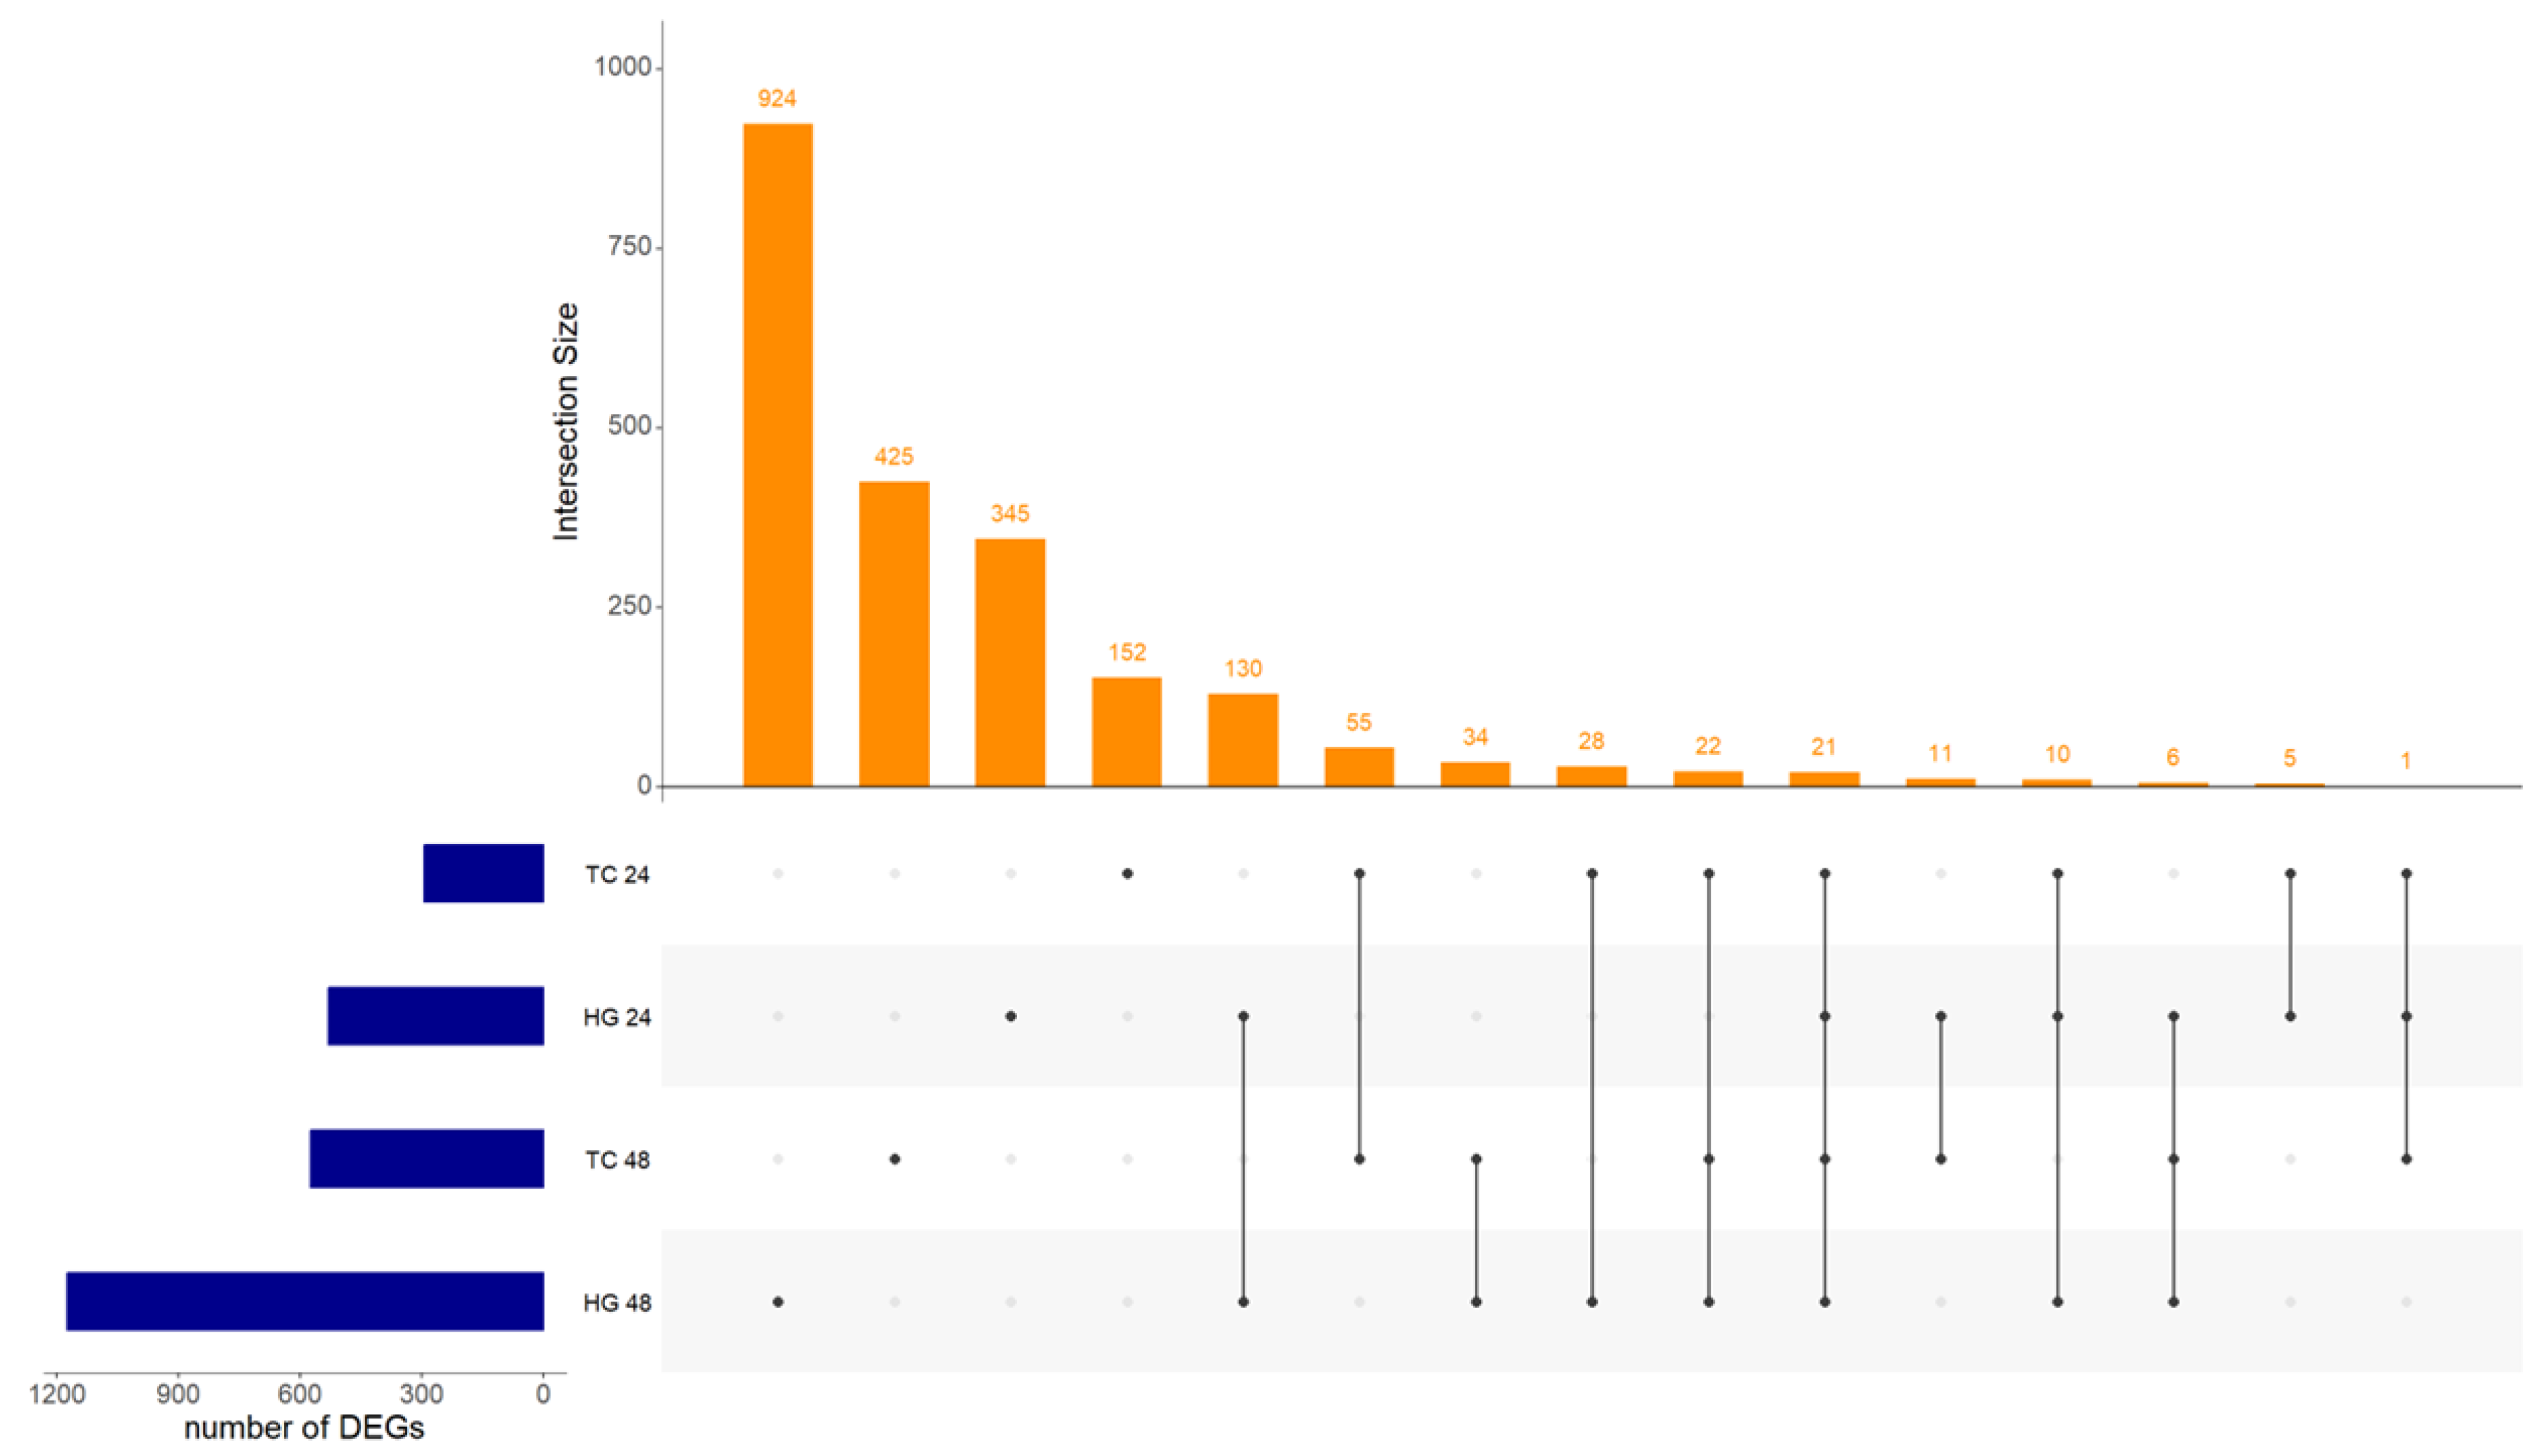
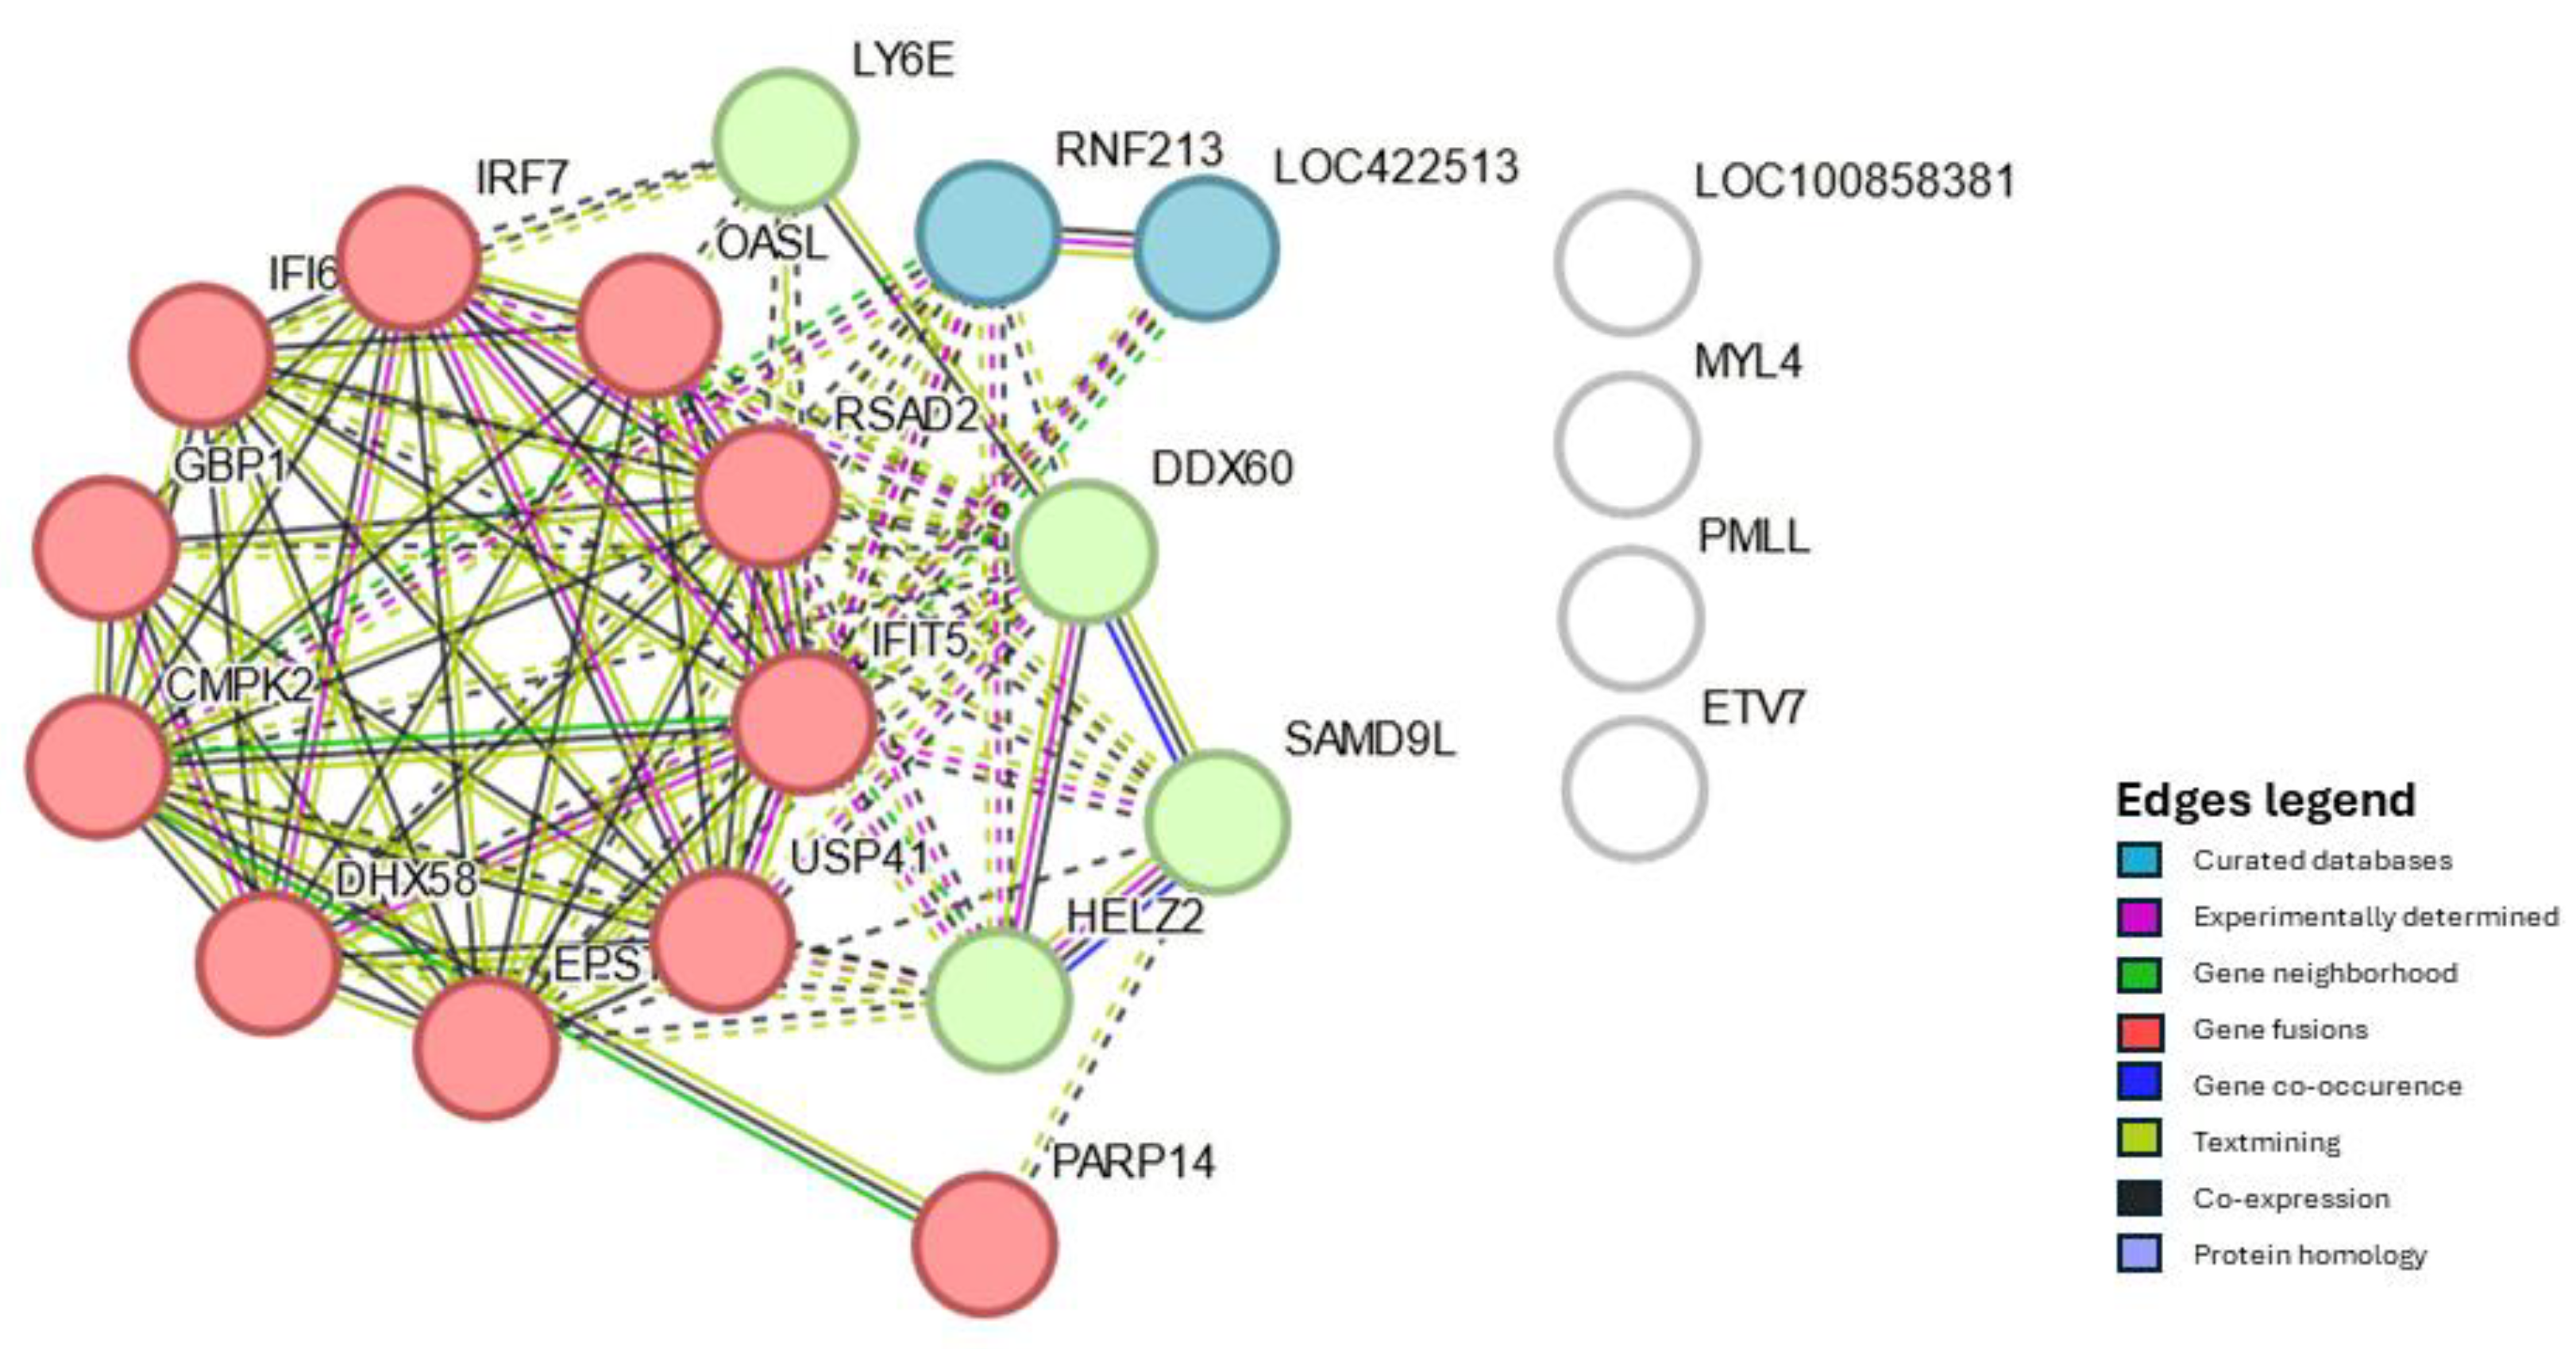
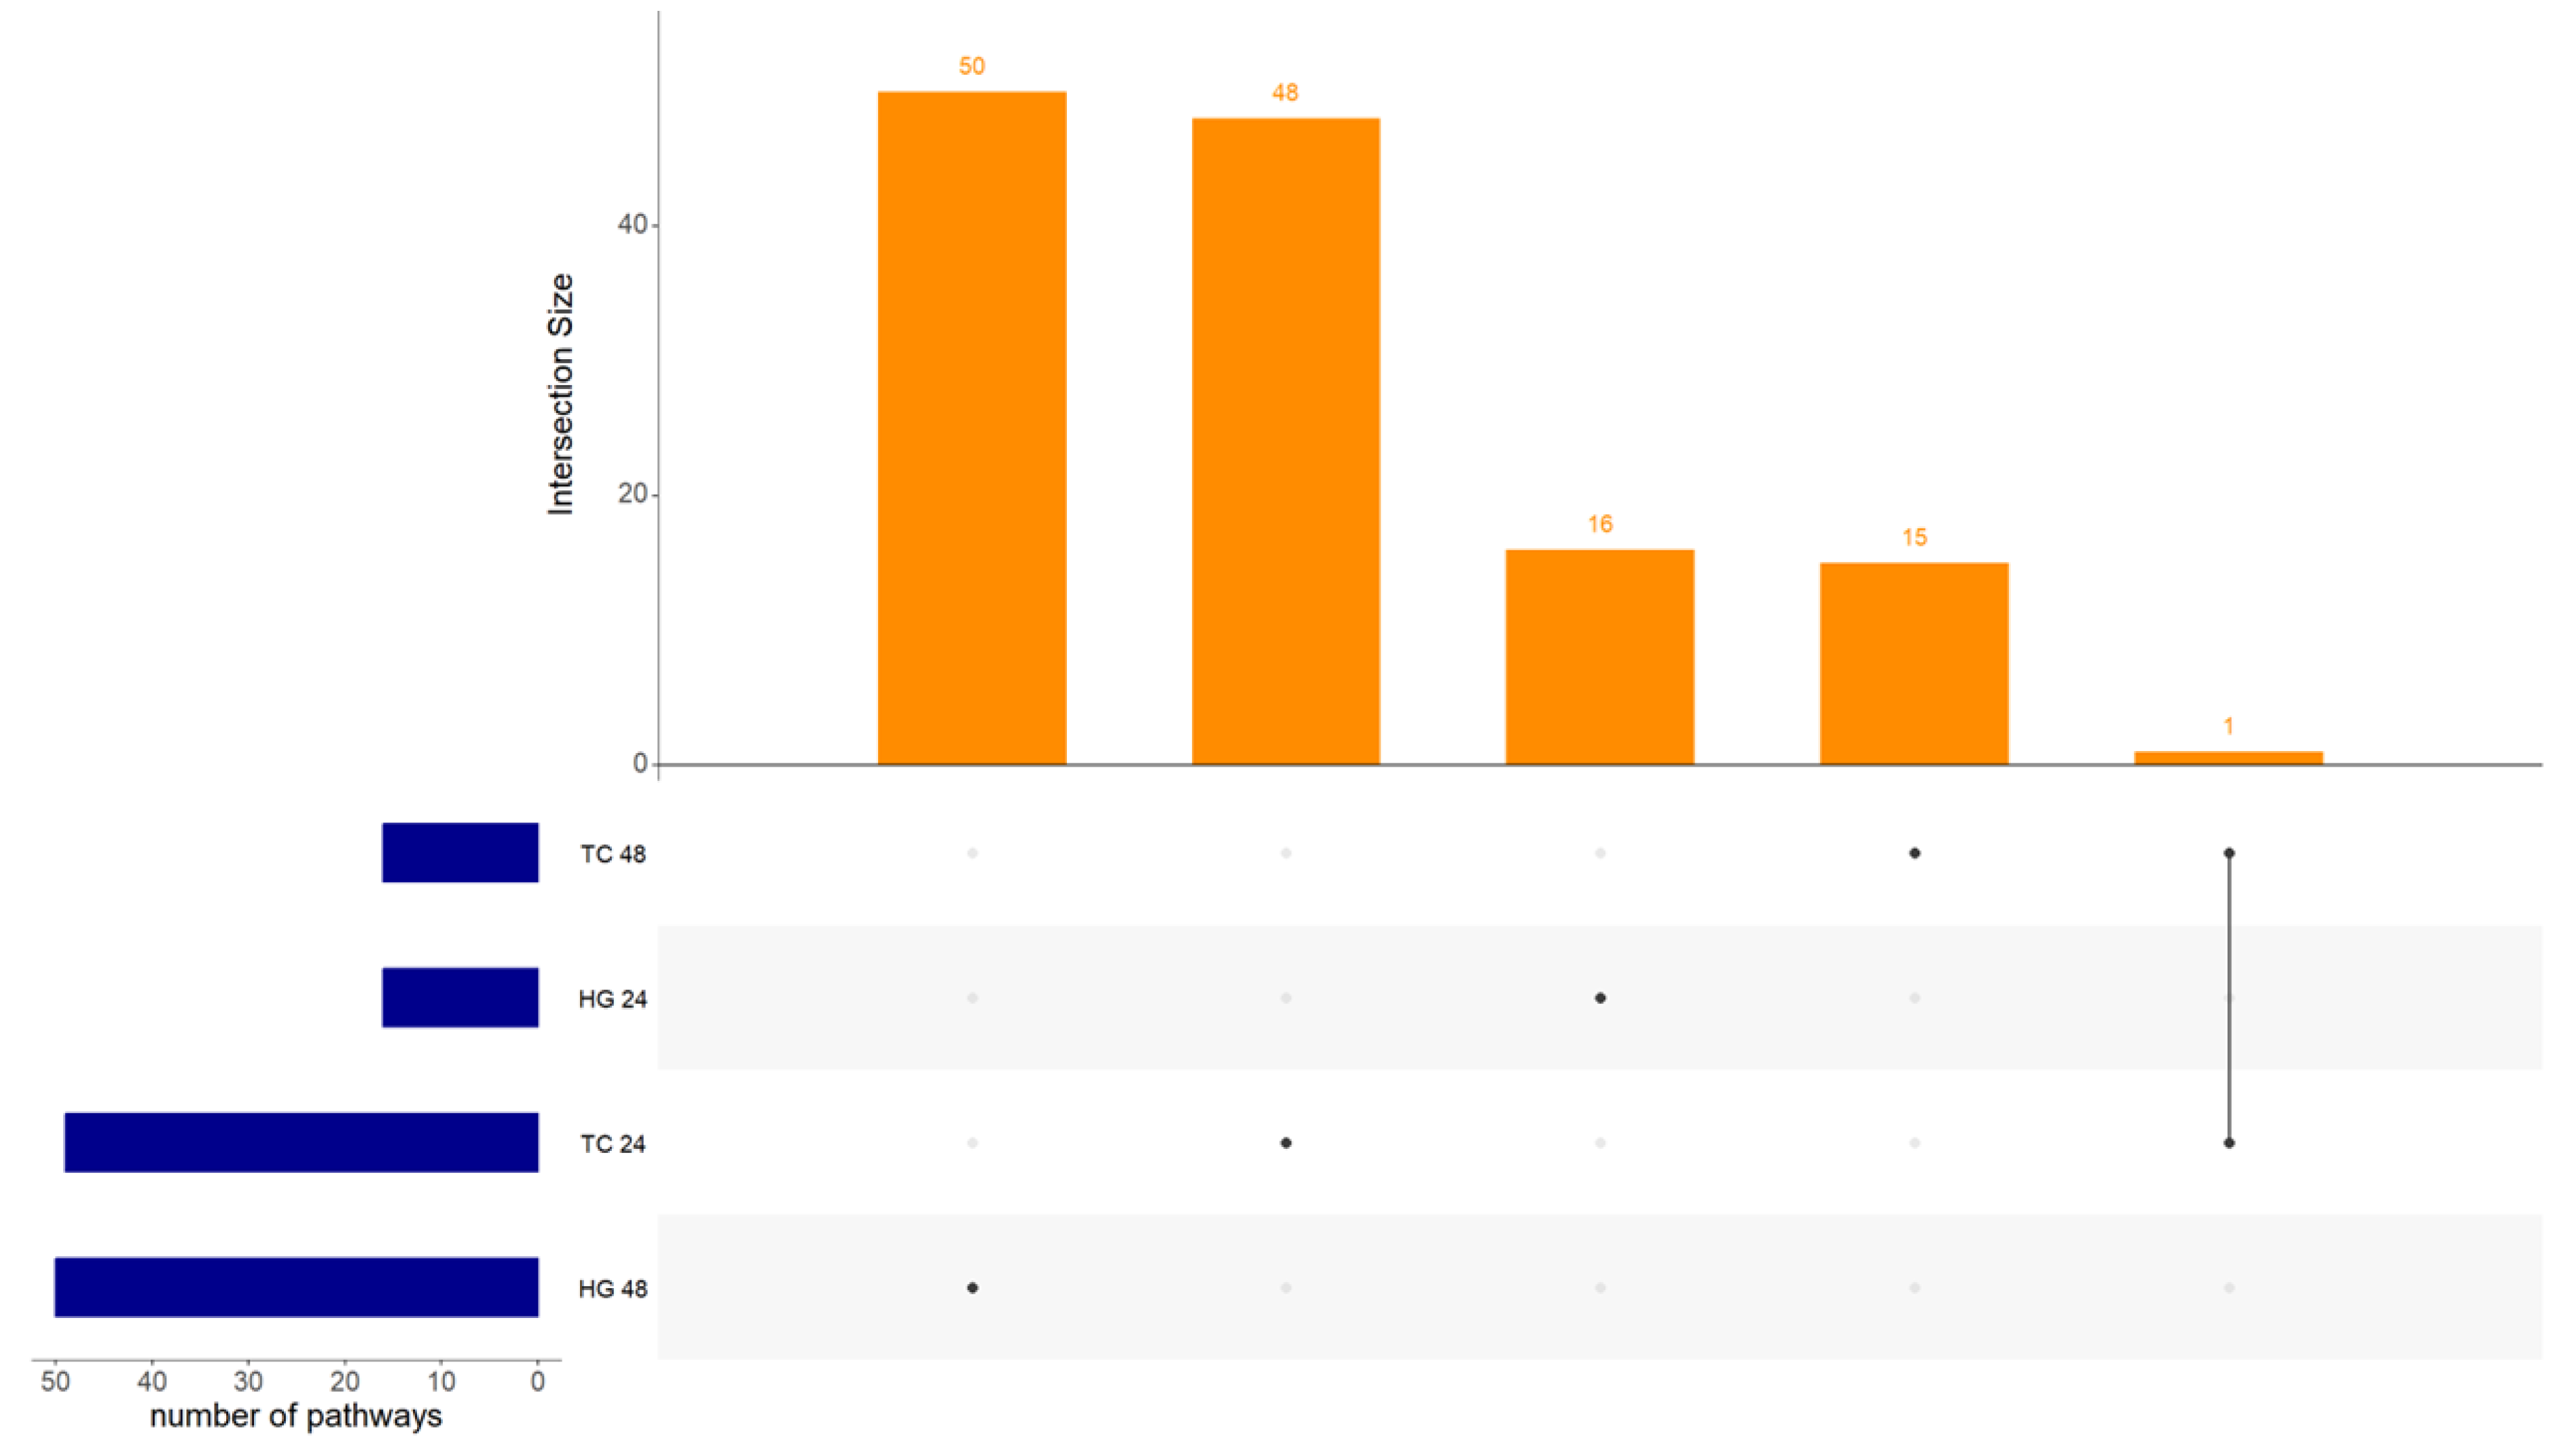
Differential Expression of Genes, GO, KEGG Pathways and PPI in Response to NDV Vaccination in Harderian Glands and Tracheas

On average, each sample yielded 23 million raw read pairs with average effective % of 97.2. The number of DEGs for each main factor and interactions, categorized by organ and timepoint, is presented in Table 2. The number of DEGs from vaccination was between 294 in the Tcs at 24 hpv (168 up-regulated genes and 126 down-regulated genes) and 1175 in the Hgs at 48 hpv (114 up-regulated genes and 1061 down-regulated genes). Among the 4 vaccinated groups, there were 2169 unique DEGs. In general, vaccination resulted in an increased number of DEGs in the Hgs compared to Tcs, and more DEGs 48 hpv than 24 hpv. A similar trend was observed for age at vaccination, with more DEGs due to age in the Hgs than in the Tcs, and more at 48 hpv compared to 24 hpv. The number of DEGs due to bird type was also higher in the Hgs. However, an inverse effect was observed regarding hpv, with a higher number of DEGs due to bird type in the Hgs at 24 hpv than at 48 hpv. In the Tcs, the previously observed trend of having more DEGs at 48 hpv was seen. The number of DEGs in 14-day-old chicks compared to 1-day-old chicks and in the absence of maternal antibodies compared to the presence of maternal antibodies is shown in Supplementary Table S4.
Furthermore, there were several interactions between two main factors (vaccination and bird type/vaccination and age) and all three main effects together (vaccination with bird type, and age). For instance, when the interaction between two main effects is significant for a gene, it indicates that the expression of this gene differs depending on the type of bird and the vaccination status, e.g., a gene identified as down-regulated in vaccinated SPF birds might be up-regulated in vaccinated commercial birds or vice versa. The same applies for interactions between three main effects.
Considering all four analyses—Hgs at 24 and 48 hpv and Tcs at 24 and 48 hpv—twenty-one DEGs were present in both organs and both sampling timepoints (Figure 1). Twenty of these were consistently either up- or down-regulated in all four analyses, while one, myosin, light chain 4 (MYL4), was up-regulated at Hgs 24 hpv but down-regulated in the other three analyses. Because of this, it was used for PPI analysis but not considered a core gene. The group formed by interferon alpha inducible protein 6 (IFI6), 2′-5′ oligoadenylate synthetase-like (OASL), poly(ADP-ribose) polymerase family member 14 (PARP14), DExD/H-box helicase 60 (DDX60), DExH-box helicase 58 (DHX58), and interferon regulatory factor 7 (IRF7), among fourteen other common DEGs, will be subsequently be referred to as the core genes (Supplementary Table S5). The PPI interaction and enrichment map from the core genes formed three clusters. Those clusters were related to host innate immune response processes either by interferon, cytokine, and caspase regulation or the regulation of viral genome replication (Figure 2, Supplementary Table S6).
The number of pathways for each main factor and their interactions, categorized by organ and timepoint, can be found in Table 3. There were 130 unique pathways regulated only by vaccination accounting for all organs and hpv. The regulation of these pathways did not follow the pattern observed for DEGs. Interestingly, an equal number of pathways were regulated due to age at vaccination in the Hgs compared to Tcs, and 24 hpv compared to 48 hpv. However, more pathways were regulated due to age at vaccination in the Hgs compared to Tcs, and at 48 hpv than 24 hpv. For bird type, the number of regulated pathways was higher in the Hgs than Tcs, and at 24 hpv than 48 hpv. Additionally, several pathways showed interactions between two (vaccination and bird type/vaccination and age at vaccination) or all three main effects (vaccination with bird type and age at vaccination). That means that when the interaction between two main effects is significant for a pathway, this pathway regulation differs depending on the type of bird and the vaccination status, e.g., a pathway identified as down-regulated in vaccinated SPF birds might be up-regulated in vaccinated commercial birds or vice versa. The same applies for interactions between three main effects. No pathways regulated due to vaccination were found to be common across all organs and hpv within all vaccinated groups (Figure 3).

4. Discussion

RNA-seq is renowned for its in-depth transcriptome analysis, whether from tissue samples or single cells. It offers a more comprehensive view of gene expression changes than PCR-based assays [35]. However, this technique is still being refined, and factors like sample size, mRNA extraction and sequencing quality, and complex statistical analysis can impact results. Conversely, RT-qPCR is often regarded as the gold standard for tracking gene transcription. However, RT-qPCR relies on well-defined target genes, so without a prior knowledge, it may fail to detect differentially expressed genes, and the selection of target genes might bias the results.
Experiment 1 aimed to compare RNA-seq and RT-qPCR results in chicks to assess the correlation between the two methods. No common DEGs were identified between the transcriptomic and RT-qPCR results. The discrepancy in the findings could be attributed to the fact that the target genes for RT-qPCR were selected before running the RNA-seq. None of the genes tested by RT-qPCR were seen to be up- or down-regulated by RNA-seq either. That means that only using RT-qPCR could lead to missing results. On the other hand, the transcriptomic approach allowed for the identification of gene expression changes without guessing what the related genes are based on prior to the analysis. Overall, RNA-seq showed potential as a helpful tool for pre-selecting genes that can be further investigated with a gold standard technique, such RT-qPCR. This could potentially lead to more consistent results.
The findings suggest that chicks vaccinated when 13 days old do not show a significant response to NDV up to 12 hpv, but the response begins to rise between 12 and 24 hpv. One of the identified up-regulated DEGs was the IFI gene, which is part of the host innate immune system and responsible for reducing viral replication by blocking single-stranded RNA virus fusion protein receptors in chicken cells [36]. This gene’s ability to inhibit viral propagation makes it a potential biomarker for immunity, particularly in relation to virus shedding. Additionally, the TRAF gene was overexpressed, indicating enhanced type I interferon production [37]. Previous research identified TRAF down-regulation caused by NDV M protein plasmids as a strategy to mock the host inflammatory response in vitro [38]. Differences between the current and cited research could be due to using different experimental models. The TRAF expression profile identified here indicates a well-functioning host early innate immune response following NDV vaccination.
Another replication strategy of viruses involves inhibiting cell apoptosis by promoting the degradation of proteins associated with cell-death up-regulation [39]. NDV specifically manipulates the ubiquitin–proteasome pathway to achieve this [40]. In the current study, there was DXT up-regulation, suggesting an increase in the degradation of proteins related to cell death by the ubiquitin–proteasome route. Even though PPI analysis did not find an increase in protein functional pathways related to these genes, gene ontology results showed an up-regulation of cell-death pathways. With that said, more studies are needed to elucidate DXT’s role in host cell death during NDV infection. All significant DEGs can be found in Supplementary Table S2.
Moving on to experiment 2, the main goal was to examine the early regulation profile of DEGs and pathways following NDV vaccination. Regarding the number of DEGs, birds vaccinated at 14 days and in the absence of maternal antibodies enhanced the number of differentially expressed genes in both organs and timepoints. The main goal of experiment 2 was to identify core genes and evaluate if they have potential as NDV vaccine biomarker candidates. Strong biomarkers are those that can be used to track protective parameters, such as innate immune response, under various conditions. In commercial poultry, there is a need for well-established NDV vaccine biomarkers that inhibit clinical signs and viral shedding. This is particularly important because it could eliminate the detection of NDV in commercial flocks, thereby reducing economic losses due to trade restrictions and depopulation. Thus, identifying innate immune genes involved in host defense or viral replication could be useful for NDV vaccine testing. Given the differences in the DEG number observed in this study, it is important to prioritize trials with commercial birds over SPF ones to identify viable vaccine biomarkers for industry application.
In that sense, experiment 2 investigated four combinations of age at vaccination and the presence of maternal antibodies as factors. The results confirmed changes in the gene expression profile between the groups, including interactions between the three main effects. The discussion will be centered in the 20 genes, the core genes, that were consistently up- or down-regulated, not only in all groups but also in the Hgs and Tcs at 24 and 48 hpv.
The transcriptomics output indicated that the core genes were involved with innate immune response regulation through changes in the interferon-I (INF-I) cascade in two ways. Firstly, by modulating genes from the pattern recognition-receptors (PRR) system, that were seen to be up-regulated. Among them, retinoic acid-inducible gene-I (RIG-I)-like receptor (RLR) and ubiquitin ligases protein families are key components of the PRR system, serving as primary tools for eukaryotic cells to recognize cytoplasmatic viruses [41]. Once a viral particle is recognized, PRR triggers several intracellular routes to activate INF-I production by regulating the gene expression of interferon-inducible genes in an attempt to reduce viral propagation [34]. In experiment 2, PRR-related genes PARP14, OASL, DHX58, and DDX60 were up-regulated together with IRF7, a non-PRR-related interferon regulator gene.
As previously mentioned, increased INF-I translation is crucial for activating the innate immune responses regulated by INF-I, including the gene expression of the IFI gene family [42]. Regarding this family, IFI6 was seen to be overexpressed in the present study. Previous research reported IFI6, also known as ISG12, to be up-regulated during NDV infection. This gene enhances mitochondrial membrane permeability and induces cell-death in an attempt to shut down several single-stranded RNA virus infections [43]. Given the importance of apoptosis in decreasing viral shedding, IFI6/ISG12 shows potential as an immunity marker for NDV vaccines, but this warrants further investigation. Other identified interferon-inducible genes, such as IFITM1 and IFIT5, are linked to NDV propagation and have potential as vaccine biomarkers. The former hinders the permeability of the host cell membrane to NDV [44], while the later directly binds to viral nucleotide sequences. The intracellular antiviral capability of IFIT5 leads to the translation of non-functional viral proteins, impacting virus replication [45].
It is worth noting that the functional profile of the core genes aligns with three clusters identified by PPI analysis. Furthermore, the enrichment map (Supplementary Table S6) has identified core genes encoding proteins that, to date, have not been specifically linked to NDV vaccinal response. Among the defense response to virus cluster genes, which include DDX60, DHX58, IFIT5, OASL, CMPK2, and RSAD2, the latter two have little characterized antiviral action upon NDV infection [10,46,47]. Moreover, USP41, which has been identified as part of the interferon regulatory factor and the negative regulation of viral genome replication clusters has not yet been linked to the immune response against NDV in chickens, according to our current knowledge.
In conclusion, using RNA-seq, this study identified key genes linked to innate immunity after vaccination against a live lentogenic NDV vaccinal strain. The PRR involving RIG-I-like receptor, their interaction with ubiquitination-linked processes, and the subsequent regulation of the immune cascade modulated by INF-I appear to be key biological processes in NDV vaccination, but they require further investigation. Furthermore, the results suggests that the core genes are connected to the host’s regulation of viral replication. This highlights them as potential marker candidates. However, the relationship between core gene expression profiles and viral shedding patterns after vaccination needs to be addressed in further experiments.

Supplementary Materials

The following supporting information can be downloaded at: https://www.mdpi.com/article/10.3390/vaccines12060592/s1, Table S1: RT2 Profiler PCR Array chicken innate and adaptive immune responses kit; Table S2: Differentially expressed genes from birds vaccinated with Newcastle disease virus LaSota at 14 days old compared to the unvaccinated ones; Table S3: Pathways regulated by the differentially expressed genes from groups experimentally vaccinated with Newcastle disease virus LaSota at 14 days old compared to mock vaccinated control birds; Table S4: Effect of age and the presence of MABs on the number of DEGs; Table S5: The twenty-one common genes, core genes, from birds vaccinated with Newcastle disease virus LaSota compared to unvaccinated control. Results from the Harderian glands and Tcs at both 24 and 48 h post-vaccination; Table S6: Protein–protein interaction and its correlated enrichment pathways map based on the twenty core genes.

Author Contributions

Conceptualization, R.H. and T.S.B.L.; formal analysis, T.S.B.L. and A.P.; investigation, J.N., T.S.B.L., C.B., A.P., R.E. and C.C.; data curation, T.S.B.L. and A.P.; writing—original draft preparation, T.S.B.L.; writing—review and editing, R.H., J.N., C.B., A.P., R.E. and C.C.; supervision, R.H. All authors have read and agreed to the published version of the manuscript.

Funding

This research was funded by United States Department of Agriculture—Agricultural Research Service (USDA-ARS), project number 6040-32000-082-006-S.

Institutional Review Board Statement

The animal study protocol was approved by the Institutional Animal Care and Use committee of Auburn University (protocol code 2022-4030 and 2022-5147).

Informed Consent Statement

Not applicable.

Data Availability Statement

The data generated in this study were submitted in the Bioproject database under ID: PRJNA1092978 and PRJNA1092705.

Acknowledgments

Funding was provided by USDA-ARS project number: 6040-32000-082-006-S as a Non-Assistance Cooperative Agreement. This work was made possible in part by a grant of high-performance computing resources and technical support from the Alabama Supercomputer Authority.

Conflicts of Interest

The authors declare no conflicts of interest.

References

  1. Abd El-Hamid, H.S.; Shafi, M.E.; Albaqami, N.M.; Ellakany, H.F.; Abdelaziz, N.M.; Abdelaziz, M.N.; Abd El-Hack, M.E.; Taha, A.E.; Alanazi, K.M.; Elbestawy, A.R. Sequence Analysis and Pathogenicity of Avian Orthoavulavirus 1 Strains Isolated from Poultry Flocks during 2015–2019. BMC Vet. Res. 2020, 16, 253. [Google Scholar] [CrossRef] [PubMed]
  2. Dimitrov, K.M.; Ferreira, H.L.; Pantin-Jackwood, M.J.; Taylor, T.L.; Goraichuk, I.V.; Crossley, B.M.; Killian, M.L.; Bergeson, N.H.; Torchetti, M.K.; Afonso, C.L.; et al. Pathogenicity and Transmission of Virulent Newcastle Disease Virus from the 2018–2019 California Outbreak and Related Viruses in Young and Adult Chickens. Virology 2019, 531, 203–218. [Google Scholar] [CrossRef] [PubMed]
  3. Moharam, I.; Razik, A.A.E.; Sultan, H.; Ghezlan, M.; Meseko, C.; Franzke, K.; Harder, T.; Beer, M.; Grund, C. Investigation of Suspected Newcastle Disease (ND) Outbreaks in Egypt Uncovers a High Virus Velogenic ND Virus Burden in Small-Scale Holdings and the Presence of Multiple Pathogens. Avian Pathol. 2019, 48, 406–415. [Google Scholar] [CrossRef] [PubMed]
  4. Lu, X.; Zhan, T.; Liu, K.; Chen, Y.; Hu, Z.; Hu, J.; Gu, M.; Hu, S.; Wang, X.; Liu, X.; et al. Biological Significance of Dual Mutations A494D and E495K of the Genotype III Newcastle Disease Virus Hemagglutinin-Neuraminidase In Vitro and In Vivo. Viruses 2022, 14, 2338. [Google Scholar] [CrossRef] [PubMed]
  5. Hu, T.; Chitnis, N.; Monos, D.; Dinh, A. Next-Generation Sequencing Technologies: An Overview. Human. Immunol. 2021, 82, 801–811. [Google Scholar] [CrossRef]
  6. Luciani, F.; Bull, R.A.; Lloyd, A.R. Next Generation Deep Sequencing and Vaccine Design: Today and Tomorrow. Trends Biotechnol. 2012, 30, 443–452. [Google Scholar] [CrossRef] [PubMed]
  7. Deist, M.S.; Gallardo, R.A.; Bunn, D.A.; Dekkers, J.C.M.; Zhou, H.; Lamont, S.J. Resistant and Susceptible Chicken Lines Show Distinctive Responses to Newcastle Disease Virus Infection in the Lung Transcriptome. BMC Genom. 2017, 18, 989. [Google Scholar] [CrossRef]
  8. Deist, M.S.; Gallardo, R.A.; Bunn, D.A.; Kelly, T.R.; Dekkers, J.C.M.; Zhou, H.; Lamont, S.J. Novel Analysis of the Harderian Gland Transcriptome Response to Newcastle Disease Virus in Two Inbred Chicken Lines. Sci. Rep. 2018, 8, 6558. [Google Scholar] [CrossRef] [PubMed]
  9. Saelao, P.; Wang, Y.; Gallardo, R.A.; Lamont, S.J.; Dekkers, J.M.; Kelly, T.; Zhou, H. Novel Insights into the Host Immune Response of Chicken Harderian Gland Tissue during Newcastle Disease Virus Infection and Heat Treatment. BMC Vet. Res. 2018, 14, 280. [Google Scholar] [CrossRef] [PubMed]
  10. Zhang, J.; Kaiser, M.G.; Deist, M.S.; Gallardo, R.A.; Bunn, D.A.; Kelly, T.R.; Dekkers, J.C.M.; Zhou, H.; Lamont, S.J. Transcriptome Analysis in Spleen Reveals Differential Regulation of Response to Newcastle Disease Virus in Two Chicken Lines. Sci. Rep. 2018, 8, 1278. [Google Scholar] [CrossRef]
  11. Wang, X.; Jia, Y.; Ren, J.; Liu, H.; Adam, F.A.; Wang, X.; Yang, Z. Insights into the Chicken Bursa of Fabricius Response to Newcastle Disease Virus at 48 and 72 Hours Post-Infection through RNA-Seq. Vet. Microbiol. 2019, 236, 108389. [Google Scholar] [CrossRef] [PubMed]
  12. Guo, L.; Nie, F.; Huang, A.; Wang, R.; Li, M.; Deng, H.; Zhou, Y.; Zhou, X.; Huang, Y.; Zhou, J.; et al. Transcriptomic Analysis of Chicken Immune Response to Infection of Different Doses of Newcastle Disease Vaccine. Gene 2021, 766, 145077. [Google Scholar] [CrossRef] [PubMed]
  13. Doan, P.T.K.; Low, W.Y.; Ren, Y.; Tearle, R.; Hemmatzadeh, F. Newcastle Disease Virus Genotype VII Gene Expression in Experimentally Infected Birds. Sci. Rep. 2022, 12, 5249. [Google Scholar] [CrossRef] [PubMed]
  14. Song, B.; Tang, D.; Yan, S.; Fan, H.; Li, G.; Shahid, M.S.; Mahmood, T.; Guo, Y. Effects of Age on Immune Function in Broiler Chickens. J. Anim. Sci. Biotechnol. 2021, 12, 42. [Google Scholar] [CrossRef] [PubMed]
  15. Kapczynski, D.R.; Afonso, C.L.; Miller, P.J. Immune Responses of Poultry to Newcastle Disease Virus. Dev. Comp. Immunol. 2013, 41, 447–453. [Google Scholar] [CrossRef] [PubMed]
  16. Bertran, K.; Lee, D.-H.; Criado, M.F.; Balzli, C.L.; Killmaster, L.F.; Kapczynski, D.R.; Swayne, D.E. Maternal Antibody Inhibition of Recombinant Newcastle Disease Virus Vectored Vaccine in a Primary or Booster Avian Influenza Vaccination Program of Broiler Chickens. Vaccine 2018, 36, 6361–6372. [Google Scholar] [CrossRef]
  17. Dale, N. National Research Council Nutrient Requirements of Poultry—Ninth Revised Edition (1994). J. Appl. Poult. Res. 1994, 3, 101–101. [Google Scholar] [CrossRef]
  18. Kim, D.; Paggi, J.M.; Park, C.; Bennett, C.; Salzberg, S.L. Graph-Based Genome Alignment and Genotyping with HISAT2 and HISAT-Genotype. Nat. Biotechnol. 2019, 37, 907–915. [Google Scholar] [CrossRef] [PubMed]
  19. Bolger, A.M.; Lohse, M.; Usadel, B. Trimmomatic: A Flexible Trimmer for Illumina Sequence Data. Bioinformatics 2014, 30, 2114–2120. [Google Scholar] [CrossRef]
  20. Putri, G.H.; Anders, S.; Pyl, P.T.; Pimanda, J.E.; Zanini, F. Analysing High-Throughput Sequencing Data in Python with HTSeq 2.0. Bioinformatics 2022, 38, 2943–2945. [Google Scholar] [CrossRef]
  21. Robinson, M.D.; McCarthy, D.J.; Smyth, G.K. edgeR: A Bioconductor Package for Differential Expression Analysis of Digital Gene Expression Data. Bioinformatics 2010, 26, 139–140. [Google Scholar] [CrossRef] [PubMed]
  22. R: Contributors. Available online: https://www.r-project.org/contributors.html (accessed on 10 January 2024).
  23. Chen, Y.; Lun, A.T.L.; Smyth, G.K. From Reads to Genes to Pathways: Differential Expression Analysis of RNA-Seq Experiments Using Rsubread and the edgeR Quasi-Likelihood Pipeline. F1000Res 2016, 5, 1438. [Google Scholar] [CrossRef] [PubMed]
  24. Carlston Org.Gg.Eg.Db. Available online: http://bioconductor.org/packages/org.Gg.eg.db/ (accessed on 12 March 2024).
  25. Ritchie, M.E.; Phipson, B.; Wu, D.; Hu, Y.; Law, C.W.; Shi, W.; Smyth, G.K. Limma Powers Differential Expression Analyses for RNA-Sequencing and Microarray Studies. Nucleic Acids Res. 2015, 43, e47. [Google Scholar] [CrossRef] [PubMed]
  26. Szklarczyk, D.; Kirsch, R.; Koutrouli, M.; Nastou, K.; Mehryary, F.; Hachilif, R.; Gable, A.L.; Fang, T.; Doncheva, N.T.; Pyysalo, S.; et al. The STRING Database in 2023: Protein-Protein Association Networks and Functional Enrichment Analyses for Any Sequenced Genome of Interest. Nucleic Acids Res 2023, 51, D638–D646. [Google Scholar] [CrossRef] [PubMed]
  27. Shannon, P.; Markiel, A.; Ozier, O.; Baliga, N.S.; Wang, J.T.; Ramage, D.; Amin, N.; Schwikowski, B.; Ideker, T. Cytoscape: A Software Environment for Integrated Models of Biomolecular Interaction Networks. Genome Res. 2003, 13, 2498–2504. [Google Scholar] [CrossRef] [PubMed]
  28. Doncheva, N.T.; Morris, J.H.; Gorodkin, J.; Jensen, L.J. Cytoscape StringApp: Network Analysis and Visualization of Proteomics Data. J. Proteome Res. 2019, 18, 623–632. [Google Scholar] [CrossRef] [PubMed]
  29. Li, M.; Li, D.; Tang, Y.; Wu, F.; Wang, J. CytoCluster: A Cytoscape Plugin for Cluster Analysis and Visualization of Biological Networks. Int. J. Mol. Sci. 2017, 18, 1880. [Google Scholar] [CrossRef]
  30. Nepusz, T.; Yu, H.; Paccanaro, A. Detecting Overlapping Protein Complexes in Protein-Protein Interaction Networks. Nat. Methods 2012, 9, 471–472. [Google Scholar] [CrossRef] [PubMed]
  31. RT2 Profiler PCR Arrays. Available online: https://www.qiagen.com/us/products/discovery-and-translational-research/pcr-qpcr-dpcr/qpcr-assays-and-instruments/mrna-incrna-qpcr-assays-panels/rt2-profiler-pcr-arrays (accessed on 7 September 2023).
  32. Espejo, R.; Breedlove, C.; Toro, H. Changes in the Transcriptome Profile in Young Chickens after Infection with LaSota Newcastle Disease Virus. preprints 2024. [Google Scholar] [CrossRef]
  33. Conway, J.R.; Lex, A.; Gehlenborg, N. UpSetR: An R Package for the Visualization of Intersecting Sets and Their Properties. Bioinformatics 2017, 33, 2938–2940. [Google Scholar] [CrossRef]
  34. Zhu, H.; Zheng, C. When PARPs Meet Antiviral Innate Immunity. Trends Microbiol. 2021, 29, 776–778. [Google Scholar] [CrossRef] [PubMed]
  35. Rachinger, N.; Fischer, S.; Böhme, I.; Linck-Paulus, L.; Kuphal, S.; Kappelmann-Fenzl, M.; Bosserhoff, A.K. Loss of Gene Information: Discrepancies between RNA Sequencing, cDNA Microarray, and qRT-PCR. Int. J. Mol. Sci. 2021, 22, 9349. [Google Scholar] [CrossRef] [PubMed]
  36. Smith, S.E.; Gibson, M.S.; Wash, R.S.; Ferrara, F.; Wright, E.; Temperton, N.; Kellam, P.; Fife, M. Chicken Interferon-Inducible Transmembrane Protein 3 Restricts Influenza Viruses and Lyssaviruses In Vitro. J. Virol. 2013, 87, 12957–12966. [Google Scholar] [CrossRef] [PubMed]
  37. Akiyama, T.; Shiraishi, T.; Qin, J.; Konno, H.; Akiyama, N.; Shinzawa, M.; Miyauchi, M.; Takizawa, N.; Yanai, H.; Ohashi, H.; et al. Mitochondria–Nucleus Shuttling FK506-Binding Protein 51 Interacts with TRAF Proteins and Facilitates the RIG-I-Like Receptor-Mediated Expression of Type I IFN. PLoS ONE 2014, 9, e95992. [Google Scholar] [CrossRef] [PubMed]
  38. Duan, Z.; Xing, J.; Shi, H.; Wang, Y.; Zhao, C. The Matrix Protein of Newcastle Disease Virus Inhibits Inflammatory Response through IRAK4/TRAF6/TAK1/NF-κB Signaling Pathway. Int. J. Biol. Macromol. 2022, 218, 295–309. [Google Scholar] [CrossRef] [PubMed]
  39. Kim, S.-J.; Ahn, D.-G.; Syed, G.H.; Siddiqui, A. The Essential Role of Mitochondrial Dynamics in Antiviral Immunity. Mitochondrion 2018, 41, 21–27. [Google Scholar] [CrossRef] [PubMed]
  40. Fan, L.; Liang, Z.; Ren, J.; Chen, Y.; Zhu, H.; Chen, Y.; Xiang, B.; Lin, Q.; Ding, C.; Chen, L.; et al. Newcastle Disease Virus Activates the PI3K/AKT Signaling Pathway by Targeting PHLPP2 Degradation to Delay Cell Apoptosis and Promote Viral Replication. Vet. Microbiol. 2024, 289, 109949. [Google Scholar] [CrossRef]
  41. Kawai, T.; Akira, S. Antiviral Signaling Through Pattern Recognition Receptors. J. Biochem. 2007, 141, 137–145. [Google Scholar] [CrossRef] [PubMed]
  42. Wilden, H.; Fournier, P.; Zawatzky, R.; Schirrmacher, V. Expression of RIG-I, IRF3, IFN-β and IRF7 Determines Resistance or Susceptibility of Cells to Infection by Newcastle Disease Virus. Int. J. Oncol. 2009, 34, 971–982. [Google Scholar] [CrossRef]
  43. Li, X.; Jia, Y.; Liu, H.; Wang, X.; Chu, Z.; Hu, R.; Ren, J.; Xiao, S.; Zhang, S.; Wang, X.; et al. High Level Expression of ISG12(1) Promotes Cell Apoptosis via Mitochondrial-Dependent Pathway and so as to Hinder Newcastle Disease Virus Replication. Vet. Microbiol. 2019, 228, 147–156. [Google Scholar] [CrossRef]
  44. Smith, S.E.; Busse, D.C.; Binter, S.; Weston, S.; Diaz Soria, C.; Laksono, B.M.; Clare, S.; Van Nieuwkoop, S.; Van den Hoogen, B.G.; Clement, M.; et al. Interferon-Induced Transmembrane Protein 1 Restricts Replication of Viruses That Enter Cells via the Plasma Membrane. J. Virol. 2019, 93, e02003-18. [Google Scholar] [CrossRef] [PubMed]
  45. Santhakumar, D.; Rohaim, M.A.M.S.; Hussein, H.A.; Hawes, P.; Ferreira, H.L.; Behboudi, S.; Iqbal, M.; Nair, V.; Arns, C.W.; Munir, M. Chicken Interferon-Induced Protein with Tetratricopeptide Repeats 5 Antagonizes Replication of RNA Viruses. Sci. Rep. 2018, 8, 6794. [Google Scholar] [CrossRef] [PubMed]
  46. Li, X.; Feng, Y.; Liu, W.; Tan, L.; Sun, Y.; Song, C.; Liao, Y.; Xu, C.; Ren, T.; Ding, C.; et al. A Role for the Chicken Interferon-Stimulated Gene CMPK2 in the Host Response Against Virus Infection. Front. Microbiol. 2022, 13. [Google Scholar] [CrossRef] [PubMed]
  47. Liu, W.; Xu, Z.; Qiu, Y.; Qiu, X.; Tan, L.; Song, C.; Sun, Y.; Liao, Y.; Liu, X.; Ding, C. Single-Cell Transcriptome Atlas of Newcastle Disease Virus in Chickens Both In Vitro and In Vivo. Microbiol. Spectr. 2023, 11, e05121-22. [Google Scholar] [CrossRef] [PubMed]
Figure 1. Upset plot showing intersection size between Harderian glands (Hgs) and tracheas (Tcs) at both, 24 and 48 h post-vaccination with Newcastle disease virus LaSota. Intersection size show the number of differentially expressed genes (DEGs) between the analyzed samples. Twenty-one DEGs were common between all combinations of organs and timepoints.
Vaccines 12 00592 g001
Figure 2. Protein–protein interaction of the core genes, i.e., genes differentially expressed in chickens in Harderian glands and tracheas 24 as well as 48 h after vaccination with Newcastle disease virus LaSota. Nodes represent proteins. Nodes with the same color are part of the same cluster. Edges represent protein–protein associations. Associations with splice isoforms or post-translational modifications are collapsed. Each node represents all the proteins produced by a single, protein-coding gene locus.
Vaccines 12 00592 g002
Figure 3. Upset plot showing intersection size between Harderian glands (Hgs) and tracheas (Tcs) at both, 24 and 48 h post-vaccination with Newcastle disease virus LaSota. Intersection size show the number of regulated pathways between the analyzed samples. No common pathways were found between all combinations of organ and timepoint.
Vaccines 12 00592 g003
Table 1. Number of samples in each treatment, per organ, and timepoint that were included in RNA-seq and RT-qPCR in experiment 1.
OrganHours Post-VaccinationControl Group Vaccinated Group
RNA-seqRT-qPCRRNA-seqRT-qPCR
Harderian glands123032
243233
482030
Tracheas123323
240223
482030
Table 2. Number of differentially expressed genes (DEGs) in Harderian glands (Hgs) and tracheas (Tcs) 24 and 48 h post-vaccination (hpv) with Newcastle disease virus LaSota by main effects and their interactions.
Main Factor or
Interaction
Organ and Sampling Timepoint (Hours)Unique DEGs
Hgs 24 hpvHgs 48 hpvTcs 24 hpvTcs 48 hpv
UpDownUpDownUpDownUpDown
Vaccination490391141061168126745032169
Age347541941069108201945472235
Type19477363366121163701036003919
Type × Age1278361441210932483521845715
Vacc × Age8145982644972146322342333
Vacc × Type3841185375152267166561722692
Vacc × Type × Age19394031131883073121724642333
Table 3. Number of regulated pathways in Harderian glands and tracheas at 24 and 48 post-vaccination with Newcastle disease virus LaSota by treatment and its interactions.
Main Factor or
Interaction
Organ and Sampling Timepoint (Hours)Unique Pathways
Hgs 24Hgs 48Tcs 24Tcs 48
UpDownUpDownUpDownUpDown
Vaccination160050302088130
Age007430102968
Type491163401005110
Type × Age252525258866128
Vacc × Age005002481535149
Vacc × Type0504370070107
Vacc × Type × Age455720005149
Disclaimer/Publisher’s Note: The statements, opinions and data contained in all publications are solely those of the individual author(s) and contributor(s) and not of MDPI and/or the editor(s). MDPI and/or the editor(s) disclaim responsibility for any injury to people or property resulting from any ideas, methods, instructions or products referred to in the content.

