

An Interrupted Time Series Analysis of the Impact of the COVID-19 Pandemic on Routine Vaccination Uptake in Kenya

Abstract
1. Introduction
2. Materials and Methods
2.1. Source of Data
2.2. Significant Public Health Events in Kenya before and during the COVID-19 Pandemic
2.3. Statistical Analysis
3. Results
4. Discussion
5. Conclusions
Author Contributions
Funding
Institutional Review Board Statement
Informed Consent Statement
Data Availability Statement
Acknowledgments
Conflicts of Interest
Appendix A
- Timeline of events in Kenya
References
- Carter, A.; Msemburi, W.; Sim, S.Y.; Gaythorpe, K.A.; Lambach, P.; Lindstrand, A.; Hutubessy, R. Modeling the impact of vaccination for the immunization Agenda 2030: Deaths averted due to vaccination against 14 pathogens in 194 countries from 2021 to 2030. Vaccine 2024, 42 (Suppl. 1), S28–S37. [Google Scholar] [CrossRef]
- Immunization Agenda 2030: A Global Strategy to Leave No One Behind. Available online: https://www.who.int/publications/m/item/immunization-agenda-2030-a-global-strategy-to-leave-no-one-behind (accessed on 14 September 2022).
- VaxView Vaccination Coverage|CDC 2021. Available online: https://www.cdc.gov/vaccines/vaxview/index.html (accessed on 9 September 2022).
- Anderson, E.L. Recommended Solutions to the Barriers to Immunization in Children and Adults. Mo. Med. 2014, 111, 344–348. [Google Scholar]
- Measles Outbreak—California, December 2014–February 2015. Available online: https://www.cdc.gov/mmwr/preview/mmwrhtml/mm6406a5.htm (accessed on 13 November 2022).
- Cacciatore, M.A.; Nowak, G.; Evans, N.J. Exploring The Impact of the US Measles Outbreak on Parental Awareness of and Support for Vaccination. Health Aff. 2016, 35, 334–340. [Google Scholar] [CrossRef]
- Omer, S.B.; Salmon, D.A.; Orenstein, W.A.; deHart, M.P.; Halsey, N. Vaccine Refusal, Mandatory Immunization, and the Risks of Vaccine-Preventable Diseases. N. Engl. J. Med. 2009, 360, 1981–1988. [Google Scholar] [CrossRef]
- Roush, S.W.; Murphy, T.V.; Vaccine-Preventable Disease Table Working Group. Historical Comparisons of Morbidity and Mortality for Vaccine-Preventable Diseases in the United States. JAMA 2007, 298, 2155–2163. [Google Scholar] [CrossRef]
- Godfrey, O.; Zhang, W.; Oppong, T.B.; Zhao, Q.; Li, D. Evidence of rotavirus vaccine impact in sub-Saharan Africa: Systematic review and meta-analysis. PLoS ONE 2020, 15, e0232113. Available online: https://journals.plos.org/plosone/article?id=10.1371/journal.pone.0232113 (accessed on 9 April 2024). [CrossRef]
- Lindstrand, A.; Cherian, T.; Chang-Blanc, D.; Feikin, D.; O’Brien, K.L. The World of Immunization: Achievements, Challenges, and Strategic Vision for the Next Decade. J. Infect. Dis. 2021, 224, S452–S467. [Google Scholar] [CrossRef]
- Zero-Dose Children and Missed Communities. Available online: https://www.gavi.org/our-alliance/strategy/phase-5-2021-2025/equity-goal/zero-dose-children-missed-communities (accessed on 14 September 2022).
- Burton, A.; Monasch, R.; Lautenbach, B.; Gacic-Dobo, M.; Neill, M.; Karimov, R.; Wolfson, L.; Jones, G.; Birmingham, M. WHO and UNICEF estimates of national infant immunization coverage: Methods and processes. Bull. World Health Organ. 2009, 87, 535–541. [Google Scholar] [CrossRef]
- Cata-Preta, B.O.; Santos, T.M.; Mengistu, T.; Hogan, D.R.; Barros, A.J.D.; Victora, C.G. Zero-dose children and the immunisation cascade: Understanding immunisation pathways in low and middle-income countries. Vaccine 2021, 39, 4564–4570. [Google Scholar] [CrossRef]
- GBD 2020, Release 1, Vaccine Coverage Collaborators. Measuring routine childhood vaccination coverage in 204 countries and territories, 1980–2019: A systematic analysis for the Global Burden of Disease Study 2020, Release 1. Lancet Lond. Engl. 2021, 398, 503–521. [Google Scholar] [CrossRef]
- Al-Tawfiq, J.A.; Jain, N.; Tanasov, A.; Schlagenhauf, P. Measles matter: Recent outbreaks highlight the need for catch-up vaccination in Europe and around the globe. New Microbes New Infect. 2024, 58, 101238. [Google Scholar] [CrossRef] [PubMed]
- Muhoza, P. Routine Vaccination Coverage—Worldwide, 2020. MMWR Morb. Mortal. Wkly. Rep. 2021, 70, 1495–1500. [Google Scholar] [CrossRef] [PubMed]
- Shet, A.; Carr, K.; Danovaro-Holliday, M.C.; Sodha, S.V.; Prosperi, C.; Wunderlich, J.; Wonodi, C.; Reynolds, H.W.; Mirza, I.; Gacic-Dobo, M.; et al. Impact of the SARS-CoV-2 pandemic on routine immunisation services: Evidence of disruption and recovery from 170 countries and territories. Lancet Glob. Health 2022, 10, e186–e194. [Google Scholar] [CrossRef] [PubMed]
- Wangari, E.N.; Gichuki, P.; Abuor, A.A.; Wambui, J.; Okeyo, S.O.; Oyatsi, H.T.; Odikara, S.; Kulohoma, B.W. Kenya’s response to the COVID-19 pandemic: A balance between minimising morbidity and adverse economic impact. AAS Open Res. 2021, 4, 3. [Google Scholar] [CrossRef] [PubMed]
- Gitau, T.; Kamita, M.; Muli, E.; Mweni, S.; Waithanji, R.; Mutisya, F.; Kirira, P.; Nzioka, A.; Figueroa, J.; Makokha, F. The impact of measures to curb COVID-19 on patient attendance at 10 hospitals in Machakos County, Kenya. J. Glob. Health 2021, 11, 05016. [Google Scholar] [CrossRef] [PubMed]
- Yusuf, M. Kenyan Doctors Strike Over Pay, Working Conditions. Voice Am. 2020. Available online: https://www.voanews.com/a/africa_kenyan-doctors-strike-over-pay-working-conditions/6199804.html (accessed on 9 April 2024).
- Analysing Disrupted Health Sectors—A Modular Manual. Available online: https://www.who.int/publications-detail-redirect/analysing-disrupted-health-sectors---a-modular-manual (accessed on 7 May 2024).
- Burton, A.; Kowalski, R.; Gacic-Dobo, M.; Karimov, R.; Brown, D. A Formal Representation of the WHO and UNICEF Estimates of National Immunization Coverage: A Computational Logic Approach. PLoS ONE 2012, 7, e47806. [Google Scholar] [CrossRef] [PubMed]
- Valentelyte, G.; Keegan, C.; Sorensen, J. A comparison of four quasi-experimental methods: An analysis of the introduction of activity-based funding in Ireland. BMC Health Serv. Res. 2022, 22, 1311. [Google Scholar] [CrossRef] [PubMed]
- Lee, W.-R.; Kim, L.-H.; Lee, G.-M.; Cheon, J.; Kwon, Y.D.; Noh, J.-W.; Yoo, K.-B. Effect of COVID-19-Related Interventions on the Incidence of Infectious Eye Diseases: Analysis of Nationwide Infectious Disease Incidence Monitoring Data. Int. J. Public. Health 2022, 67, 1605211. [Google Scholar] [CrossRef] [PubMed]
- Auger, N.; Wei, S.Q.; Dayan, N.; Ukah, U.V.; Quach, C.; Lewin, A.; Healy-Profitós, J.; Ayoub, A.; Chang, J.; Luu, T.M. Impact of Covid-19 on rates of gestational diabetes in a North American pandemic epicenter. Acta Diabetol. 2022, 60, 257–264. [Google Scholar] [CrossRef]
- Bernal, J.L.; Cummins, S.; Gasparrini, A. Interrupted time series regression for the evaluation of public health interventions: A tutorial. Int. J. Epidemiol. 2017, 46, 348–355. [Google Scholar] [CrossRef]
- Travis-Lumer, Y.; Goldberg, Y.; Levine, S.Z. Effect size quantification for interrupted time series analysis: Implementation in R and analysis for Covid-19 research. Emerg. Themes Epidemiol. 2022, 19, 9. [Google Scholar] [CrossRef] [PubMed]
- Barasa, E.; Kazungu, J.; Orangi, S.; Kabia, E.; Ogero, M.; Kasera, K. Indirect health effects of the COVID-19 pandemic in Kenya: A mixed methods assessment. BMC Health Serv. Res. 2021, 21, 740. [Google Scholar] [CrossRef] [PubMed]
- Box, G.E.P.; Jenkins, G.M.; Reinsel, G.C.; Ljung, G.M. Time Series Analysis: Forecasting and Control, 5th ed.; John Wiley & Sons, Inc.: Hoboken, NJ, USA, 2015; p. 1. ISBN 978-1-118-67502-1. [Google Scholar]
- Jandoc, R.; Burden, A.M.; Mamdani, M.; Lévesque, L.E.; Cadarette, S.M. Interrupted time series analysis in drug utilization research is increasing: Systematic review and recommendations. J. Clin. Epidemiol. 2015, 68, 950–956. [Google Scholar] [CrossRef] [PubMed]
- Schaffer, A.L.; Dobbins, T.A.; Pearson, S.-A. Interrupted time series analysis using autoregressive integrated moving average (ARIMA) models: A guide for evaluating large-scale health interventions. BMC Med. Res. Methodol. 2021, 21, 58. [Google Scholar] [CrossRef] [PubMed]
- Vanella, P.; Basellini, U.; Lange, B. Assessing excess mortality in times of pandemics based on principal component analysis of weekly mortality data—The case of COVID-19. Genus 2021, 77, 1–36. [Google Scholar] [CrossRef] [PubMed]
- Vanella, P. A principal component model for forecasting age- and sex-specific survival probabilities in Western Europe. Z. Gesamte Versicherungswissenschaft 2017, 106, 539–554. [Google Scholar] [CrossRef]
- Wang, Y.; Yan, Z.; Wang, D.; Yang, M.; Li, Z.; Gong, X.; Wu, D.; Zhai, L.; Zhang, W.; Wang, Y. Prediction and analysis of COVID-19 daily new cases and cumulative cases: Times series forecasting and machine learning models. BMC Infect. Dis. 2022, 22, 495. [Google Scholar] [CrossRef] [PubMed]
- Manya, A.; Braa, J.; Øverland, L.; Titlestad, O.; Mumo, J.; Nzioka, C. National Roll out of District Health Information Software (DHIS 2) in Kenya, 2011—Central Server and Cloud based Infrastructure. In Proceedings of the IST-Africa 2012, Dar es Salaam, Tanzania, 9–11 May 2012. [Google Scholar]
- Ombuor, R. Kenya’s Doctors, Nurses Strike for Better Pay. Voice Am. 2016. Available online: https://www.voanews.com/a/kenya-doctors-nurses-strike-for-better-pay/3623644.html (accessed on 9 April 2024).
- Kenya doctors end strike after signing government deal. BBC News, 14 March 2017.
- At Least 8 Dead in Kenya Following Nurses Strike—SABC News—Breaking News, Special Reports, World, Business, Sport Coverage of All South African Current Events. Africa’s News Leader. Available online: https://www.sabcnews.com/sabcnews/at-least-8-dead-in-kenya-following-nurses-strike/ (accessed on 9 April 2024).
- Kenyan Nurses End 150-Day Strike. Available online: https://www.aa.com.tr/en/africa/kenyan-nurses-end-150-day-strike/955232 (accessed on 9 April 2024).
- Ombok, E. Kenya Reports First Case of Coronavirus. BloombergCom, 13 March 2020. [Google Scholar]
- Coronavirus: Kenya introduces tight restrictions 2020. BBC News. Available online: https://www.bbc.com/news/world-africa-51917920 (accessed on 24 June 2024).
- Uhuru’s Speech in Full as More COVID-19 Measures Announced|Nation. Available online: https://nation.africa/kenya/news/uhuru-s-speech-in-full-as-more-covid-19-measures-announced-281796 (accessed on 9 April 2024).
- Kenya Goes Into Dusk-to-Dawn Curfew as Contact Tracing Expands to 1000. East African 2020. Available online: https://www.theeastafrican.co.ke/tea/news/east-africa/kenya-goes-into-dusk-to-dawn-curfew-as-contact-tracing-expands-to-1-000--1439314 (accessed on 9 April 2024).
- COVID-19: Kenya Bans Travel in and out of Nairobi, Other Areas. Al Jazeera. Available online: https://www.aljazeera.com/news/2020/4/6/covid-19-kenya-bans-travel-in-and-out-of-nairobi-other-areas (accessed on 10 April 2024).
- Ombuor, R. Kenya’s President Halts All Passenger Transport in Four Counties to Stop Coronavirus. Voice Am 2020. Available online: https://www.voanews.com/a/science-health_coronavirus-outbreak_kenyas-president-halts-all-passenger-transport-four-counties/6187054.html (accessed on 10 April 2024).
- State Restricts Movement in Mandera Over COVID 19—Kenya News Agency. 2020. Available online: https://www.kenyanews.go.ke/mandera-falls-under-covid-19-hot-spots/ (accessed on 10 April 2024).
- Heavy Security as Government Implements Lockdown in Old Town—Kenya News Agency. 2020. Available online: https://www.kenyanews.go.ke/heavy-security-as-government-implements-lockdown-in-old-town/ (accessed on 10 April 2024).
- Kenya USE. Government of Kenya Announces New Restrictions (18 June 2021). US Embassy Kenya 2021. Available online: https://ke.usembassy.gov/government-of-kenya-announces-new-restrictions/ (accessed on 10 April 2024).
- President Uhuru Kenyatta Lifts COVID-19 Restrictions. East African 2020. Available online: https://www.theeastafrican.co.ke/tea/news/east-africa/president-uhuru-kenyatta-lifts-covid-19-restrictions-1447140 (accessed on 10 April 2024).
- Kenya Lifts Remaining COVID Restrictions|Reuters. Available online: https://www.reuters.com/world/africa/kenya-lifts-remaining-covid-restrictions-2022-03-11/ (accessed on 10 April 2024).
- Kenya’s Official Campaign Period Begins Today. What’s at Stake? Available online: https://www.citizen.digital/news/iebc-releases-key-timelines-ahead-of-august-polls-n299075 (accessed on 10 April 2024).
- Kenya’s Presidential Candidates Hold Final Rallies on Election Eve|News|Al Jazeera. Available online: https://www.aljazeera.com/news/2022/8/7/kenyas-presidential-candidates-hold-last-ditch-rallies (accessed on 10 April 2024).
- D-Day as Kenyans Cast Their Votes in General Election—The East African. Available online: https://www.theeastafrican.co.ke/tea/news/east-africa/d-day-as-kenyans-cast-their-votes-in-general-election-3907976 (accessed on 10 April 2024).
- Helfenstein, U. The Use of Transfer Function Models, Intervention Analysis and Related Time Series Methods in Epidemiology. Int. J. Epidemiol. 1991, 20, 808–815. [Google Scholar] [CrossRef] [PubMed]
- McDowall, D.; McCleary, R.; Bartos, B.J. Interrupted Time Series Analysis; Oxford University Press: Oxford, NY, USA, 2019. [Google Scholar]
- Hyndman, R.J.; Khandakar, Y. Automatic Time Series Forecasting: The forecast Package for R. J. Stat. Softw. 2008, 27, 1–22. [Google Scholar] [CrossRef]
- COVID-19 Pandemic Fuels Largest Continued Backslide in Vaccinations in Three Decades. Available online: https://www.unicef.org/rosa/press-releases/covid-19-pandemic-fuels-largest-continued-backslide-vaccinations-three-decades (accessed on 8 May 2024).
- Guidelines, Standards & Policies Portal. Available online: http://guidelines.health.go.ke/#/category/25/471/meta (accessed on 13 June 2024).
- Impact of COVID-19 on Immunization of Brazilian Infants—PubMed. Available online: https://pubmed.ncbi.nlm.nih.gov/33962080/ (accessed on 4 March 2024).
- da Silva, T.P.R.; Brandão, L.G.V.A.; Vieira, E.W.R.; Maciel, T.B.S.; da Silva, T.M.R.; Luvisaro, B.M.O.; de Menezes, F.R.; Matozinhos, F.P. Impact of COVID-19 pandemic on vaccination against meningococcal C infection in Brazil. Vaccine X 2022, 10, 100156. [Google Scholar] [CrossRef]
- The Effect of Vaccine Mandate Announcements on Vaccine Uptake in Canada: An Interrupted Time Series Analysis—PubMed. Available online: https://pubmed.ncbi.nlm.nih.gov/37019696/ (accessed on 4 March 2024).
- Burt, J.F.; Ouma, J.; Lubyayi, L.; Amone, A.; Aol, L.; Sekikubo, M.; Nakimuli, A.; Nakabembe, E.; Mboizi, R.; Musoke, P.; et al. Indirect effects of COVID-19 on maternal, neonatal, child, sexual and reproductive health services in Kampala, Uganda. BMJ Glob. Health 2021, 6, e006102. [Google Scholar] [CrossRef] [PubMed]


| First Month of the Interruption | Immediate Change a (95% CI) | Slope Change b (95% CI) | |||
|---|---|---|---|---|---|
| Vaccine | Observed | Forecasted (95% CI) | Relative Difference (%) | ||
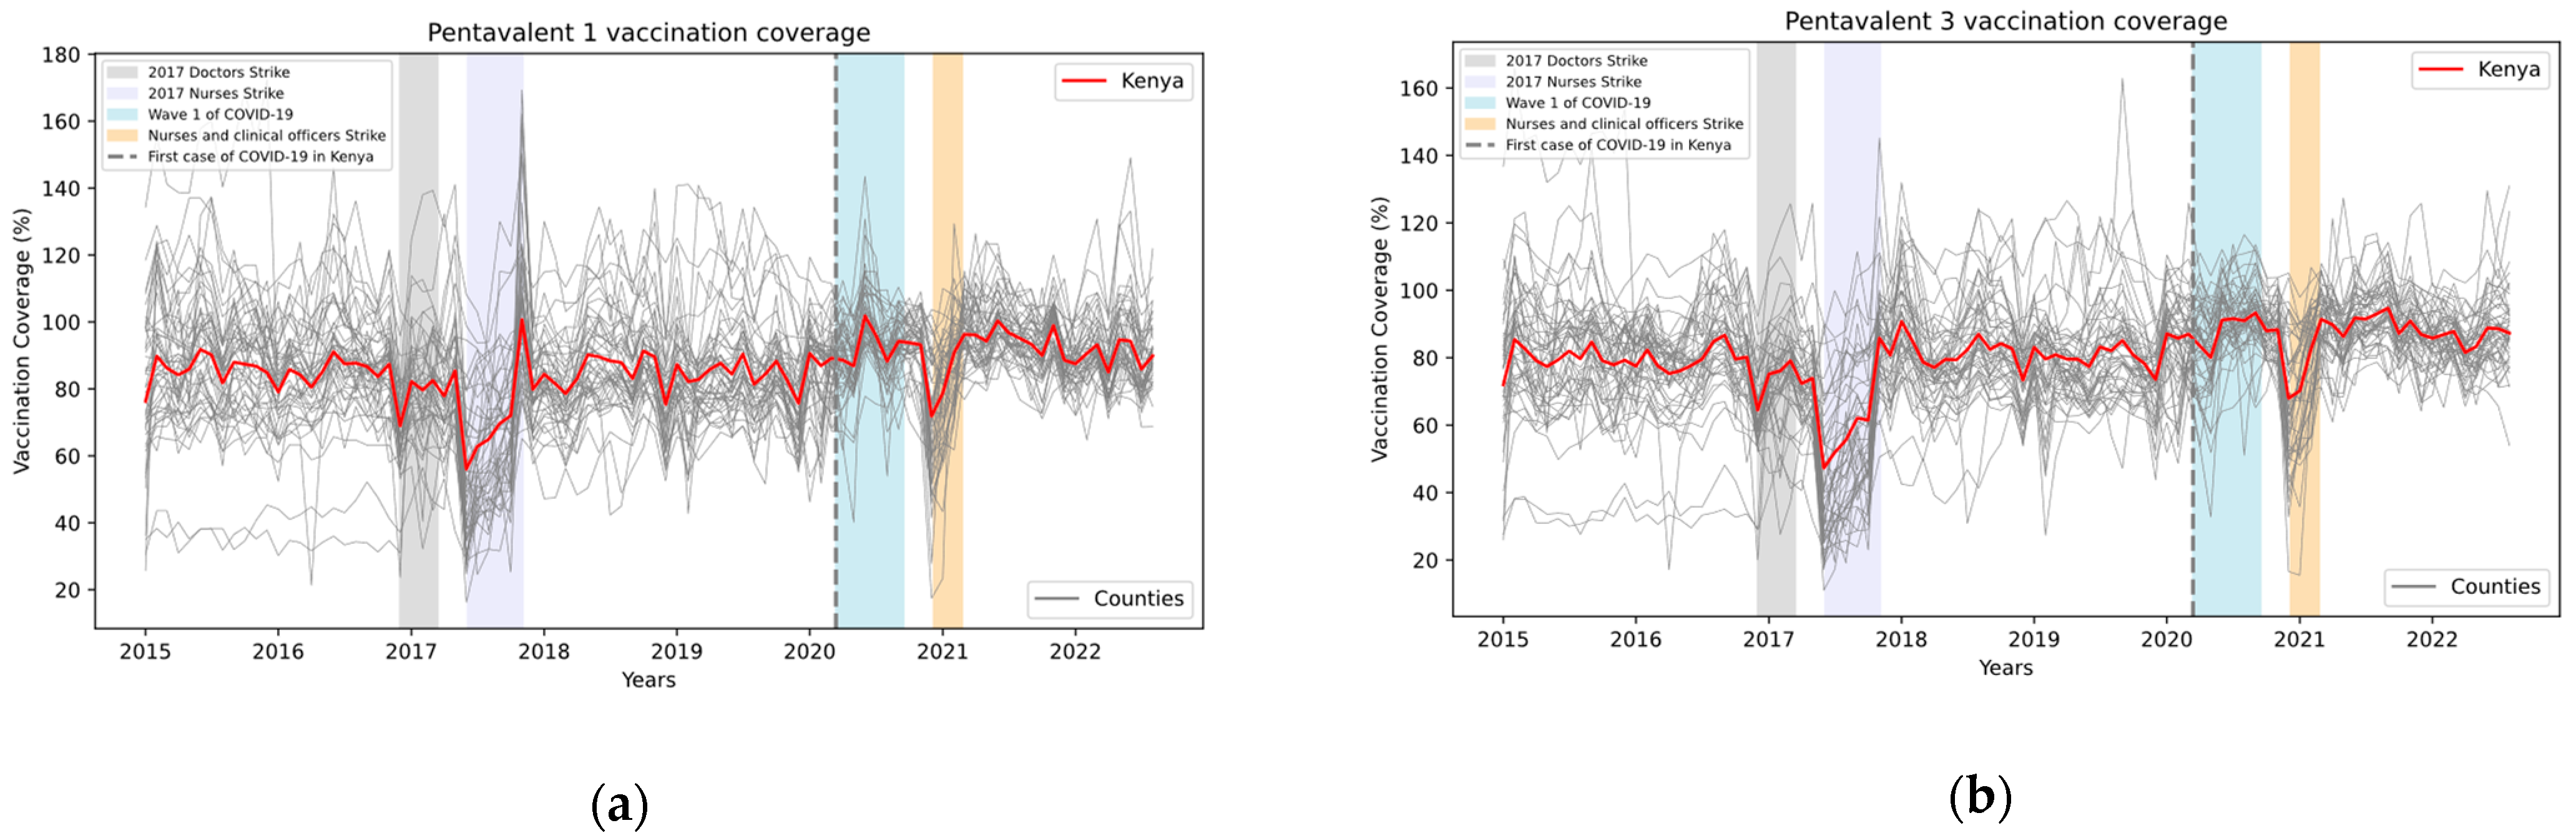
| Pentavalent, 1st dose | 89,590 | 108,939 (89,831 to 128,047) | −21·6 | −8336 (−24,507 to 7833) | 889 (−287 to 2065) |
| Pentavalent, 2nd dose | 87,953 | 105,661 (90,107 to 121,216) | −20·1 | −12,212 (−27,872 to 3448) | 1106 (−162 to 2374) |
| Pentavalent, 3rd dose | 84,616 | 105,353 (87,773 to 122,934) | −24·5 | −20,848 (−35,299 to -6397) | 1426 (−2325 to 5177) |
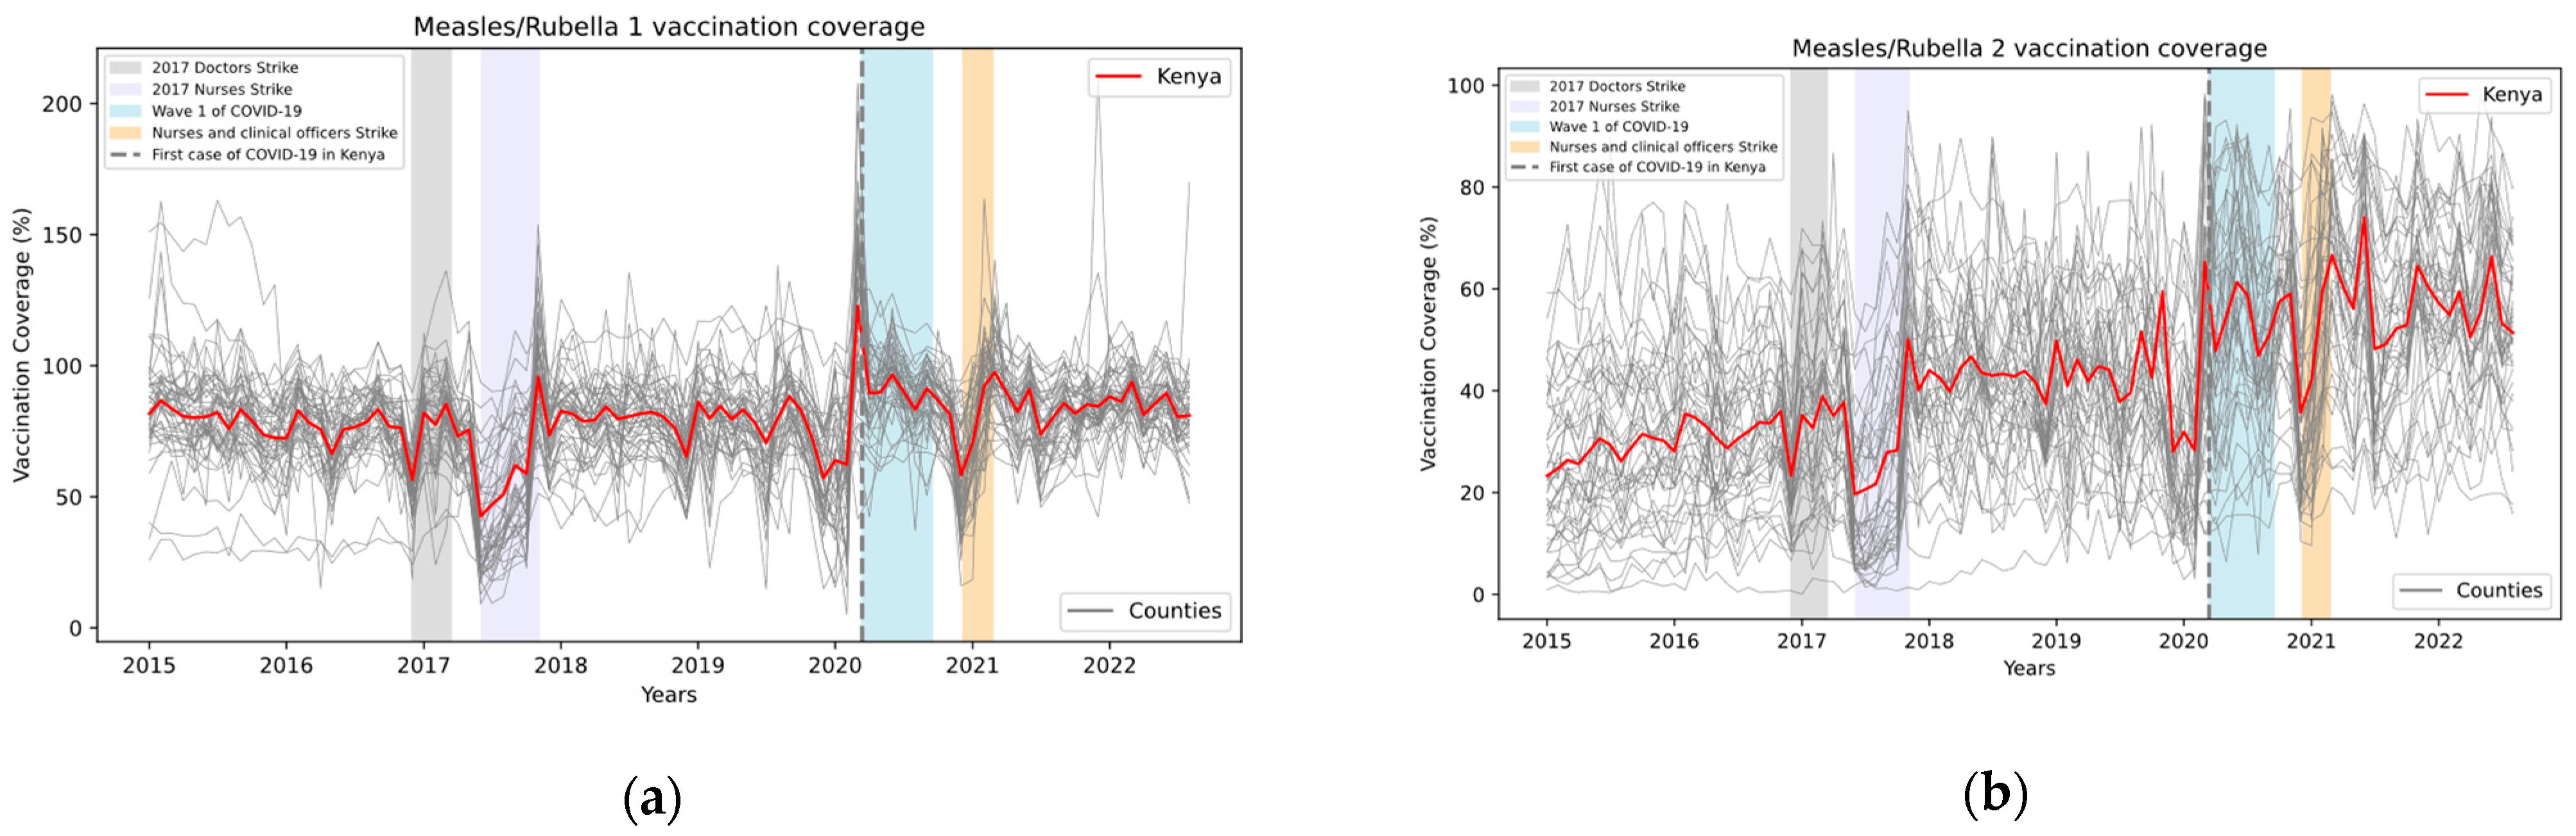
| Measles/rubella, 1st dose | 73,023 | 92,965 (61,106 to 124,824) | −27·3 | −6609 (−24,184 to 10,966) | 885 (−411 to 2181) |
| Measles/rubella, 2nd dose | 44,335 | 60,138 (37,274 to 83,003) | −35·6 | 762 (−14,205 to 15,729) | 361 (−888 to 1610) |
Disclaimer/Publisher’s Note: The statements, opinions and data contained in all publications are solely those of the individual author(s) and contributor(s) and not of MDPI and/or the editor(s). MDPI and/or the editor(s) disclaim responsibility for any injury to people or property resulting from any ideas, methods, instructions or products referred to in the content. |
© 2024 by the authors. Licensee MDPI, Basel, Switzerland. This article is an open access article distributed under the terms and conditions of the Creative Commons Attribution (CC BY) license (https://creativecommons.org/licenses/by/4.0/).
Share and Cite
Ngigi, M.; Moride, Y.; Castilloux, A.-M.; Clemens, S.A.C. An Interrupted Time Series Analysis of the Impact of the COVID-19 Pandemic on Routine Vaccination Uptake in Kenya. Vaccines 2024, 12, 826. https://doi.org/10.3390/vaccines12080826
Ngigi M, Moride Y, Castilloux A-M, Clemens SAC. An Interrupted Time Series Analysis of the Impact of the COVID-19 Pandemic on Routine Vaccination Uptake in Kenya. Vaccines. 2024; 12(8):826. https://doi.org/10.3390/vaccines12080826
Chicago/Turabian StyleNgigi, Michael, Yola Moride, Anne-Marie Castilloux, and Sue Ann Costa Clemens. 2024. "An Interrupted Time Series Analysis of the Impact of the COVID-19 Pandemic on Routine Vaccination Uptake in Kenya" Vaccines 12, no. 8: 826. https://doi.org/10.3390/vaccines12080826
APA StyleNgigi, M., Moride, Y., Castilloux, A.-M., & Clemens, S. A. C. (2024). An Interrupted Time Series Analysis of the Impact of the COVID-19 Pandemic on Routine Vaccination Uptake in Kenya. Vaccines, 12(8), 826. https://doi.org/10.3390/vaccines12080826