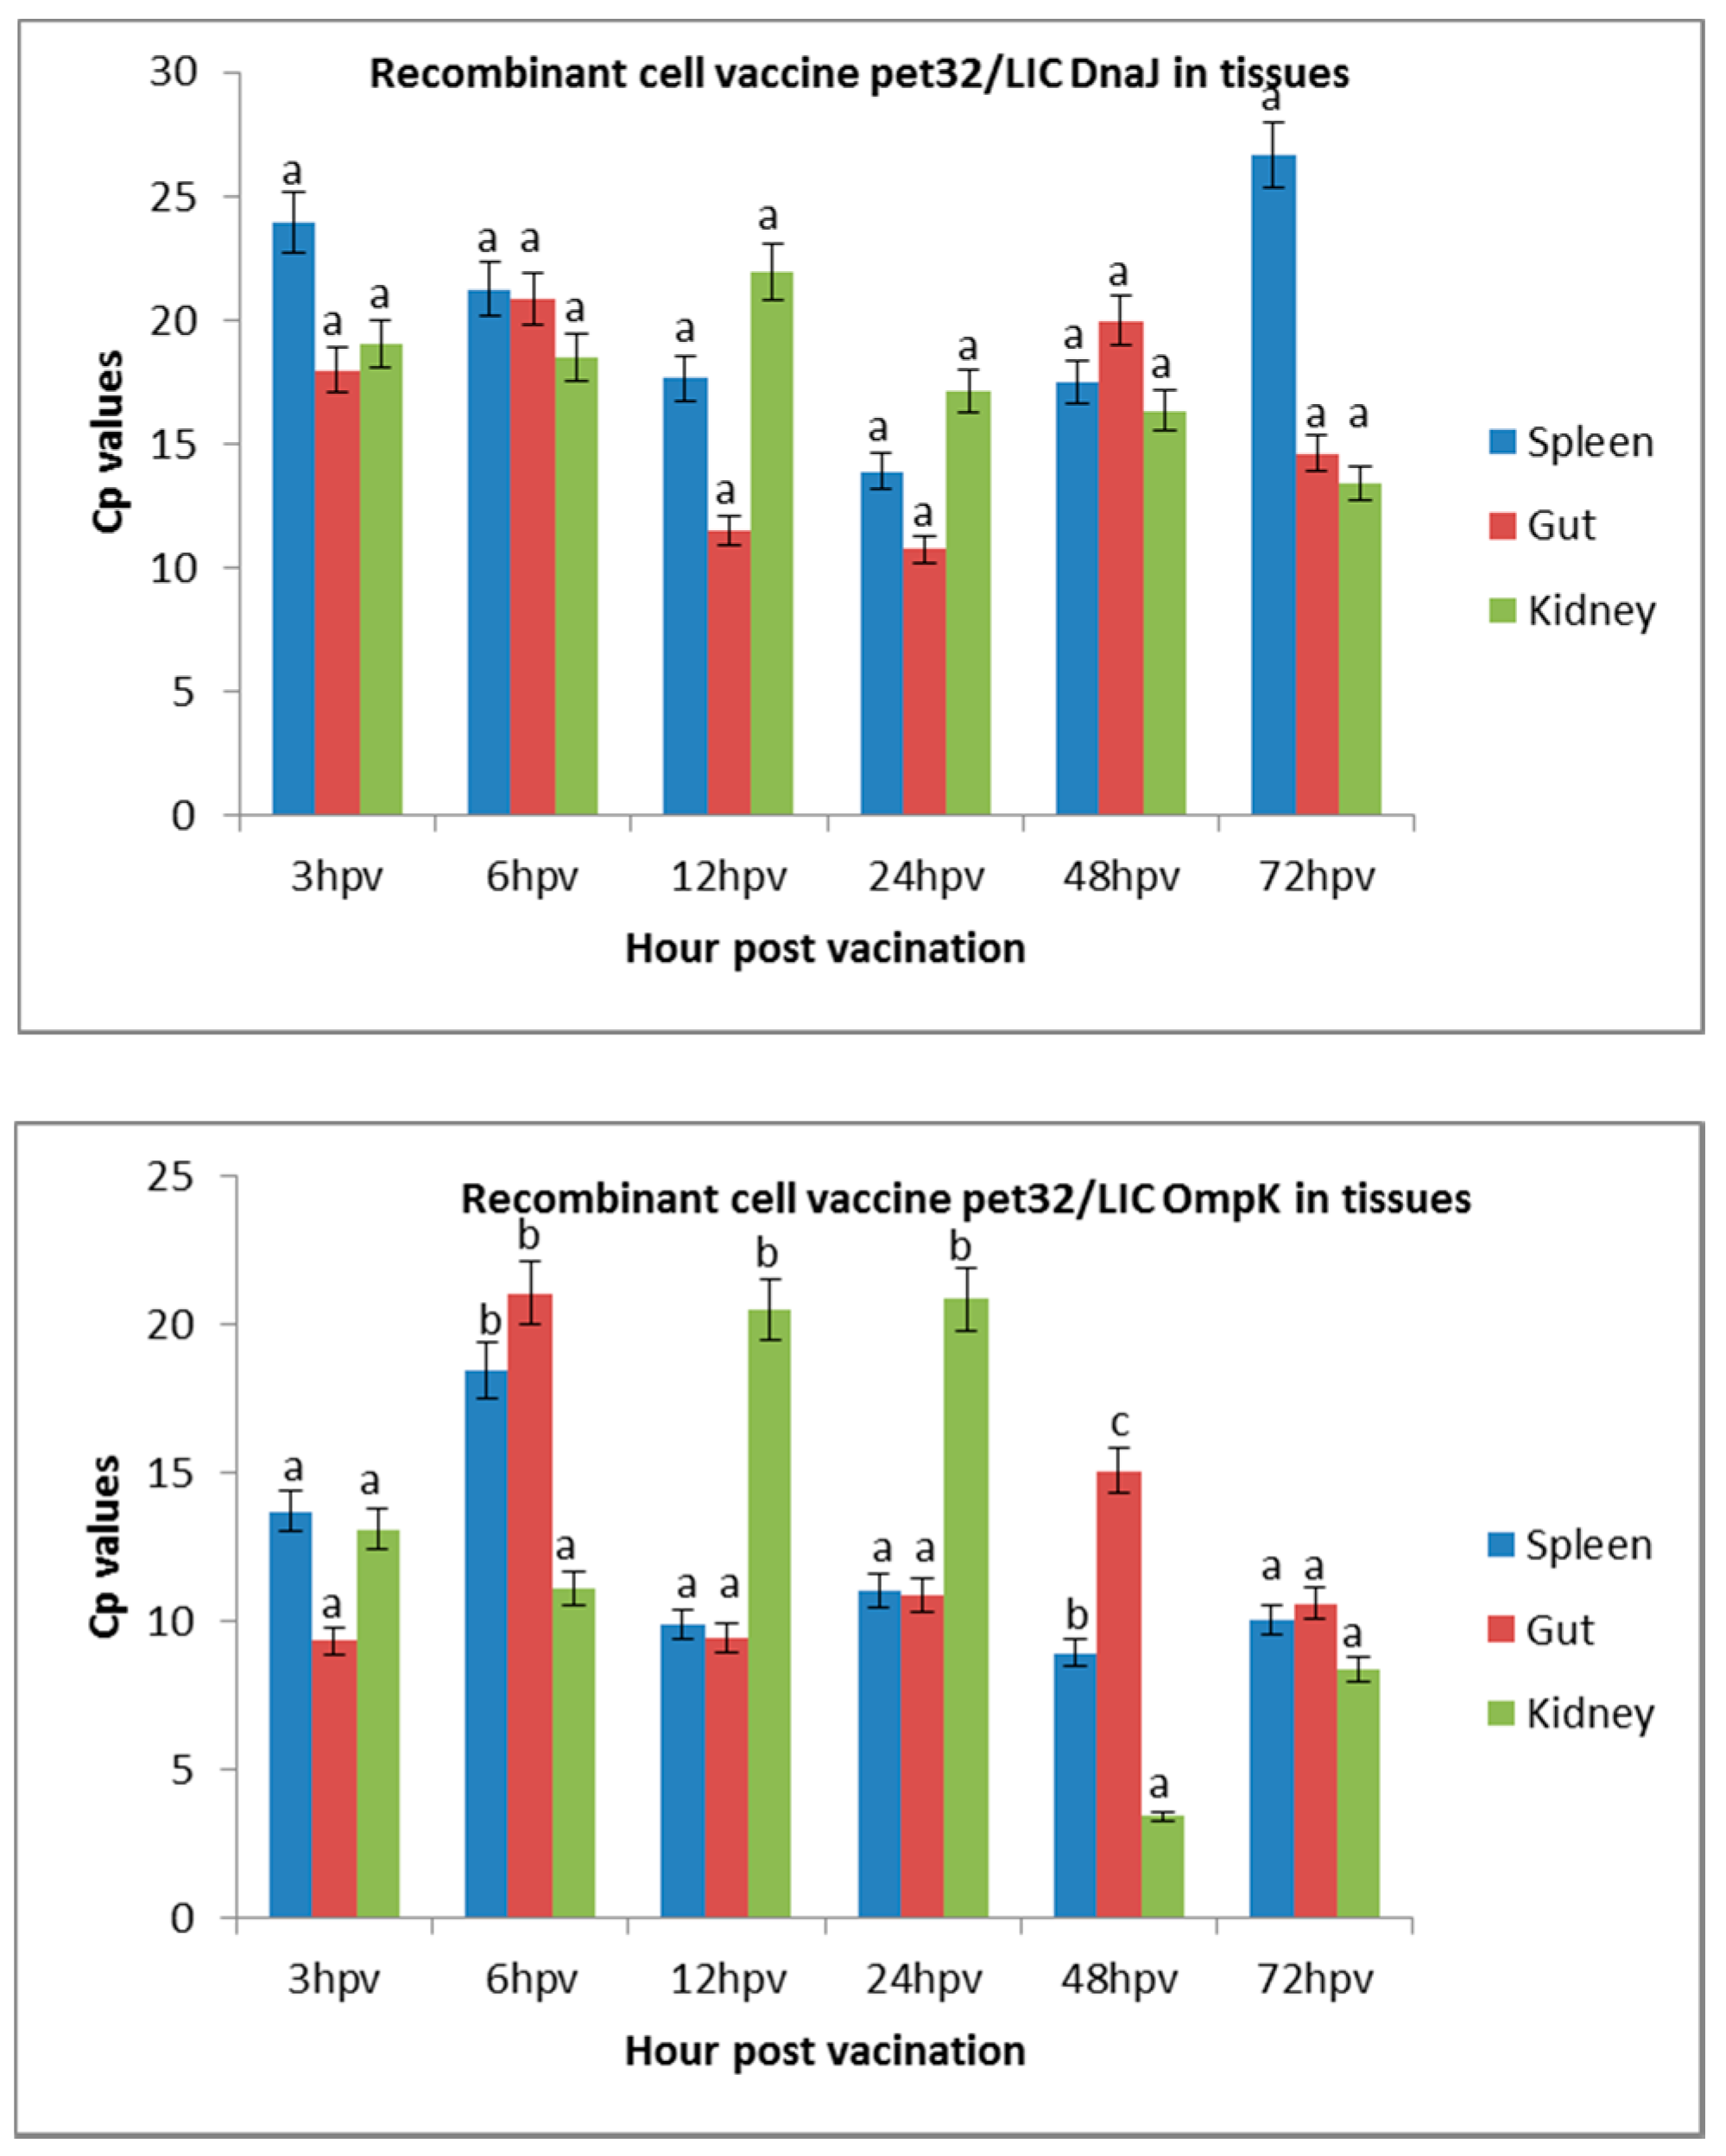
Figure 1.
Expression of recombinant cell vaccines in the spleen, intestine, and kidney of vaccinated fish. The abundant expression in the spleen, gut, and kidney tissues was expressed as the crossing point (cp) value (the crossing point at which fluoresces crosses the threshold). The results are presented as means ± SD. A higher cp value indicates lower expression level. Significant differences are indicated by different letters (p < 0.05).
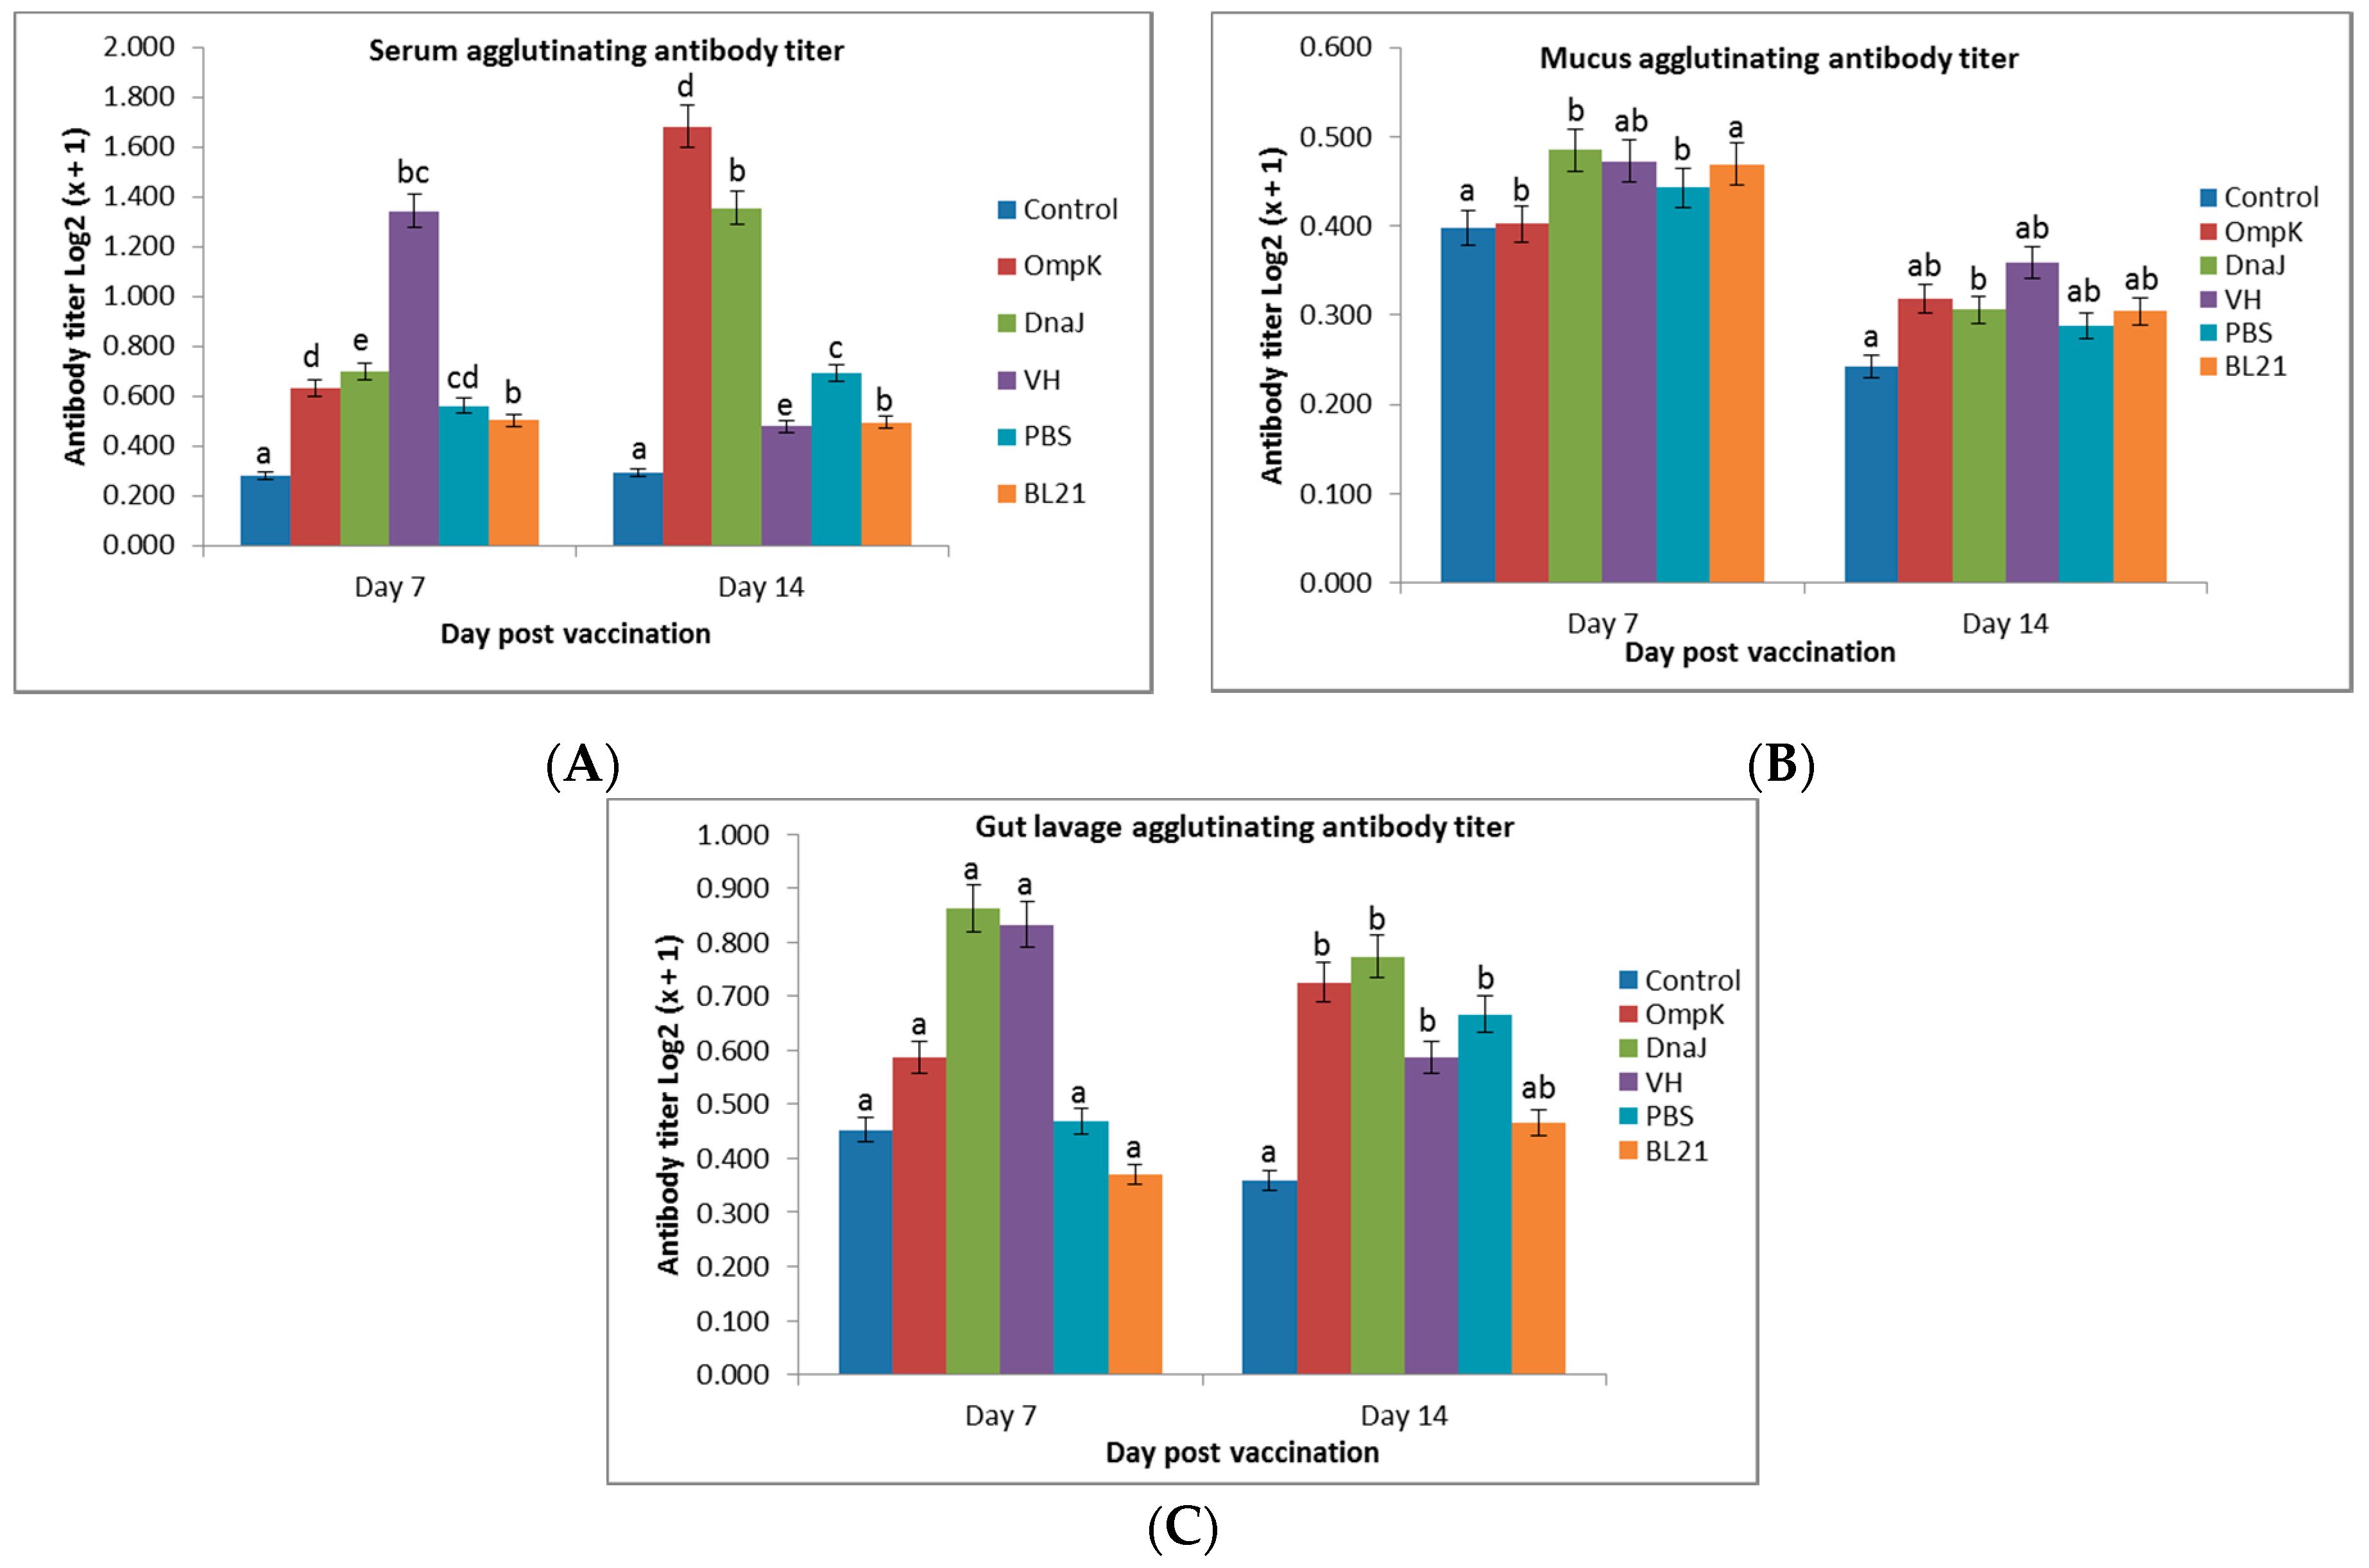
Figure 2.
The agglutinating antibody titers in (A) serum, (B) mucus, and (C) gut lavage of immunized juvenile seabass at day 7 and 14 post-vaccination (mean ± sd). Significant differences are indicated by different letters (p > 0.05).
Figure 2.
The agglutinating antibody titers in (A) serum, (B) mucus, and (C) gut lavage of immunized juvenile seabass at day 7 and 14 post-vaccination (mean ± sd). Significant differences are indicated by different letters (p > 0.05).
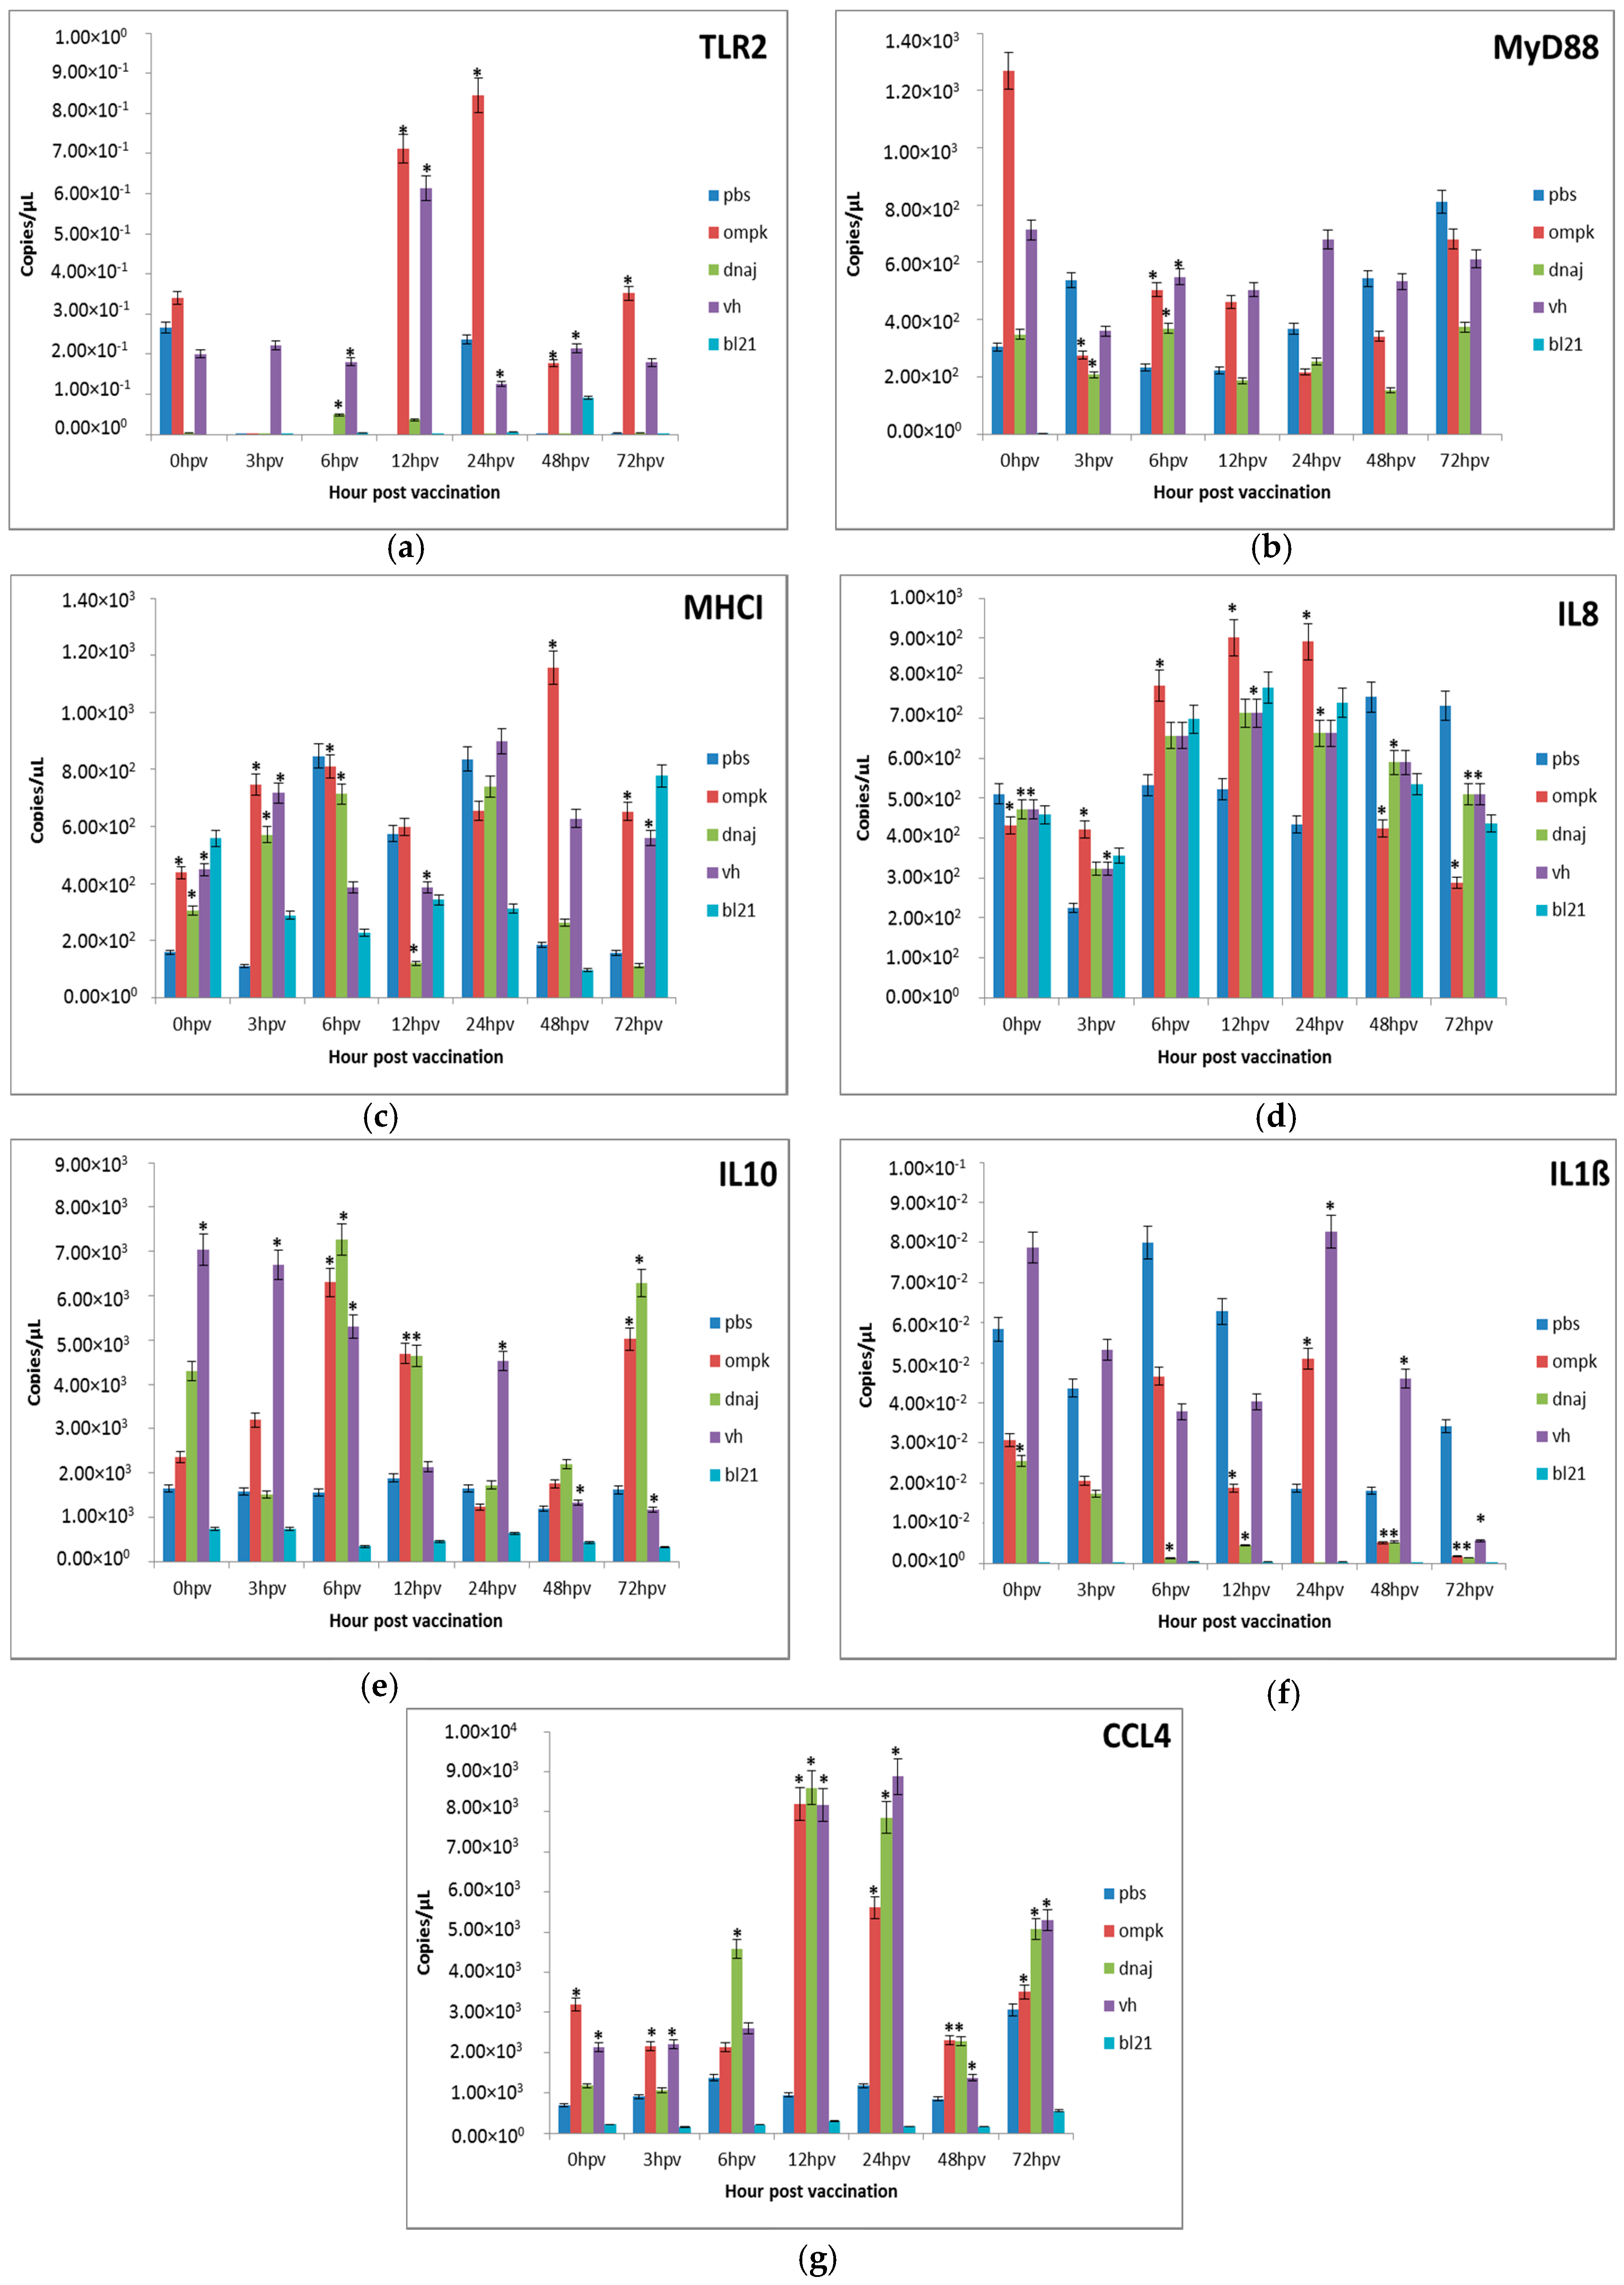
Figure 3.
Comparative expression profiles of the antigen recognition-related genes (a) TLR2, (b) MyD88, (c) MHCI and pro-inflammatory cytokines (d) IL8, (e) IL10, (f) IL1ß, (g) CCL4 in the kidney of juvenile seabass after vaccination. Juvenile seabass were injected with 107 CFU/mL of the inactivated pET-32/LIC-OmpK and pET-32/LIC-DnaJ recombinant cell, inactivated E. coli BL21 (DE3) and formalin-killed whole cell V. harveyi vaccines, while the unvaccinated control group was injected with PBS solution. Bars represent the mean copy number of three biological replicates and error bars represent standard deviation. Statistical significance was analyzed between the vaccinated and PBS control groups of seabass (* p < 0.05).
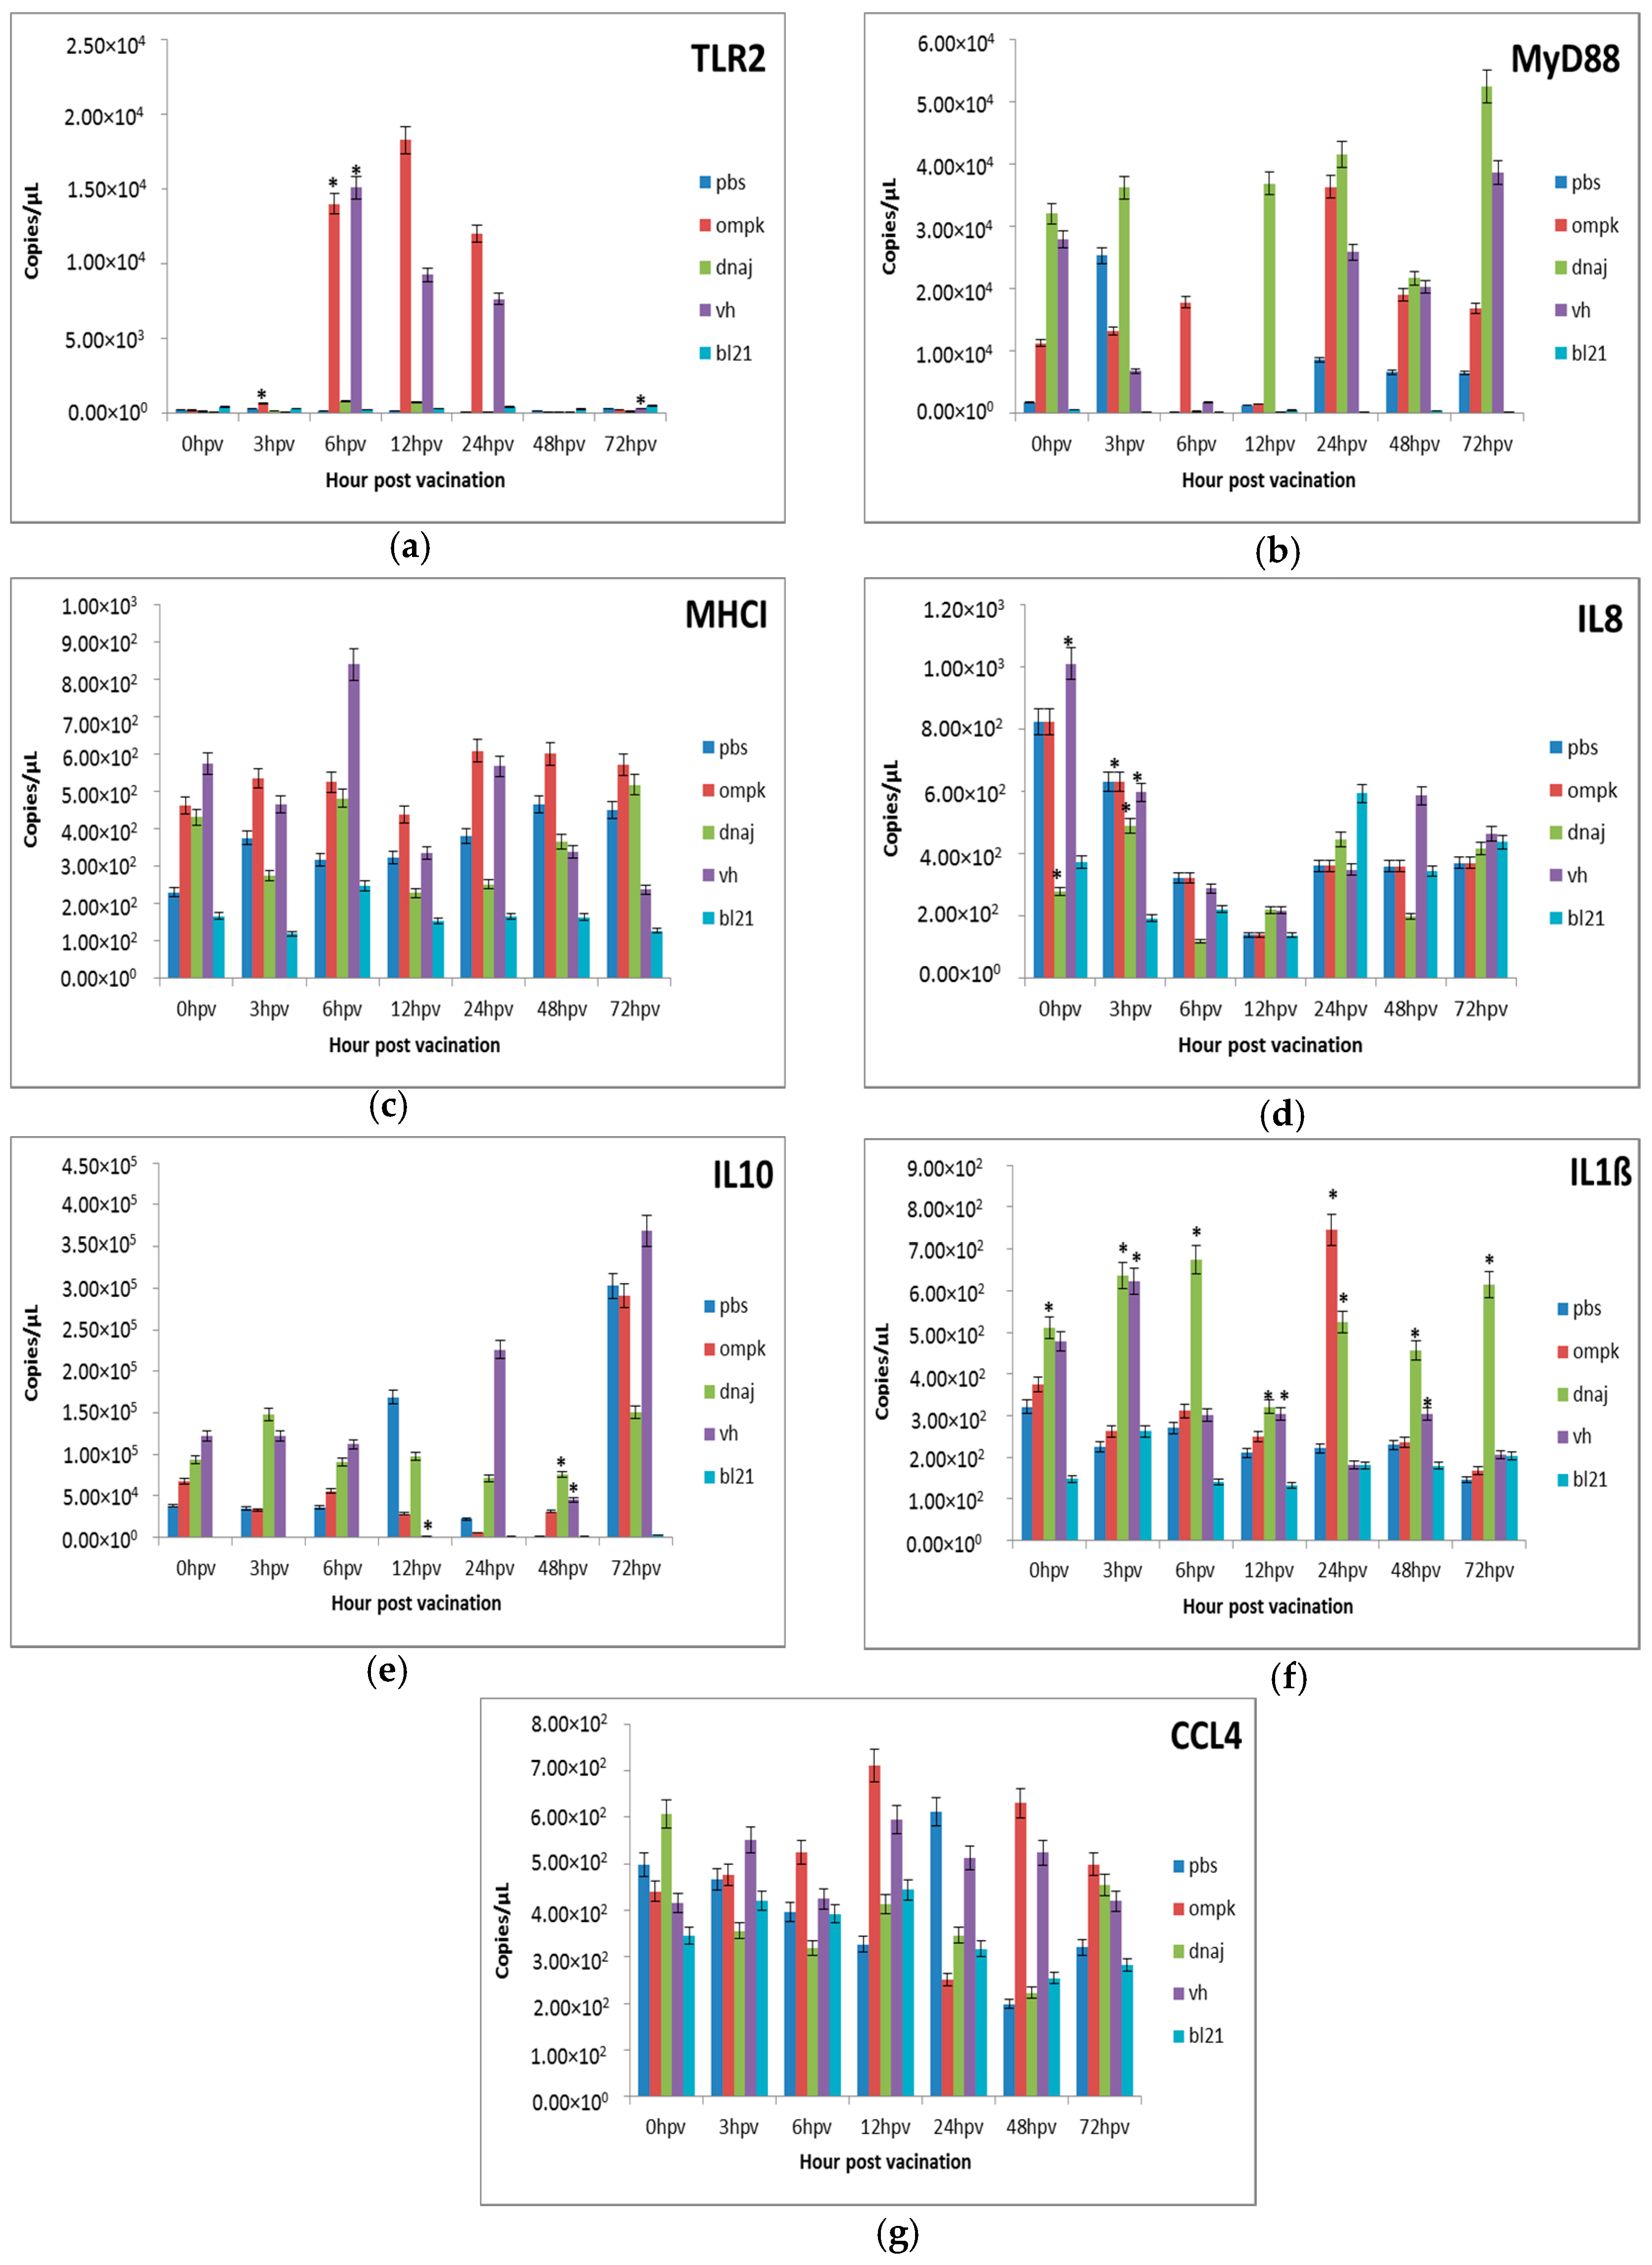
Figure 4.
Comparative expression profiles of the antigen recognition-related genes (a) TLR2, (b) MyD88, (c) MHCI and pro-inflammatory cytokines (d) IL8, (e) IL10, (f) IL1ß, (g) CCL4 in the intestine of juvenile seabass after vaccination. Juvenile seabass were injected with 107 CFU/mL of the inactivated pET-32/LIC-OmpK and pET-32/LIC-DnaJ recombinant cells, inactivated E. coli BL21 (DE3) and formalin killed whole cells V. harveyi vaccines, while unvaccinated fish were injected with PBS. Bars represent the mean copy numbers of three biological replicates and error bars represent standard deviation. Statistical significance was analyzed between the vaccinated and PBS vaccinated groups of seabass (* p < 0.05).
Figure 5.
Comparative expression profiles of the antigen recognition-related genes (a) TLR2, (b) MyD88, (c) MHCI and pro-inflammatory cytokines (d) IL8, (e) IL10, (f) IL1ß, (g) CCL4 in the spleen of juvenile seabass after vaccination. Juvenile seabass were injected with 107 CFU/mL of the inactivated pET-32/LIC-OmpK and pET-32/LIC-DnaJ recombinant cells, inactivated E. coli BL21 (DE3) and formalin killed whole cells V. harveyi vaccines, while the unvaccinated control group was injected with PBS solution. Bars represent the mean copy numbers of three biological replicates and error bars represent standard deviation. Statistical significance was analyzed between the vaccinated and PBS vaccinated groups of seabass (* p < 0.05).
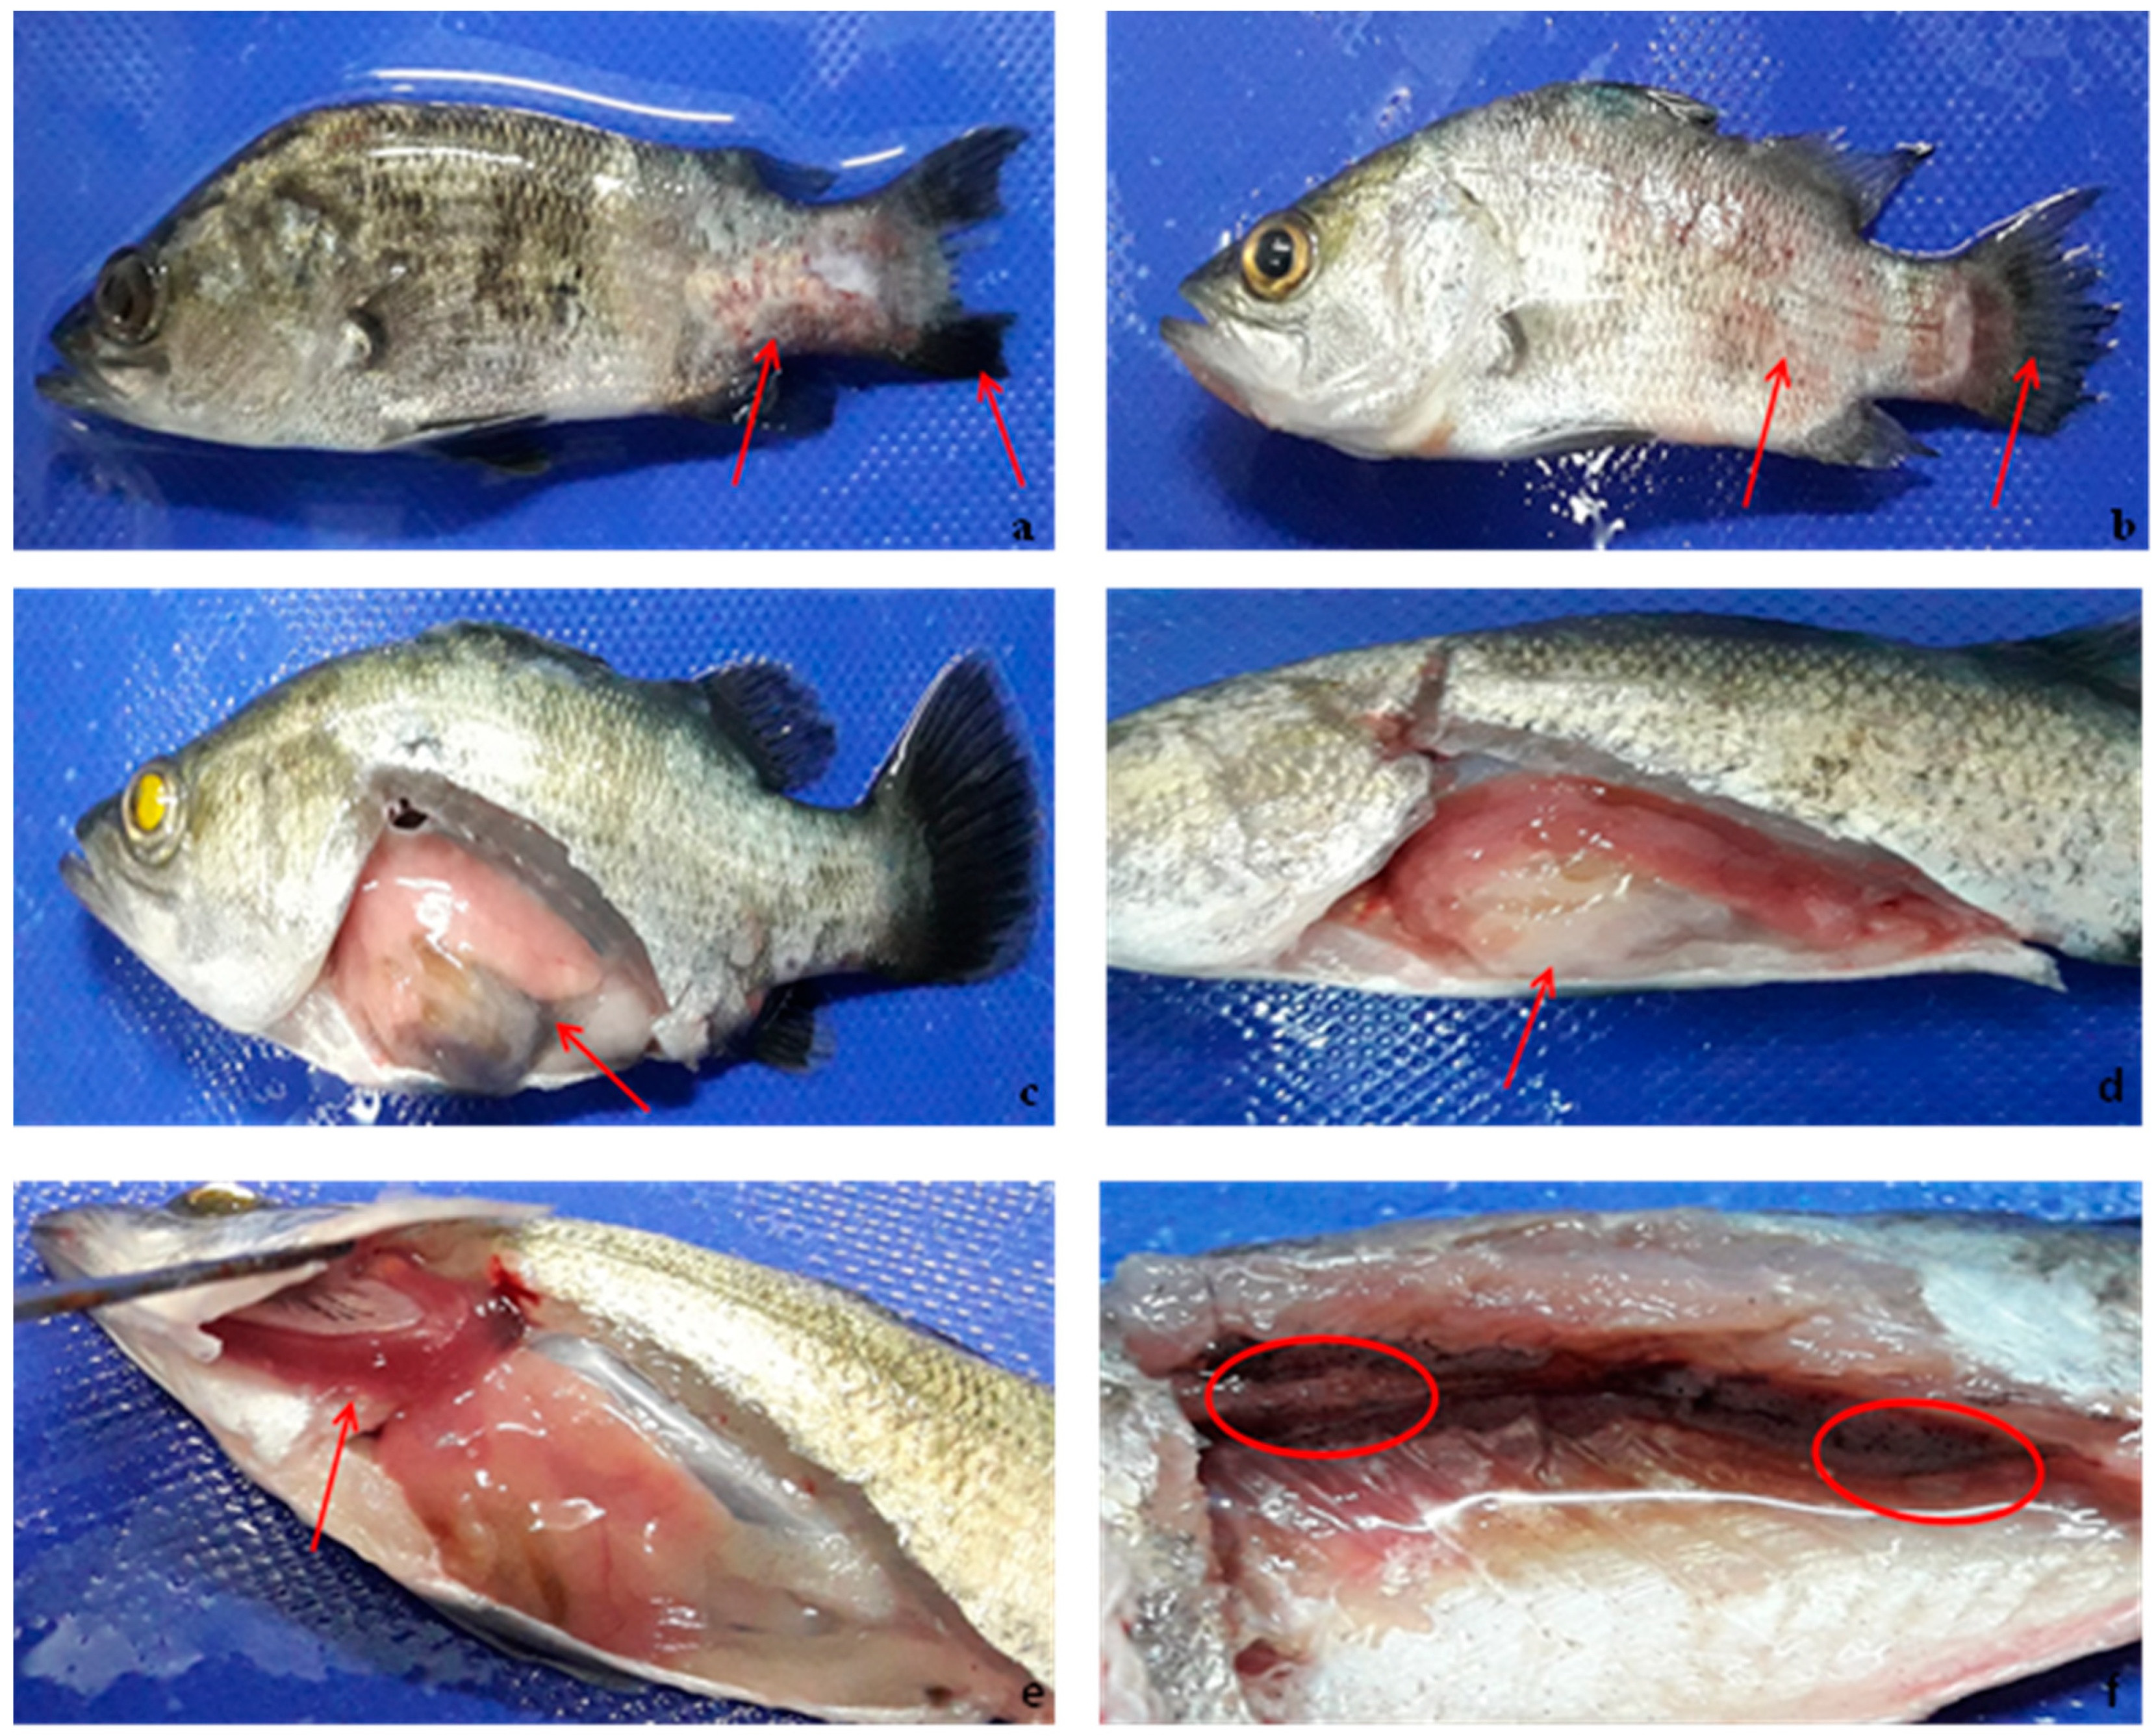
Figure 6.
Juvenile seabass experimentally challenged with pathogenic V. harveyi showing (a,b) hemorrhagic skin, eye opacity, tail and fin rot, (c) Infected and swollen gonad, (d) Swollen intestine, (e) Pale and discolored of gill, and (f) Black spots.
Figure 6.
Juvenile seabass experimentally challenged with pathogenic V. harveyi showing (a,b) hemorrhagic skin, eye opacity, tail and fin rot, (c) Infected and swollen gonad, (d) Swollen intestine, (e) Pale and discolored of gill, and (f) Black spots.
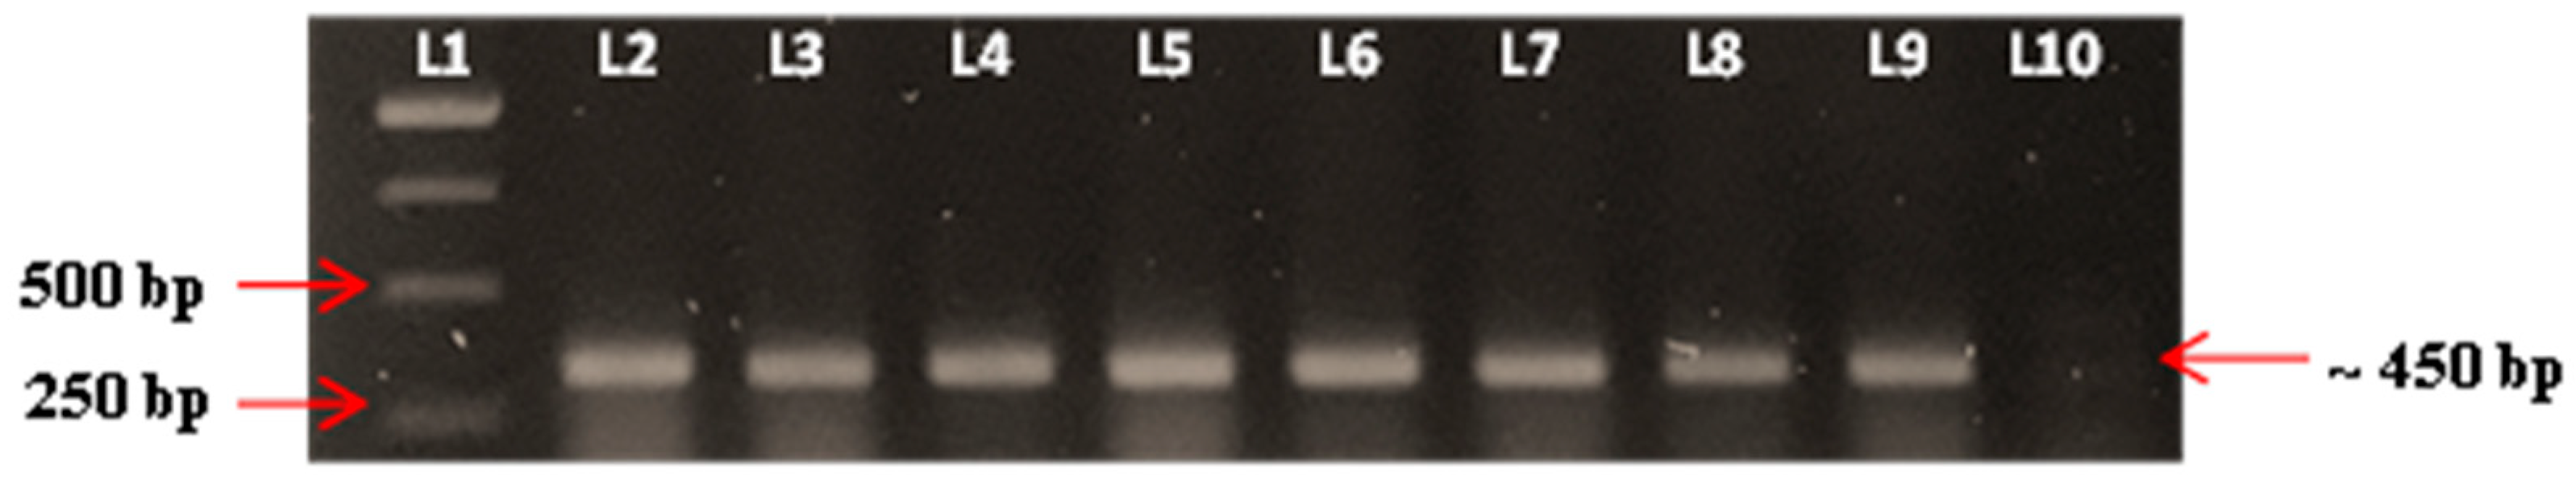
Figure 7.
Confirmations of Vibrio spp. isolated from dead experimental fish by using PCR, gyrB forward and reverse primers. Lane 1: 1 kb DNA ladder marker (Fermentas, Waltham, MA, USA), Lane 2: Positive control (ATCC of V. harveyi), Lane 3–9: Positive colonies of vibrio spp., Lane 10: Negative control.
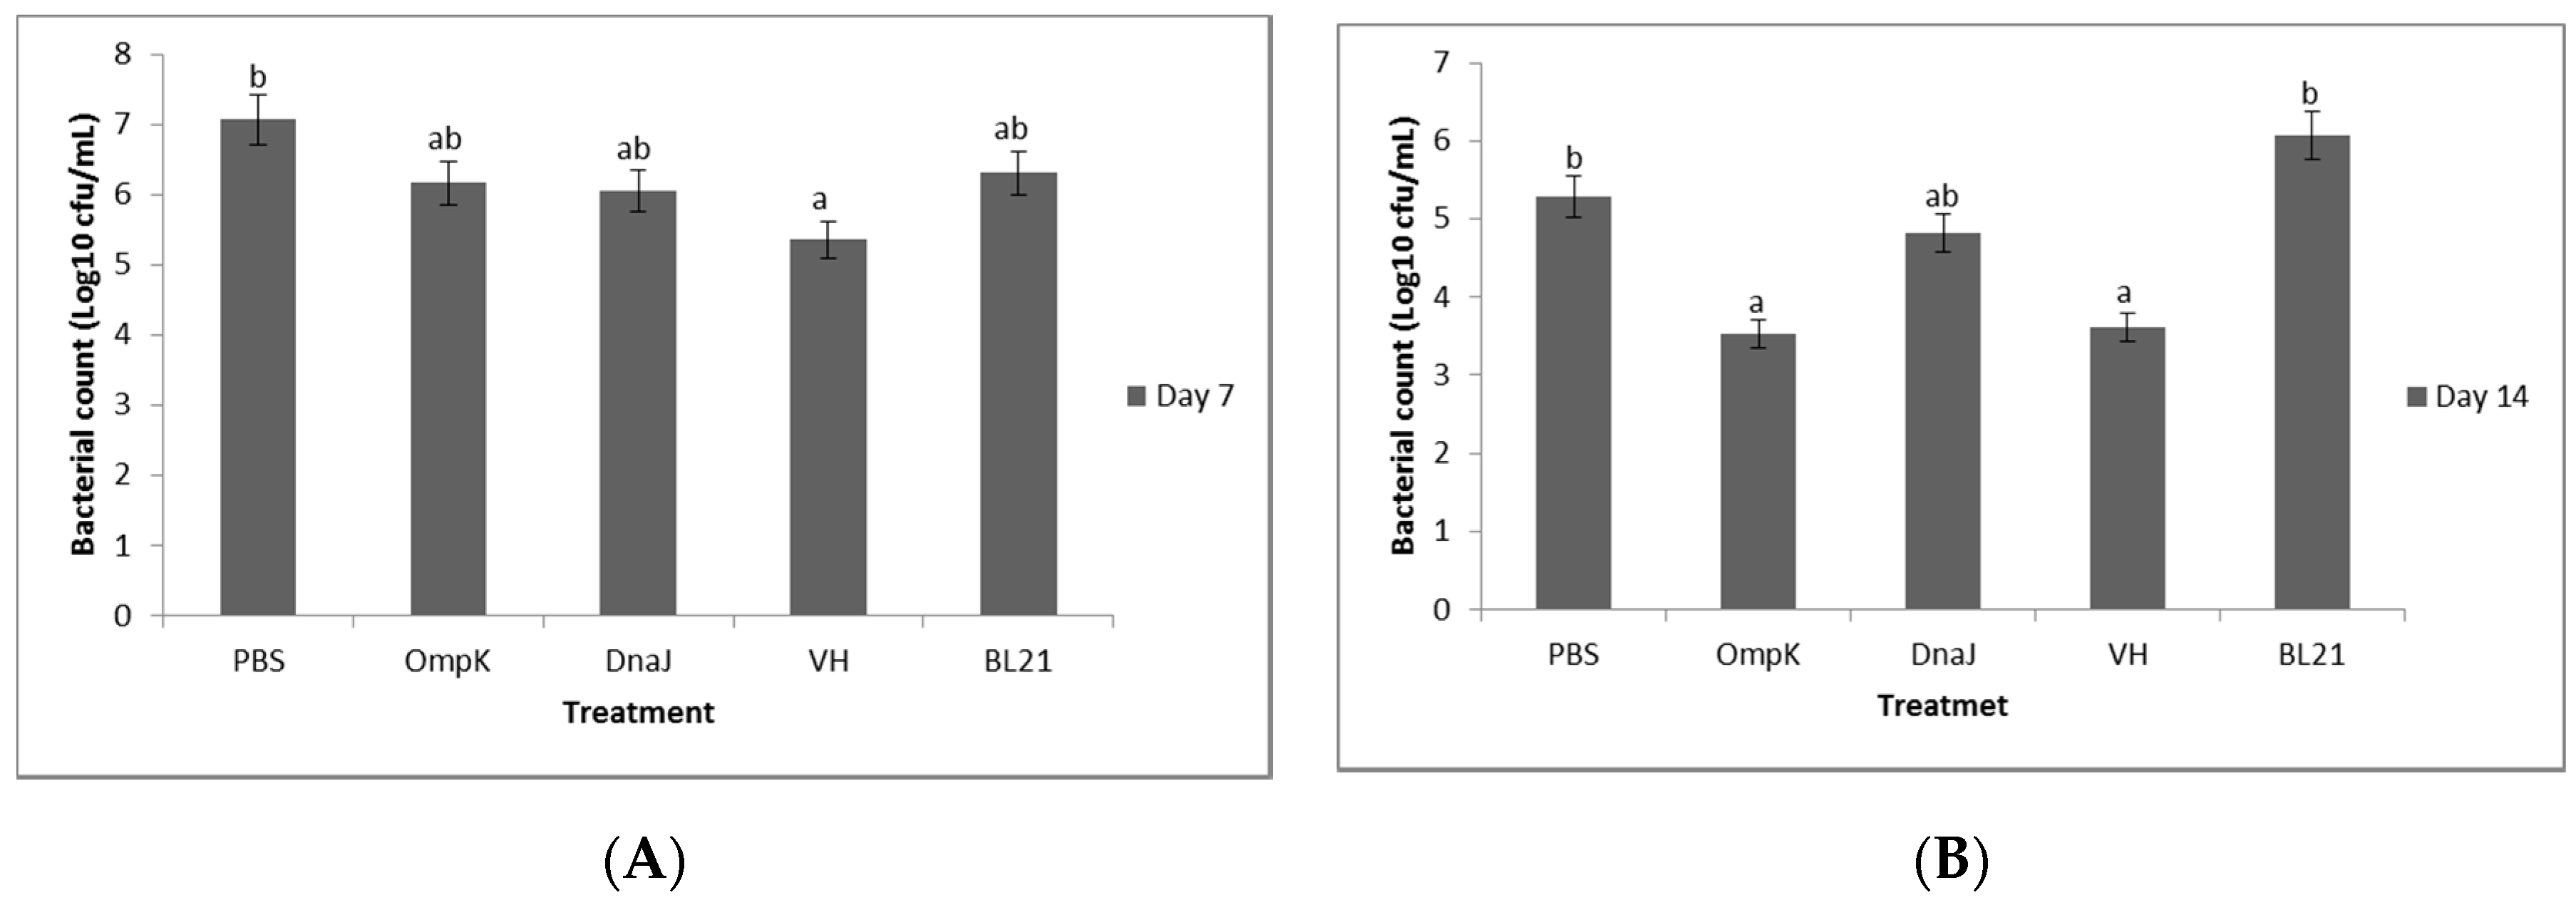
Figure 8.
Bacterial count (cfu/mL) in the serum of non-vaccinated and vaccinated juvenile seabass at (A) days 7 and (B) day 14 post-vaccination. Significant differences are indicated by different letters (p < 0.05).
Figure 8.
Bacterial count (cfu/mL) in the serum of non-vaccinated and vaccinated juvenile seabass at (A) days 7 and (B) day 14 post-vaccination. Significant differences are indicated by different letters (p < 0.05).
Figure 9.
Bacterial count (cfu/mL) in serum of non-vaccinated and vaccinated juvenile seabass at 24, 48, and 72 h post-challenge with (A) V. harveyi, (B) V. parahaemolyticus, and (C) V. alginolyticus. Significant differences are indicated by different letters (p < 0.05).
Figure 9.
Bacterial count (cfu/mL) in serum of non-vaccinated and vaccinated juvenile seabass at 24, 48, and 72 h post-challenge with (A) V. harveyi, (B) V. parahaemolyticus, and (C) V. alginolyticus. Significant differences are indicated by different letters (p < 0.05).
Table 1.
Experimental group for fish vaccination study.
Table 1.
Experimental group for fish vaccination study.
| Treatment Groups | Vaccines | Dosages |
|---|
| Group 1 | Recombinant cell pet32/LIC OmpK vaccine (r-OmpK) | 107 cfu/mL |
| Group 2 | Recombinant cell pet32/LIC DnaJ vaccine (r-DnaJ) | 107 cfu/mL |
| Group 3 | Whole cells-killed V. harveyi vaccine (VH), positive control | 107 cfu/mL |
| Group 4 | BL21 (DE2) vaccine (BL21), negative control | 107 cfu/mL |
| Group 5 | Phosphate buffered saline (PBS), control | 0.01 M |
Table 2.
Recombinant cell vaccine sequences for r-OmpK and r-DnaJ.
Table 2.
Recombinant cell vaccine sequences for r-OmpK and r-DnaJ.
| No. | Vaccines | Forward Primer (5′–3′) | Reverse Primer (5′–3′) | Reference |
|---|
| 1 | r-OmpK | GACGACGACAAGATGCGTAAATCACT | GAGGAGAAGCCCGGTTAGAACTTGTA | Qian et al. [17] |
| 2 | r-DnaJ | GACCACGACAAGATGCATATTTTTGGC | GAGGAGAAGCCCGGTTATTTAAAGCC |
Table 3.
List of genes for quantification of immune related genes in sea bass against vibriosis.
Table 3.
List of genes for quantification of immune related genes in sea bass against vibriosis.
| No. | Genes | Forward Primer (5′–3′) | Reverse Primer (5′–3′) | Reference |
|---|
| 1 | ACTB * | taccaccggtatcgtcatgga | Ccacgctctgtcaggatcttc | Paria et al. [20] |
| 2 | GAPDH * | cgcttcctgcacaaccaact | Gtggcagtgatggcatgaac |
| 3 | TLR-2 | Tctccgtcttggtttcac | Ggtcccacagttgagtatg | Dahai Yang et al. [21] |
| 4 | MHC I | ggctgtttttgccgctct g | Gtggacaggtctggataaag |
| 5 | Myd88 | Aacaacttcgctggataa | Gttactggaatcgcctca |
| 6 | IL-8 | Cttccctccaagcccacag | Gatccgggcattcatgg | Reyes-López et al. [22] |
| 7 | IL-1B | Atctggaggtggtggacaaa | Agggtgctgatgttcaaacc |
| 8 | IL-10 | Cgaccagctcaagagtgatg | Agaggctgcatggtttctgt |
| 9 | CCL4 | Tcctcgtctcactctgtctgt | Gacctgccactgtcttcagc |
Table 4.
Relative percentage survival (RPS) of vaccinated Lates calcarifer at 72 h post infection with multiple pathogenic Vibrio strain.
Table 4.
Relative percentage survival (RPS) of vaccinated Lates calcarifer at 72 h post infection with multiple pathogenic Vibrio strain.
| Challenged Bacteria | V. harveyi (108 CFU/mL) | V. alginolyticus (108 CFU/mL) | V. parahaemolyticus (108 CFU/mL) |
|---|
| Vaccination Treatment | Survival (%) | Mortality (%) | RPS (%) | Survival (%) | Mortality (%) | RPS (%) | Survival (%) | Mortality (%) | RPS (%) |
|---|
| r-OmpK | 87 | 13 | 87 | 100 | 0 | 100 | 100 | 0 | 100 |
| r-DnaJ | 33 | 67 | 33 | 33 | 63 | 23 | 33 | 67 | 17 |
| VH | 93 | 7 | 93 | 100 | 0 | 100 | 100 | 0 | 100 |
| E. coli BL21(DE3) | 0 | 100 | 0 | 0 | 100 | 0 | 0 | 100 | 0 |
| PBS | 0 | 100 | n.a | 13 | 87 | n.a | 20 | 80 | n.a |
Table 5.
Detection of yellow colonies of Vibrio on TCBS agar, isolated from the spleen, intestine, and kidney of fish challenged with V. harveyi, V. alginolyticus, and V. parahaemolyticus.
Table 5.
Detection of yellow colonies of Vibrio on TCBS agar, isolated from the spleen, intestine, and kidney of fish challenged with V. harveyi, V. alginolyticus, and V. parahaemolyticus.
| Treatments | Vibrio harveyi (108 cfu/mL) | Vibrio alginolyticus (108 cfu/mL) | Vibrio parahaemolyticus (108 cfu/mL) |
|---|
| Spleen | Kidney | Intestine | Spleen | Kidney | Intestine | Spleen | Kidney | Intestine |
|---|
| PBS | +++ | +++ | +++ | +++ | +++ | ++ | +++ | + | - |
| r-OmpK | +++ | +++ | - | ++ | - | - | + | - | - |
| r-DnaJ | +++ | +++ | - | ++ | ++ | + | + | - | - |
| VH | ++ | - | - | + | - | - | + | - | - |
| E.coli BL21 (DE3) | +++ | +++ | +++ | +++ | +++ | ++ | ++ | + | + |
Table 6.
Semi-quantitative PCR detected variable amount of V. harveyi, V. parahaemolyticus, and V. alginolyticus from the seawater samples of challenged fish.
Table 6.
Semi-quantitative PCR detected variable amount of V. harveyi, V. parahaemolyticus, and V. alginolyticus from the seawater samples of challenged fish.
| Treatments | V. harveyi | V. alginolyticus | V. parahaemolyticus |
|---|
| 24hpc | 48hpc | 72hpc | 24hpc | 48hpc | 72hpc | 24hpc | 48hpc | 72hpc |
|---|
| +ve control * | +++ | +++ | +++ | +++ | +++ | +++ | +++ | +++ | +++ |
| PBS | ++ | ++ | +++ | +++ | +++ | +++ | + | +++ | +++ |
| r-OmpK | + | ++ | ++ | ++ | ++ | ++ | - | - | ++ |
| r-DnaJ | + | ++ | +++ | ++ | +++ | +++ | - | +++ | +++ |
| VH | + | - | ++ | + | ++ | ++ | - | - | - |
| -ve control * | - | - | - | - | - | - | - | - | - |

 and
and 


