Repeated Leftover Serosurvey of SARS-CoV-2 IgG Antibodies in Greece, May to August 2020
Abstract
:1. Introduction
2. Materials and Methods
2.1. Study Design and Participants
2.2. Laboratory Analysis
2.3. Statistical Analysis
2.4. Weighted Prevalence
2.5. Effective Sample Size
2.6. Ethical Statement
3. Results
4. Discussion
5. Conclusions
Supplementary Materials
Author Contributions
Funding
Institutional Review Board Statement
Informed Consent Statement
Acknowledgments
Conflicts of Interest
References
- Chan, J.F.W.; Yuan, S.; Kok, K.H.; To, K.K.W.; Chu, H.; Yang, J.; Xing, F.; Liu, J.; Yip, C.C.Y.; Poon, R.W.S.; et al. A familial cluster of pneumonia associated with the 2019 novel coronavirus indicating person-to-person transmission: A study of a family cluster. Lancet 2020, 395, 514–523. Available online: https://www.sciencedirect.com/science/article/pii/S0140673620301549 (accessed on 4 March 2021). [CrossRef] [Green Version]
- WHO Director-General’s Opening Remarks at the Media Briefing on COVID-19—11 March 2020. Available online: https://www.who.int/director-general/speeches/detail/who-director-general-s-opening-remarks-at-the-media-briefing-on-covid-19---11-march-2020 (accessed on 4 March 2021).
- Greece: Coronavirus Pandemic Country Profile-Our World in Data. Available online: https://ourworldindata.org/coronavirus/country/greece#what-is-the-cumulative-number-of-confirmed-deaths (accessed on 16 April 2021).
- Policy Responses to the Coronavirus Pandemic-Statistics and Research-Our World in Data. Available online: https://ourworldindata.org/policy-responses-covid (accessed on 4 March 2021).
- Sethuraman, N.; Jeremiah, S.S.; Ryo, A. Interpreting Diagnostic Tests for SARS-CoV-2. JAMA 2020, 323, 2249–2251. [Google Scholar] [CrossRef] [PubMed]
- Self, W.H.; Tenforde, M.W.; Stubblefield, W.B.; Feldstein, L.R.; Steingrub, J.S.; Shapiro, N.I.; Ginde, A.A.; Prekker, M.E.; Brown, S.M.; Peltan, I.D.; et al. Decline in SARS-CoV-2 Antibodies After Mild Infection Among Frontline Health Care Personnel in a Multistate Hospital Network—12 States, April–August 2020. MMWR Morb. Mortal Wkly. Rep. 2020, 69, 1762–1766. [Google Scholar] [CrossRef] [PubMed]
- Buss, L.F.; Prete, C.A.; Abrahim, C.M.; Mendrone, A.; Salomon, T.; de Almeida-Neto, C.; França, R.F.; Belotti, M.C.; Carvalho, M.P.; Costa, A.G.; et al. Three-quarters attack rate of SARS-CoV-2 in the Brazilian Amazon during a largely unmitigated epidemic. Science 2021, 371, 288–292. Available online: http://science.sciencemag.org/content/371/6526/288.abstract (accessed on 4 March 2021). [CrossRef] [PubMed]
- Bogogiannidou, Z.; Vontas, A.; Dadouli, K.; Kyritsi, M.A.; Soteriades, S.; Nikoulis, D.J.; Mouchtouri, V.A.; Koureas, M.; Kazakos, E.I.; Spanos, E.G.; et al. Repeated leftover serosurvey of SARS-CoV-2 IgG antibodies, Greece, March and April 2020. Eurosurveillance 2020, 25, 1–6. [Google Scholar] [CrossRef] [PubMed]
- Nardone, A.; Miller, E. Serological surveillance of rubella in Europe: European Sero-Epidemiology Network (ESEN2). Eurosurveilllance 2004, 9, 5–7. [Google Scholar] [CrossRef] [PubMed]
- Naing, N.N. Easy way to learn standardization: Direct and indirect methods. Malays. J. Med. Sci. 2000, 7, 10–15. [Google Scholar] [PubMed]
- Bendavid, E.; Mulaney, B.; Sood, N.; Shah, S.; Ling, E.; Bromley-Dulfano, R.; Lai, C.; Weissberg, Z.; Saavedra-Walker, R.; Tedrow, J.; et al. COVID-19 Antibody Seroprevalence in Santa Clara County, California. MedRxiv 2020. Available online: http://medrxiv.org/content/early/2020/04/30/2020.04.14.20062463.abstract (accessed on 4 March 2021). [CrossRef]
- Diggle, P.J. Estimating Prevalence Using an Imperfect Test. Epidemiol. Res. Int. 2011, 2011, 608719. [Google Scholar] [CrossRef] [Green Version]
- Campbell, I. Chi-squared and Fisher-Irwin tests of two-by-two tables with small sample recommendations. Stat. Med. 2007, 26, 3661–3675. Available online: https://pubmed.ncbi.nlm.nih.gov/17315184/ (accessed on 4 March 2021). [CrossRef]
- Moshe, M.; Brown, J.C.; Flower, B.; Daunt, A.; Ward, H.; Elliott, P. Declining prevalence of antibody positivity to SARS-CoV-2: A community study of 365,000 adults. MedRxiv 2020. [Google Scholar] [CrossRef]
- Hansen, C.B.; Jarlhelt, I.; Pérez-Alós, L.; Landsy, L.H.; Loftager, M.; Rosbjerg, A.; Helgstrand, C.; Bjelke, J.R.; Egebjerg, T.; Jardine, J.G.; et al. SARS-CoV-2 Antibody Responses Are Correlated to Disease Severity in COVID-19 Convalescent Individuals. J. Immunol. 2021, 206, 109–117. Available online: http://www.jimmunol.org/content/206/1/109.abstract (accessed on 4 March 2021). [CrossRef] [PubMed]
- To, K.K.W.; Hung, I.F.N.; Ip, J.D.; Chu, A.W.H.; Chan, W.M.; Tam, A.R.; Fong, C.H.Y.; Yuan, S.; Tsoi, H.W.; Ng, A.C.K.; et al. COVID-19 re-infection by a phylogenetically distinct SARS-coronavirus-2 strain confirmed by whole genome sequencing. Clin. Infect. Dis. 2020, ciaa1275. Available online: https://pubmed.ncbi.nlm.nih.gov/32840608 (accessed on 4 March 2021).
- Bajema, K.L.; Wiegand, R.E.; Cuffe, K.; Patel, S.V.; Iachan, R.; Lim, T.; Lee, A.; Moyse, D.; Havers, F.P.; Harding, L.; et al. Estimated SARS-CoV-2 Seroprevalence in the US as of September 2020. JAMA Intern. Med. 2020, 181, 450–460. [Google Scholar] [CrossRef]
- Rostami, A.; Sepidarkish, M.; Leeflang, M.; Riahi, S.M.; Shiadeh, M.N.; Esfandyari, S.; Mokdad, A.H.; Hotez, P.J.; Gasser, R.B. SARS-CoV-2 seroprevalence worldwide: A systematic review and meta-analysis. Clin. Microbiol. Infect. 2020, 27, 331–340. [Google Scholar] [CrossRef] [PubMed]


| May | Positive/Sample Size | S1: Crude Prevalence | S2: Age, Sex and Population-Adjusted Prevalence | S3: S2 + Adjustment for Sensitivity and Specificity | S4: S3 + NPHO Data 1 | |||||
|---|---|---|---|---|---|---|---|---|---|---|
| n/N | Prevalence (%) | 95% CI 2 | Prevalence (%) | 95% CI | Prevalence (%) | 95% CI | Prevalence (%) | 95% CI | ||
| Total | 25/5718 | 0.44 | 0.27–0.61 | 0.59 | 0.28–0.89 | 0.35 | 0–0.71 | 0.35 | 0–0.71 | |
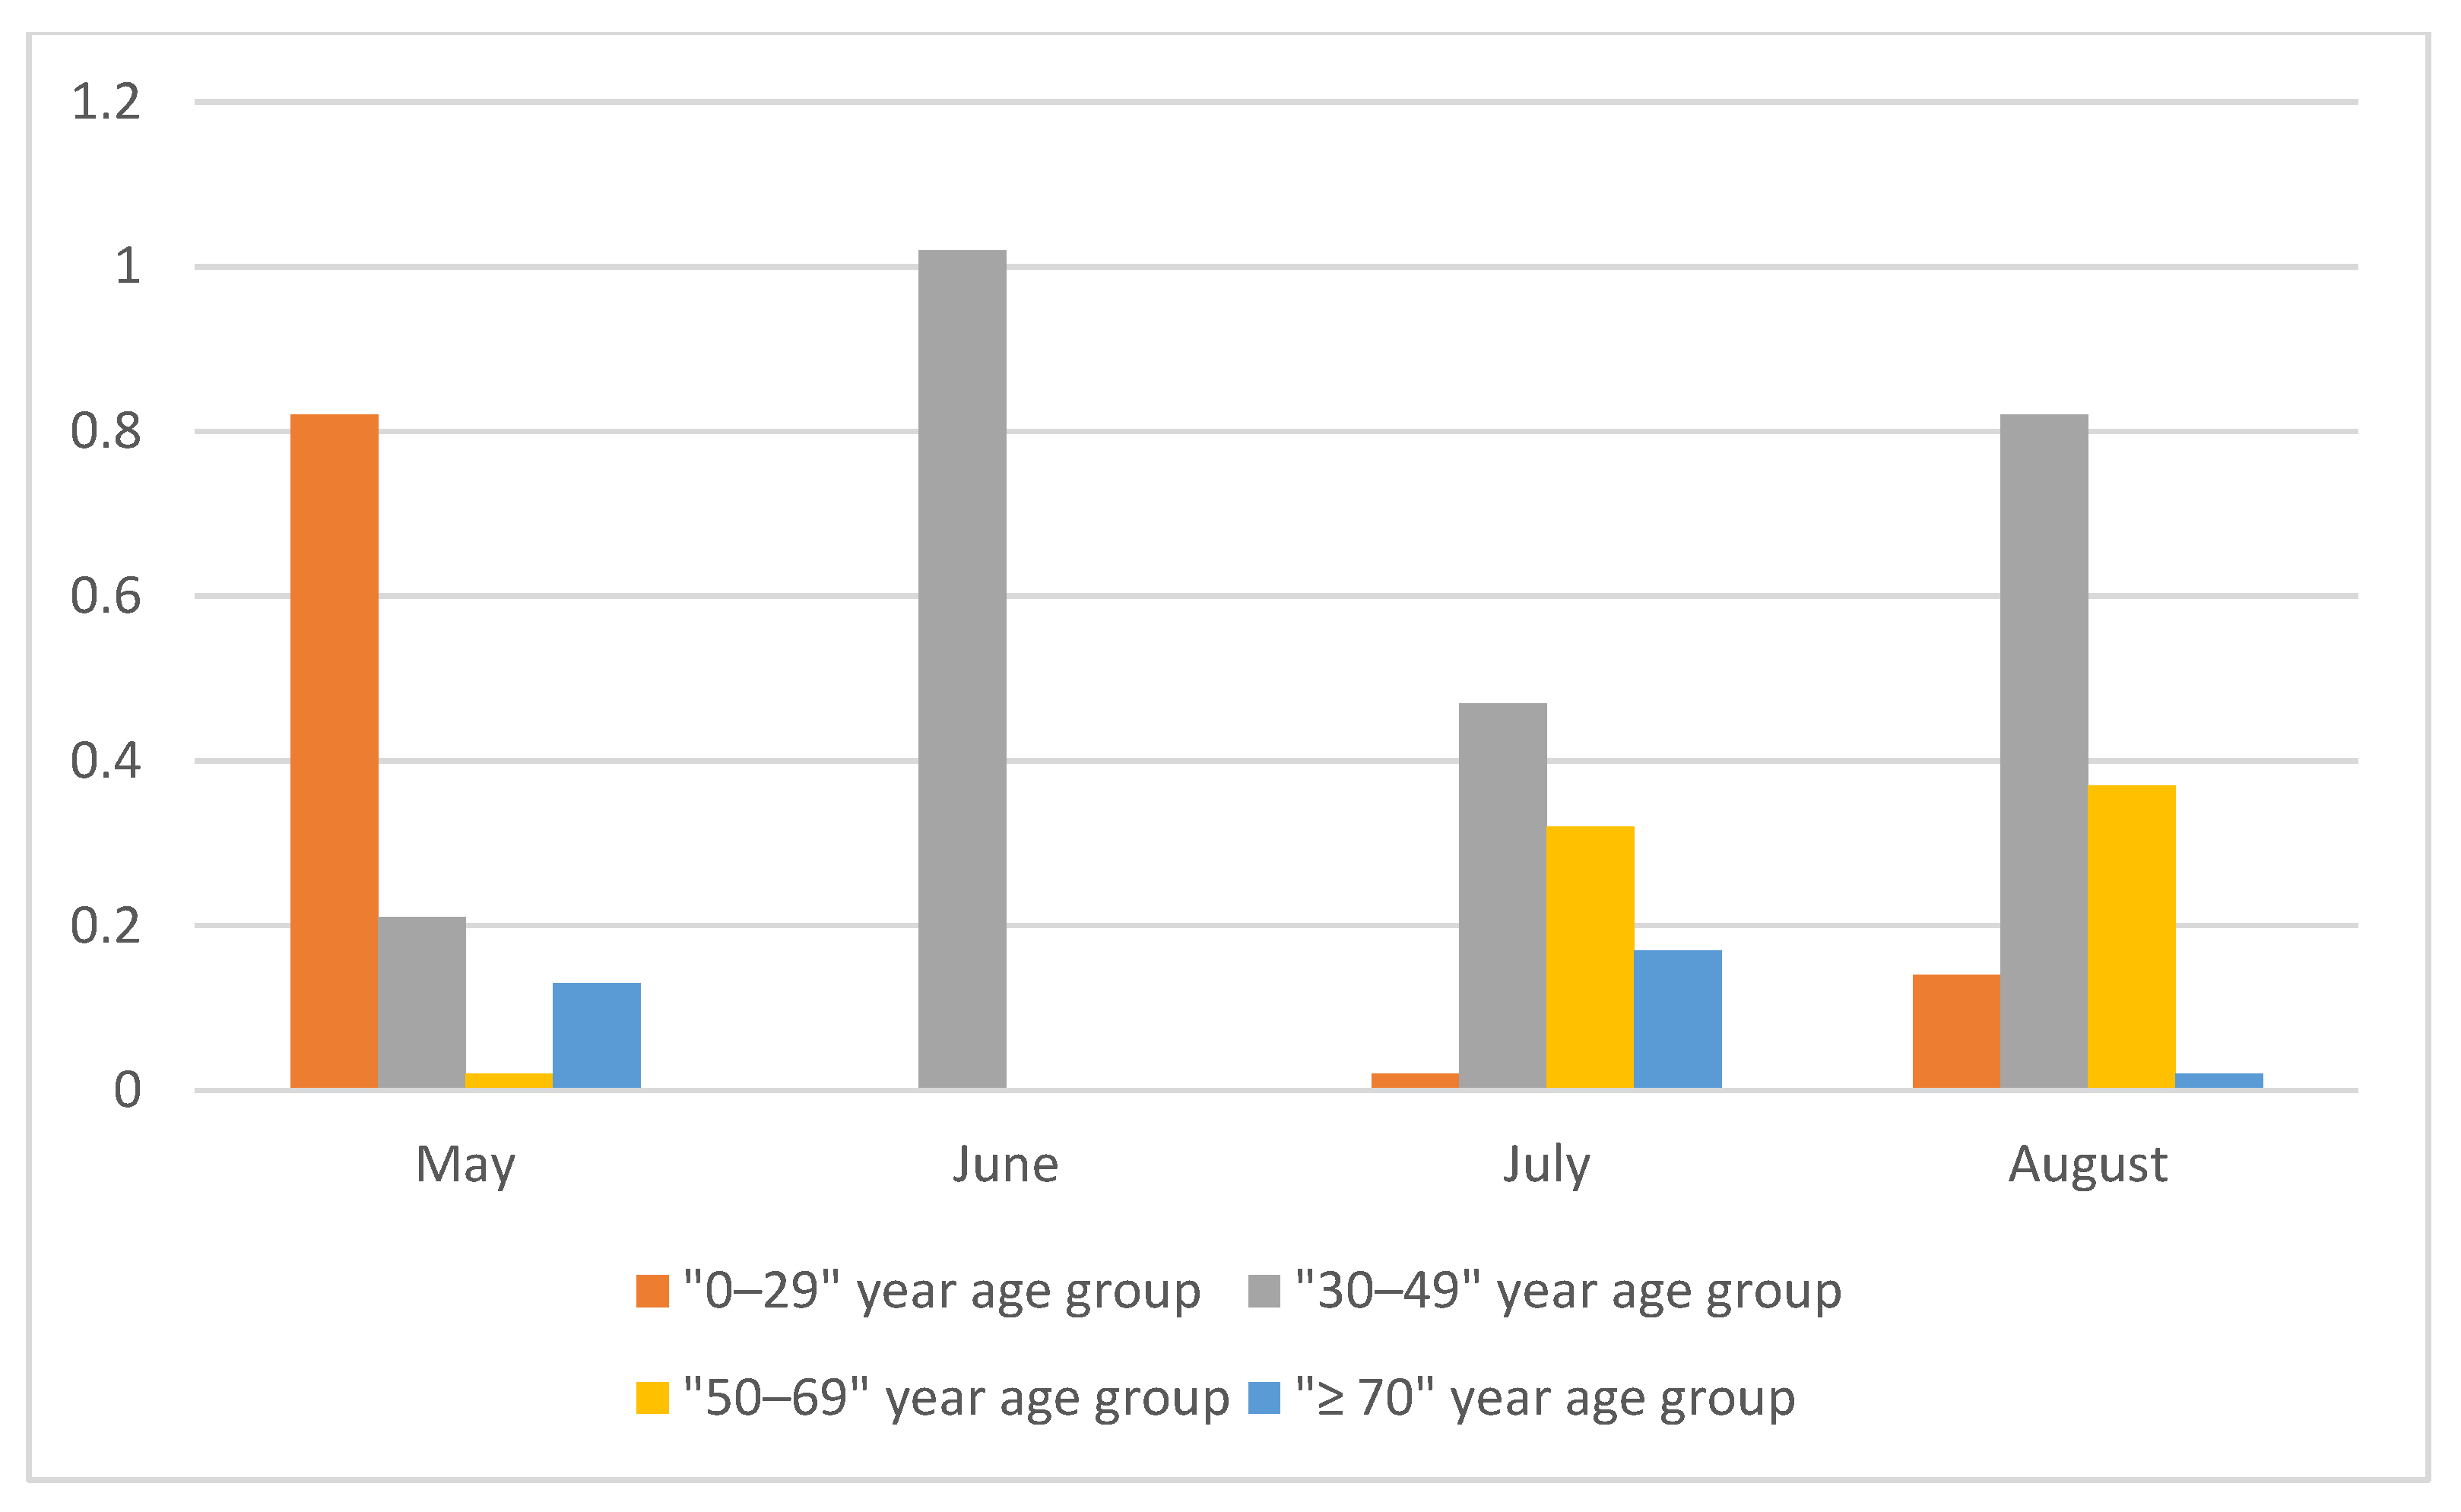
| Age group (years) | 0–29 | 7/1181 | 0.59 | 0.15–1.03 | 0.98 | 0–2.05 | 0.82 | 0–2.09 | 0.82 | 0–2.09 |
| 30–49 | 9/1657 | 0.54 | 0.19–0.90 | 0.47 | 0–0.97 | 0.21 | 0–0.80 | 0.21 | 0–0.80 | |
| 50–69 | 5/1608 | 0.31 | 0.04–0.58 | 0.31 | 0–0.72 | 0.02 | 0–0.50 | 0.02 | 0–0.50 | |
| ≥70 | 4/1272 | 0.31 | 0.01–0.62 | 0.41 | 0–1.03 | 0.13 | 0–0.87 | 0.13 | 0–0.87 | |
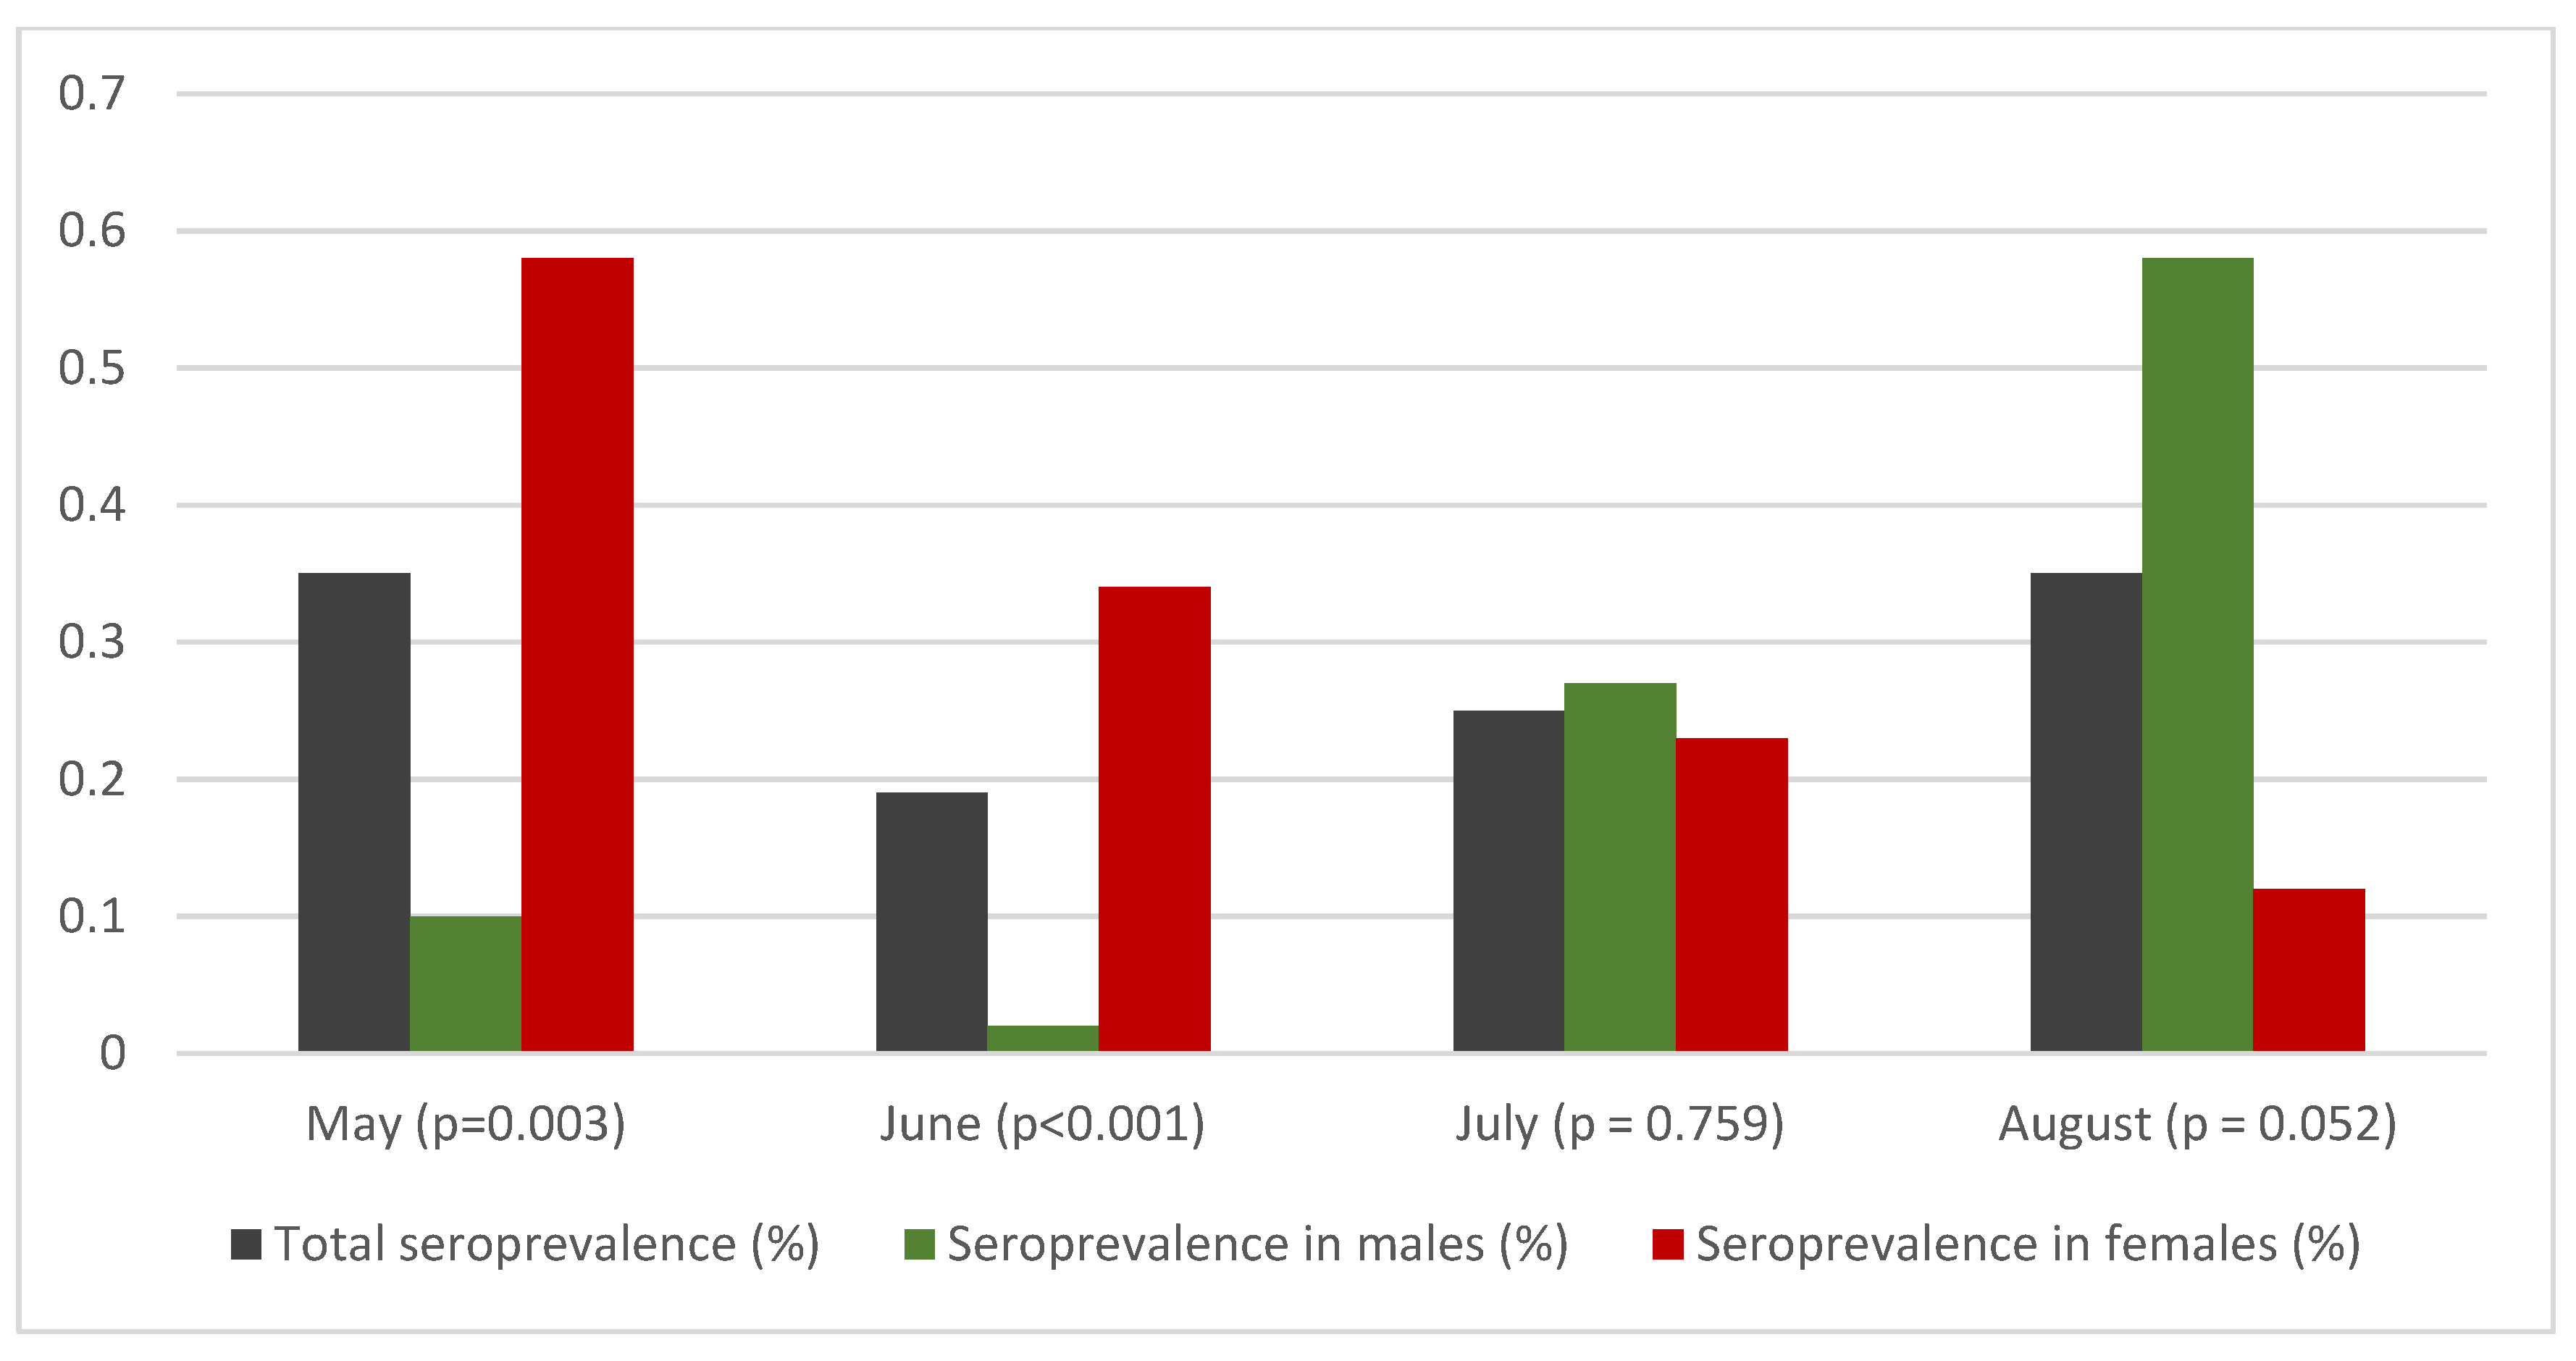
| Sex | Male | 8/2428 | 0.33 | 0.10–0.56 | 0.39 | 0–0.81 | 0.10 | 0–0.61 | 0.10 | 0–0.87 |
| Female | 17/3290 | 0.52 | 0.27–0.76 | 0.78 | 0.33–1.23 | 0.58 | 0.04–1.12 | 0.58 | 0.04–1.12 | |
|
‘Ν-1’ chi-squared test Difference between sex | Difference = 0.19% p = 0.283 | Difference = 0.39% p = 0.062 | Difference = 0.48% p = 0.003 | Difference = 0.48% p = 0.003 | ||||||
| Large urban areas | 7/1372 | 0.51 | 0.13–0.89 | 0.69 | 0.25–1.14 | 0.47 | 0–1.00 | 0.47 | 0–1.00 | |
| Rest of country | 16/4346 | 0.41 | 0.22–0.61 | 0.43 | 0.04–0.82 | 0.16 | 0–0.62 | 0.16 | 0–0.62 | |
|
‘Ν-1’ chi-squared test Difference between large urban areas and rest of country | Difference = 0.10% p = 0.623 | Difference = 0.26% p = 0.230 | Difference = 0.31% p = 0.039 | Difference = 0.31% p = 0.039 | ||||||
| CFR (%) | 95% CI | IFR according to | ||||||||
| S1 | S2 | S3 | S4 | |||||||
| IFR (%) | 95% CI | IFR (%) | 95% CI | IFR (%) | 95% CI | IFR (%) | 95% CI | |||
| 10.74 | 9.11–12.37 | 0.08 | 0.06–0.13 | 0.06 | 0.04–0.12 | 0.10 | 0.05–NA 3 | 0.10 | 0.05–NA | |
| June | Positive/Sample Size | S1: Crude Prevalence | S2: Age, Sex and Population-Adjusted Prevalence | S3: S2 + Adjustment for Sensitivity and Specificity | S4: S3 + NPHO Data 1 | |||||
|---|---|---|---|---|---|---|---|---|---|---|
| n/N | Prevalence (%) | 95% CI | Prevalence (%) | 95% CI | Prevalence (%) | 95% CI | Prevalence (%) | 95% CI | ||
| Total | 23/6135 | 0.37 | 0.22–0.53 | 0.46 | 0.17–0.74 | 0.19 | 0–0.53 | 0.19 | 0–0.53 | |
| Age group (years) | 0–29 | 4/1366 | 0.29 | 0.01–0.58 | 0.22 | 0–0.64 | 0 | 0–0.40 | 0 | 0–0.40 |
| 30–49 | 10/1885 | 0.53 | 0.20–0.86 | 1.16 | 0.32–1.99 | 1.02 | 0.02–2.02 | 1.02 | 0.02–2.02 | |
| 50–69 | 6/1625 | 0.37 | 0.07–0.66 | 0.13 | 0–0.45 | 0 | 0–0.18 | 0 | 0–0.18 | |
| ≥70 | 3/1259 | 0.24 | 0–0.51 | 0.04 | 0–0.28 | 0 | 0–0.01 | 0 | 0–0.01 | |
| Sex | Male | 12/2785 | 0.43 | 0.19–0.67 | 0.31 | 0–0.67 | 0.02 | 0–0.44 | 0.02 | 0–0.44 |
| Female | 11/3350 | 0.33 | 0.13–0.52 | 0.59 | 0.13–1.04 | 0.34 | 0–0.88 | 0.34 | 0–0.88 | |
| ‘Ν-1’ chi-squared test Difference between sex | Difference = 0.17% p = 0.366 | Difference = 0.54% p < 0.001 | Difference = 0.46% p < 0.001 | Difference = 0.46% p < 0.001 | ||||||
| Large urban areas | 7/1375 | 0.51 | 0.13–0.89 | 0.68 | 0.19–1.18 | 0.46 | 0–1.05 | 0.46 | 0–1.05 | |
| Rest of country | 16/4760 | 0.34 | 0.17–0.50 | 0.14 | 0–0.36 | 0 | 0–0.07 | 0 | 0–0.07 | |
| ‘Ν-1’ chi-squared test Difference between large urban areas and rest of country | Difference = 0.17% p = 0.366 | Difference = 0.54% p < 0.001 | Difference = 0.46% p < 0.001 | Difference = 0.46% p < 0.001 | ||||||
| CFR (%) | 95% CI | IFR according to | ||||||||
| S1 | S2 | S3 | S4 | |||||||
| IFR (%) | 95% CI | IFR (%) | 95% CI | IFR (%) | 95% CI | IFR (%) | 95% CI | |||
| 4.51 | 3.42–5.60 | 0.04 | 0.03–0.07 | 0.04 | 0.02–0.10 | 0.09 | 0.03–NA | 0.09 | 0.03–NA | |
| July | Positive/Sample Size | S1: Crude Prevalence | S2: Age, Sex and Population-Adjusted Prevalence | S3: S2 + Adjustment for Sensitivity and Specificity | S4: S3 + NPHO Data 1 | |||||
|---|---|---|---|---|---|---|---|---|---|---|
| n/N | Prevalence (%) | 95% CI | Prevalence (%) | 95% CI | Prevalence (%) | 95% CI | Prevalence (%) | 95% CI | ||
| Total | 29/5959 | 0.49 | 0.31–0.66 | 0.50 | 0.24–0.76 | 0.24 | 0–0.55 | 0.25 | 0.01-056 | |
| Age group (years) | 0–29 | 6/1221 | 0.49 | 0.10–0.88 | 0.32 | 0–0.74 | 0.02 | 0–0.52 | 0.02 | 0–0.52 |
| 30–49 | 8/1645 | 0.49 | 0.15–0.82 | 0.69 | 0.13–1.25 | 0.46 | 0–1.13 | 0.47 | 0.01–1.14 | |
| 50–69 | 9/1586 | 0.57 | 0.20–0.94 | 0.56 | 0.03–1.09 | 0.31 | 0–0.95 | 0.32 | 0.01–0.96 | |
| ≥70 | 6/1507 | 0.40 | 0.08–0.72 | 0.44 | 0–1.01 | 0.16 | 0–0.84 | 0.17 | 0.01–0.85 | |
| Sex | Male | 17/2442 | 0.70 | 0.37–1.03 | 0.52 | 0.11–0.93 | 0.26 | 0–0.75 | 0.27 | 0.01–0.76 |
| Female | 12/3517 | 0.34 | 0.15–0.53 | 0.48 | 0.15–0.82 | 0.22 | 0–0.62 | 0.23 | 0.01–0.63 | |
| ‘Ν-1’ chi-squared test Difference between sex | Difference = 0.36% p = 0.050 | Difference = 0.04% p = 0.829 | Difference = 0.04% p = 0.755 | Difference = 0.04% p = 0.759 | ||||||
| Large urban areas | 10/1593 | 0.63 | 0.24–1.02 | 0.53 | 0.15–0.91 | 0.28 | 0–0.73 | 0.29 | 0.01–0.74 | |
| Rest of country | 19/4366 | 0.44 | 0.24–0.63 | 0.47 | 0.13–0.81 | 0.20 | 0–0.61 | 0.21 | 0.01–0.62 | |
| ‘Ν-1’ chi-squared test Difference between large urban areas and rest of country | Difference = 0.19% p = 0.353 | Difference = 0.06% p = 0.768 | Difference = 0.08% p = 0.561 | Difference = 0.08% p = 0.570 | ||||||
| CFR (%) | 95% CI | IFR according to | ||||||||
| S1 | S2 | S3 | S4 | |||||||
| IFR (%) | 95% CI | IFR (%) | 95% CI | IFR (%) | 95% CI | IFR (%) | 95% CI | |||
| 2.00 | 1.26–0.38 | 0.03 | 0.02–0.04 | 0.03 | 0.02–0.06 | 0.06 | 0.02–NA | 0.05 | 0.02–1.36 | |
| August | Positive/Sample Size | S1: Crude Prevalence | S2: Age, Sex and Population-Adjusted Prevalence | S3: S2 + Adjustment for Sensitivity and Specificity | S4: S3 + NPHO Data 1 | |||||
|---|---|---|---|---|---|---|---|---|---|---|
| n/N | Prevalence (%) | 95% CI | Prevalence (%) | 95% CI | Prevalence (%) | 95% CI | Prevalence (%) | 95% CI | ||
| Total | 12/2298 | 0.52 | 0.23–0.82 | 0.55 | 0.25–0.86 | 0.30 | 0–0.66 | 0.35 | 0.05–0.71 | |
| Age group (years) | 0–29 | 2/607 | 0.33 | 0–0.79 | 0.37 | 0–0.86 | 0.09 | 0–0.67 | 0.14 | 0.05–0.72 |
| 30–49 | 6/770 | 0.78 | 0.16–1.40 | 0.84 | 0.20–1.49 | 0.65 | 0–1.42 | 0.82 | 0.17–1.59 | |
| 50–69 | 3/509 | 0.59 | 0–1.25 | 0.58 | 0–1.29 | 0.33 | 0–1.12 | 0.37 | 0.04–1.16 | |
| ≥70 | 1/412 | 0.24 | 0–0.72 | 0.27 | 0–0.77 | 0.00 | 0–0.56 | 0.02 | 0–0.58 | |
| Sex | Male | 7/974 | 0.72 | 0.19–1.25 | 0.74 | 0.20–1.28 | 0.53 | 0–1.17 | 0.58 | 0.05–1.22 |
| Female | 5/1324 | 0.38 | 0.05–0.71 | 0.36 | 0.04–0.68 | 0.07 | 0–0.46 | 0.12 | 0.05–0.51 | |
| ‘Ν-1’ chi-squared test Difference between sex | Difference = 0.34% p = 0.265 | Difference = 0.38% p = 0.211 | Difference = 0.46% p = 0.034 | Difference = 0.46% p = 0.052 | ||||||
| CFR (%) | 95% CI | IFR according to | ||||||||
| S1 | S2 | S3 | S4 | |||||||
| IFR (%) | 95% CI | IFR (%) | 95% CI | IFR (%) | 95% CI | IFR (%) | 95% CI | |||
| 1.14 | 0.58–1.70 | 0.11 | 0.07–0.26 | 0.11 | 0.07–0.23 | 0.19 | 0.09–NA | 0.17 | 0.08–1.16 | |
| May–August | Positive/ Sample Size | S1: Crude Prevalence | S2: Age, Sex and Population-Adjusted Prevalence | S3: S2 + ;Adjustment for Sensitivity and Specificity | S4: S3 + NPHO Data | ||||
|---|---|---|---|---|---|---|---|---|---|
| n/N | Prevalence (%) | 95% CI | Prevalence (%) | 95% CI | Prevalence (%) | 95% CI | Prevalence (%) | 95% CI | |
| Total | 89/20,110 | 0.44 | 0.35–0.53 | 0.46 | 0.37–0.55 | 0.19 | 0.08–0.30 | 0.26 | 0.15–0.37 |
| CFR (%) | 95% CI | IFR according to | |||||||
| S1 | S2 | S3 | S4 | ||||||
| IFR (%) | 95% CI | IFR (%) | 95% CI | IFR (%) | 95% CI | IFR (%) | 95% CI | ||
| 1.89 | 1.56–2.21 | 0.28 | 0.23–0.35 | 0.27 | 0.22–0.33 | 0.63 | 0.40–1.51 | 0.47 | 0.33–0.84 |
Publisher’s Note: MDPI stays neutral with regard to jurisdictional claims in published maps and institutional affiliations. |
© 2021 by the authors. Licensee MDPI, Basel, Switzerland. This article is an open access article distributed under the terms and conditions of the Creative Commons Attribution (CC BY) license (https://creativecommons.org/licenses/by/4.0/).
Share and Cite
Bogogiannidou, Z.; Speletas, M.; Vontas, A.; Nikoulis, D.J.; Dadouli, K.; Kyritsi, M.A.; Mouchtouri, V.A.; Mina, P.; Anagnostopoulos, L.; Koureas, M.; et al. Repeated Leftover Serosurvey of SARS-CoV-2 IgG Antibodies in Greece, May to August 2020. Vaccines 2021, 9, 504. https://doi.org/10.3390/vaccines9050504
Bogogiannidou Z, Speletas M, Vontas A, Nikoulis DJ, Dadouli K, Kyritsi MA, Mouchtouri VA, Mina P, Anagnostopoulos L, Koureas M, et al. Repeated Leftover Serosurvey of SARS-CoV-2 IgG Antibodies in Greece, May to August 2020. Vaccines. 2021; 9(5):504. https://doi.org/10.3390/vaccines9050504
Chicago/Turabian StyleBogogiannidou, Zacharoula, Matthaios Speletas, Alexandros Vontas, Dimitrios J. Nikoulis, Katerina Dadouli, Maria A. Kyritsi, Varvara A. Mouchtouri, Paraskevi Mina, Lemonia Anagnostopoulos, Michalis Koureas, and et al. 2021. "Repeated Leftover Serosurvey of SARS-CoV-2 IgG Antibodies in Greece, May to August 2020" Vaccines 9, no. 5: 504. https://doi.org/10.3390/vaccines9050504
APA StyleBogogiannidou, Z., Speletas, M., Vontas, A., Nikoulis, D. J., Dadouli, K., Kyritsi, M. A., Mouchtouri, V. A., Mina, P., Anagnostopoulos, L., Koureas, M., Karavasilis, V., Nikou, O., Pinaka, O., Thomaidis, P. C., Kadoglou, K., Bedevis, K., Spyrou, N., Eleftheriou, A. A., Papaevangelou, V., ... Hadjichristodoulou, C. (2021). Repeated Leftover Serosurvey of SARS-CoV-2 IgG Antibodies in Greece, May to August 2020. Vaccines, 9(5), 504. https://doi.org/10.3390/vaccines9050504


