
Study of Acid Whey Fouling after Protein Isolation Using Nanofiltration


Abstract
:1. Introduction
2. Materials and Methods
2.1. Zeta Potential Measurements
2.2. Nonlinear Regression
3. Results and Discussion
3.1. Physico-Chemical Analyses
3.2. Membrane Fouling Study
3.2.1. Zeta Potential
3.2.2. Membrane Flux Measurements
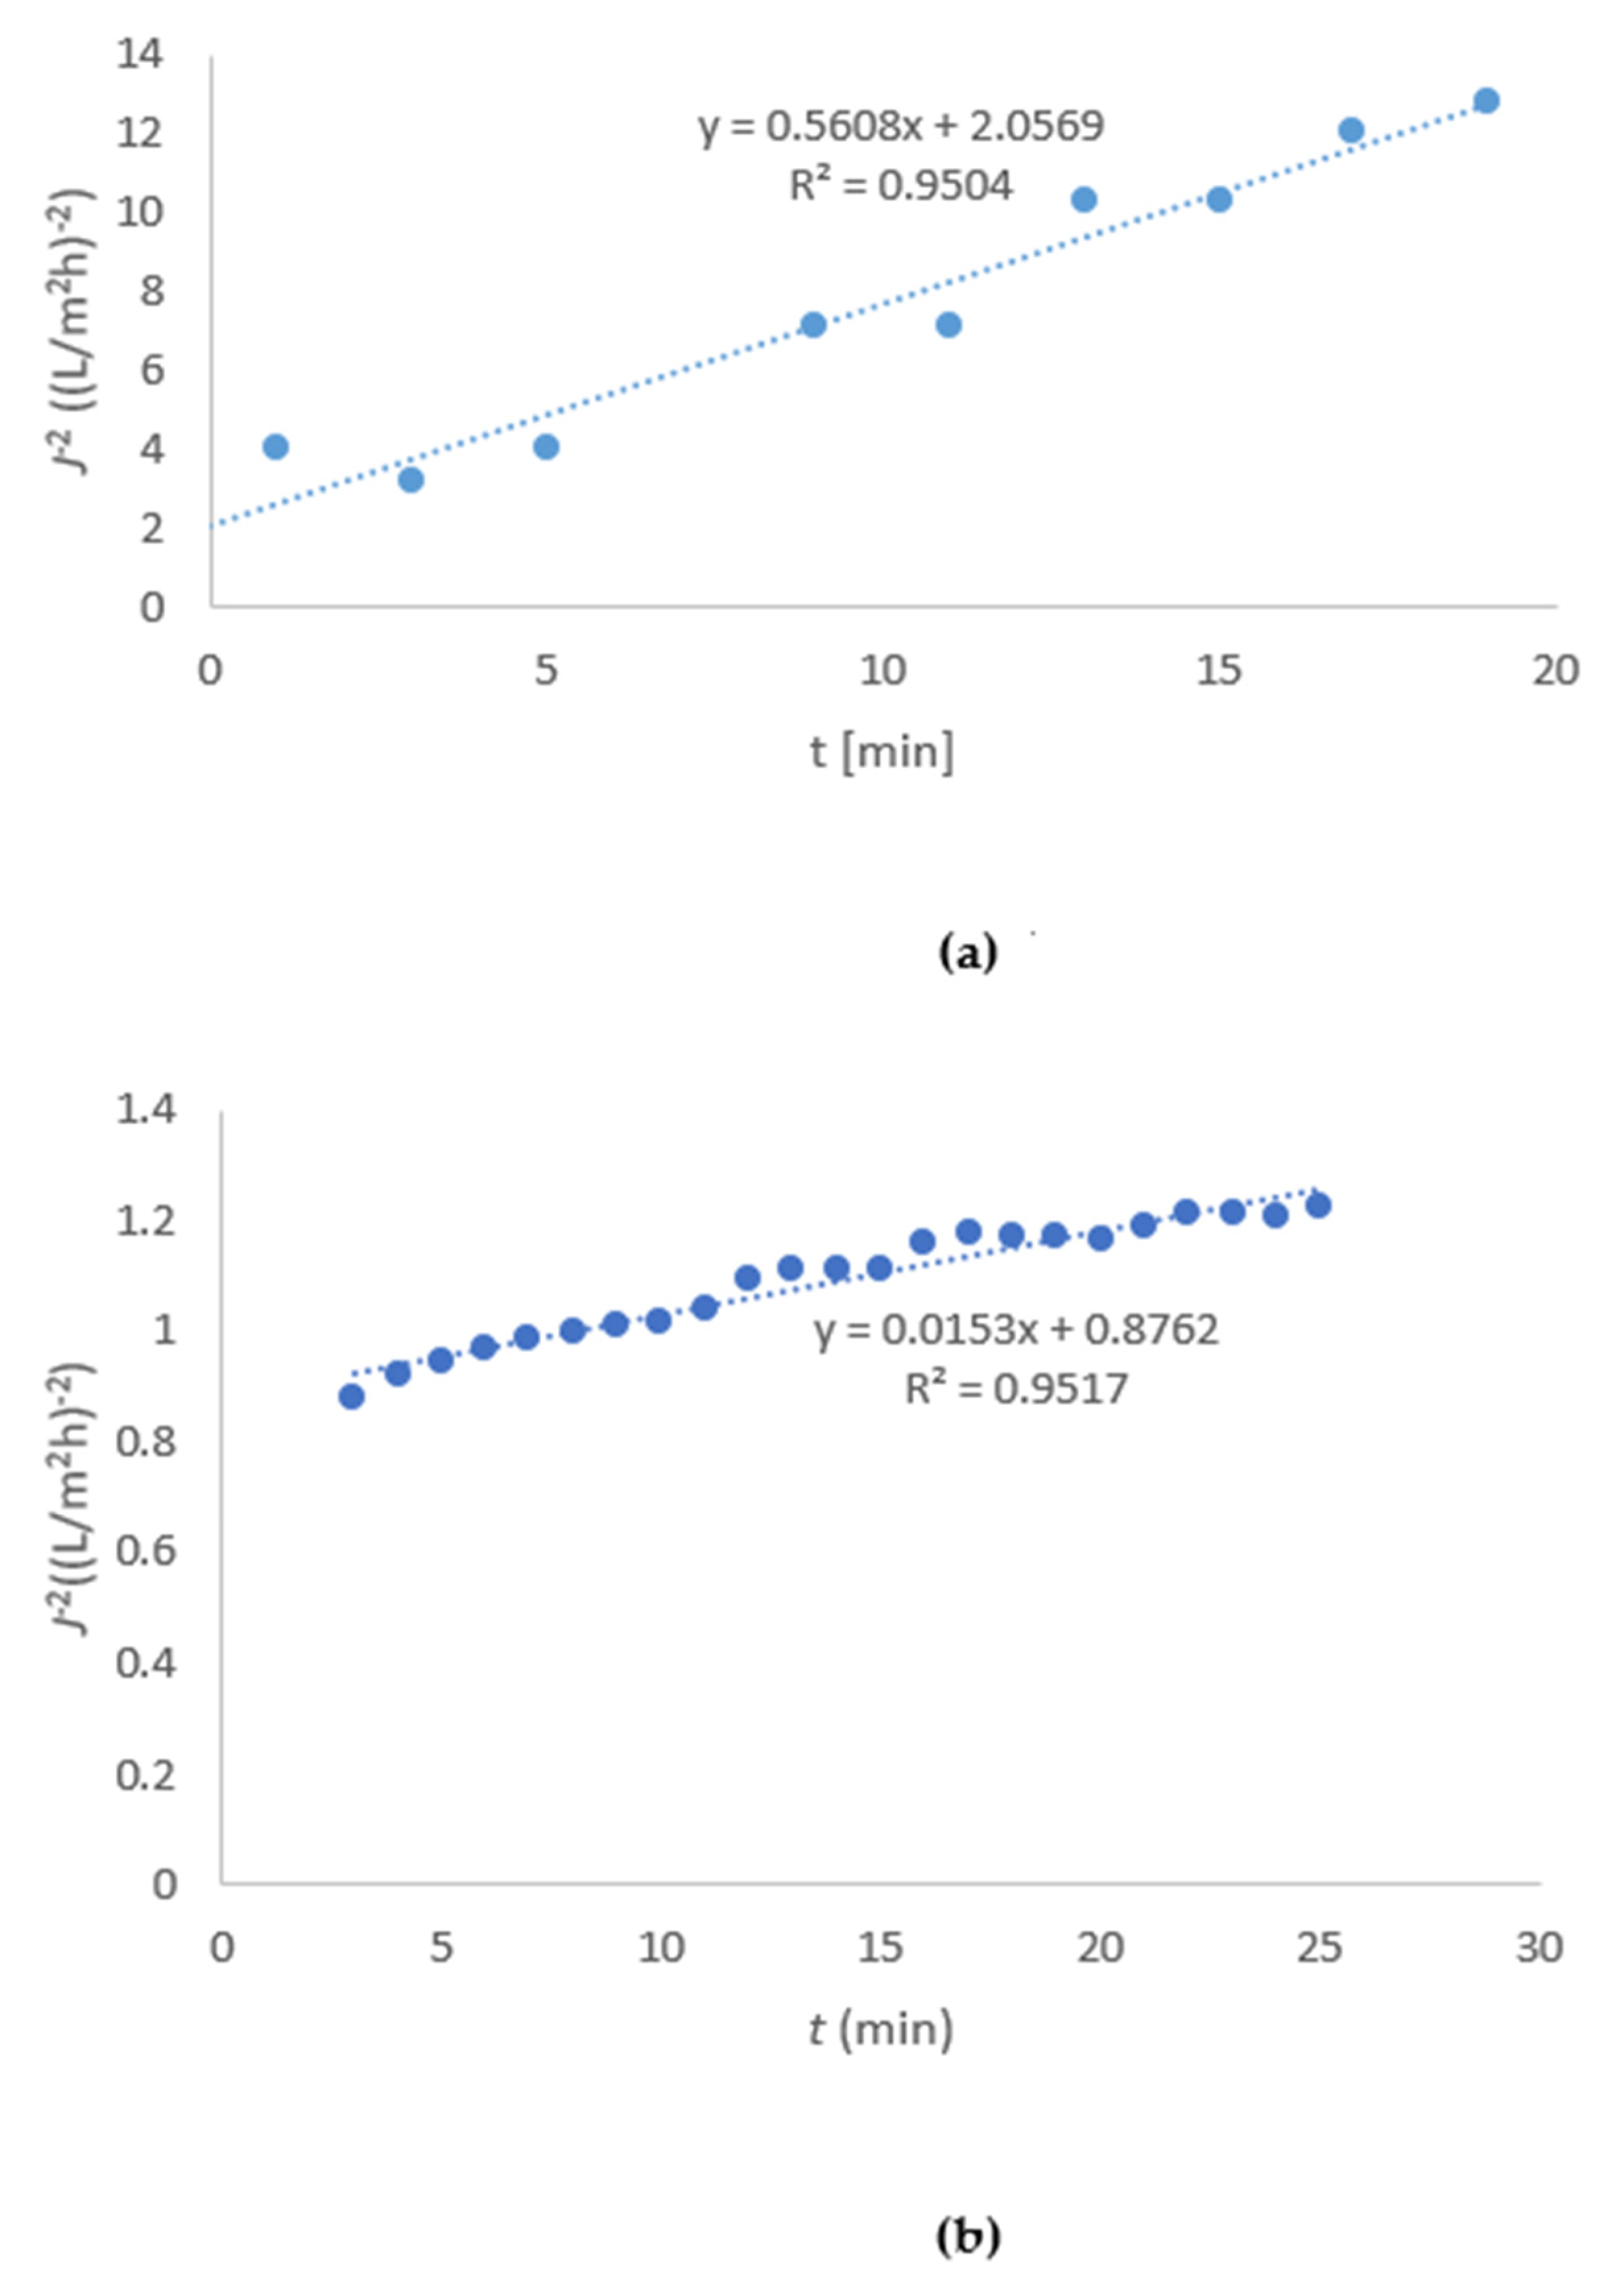
3.2.3. Membrane Fouling Studies and Modeling
4. Conclusions
Author Contributions
Funding
Institutional Review Board Statement
Informed Consent Statement
Data Availability Statement
Acknowledgments
Conflicts of Interest
References
- Chandrapala, J.; Duke, M.C.; Gray, S.R.; Weeks, M.; Palmer, M.; Vasiljevic, T. Nanofiltration and nanodiafiltration of acid whey as a function of pH and temperature, Sep. Purif. Technol. 2016, 160, 18–27. [Google Scholar] [CrossRef]
- de Souza, R.R.; Bergamasco, R.; Da Costa, S.C.; Feng, X.; Faria, S.H.B.; Gimenez, M.L. Recovery and purification of lactose from whey. Chem. Eng. Process. 2010, 49, 1137–1143. [Google Scholar] [CrossRef]
- Tsui, T.-H.; Wong, J.W.C. A critical review: Emerging bioeconomy and waste-to-energy technologies for sustainable municipal solid waste management. Waste Dispos. Sustain. Energy 2019, 1, 151–167. [Google Scholar] [CrossRef] [Green Version]
- Tsui, T.-H.; Wu, H.; Song, B.; Liu, S.-S.; Bhardwaj, A.; Wong, J.W.C. Food waste leachate treatment using an Upflow Anaerobic Sludge Bed (UASB): Effect of conductive material dosage under low and high organic loads. Bioresour. Technol. 2020, 304, 122738. [Google Scholar] [CrossRef]
- Atra, R.; Vatai, G.; Becassy-Molnar, E.; Balint, A. Investigation of ultra-and nanofiltration for utilization of whey protein and lactose. J. Food Eng. 2005, 67, 325–332. [Google Scholar] [CrossRef]
- Matijašić, B.B.; Oberčkal, J.; Mohar Lorbeg, P.; Paveljšek, D.; Skale, N.; Kolenc, B.; Gruden, Š.; Poklar Ulrih, N.; Kete, M.; Zupančič Justin, M. Characterisation of Lactoferrin Isolated from Acid Whey Using Pilot-Scale Monolithic Ion-Exchange Chromatography. Processes 2020, 8, 804. [Google Scholar] [CrossRef]
- Castro-Munoz, R.; Gontarek, E. Handbook of Food Nanotechnology, Applications and Approaches; Nanofiltration in the food Industry; Academic Press: Cambridge, MA, USA, 2020; pp. 73–106. [Google Scholar] [CrossRef]
- Cuartas Uribe, B.; Alcaiina-Miranda, M.I.; Soriano-Costa, E.; Mendoza-Roca, J.A.; Ibora-Clar, M.I.; Lora-Garcia, J. A study of the separation of lactose from whey ultrafiltration permeate using nanofiltration. Desalination 2009, 241, 244–255. [Google Scholar] [CrossRef]
- Merkel, A.; Voropaeva, D.; Ondrušek, M. The impact of integrated nanofiltration and electrodialytic process on the chemical composition of sweat and acid whey streams. J. Food Eng. 2021, 298, 110500. [Google Scholar] [CrossRef]
- Barukčić, I.; Božanić, R.; Kulozik, U. Effect of pore size and process temperature on flux, microbial reduction and fouling mechanisms during sweet whey cross-flow microfiltration by ceramic membranes. Int. Dairy J. 2014, 39, 8–15. [Google Scholar] [CrossRef]
- Kulozik, U. Current Trends and Future Developments on (Bio-) Membranes, Chapter1: Ultra-and Microfiltration in Dairy Technology, 1st ed.; Elsevier: Amsterdam, The Netherlands, 2019; pp. 1–28. ISBN 9780128136072. [Google Scholar]
- Steinhauer, T.; Hanély, S.; Bogendörfer, K.; Kulozik, U. Temperature dependent membrane fouling during filtration of whey and whey proteins. J. Membr. Sci. 2015, 492, 364–370. [Google Scholar] [CrossRef]
- Cohen, J.L.; Barile, D.; Liu, Y.; de Maura Bell, J.M.L.N. Role of pH in the recovery of bovine milk oligosaccharides from colostrum whey permeate by nanofiltration. Int. Dairy J. 2017, 66, 68–75. [Google Scholar] [CrossRef] [PubMed] [Green Version]
- Al-Zoubi, H.; Rieger, A.; Steinberger, P.; Pelz, W. Nanofiltration of acid Mine Dainage. Desalin Water Treat. 2010, 21, 148–161. [Google Scholar] [CrossRef]
- Cuartas-Uribe, B.; Alcaina-Miranda, M.I.; Soriano-Costa, E.; Bes-Pia, A. Comparison of the behavior of Two Nanofiltration membranes for Sweet whey demineralization. J. Dairy Sci. 2007, 90, 1094–1101. [Google Scholar] [CrossRef]
- Petrinic, I.; Pusic, T.; Mijatovic, I.; Simončič, B.; Sostar Turk, S. Characterization of polymeric nanofiltration membranes. Kem. Ind. 2007, 56, 561–567. [Google Scholar]
- Antczak, J.; Szczygielda, M.; Prochaska, K. Nanofiltration separation of succinic acid from post-fermentation broth: Impact of process conditions and fouling analysis. J. Ind. Eng. Chem. 2019, 77, 253–261. [Google Scholar] [CrossRef]
- Salahi, A.; Mohsen, A.; Mohammadi, T. Permeate flux decline during UF of oily wastewater: Experimental and modeling. Desalination 2010, 251, 153–160. [Google Scholar] [CrossRef]
- Wang, J.; Tang, X.; Xu, Y.; Cheng, X.; Li, G.; Liang, H. “Hybrid UF/NF process treating secondary effluent of wastewater treatment plants for potable water reuse: Adsorption vs. coagulation for removal improvements and membrane fouling alleviation. Environ. Res. 2020, 109833. [Google Scholar] [CrossRef] [PubMed]
- Regulation (2007), Regulation on the Emission of Substances and Heat from the Discharge of Waste Water from Installations for the Treatment and Processing of Animal and Vegetable Raw Materials and Milk in the Production of Food for Human Consumption and Animal Feed, Official Gazette of Republic of Slovenia, No 45/2007. Available online: https://www.uradni-list.si/glasilo-uradni-list-rs/vsebina/2007-01-2454/uredba-o-emisiji-snovi-in-toplote-pri-odvajanju-odpadne-vode-iz-naprav-za-obdelavo-in-predelavo-zivalskih-in-rastlinskih-surovin-ter-mleka-pri-proizvodnji-hrane-za-prehrano-ljudi-in-zivalske-krme (accessed on 29 June 2021).
- Bedas, M.; Tanguy, G.; Dolivet, A.; Mejean, S.; Gaucherson, F.; Garric, G.; Senard, G.; Jeantet, R.; Schuck, P. Nanofiltration of lactic acid whey prior to spray drying: Scaling up to semi-industrial scale. LWT 2017, 79, 355–360. [Google Scholar] [CrossRef]
- Meschke, K.; Hansen, N.; Hofmann, R.; Haseneder, R.; Uwe-Repke, J. Characterization and performance evaluation of polymeric nanofiltration membranes for the separation of strategic elements from aqueous solutions. J. Membr. Sci. 2018, 546, 246–257. [Google Scholar] [CrossRef]
- Nyström, M.; Butylina, S.; Platt, S. NF retention and critical flux of small hydrophilic/hydrophobic molecules. Memb. Technol. 2004, 10, 5–8. [Google Scholar] [CrossRef]
- Simonič, M. Compost leaching treatment using polyaluminium chloride and nanofiltration. Open Chem. 2017, 15, 123–128. [Google Scholar] [CrossRef]
- Zou, T.; Dong, X.; Kang, G.; Zhou, M.; Li, M.; Cao, Y. Fouling behavior and scaling mitigation strategy of CaSO4 in submerged vacuum membrane distillation. Desalination 2018, 425, 86–93. [Google Scholar] [CrossRef]


| Parameter | NF-99 | DL |
|---|---|---|
| Producer | Alfa Laval (Sweden) | Osmonic Desal (Germany) |
| P | 1–55 bar | 0.5–28 bar |
| Tmax | 50 °C | 50 °C |
| pH | 2–10 | 2–11 |
| MWCO | 200 Da | 340 Da |
| Morphology | Thin-film polyamide | Thin-film poly(piperazineamide) |
| Support | Polyester | Polyester |
| Parameter | Standard Method | Apparatus |
|---|---|---|
| T (°C) | ISO 10523 | Thermometer |
| pH | ISO 10523 | pH meter, MA 5740 |
| A (436 nm) | SIST EN ISO 7887 | Spectrophotometer |
| Turbidity (NTU) | ISO 2027-1 | Turbidity meter |
| COD (g/L O2) | ISO 6060 | Digestion, titration |
| Equation | Plot | ||
|---|---|---|---|
| Intermediate pore blocking | J−1 = Jo−1 – K⋅ t | (3) | t − J−1 |
| Complete pore blocking | ln(J−1) = ln(Jo−1) − K⋅ t | (4) | t − ln(J−1) |
| Standard pore blocking | J−0.5 = Jo−0.5 − K⋅ t | (5) | t − J−0.5 |
| Cake layer formation | J−2 = Jo−2 − K⋅ t | (6) | t − J−2 |
| Parameter | FT | NF-99 Permeate | DL Permeate |
|---|---|---|---|
| A(436 nm) | 38.2 | 0.85 | 0.60 |
| Turbidity (NTU) | 1280 | 0.9 | 1.0 |
| κ (mS/cm) | 7.35 | 3.50 | 3.95 |
| pH | 3.3 | 3.2 | 3.2 |
| COD (g/L O2) | 60.3 | 1.5 | 1.9 |
| Membrane | Fr | Fir |
|---|---|---|
| DL | 0.49 | 0.19 |
| NF-99 | 0.67 | 0.21 |
| Coefficient | a (m2h/L) | b (m2h/L) | τ (min) | R2 |
|---|---|---|---|---|
| Membrane DL | 0.0324 | 0.01785 | 5.951 | 0.943 |
| Membrane NF-99 | 0.0659 | 0.03628 | 3.466 | 0.908 |
Publisher’s Note: MDPI stays neutral with regard to jurisdictional claims in published maps and institutional affiliations. |
© 2021 by the authors. Licensee MDPI, Basel, Switzerland. This article is an open access article distributed under the terms and conditions of the Creative Commons Attribution (CC BY) license (https://creativecommons.org/licenses/by/4.0/).
Share and Cite
Simonič, M.; Pintarič, Z.N. Study of Acid Whey Fouling after Protein Isolation Using Nanofiltration. Membranes 2021, 11, 492. https://doi.org/10.3390/membranes11070492
Simonič M, Pintarič ZN. Study of Acid Whey Fouling after Protein Isolation Using Nanofiltration. Membranes. 2021; 11(7):492. https://doi.org/10.3390/membranes11070492
Chicago/Turabian StyleSimonič, Marjana, and Zorka Novak Pintarič. 2021. "Study of Acid Whey Fouling after Protein Isolation Using Nanofiltration" Membranes 11, no. 7: 492. https://doi.org/10.3390/membranes11070492
APA StyleSimonič, M., & Pintarič, Z. N. (2021). Study of Acid Whey Fouling after Protein Isolation Using Nanofiltration. Membranes, 11(7), 492. https://doi.org/10.3390/membranes11070492