

Novel O-Methylglucoside Derivatives of Flavanone in Interaction with Model Membrane and Transferrin

 , and
, and
Abstract
:1. Introduction
2. Materials
2.1. 6-Methylflavanone Biotransformation Products
2.2. Biological and Lipid Membranes
3. Methods
3.1. Fluorimetric Studies of Interaction of the Compounds with Biological and Lipid Membrane
3.2. Hemolytic Studies of Toxicity of the Compounds and Their Influence on Osmotic Resistance
3.3. Microscopic Studies of the Influence of Compounds on the Shape of Erythrocytes
3.4. Fluorescence Study of the Holo-Transferrin-Compounds Interactions
3.5. Statistical Analysis
3.6. Pharmacokinetics and Drug-Likeness Prediction of the 6-Methylflavanone Derivatives
4. Results and Discussion
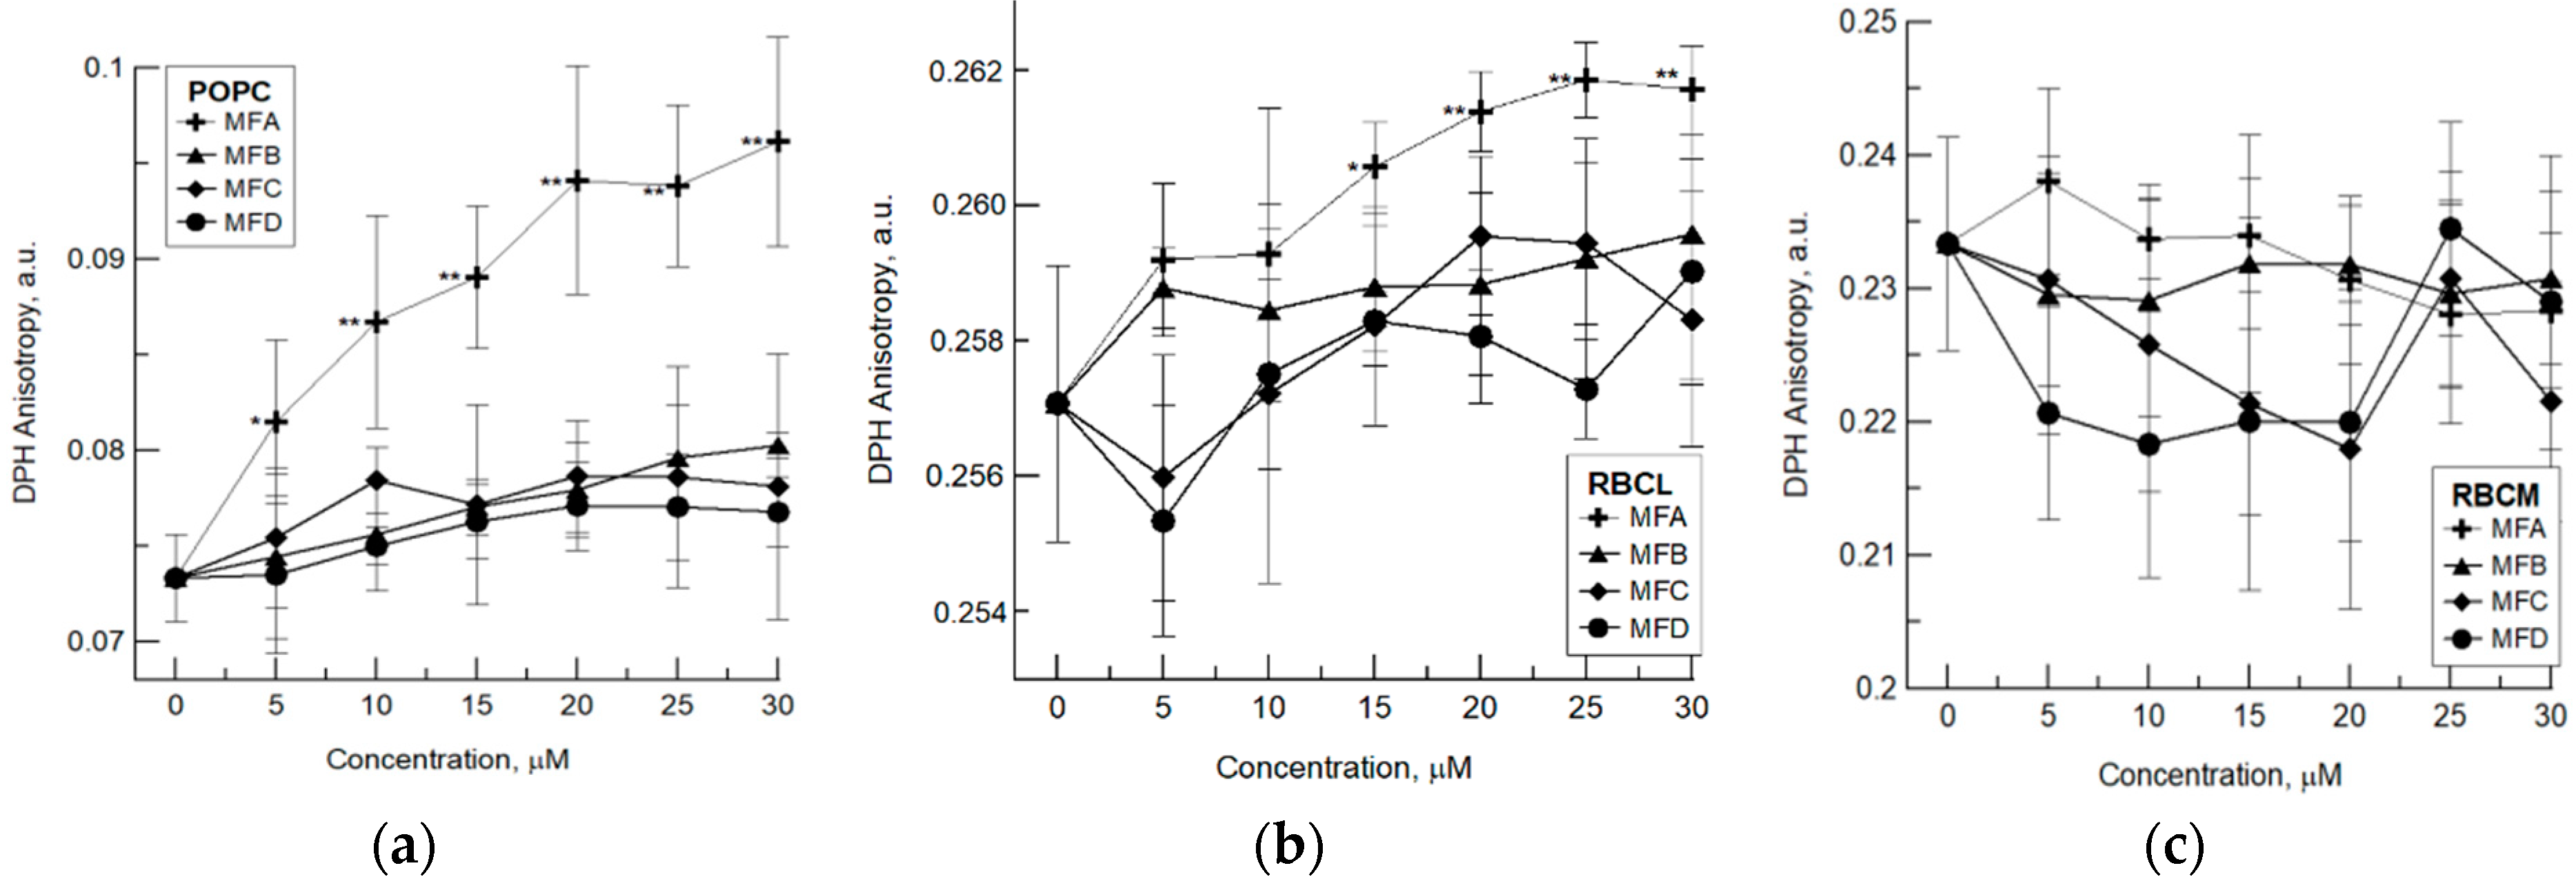
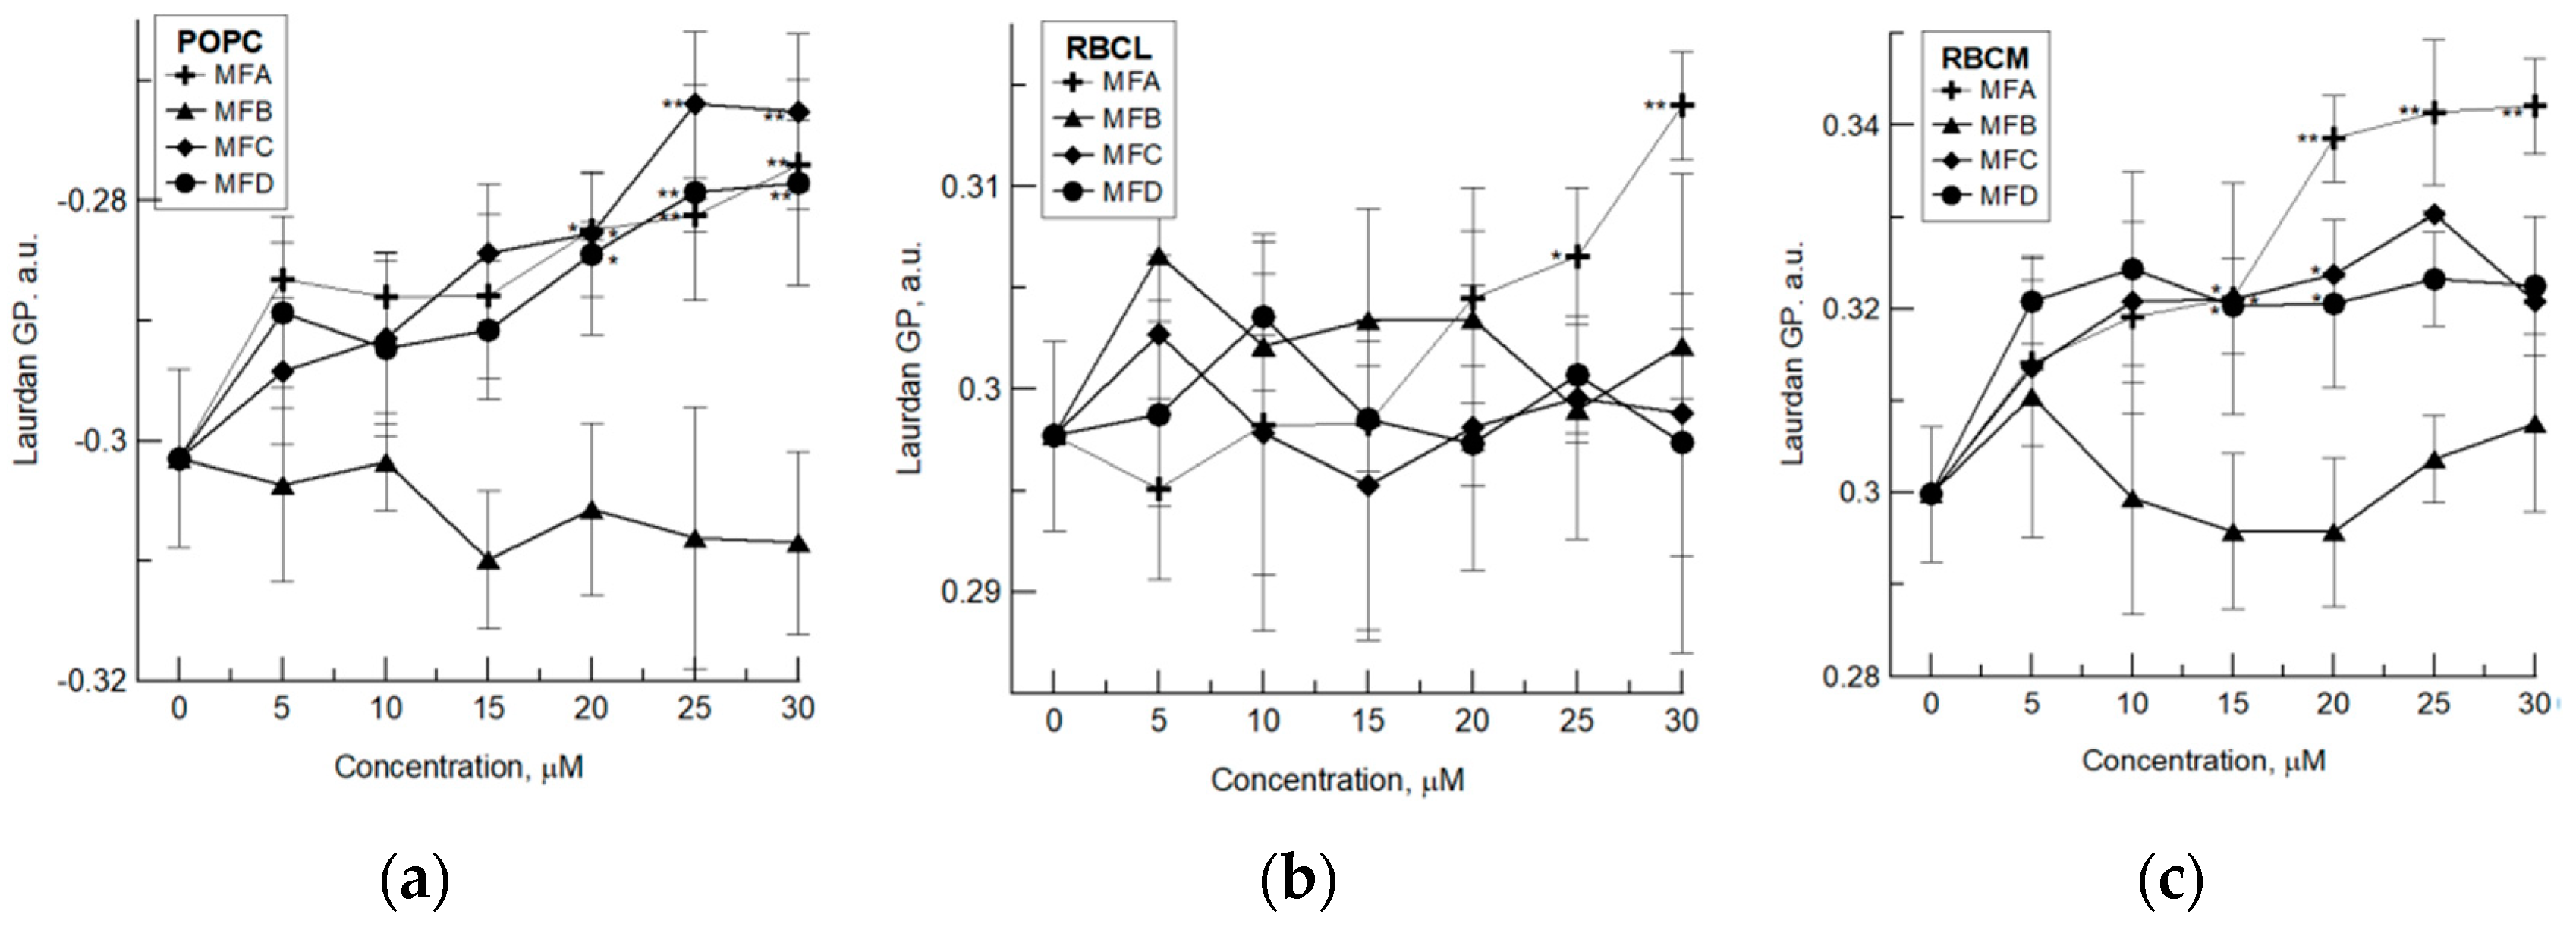
4.1. Fluorimetric Studies
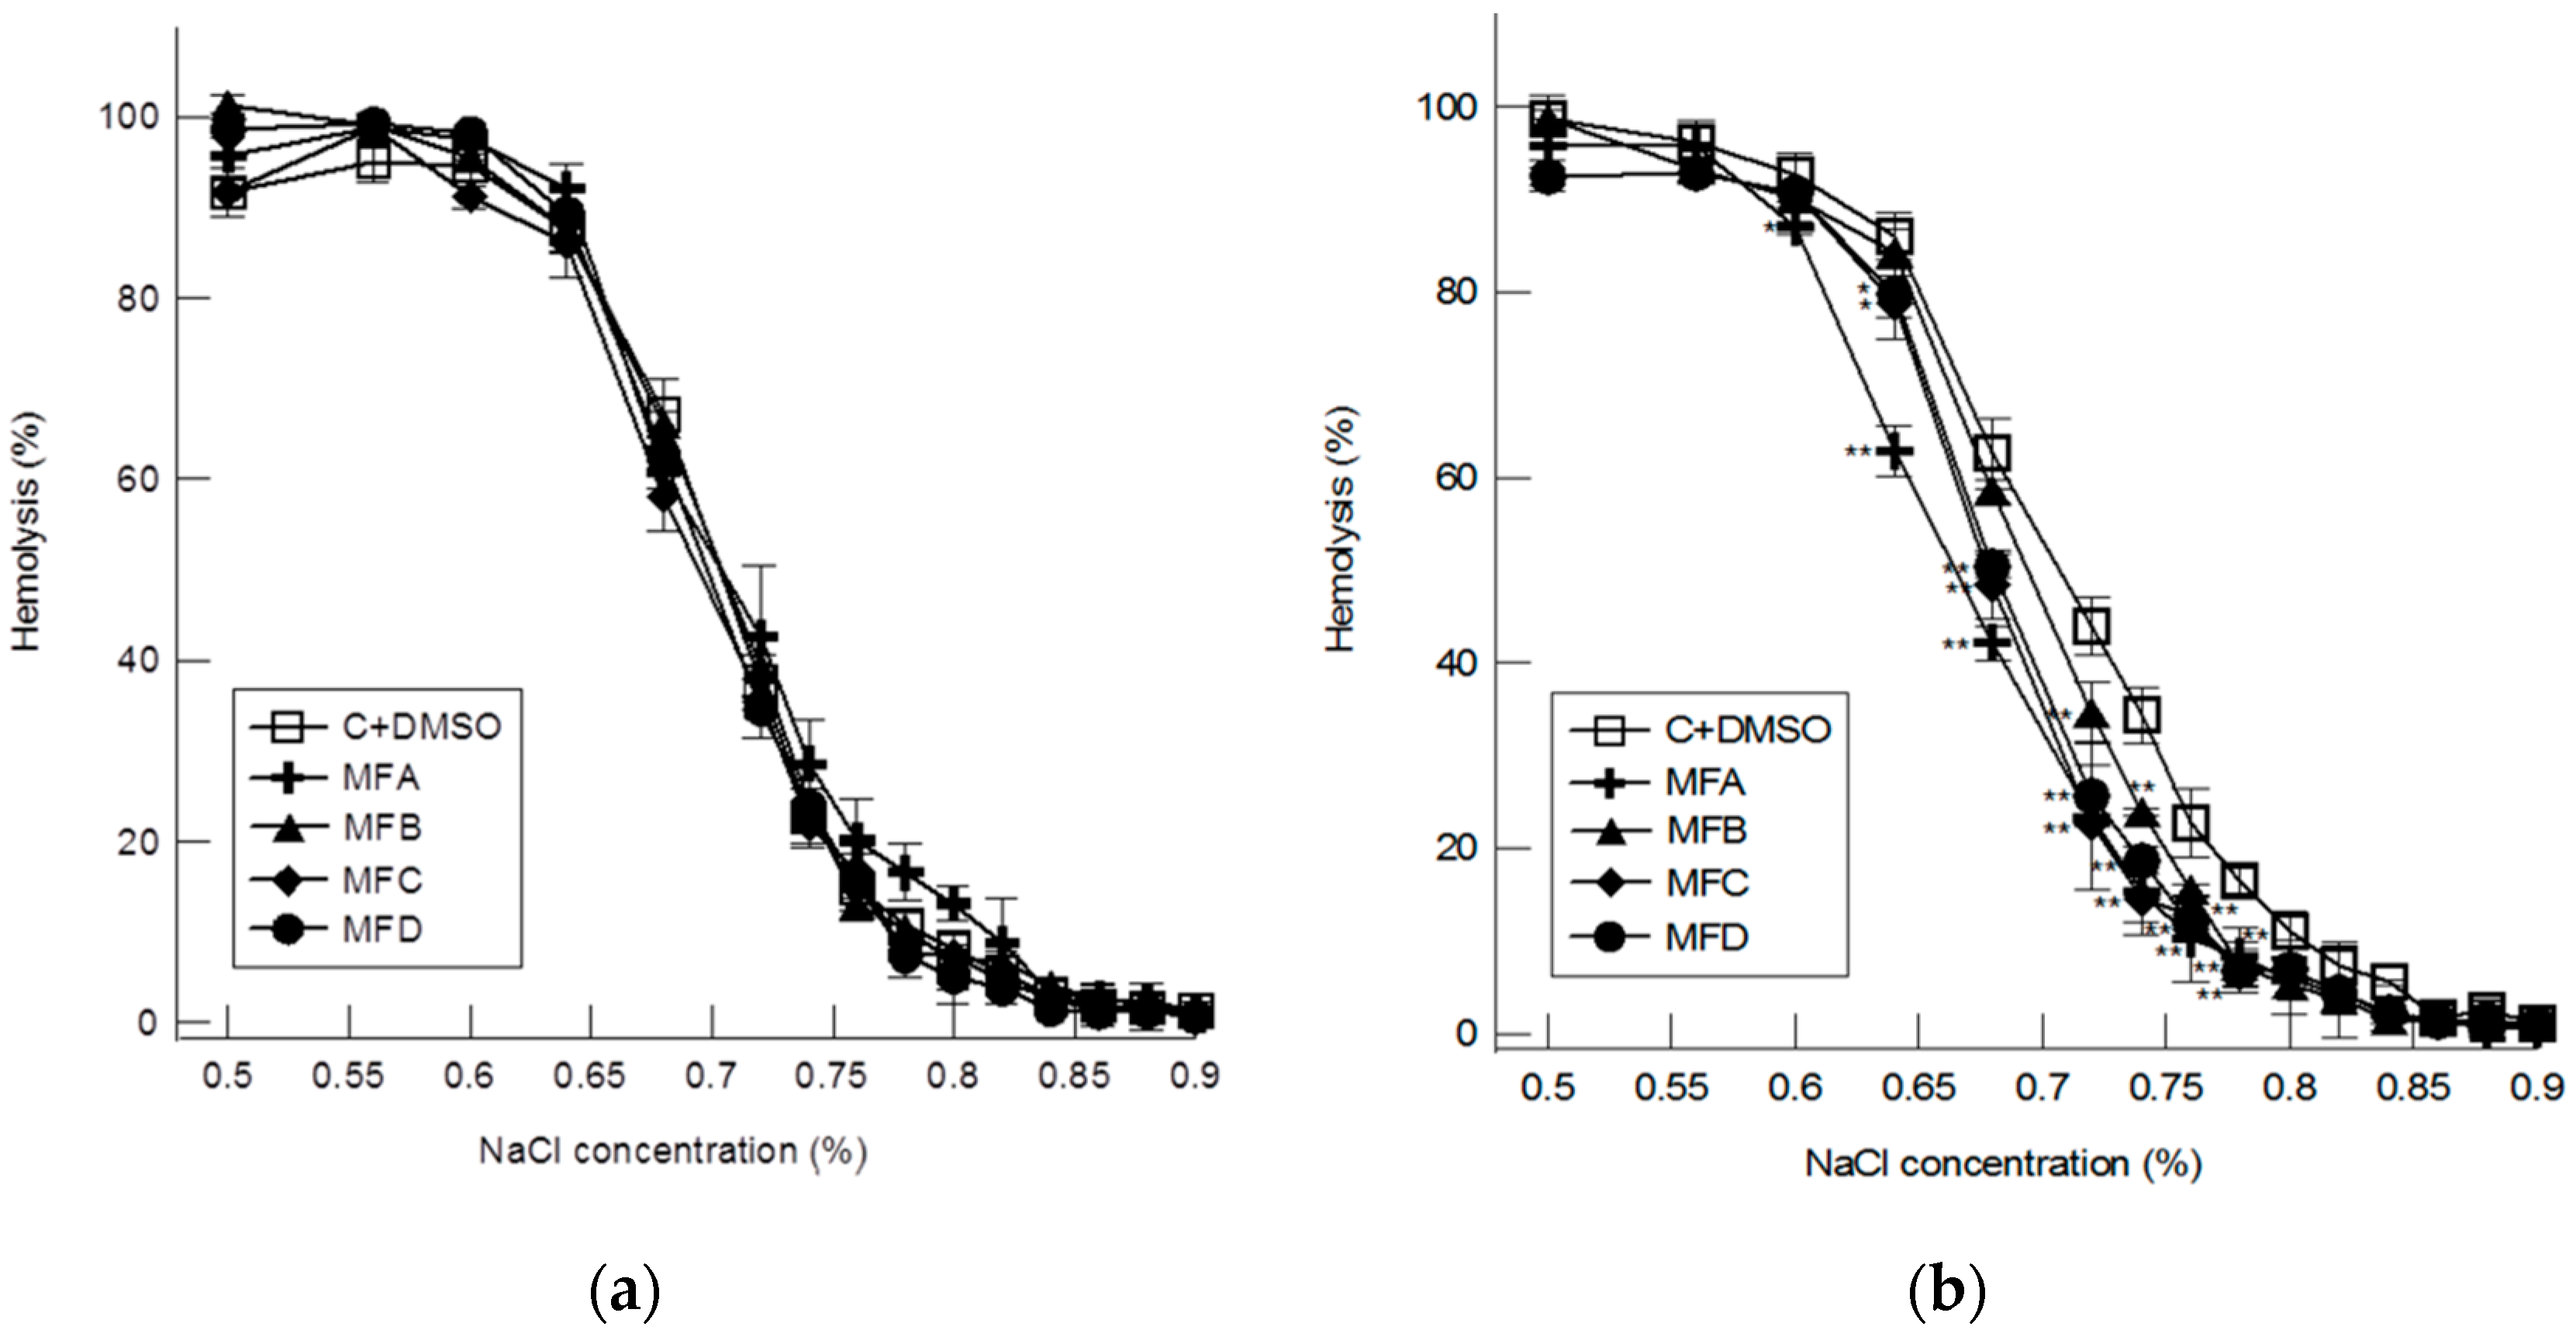
4.2. Hemolytic Studies
4.3. Microscopic Studies
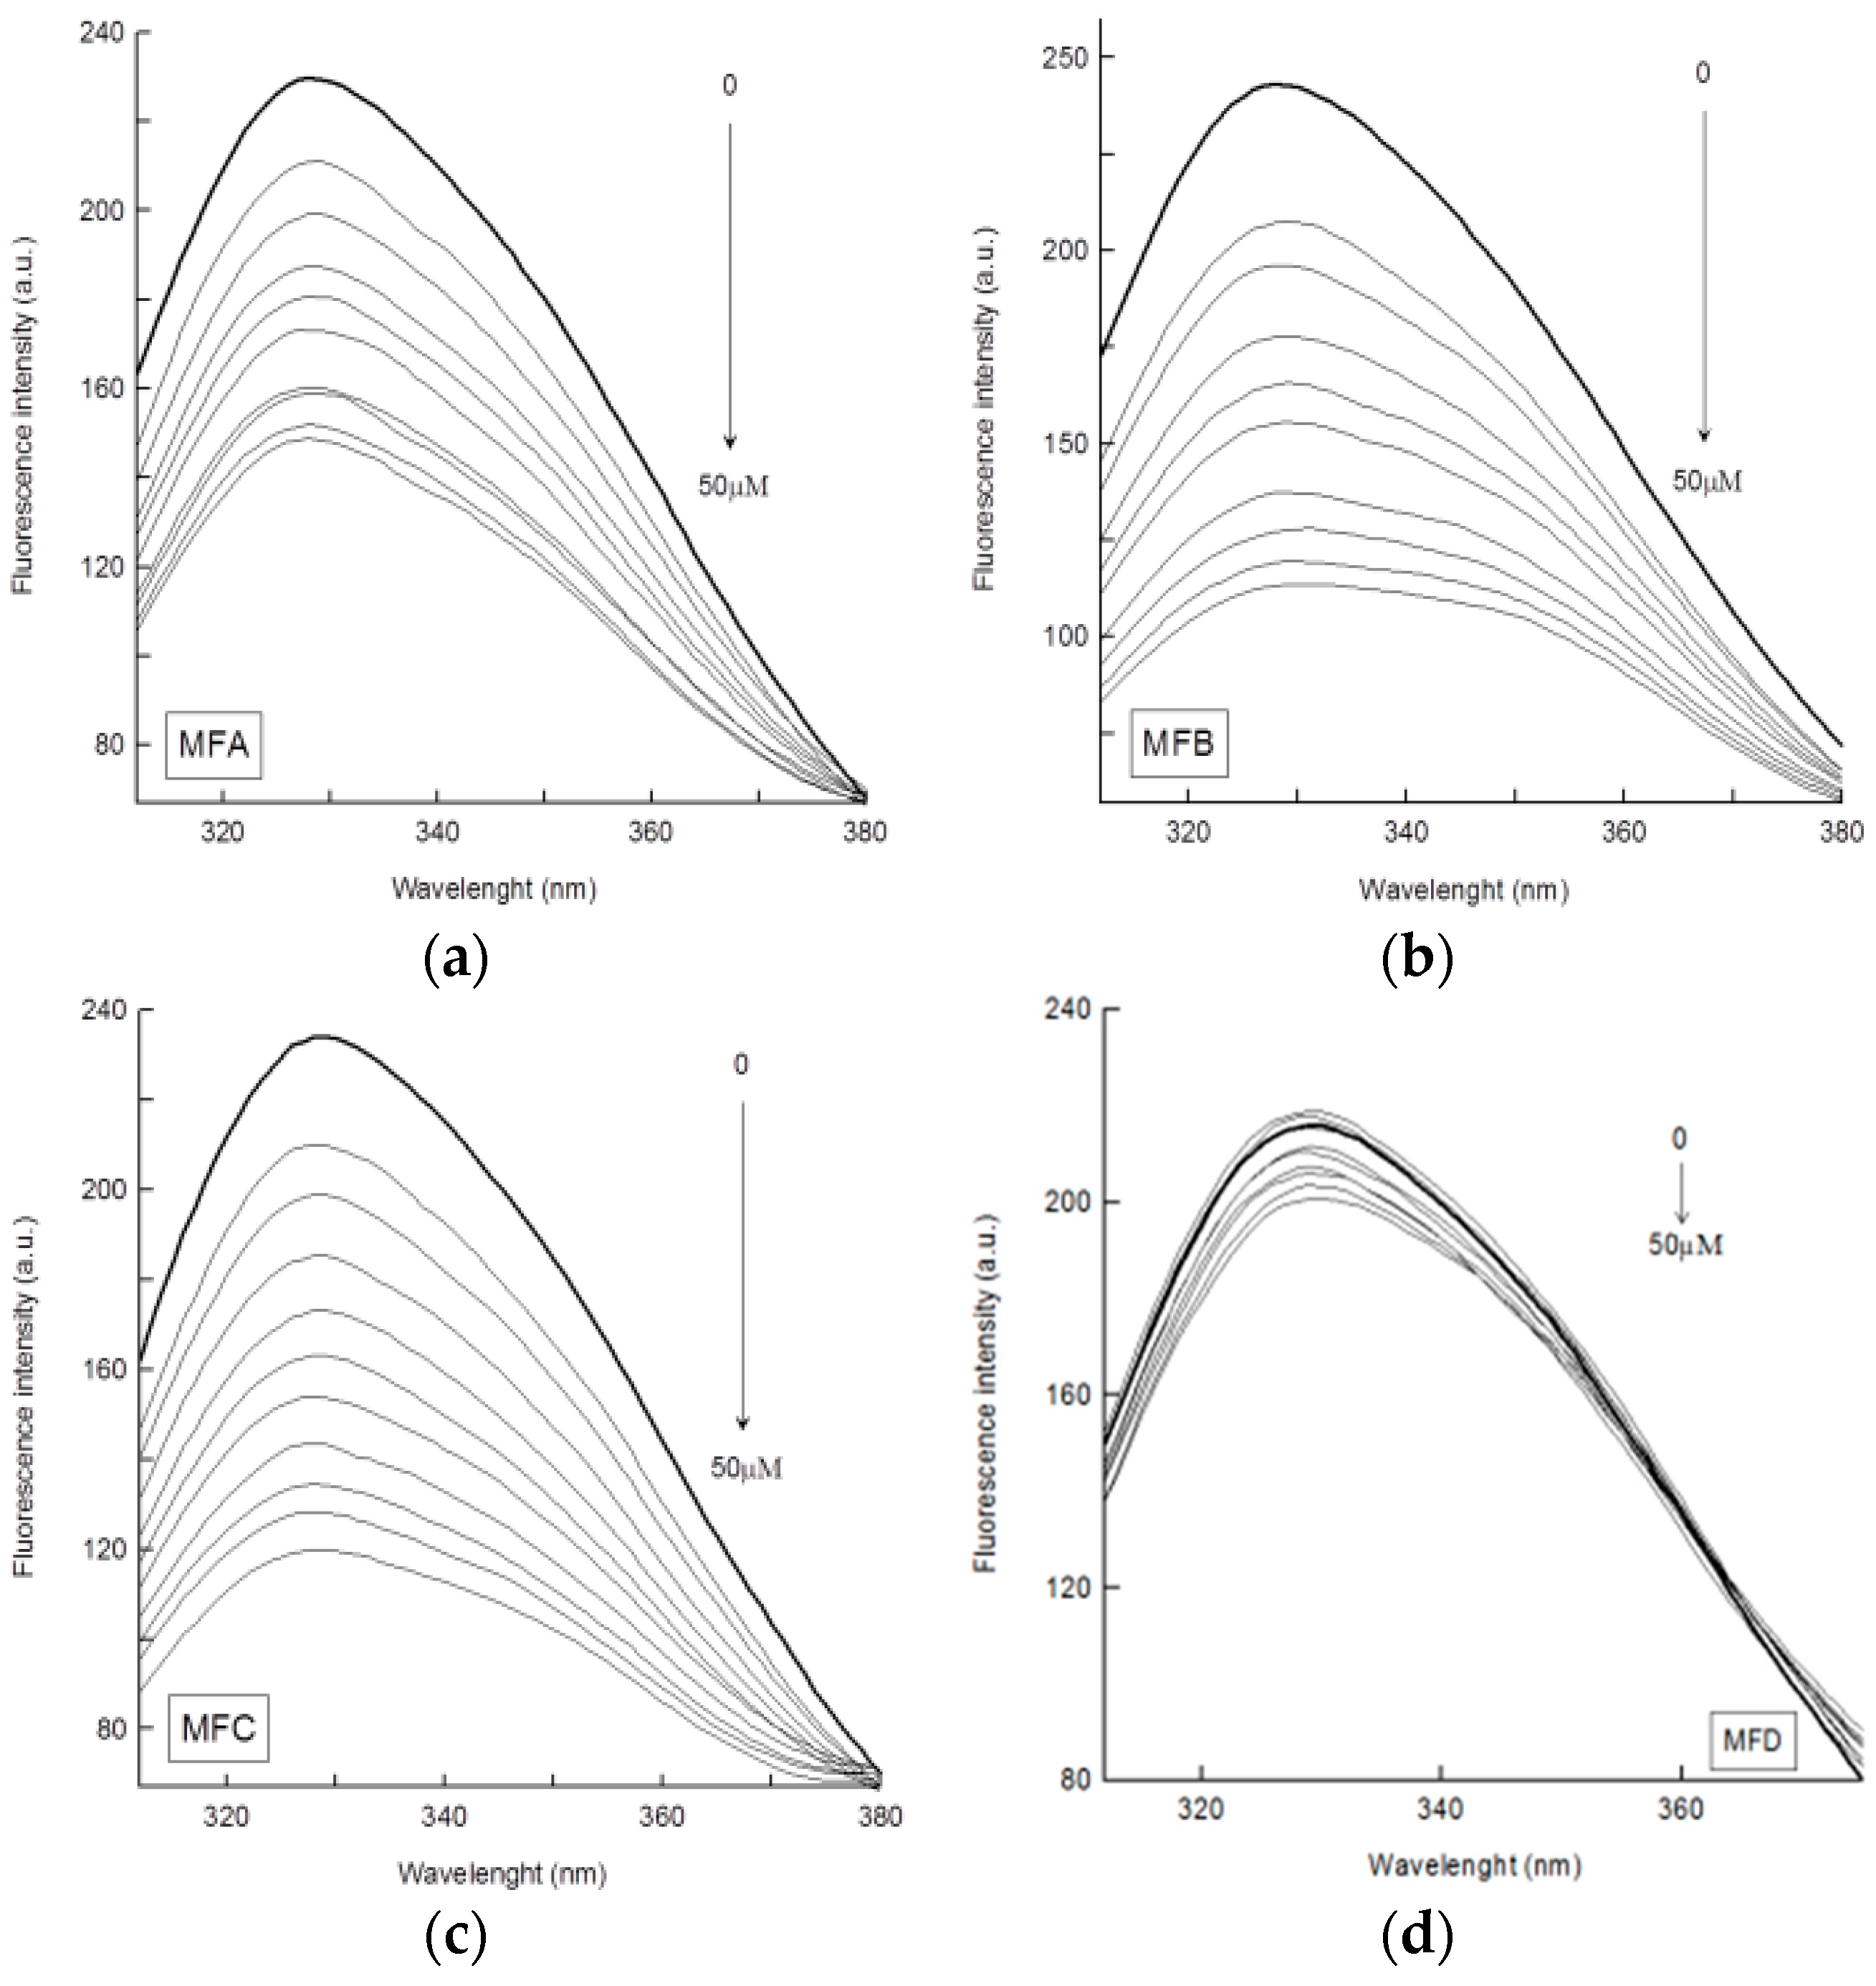
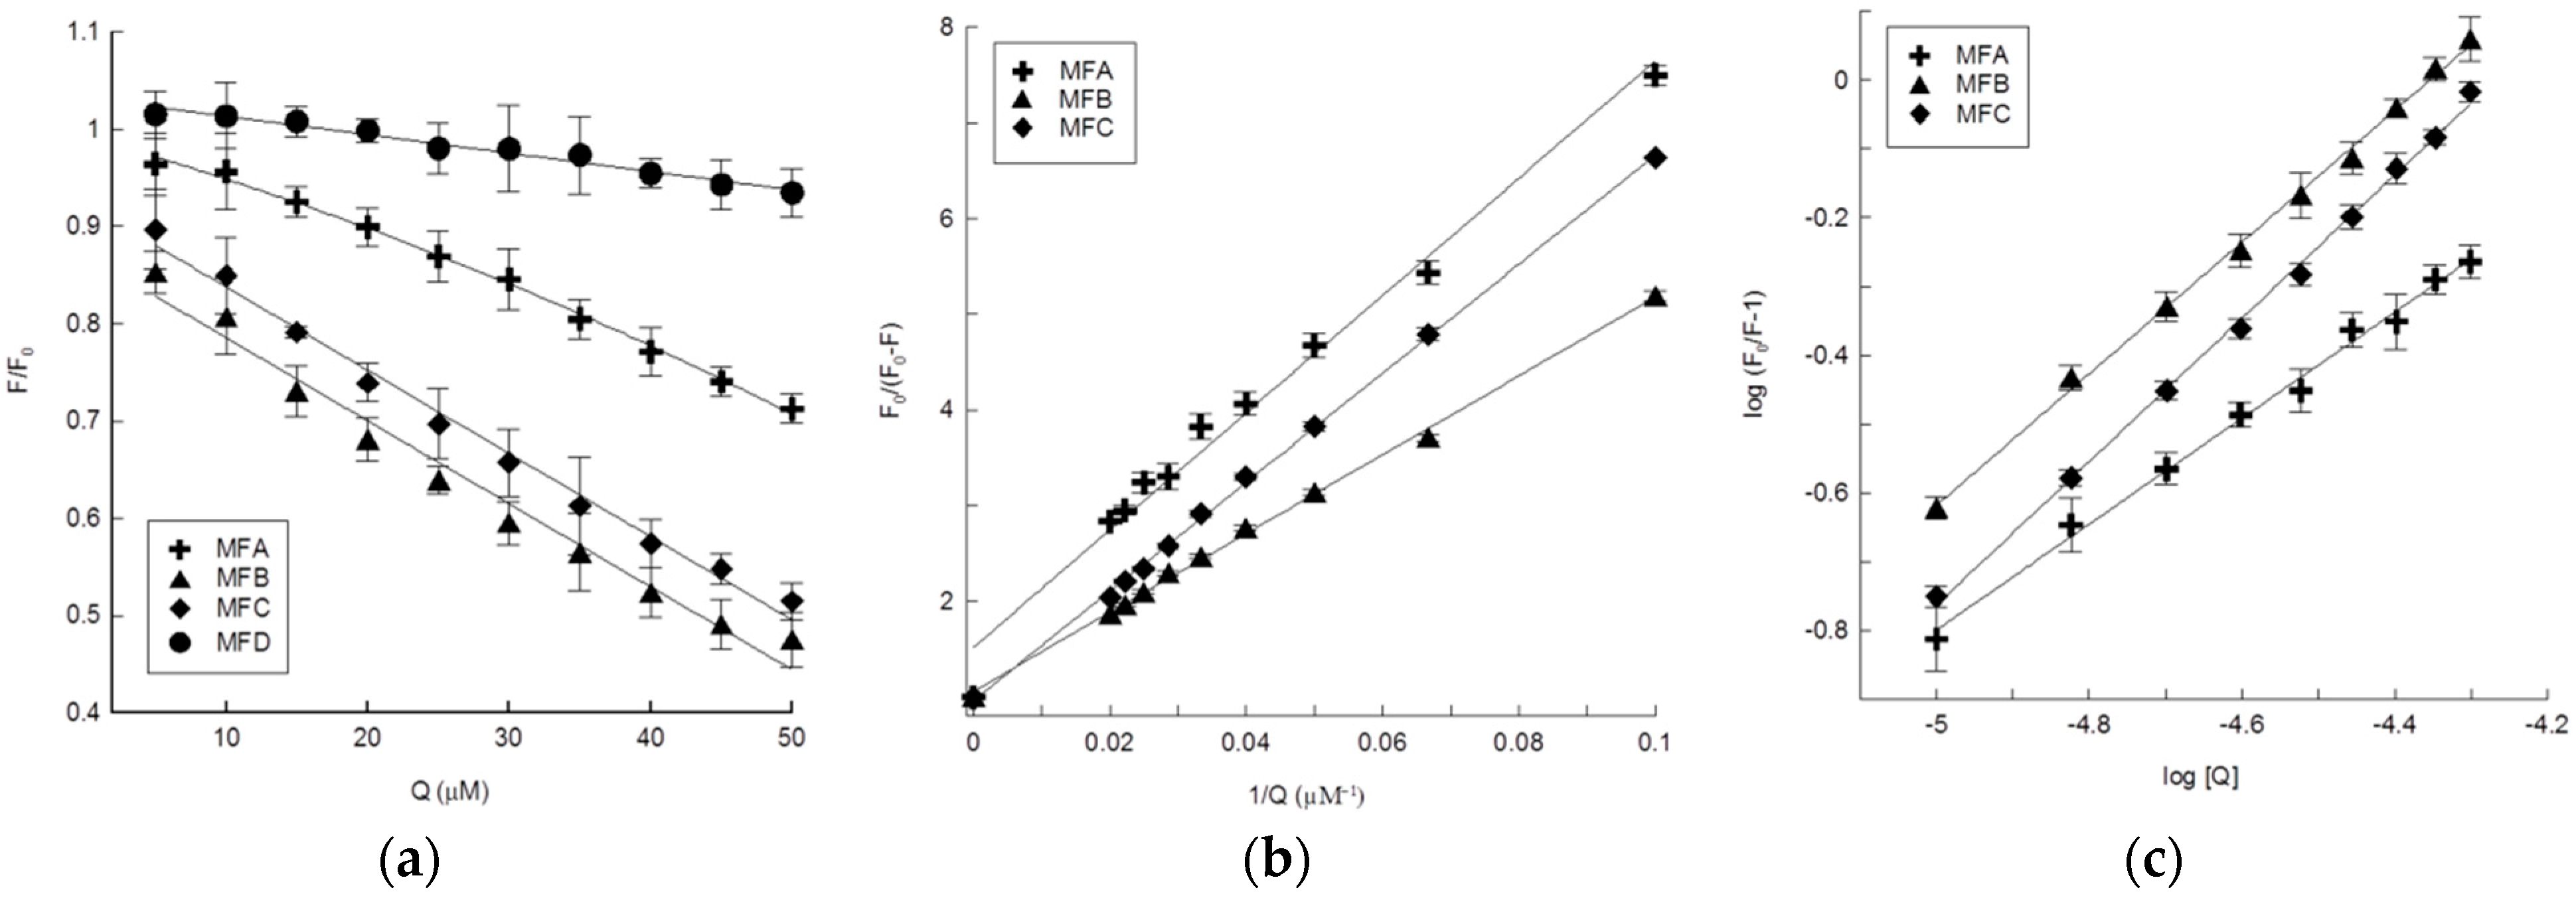
4.4. Interaction of the Compounds with HTF
5. Conclusions
Supplementary Materials
Author Contributions
Funding
Institutional Review Board Statement
Informed Consent Statement
Data Availability Statement
Conflicts of Interest
References
- Panche, A.N.; Diwan, A.D.; Chandra, S.R. Flavonoids: An Overview. J. Nutr. Sci. 2016, 5, e47. [Google Scholar] [CrossRef] [Green Version]
- Karim, N.; Jia, Z.; Zheng, X.; Cui, S.; Chen, W. A Recent Review of Citrus Flavanone Naringenin on Metabolic Diseases and Its Potential Sources for High Yield-Production. Trends Food Sci. Technol. 2018, 79, 35–54. [Google Scholar] [CrossRef]
- Sutthivaiyakit, S.; Seeka, C.; Wetprasit, N.; Sutthivaiyakit, P. C-Methylated Flavonoids from Pisonia grandis Roots. Phytochem. Lett. 2013, 6, 407–411. [Google Scholar] [CrossRef]
- Mulvihill, E.E.; Burke, A.C.; Huff, M.W. Citrus Flavonoids as Regulators of Lipoprotein Metabolism and Atherosclerosis. Annu. Rev. Nutr. 2016, 36, 275–299. [Google Scholar] [CrossRef]
- Yenjai, C.; Prasanphen, K.; Daodee, S.; Wongpanich, V.; Kittakoop, P. Bioactive Flavonoids from Kaempferia parviflora. Fitoterapia 2004, 75, 89–92. [Google Scholar] [CrossRef] [PubMed]
- Plaza, M.; Pozzo, T.; Liu, J.; Gulshan Ara, K.Z.; Turner, C.; Nordberg Karlsson, E. Substituent Effects on in Vitro Antioxidizing Properties, Stability, and Solubility in Flavonoids. J. Agric. Food Chem. 2014, 62, 3321–3333. [Google Scholar] [CrossRef] [PubMed]
- Kren, V. Chemical Biology and Biomedicine of Glycosylated Natural Compounds. In Glycoscience: Chemistry and Chemical Biology I–III; Fraser-Reid, B.O., Tatsuta, K., Thiem, J., Eds.; Springer: Berlin/Heidelberg, Germany, 2001; pp. 2471–2529. [Google Scholar] [CrossRef]
- Xiao, J. Dietary Flavonoid Aglycones and Their Glycosides: Which Show Better Biological Significance? Crit. Rev. Food Sci. Nutr. 2017, 57, 1874–1905. [Google Scholar] [CrossRef]
- Wen, L.; Jiang, Y.; Yang, J.; Zhao, Y.; Tian, M.; Yang, B. Structure, Bioactivity, and Synthesis of Methylated Flavonoids. Ann. N. Y. Acad. Sci. 2017, 1398, 120–129. [Google Scholar] [CrossRef] [PubMed]
- Brand, W.; van der Wel, P.A.I.; Rein, M.J.; Barron, D.; Williamson, G.; van Bladeren, P.J.; Rietjens, I.M.C.M. Metabolism and Transport of the Citrus Flavonoid Hesperetin in Caco-2 Cell Monolayers. Drug Metab. Dispos. 2008, 36, 1794–1802. [Google Scholar] [CrossRef] [PubMed]
- Zhu, B.T.; Ezell, E.L.; Liehr, J.G. Catechol-O-Methyltransferase-Catalyzed Rapid O-Methylation of Mutagenic Flavonoids. Metabolic Inactivation as a Possible Reason for Their Lack of Carcinogenicity in Vivo. J. Biol. Chem. 1994, 269, 292–299. [Google Scholar] [CrossRef]
- Pretorius, E.; Olumuyiwa-Akeredolu, O.-O.O.; Mbotwe, S.; Bester, J. Erythrocytes and Their Role as Health Indicator: Using Structure in a Patient-Orientated Precision Medicine Approach. Blood Rev. 2016, 30, 263–274. [Google Scholar] [CrossRef]
- Farag, M.R.; Alagawany, M. Erythrocytes as a Biological Model for Screening of Xenobiotics Toxicity. Chem. Biol. Interact. 2018, 279, 73–83. [Google Scholar] [CrossRef]
- Hollán, S. Membrane Fluidity of Blood Cells. Haematologia 1996, 27, 109–127. [Google Scholar]
- Gomme, P.T.; McCann, K.B.; Bertolini, J. Transferrin: Structure, Function and Potential Therapeutic Actions. Drug Discov. Today 2005, 10, 267–273. [Google Scholar] [CrossRef]
- Parkkinen, J.; von Bonsdorff, L.; Ebeling, F.; Sahlstedt, L. Function and Therapeutic Development of Apotransferrin. Vox Sang. 2002, 83 (Suppl. 1), 321–326. [Google Scholar] [CrossRef]
- Wally, J.; Halbrooks, P.J.; Vonrhein, C.; Rould, M.A.; Everse, S.J.; Mason, A.B.; Buchanan, S.K. The Crystal Structure of Iron-Free Human Serum Transferrin Provides Insight into Inter-Lobe Communication and Receptor Binding. J. Biol. Chem. 2006, 281, 24934–24944. [Google Scholar] [CrossRef] [Green Version]
- Yang, N.; Zhang, H.; Wang, M.; Hao, Q.; Sun, H. Iron and Bismuth Bound Human Serum Transferrin Reveals a Partially-Opened Conformation in the N-Lobe. Sci. Rep. 2012, 2, 999. [Google Scholar] [CrossRef] [Green Version]
- Atyabi, F.; Zahir, F.; Khonsari, F.; Shafiee, A.; Mottaghitalab, F. Chapter 21—Combination Therapy of Macromolecules and Small Molecules: Approaches, Advantages, and Limitations. In Nanostructures for Cancer Therapy; Ficai, A., Grumezescu, A.M., Eds.; Micro and Nano Technologies; Elsevier: Amsterdam, The Netherlands, 2017; pp. 541–561. [Google Scholar] [CrossRef]
- Krawczyk-Łebek, A.; Dymarska, M.; Janeczko, T.; Kostrzewa-Susłow, E. Entomopathogenic Filamentous Fungi as Biocatalysts in Glycosylation of Methylflavonoids. Catalysts 2020, 10, 1148. [Google Scholar] [CrossRef]
- Dodge, J.T.; Mitchell, C.; Hanahan, D.J. The Preparation and Chemical Characteristics of Hemoglobin-Free Ghosts of Human Erythrocytes. Arch. Biochem. Biophys. 1963, 100, 119–130. [Google Scholar] [CrossRef]
- Peterson, G.L. Determination of Total Protein. Methods Enzymol. 1983, 91, 95–119. [Google Scholar] [CrossRef]
- Maddy, A.H.; Dunn, M.J.; Kelly, P.G. The Characterisation of Membrane Proteins by Centrifugation and Gel Electrophoresis a Comparison of Proteins Prepared by Different Methods. Biochim. Biophys. Acta BBA Biomembr. 1972, 288, 263–276. [Google Scholar] [CrossRef]
- Lakowicz, J.R. (Ed.) Principles of Fluorescence Spectroscopy; Springer: Boston, MA, USA, 2006. [Google Scholar] [CrossRef]
- Parasassi, T.; Krasnowska, E.K.; Bagatolli, L.; Gratton, E. Laurdan and Prodan as Polarity-Sensitive Fluorescent Membrane Probes. J. Fluoresc. 1998, 8, 365–373. [Google Scholar] [CrossRef]
- Włoch, A.; Strugała-Danak, P.; Pruchnik, H.; Krawczyk-Łebek, A.; Szczecka, K.; Janeczko, T.; Kostrzewa-Susłow, E. Interaction of 4′-Methylflavonoids with Biological Membranes, Liposomes, and Human Albumin. Sci. Rep. 2021, 11, 16003. [Google Scholar] [CrossRef]
- Scheidt, H.A.; Pampel, A.; Nissler, L.; Gebhardt, R.; Huster, D. Investigation of the membrane localization and distribution of flavonoids by high-resolution magic angle spinning NMR spectroscopy. Biochim. Biophys. Acta BBA Biomembr. 2004, 1663, 97–107. [Google Scholar] [CrossRef]
- Altunayar-Unsalan, C.; Unsalan, O.; Mavromoustakos, T. Insights into Molecular Mechanism of Action of Citrus Flavonoids Hesperidin and Naringin on Lipid Bilayers Using Spectroscopic, Calorimetric, Microscopic and Theoretical Studies. J. Mol. Liq. 2022, 347, 118411. [Google Scholar] [CrossRef]
- Karonen, M. Insights into Polyphenol–Lipid Interactions: Chemical Methods, Molecular Aspects and Their Effects on Membrane Structures. Plants 2022, 11, 1809. [Google Scholar] [CrossRef]
- Asgary, S.; Naderi, G.; Askari, N. Protective Effect of Flavonoids against Red Blood Cell Hemolysis by Free Radicals. Exp. Clin. Cardiol. 2005, 10, 88–90. [Google Scholar]
- Bernhardt, I.; Ellory, J.C. Red Cell Membrane Transport in Health and Disease; Springer: Berlin/Heidelberg, Germany, 2013. [Google Scholar]
- Sheetz, M.P.; Singer, S.J. Biological Membranes as Bilayer Couples. A Molecular Mechanism of Drug-Erythrocyte Interactions. Proc. Natl. Acad. Sci. USA. 1974, 71, 4457–4461. [Google Scholar] [CrossRef] [Green Version]
- Cyboran-Mikołajczyk, S.; Jurkiewicz, P.; Hof, M.; Kleszczyńska, H. The Impact of O-Glycosylation on Cyanidin Interaction with POPC Membranes: Structure-Activity Relationship. Molecules 2018, 23, 2771. [Google Scholar] [CrossRef]
- Sandu, N.; Chilom, C.G.; Popescu, A.I. Structural and Molecular Aspects of Flavonoids as Ligands for Serum Transferrin. Spectrochim. Acta. Part A Mol. Biomol. Spectrosc. 2021, 254, 119600. [Google Scholar] [CrossRef]
- Papadopoulou, A.; Green, R.J.; Frazier, R.A. Interaction of Flavonoids with Bovine Serum Albumin: A Fluorescence Quenching Study. J. Agric. Food Chem. 2005, 53, 158–163. [Google Scholar] [CrossRef]
- Zhang, X.; Han, R.; Sun, X.; Li, G.; Yang, Q.; Li, Q.; Gai, W.; Zhang, M.; Chen, L.; Yang, G.; et al. The Effect of the Skeleton Structure of Flavanone and Flavonoid on Interaction with Transferrin. Bioorg. Med. Chem. Lett. 2013, 23, 6677–6681. [Google Scholar] [CrossRef]
- Du, H.; Xiang, J.; Zhang, Y.; Tang, Y.; Xu, G. Structural Effects on the Conformational Transition of Transferrin Induced by Binding of Flavonoids with Different Numbers and Positions of Hydroxyl Groups. J. Photochem. Photobiol. A Chem. 2008, 195, 127–134. [Google Scholar] [CrossRef]
- Tang, H.; Huang, L.; Zhao, D.; Sun, C.; Song, P. Interaction Mechanism of Flavonoids on Bovine Serum Albumin: Insights from Molecular Property-Binding Affinity Relationship. Spectrochim. Acta. Part A. Mol. Biomol. Spectrosc. 2020, 239, 118519. [Google Scholar] [CrossRef]


| System | KSV (M−1) × 104 | R* | Kq (s−1 M−1) × 1012 | Ka (M−1) × 104 | R** | n |
|---|---|---|---|---|---|---|
| HTF-MFA | 2.50 | 0.983 | 9.92 | 1.12 | 0.994 | 0.77 |
| HTF-MFC | 1.70 | 0.998 | 6.80 | 2.79 | 0.998 | 1.04 |
| HTF-MFB | 2.58 | 0.999 | 10.3 | 1.47 | 0.998 | 0.96 |
Publisher’s Note: MDPI stays neutral with regard to jurisdictional claims in published maps and institutional affiliations. |
© 2022 by the authors. Licensee MDPI, Basel, Switzerland. This article is an open access article distributed under the terms and conditions of the Creative Commons Attribution (CC BY) license (https://creativecommons.org/licenses/by/4.0/).
Share and Cite
Cyboran-Mikołajczyk, S.; Bonarska-Kujawa, D.; Męczarska, K.; Krawczyk-Łebek, A.; Kostrzewa-Susłow, E. Novel O-Methylglucoside Derivatives of Flavanone in Interaction with Model Membrane and Transferrin. Membranes 2022, 12, 978. https://doi.org/10.3390/membranes12100978
Cyboran-Mikołajczyk S, Bonarska-Kujawa D, Męczarska K, Krawczyk-Łebek A, Kostrzewa-Susłow E. Novel O-Methylglucoside Derivatives of Flavanone in Interaction with Model Membrane and Transferrin. Membranes. 2022; 12(10):978. https://doi.org/10.3390/membranes12100978
Chicago/Turabian StyleCyboran-Mikołajczyk, Sylwia, Dorota Bonarska-Kujawa, Katarzyna Męczarska, Agnieszka Krawczyk-Łebek, and Edyta Kostrzewa-Susłow. 2022. "Novel O-Methylglucoside Derivatives of Flavanone in Interaction with Model Membrane and Transferrin" Membranes 12, no. 10: 978. https://doi.org/10.3390/membranes12100978
APA StyleCyboran-Mikołajczyk, S., Bonarska-Kujawa, D., Męczarska, K., Krawczyk-Łebek, A., & Kostrzewa-Susłow, E. (2022). Novel O-Methylglucoside Derivatives of Flavanone in Interaction with Model Membrane and Transferrin. Membranes, 12(10), 978. https://doi.org/10.3390/membranes12100978