Article

Sessile Drop Method: Critical Analysis and Optimization for Measuring the Contact Angle of an Ion-Exchange Membrane Surface

1
Membrane Institute, Kuban State University, 149 Stavropolskaya St., 350040 Krasnodar, Russia
2
Department of Applied Chemistry, Anhui Provincial Engineering Laboratory of Functional Membrane Science and Technology, School of Chemistry and Materials Science, University of Science and Technology of China, Hefei 230026, China
*
Author to whom correspondence should be addressed.
Membranes 2022, 12(8), 765; https://doi.org/10.3390/membranes12080765
Submission received: 19 July 2022 / Revised: 31 July 2022 / Accepted: 1 August 2022 / Published: 4 August 2022
(This article belongs to the Special Issue Ion-Exchange Membranes and Processes (Volume III))

Abstract

:
The contact angle between a membrane surface and a waterdrop lying on its surface provides important information about the hydrophilicity/hydrophobicity of the membrane. This method is well-developed for solid non-swelling materials. However, ion-exchange membranes (IEMs) are gel-like solids that swell in liquids. When an IEM is exposed to air, its degree of swelling changes rapidly, making it difficult to measure the contact angle. In this paper, we examine the known experience of measuring contact angles and suggest a simple equipment that allows the membrane to remain swollen during measurements. An optimized protocol makes it possible to obtain reliable and reproducible results. Measuring parameters such as drop size, water dosing speed and others are optimized. Contact angle measurements are shown for a large number of commercial membranes. These data are supplemented with values from other surface characteristics from optical and profilometric measurements.

1. Introduction

Ion exchange membranes (IEMs) are increasingly used in modern technology, applied in chemistry, energy, medicine and other fields [1,2,3]. They constitute the main part of membrane bioreactors [4], fuel cells [5,6] (including biological ones [7]) and other energy generating devices [8], form membrane stacks in dialysis [9] and electrodialysis [10] units, and are used in membrane capacitive deionization [11,12], microfluidics [13,14], potentiometric sensors [15] and others [16]. The degree of hydrophilicity/hydrophobicity of the IEM surface is an important characteristic that affects their performance in the above processes; the membrane permselectivity [17], the ability to increase mass transfer rate due to electroconvection [18,19], fouling resistance [20,21,22] strongly correlate with the degree of surface hydrophilicity. Changes in this characteristic, estimated from contact angle measurements, can be used as an indicator of changes in the chemical composition and structure of the surface due to its modification [23] or membrane degradation during use [24]. These changes can be also caused by the adsorption of organic and inorganic substances by the membrane surface [25,26,27,28], changes in the surface charge [29,30] and/or roughness [20,29].
The high significance of the contact angle explains the high popularity of this research method [31]. A Scopus “contact angle” keyword search reveals about 130,000 publications, including about 2400 publications related to IEM (accessed 15 June 2022). Figure 1 shows some possibilities of determining the ion-exchange membrane surface parameters by the contact angle measurement. Thus, the parameters of geometric and chemical heterogeneity combined with the contact angle of the surface under study allow calculating the equilibrium contact angle using the Wenzel and/or Cassi–Baxter equations [32,33]. From this value, the free energy of adhesion (free energy of hydration) can be calculated by the Young–Dupré equation [34]. This energy determines the degree of the surface hydrophilicity/hydrophobicity, which is useful for the evaluation of different methods of membrane modification. If test fluids have different surface tension and chemical nature, information about interfacial tension and its components can be obtained [29,35]. These data are important in the research of fouling and scaling of IEM surfaces [26,27]. Contact angle titration in accordance with [30,36,37] makes it possible to calculate the surface charge density, degree of surface ionization, concentration of reactive groups on the surface and other parameters.
Many approaches have been developed to measure the contact angle [39]. The most common is the sessile drop method. It consists of applying a drop of distilled water (or other test liquid) over the sample surface and measuring the contact angle formed at the three-phase interface (solid–liquid–gas). The sessile drop method is widespread due to the simplicity of the measuring setup and measurement protocol, small volume of the test liquid and size of the sample required for measurements. The method makes it easy to obtain reproducible results for solid non-swelling, geometrically and chemically homogeneous materials (such as polyethylene and polytetrafluoroethylene) [40].
The correct contact angle determination is an intensively discussed topic in the literature. Refs. [41,42,43] provide the protocols for measuring the contact angles, which allow obtaining reliable and reproducible data for solid non-swelling surfaces. Our work is aimed at optimizing the contact angle measurement for IEM surfaces, which have special properties. IEMs are semi-solid gel-like polymers that swell in an aqueous medium. Without contact with water, the swelling degree decreases rapidly with time, making it very difficult to determine the correct contact angle value. The values reported in the literature for the same membrane can vary considerably from one publication to another. For example, the contact angles of the Neosepta AMX membrane (manufacture Astom, Japan), reported by different authors in the literature, differ by 20 degrees: 64 [44], 66–70 [45], 69 [46], 80.6 [47] and 84 [48]. The reason for these variations is that researchers use dry and swollen samples for measurements (sometimes without specifying the state of the sample under study). A feature of IEM is that its structure, including the surface layer, strongly depends on the swelling degree [49]. In the air-dry state, the surface of these membranes tends to absorb a drop of polar test liquid (e.g., water) due to the ion–dipole interaction of liquid molecules with fixed IEM groups [49,50]. With that, the surface of the initially dry IEM is deformed in most cases. The value of the contact angle can also be influenced by the composition of the equilibrium solution [51], surface roughness [32], distribution of conductive and nonconductive regions [33,38], drop size [52], the distance between the needle and sample [53], dosing flow rate [41], image registration and processing method, contact angle acquisition [54], time after drop deposition at which the measurement is made [53], and some other details of the measurement procedure [41,43,53,55].
This paper examines the known experience of measuring the contact angles of ion-exchange membranes and proposes an optimized protocol of the sessile drop method. The measurement setup is improved, so that the membrane remains wet during the time of measurements. This makes it possible to obtain reproducible results under conditions when the membrane surface is not deformed. Measurement conditions, such as drop size and dosing flow rate, are optimized. The results of contact angle measurements for a large number of commercial membranes are presented. These data are supplemented by surface characterization using optical microscopy and profilometry. We believe that the optimized protocol can serve as the basis for the standard for measuring contact angles.

2. Theoretical Foundations

The sessile drop method is used to obtain an apparent contact angle θ a p , which describes metastable state of a liquid drop on the surface of a real sample. In general, θ a p is a random value, since the metastable state of two successive droplets may be different [41,52]. The values of θ a p belong to the range of contact angle hysteresis, which is limited by advancing θA and receding θR contact angles [56].
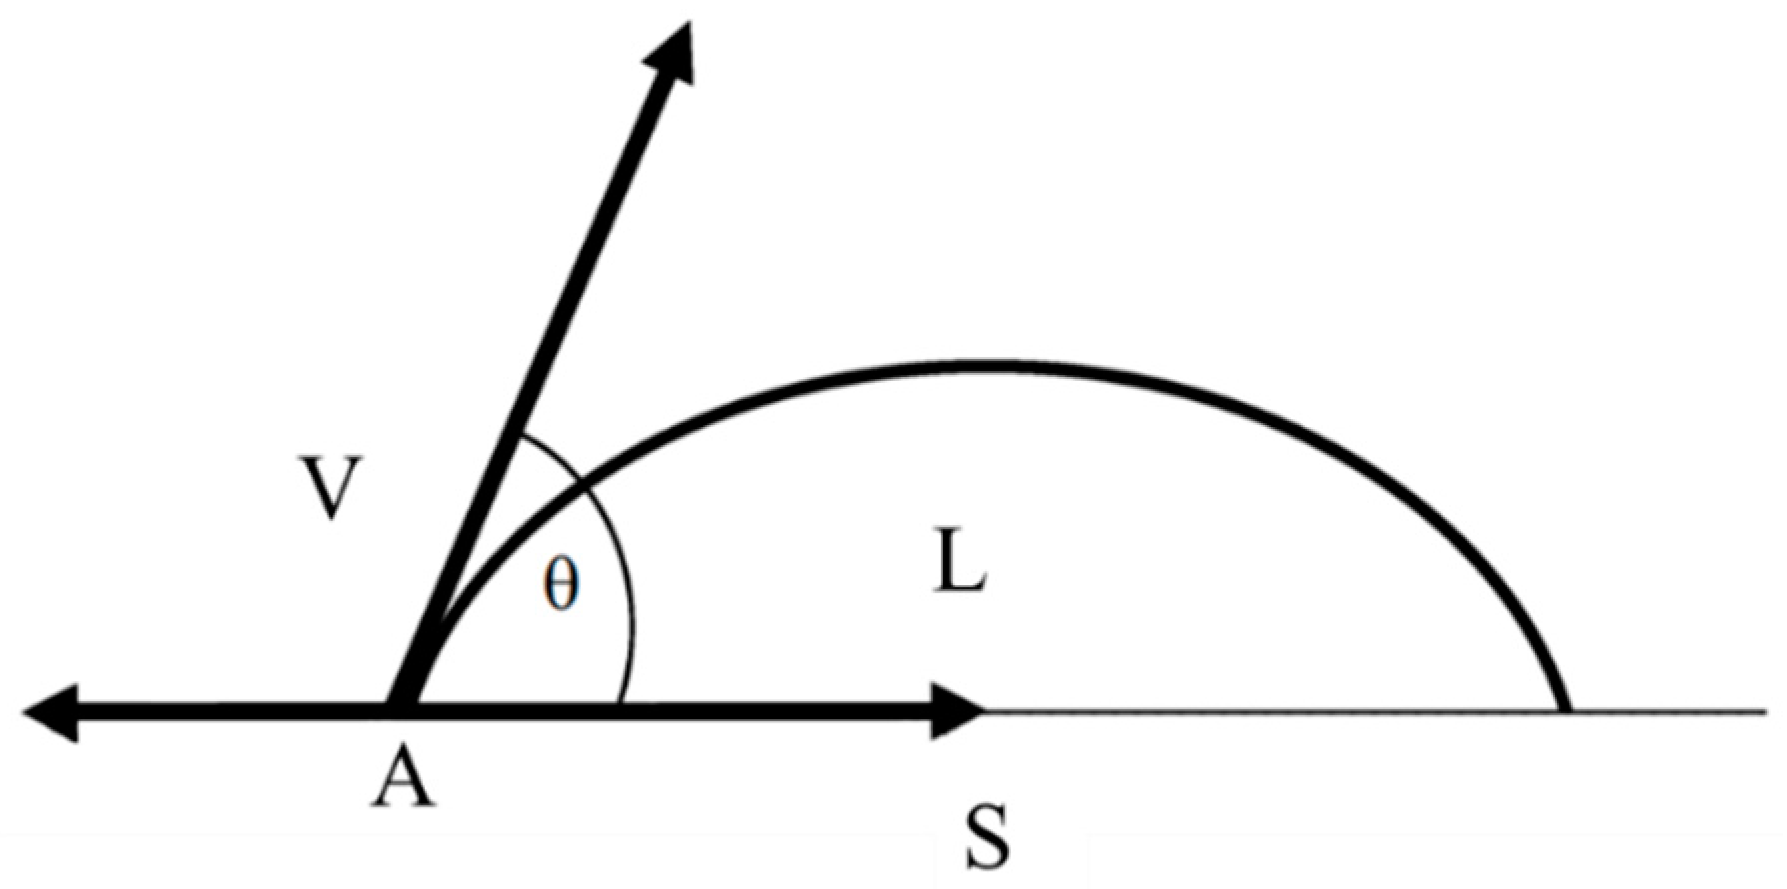
The basic relationship linking the wetting properties of the liquid with the contact angle is the Young equation [57]. It expresses the balance of surface forces at point A of contact of the three phases: liquid, solid and gas (Figure 2):
cos θ Y = γ S V γ S L γ L V  
where θ Y is the contact angle of the liquid–solid–gas system; and γ S V , γ S L and γ L V are the interfacial tensions in the solid/gas, solid/liquid and liquid/gas systems, respectively.
The Young equation is valid for an equilibrium system with a perfectly smooth, chemically homogeneous, nonreactive and nondeformable surface [32,33,51]. However, real samples have geometrical and chemical defects. The Wenzel equation was proposed for rough surfaces; it takes into account the change in surface energy caused by the growth of the phase contact area [32,58]:
cos θ a p = r cos θ Y
Equation (2) relates Young’s contact angle and the apparent contact angle to the roughness factor r; r is the ratio of the real surface area, Arough, to its flat projected area, Aflat; r = Arough/ Aflat. It follows from Equation (2) that, for surfaces with roughness factor r > 1, the value of θ a p > θ Y , if the material is hydrophobic ( θ Y > 90 degree) and θ a p < θ Y , if the material is hydrophilic ( θ Y < 90 degree).
To account for the change in surface energy resulting from the contact of the test liquid with the areas of a flat surface having different chemical nature, Cassie and Baxter proposed an equation containing the energy contribution of each specific surface area to the formation of the contact angle [33]:
cos θ C = f 1 cos θ 1 Y + f 2 cos θ 2 Y
where f 1 и f 2 are the fractions of the surface areas characterized by Young’s contact angles θ 1 Y и θ 2 Y , respectively.
The equations presented above are widely used to interpret the contact angles. Other equations (also mentioned in Figure 1) have important applications for a more detailed characterization of surface properties. The derivation and analysis of these equations can be found in reviews [31,59].

3. Experiment

3.1. Membranes

Commercial homogeneous Neosepta CMX, CSE, AMX and ACM membranes (manufacturer Astom, Tokyo, Japan); homogeneous CJMC-2, CJMC-3, CJMC-4, CJMA-2, CJMA-3 and CJMA-4 membranes (manufacturer Hefei Chemjoy Polymer Material, Hefei, China); and heterogeneous MK-40, MA-41 membranes (manufacturer Shchekinoazot, Pervomayskiy, Russia) and Ralex CMH PES, Ralex AMH PES membranes (manufacturer MEGA, Drahobejlova, Czech Republic) were studied. Some of the characteristics of the membranes are presented in Table 1.
The membranes underwent a standard pretreatment procedure [51]. Prior to surface characterization, the samples were equilibrated in 0.02 М NaCl.

3.2. Measurement of Membrane Surface Roughness

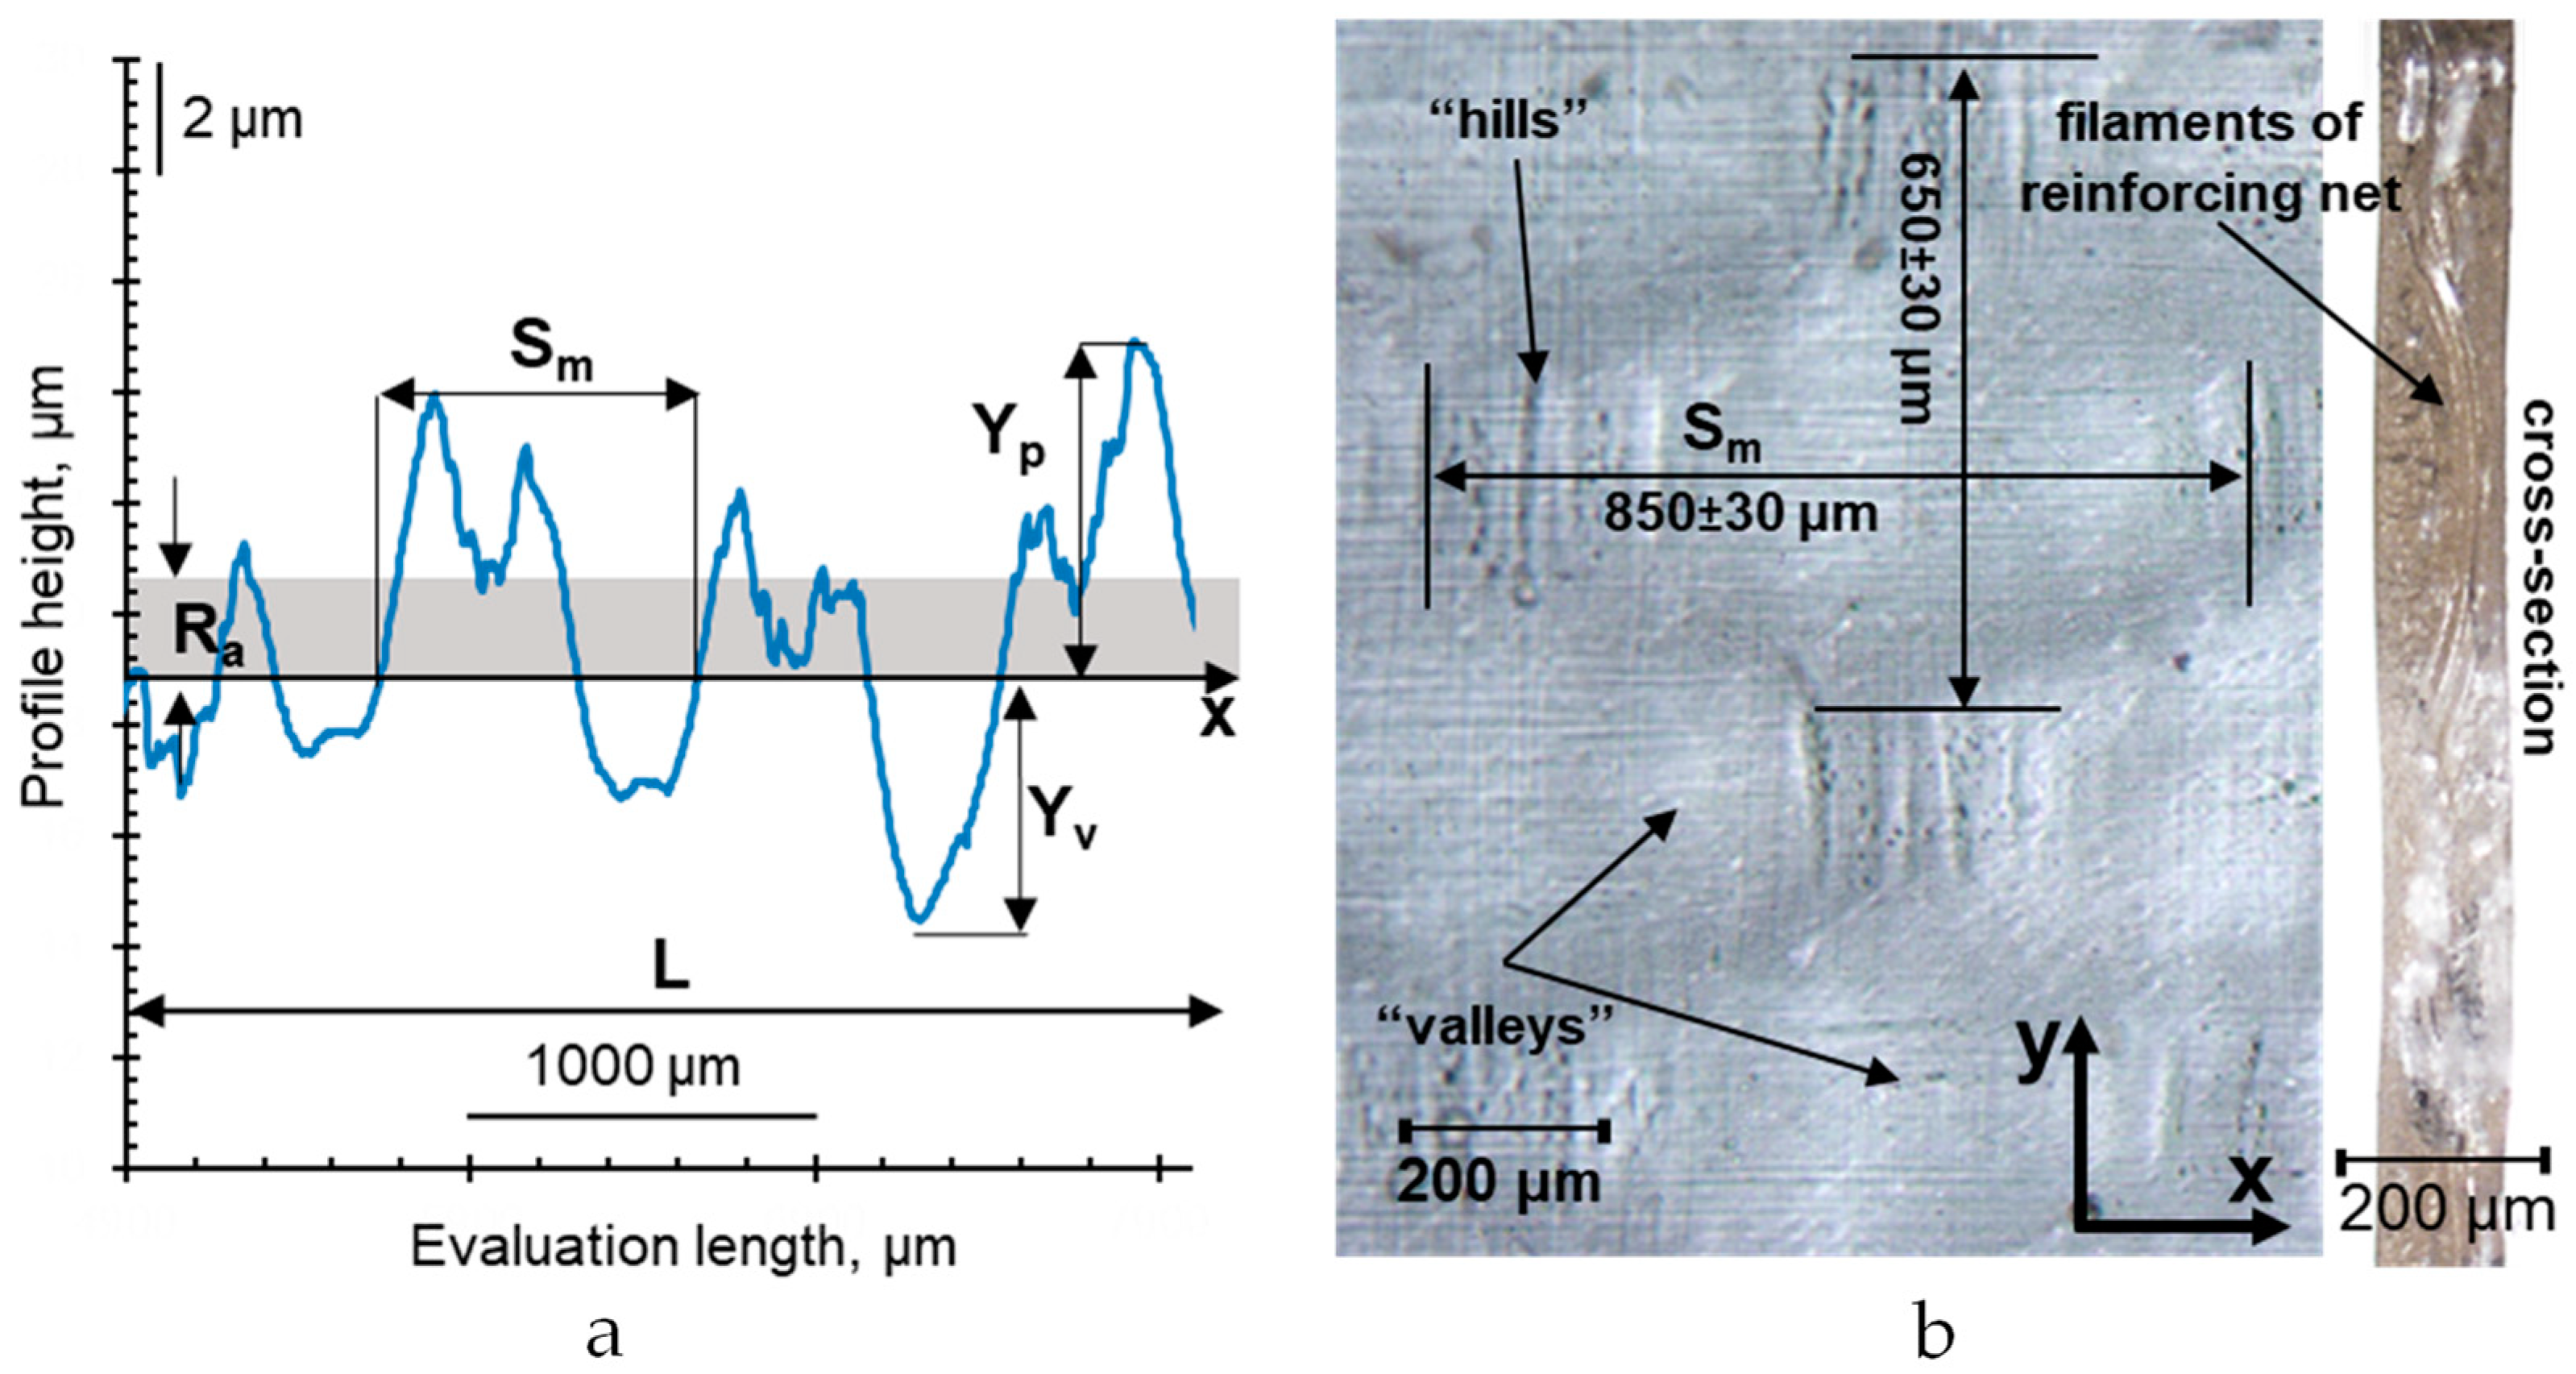
The roughness profile of the swollen membranes under study was characterized by the following parameters (Figure 3a) [68]:
  • Ra (arithmetic mean roughness) is the arithmetical mean deviation of the assessed profile within the evaluation length:
R a = 1 n i 1 n | y i |
where yi is the ordinate of the i point belonging to the profilogram within the evaluation length.
2.
Rt is the height distance between the deepest valley, Yv, and the highest hill, Yp, within the evaluation length (total height of profile):
R t = Y p m a x + Y v m a x
3.
Sm is the mean width of the profile elements (the average distance between the points of intersection of hills with the middle line within the evaluation length):
S m = 1 n i 1 n x S i
4.
r is the roughness factor is the ratio of the length of the real surface profile to the length of its geometrical projection. In this work, it was determined as the ratio of the average (found by 10 measurements) real roughness profile length, Lr, to its projection, L:
r = L r L
The value of Lr was found as the sum of distances Li between each two points on the profilogram by the formula:
L r = L i = ( x i + 1 x i ) 2 + ( y i + 1 y i ) 2
The above-mentioned surface roughness parameters of the swollen IEM were determined using a TR200 portable roughness meter. The measurements were made in 5000 μm sections in two mutually perpendicular directions: x and y along the surface of the IEM (Figure 3b). The obtained results within both directions were averaged to obtain the average size of the geometric heterogeneities of the IEM surface. The results of measurements along x and y may differ due to features of the manufacturing, sample preparation, swelling, etc. To avoid drying and deformation of the membranes, the sample under study was placed on a drop of an equilibrium solution. The number of measurements was equal to at least 3 on different surface areas of each sample. The accuracy of measurements was ±1%. The size of the studied area was commensurate with the diameter of the drop applied to the surface, so the information obtained characterizes the scale of heterogeneities on the surface, which can affect the contact angle.
The use of this method makes it possible to overcome some limitations of such high-resolution methods of surface morphology research as atomic force microscopy (AFM) and scanning electron microscopy (SEM), which are widely used to study IEM [60,69]. The scan size in AFM method, as a rule, does not exceed 100 × 100 microns [70]. In the case of heterogeneous and/or inert material-reinforced membranes, this area is often smaller than the geometric heterogeneity of the samples, and the results depend on the size of the scan [20]. SEM is most often used to study dry samples, whose the surface topography differs significantly from that of swollen membranes [71]. Low-vacuum SEM [72], which can be used without pre-drying the sample, yields large errors due to rapid changes in the surface parameters of swollen ionomers in contact with air. Optical microscopy makes it possible to measure the roughness parameters of IEM cross-sections of any length [69]. However, cutting samples leads to the disruption of membrane structure integrity (first of all, reinforcing fabric) and distortion of surface roughness parameters as compared to those existing in reality.

3.3. Visualization of Membrane Surface and Cross Sections

An optical microscope SOPTOP CX40M (Yuyao, Zhejiang, P.R. China) with a digital USB camera was used to visualize the surface and cross section of swollen ion-exchange membranes. The sample was placed on a drop of distilled water situated on the slide table. This prevented the sample from drying out during image acquisition.

3.4. Sessile Drop Method of Contact Angle Measurement

3.4.1. Optimized Protocol for Contact Angle Measurement

When using the sessile drop method, the measured contact angle can be influenced by some groups of factors presented in Table 2 [41,43,53,59,73,74]. The optimization of the experimental conditions and the components of the setup for determining the contact angles of IEMs with regard to these factors is presented in Section 3.4.2 and Section 3.4.3. The found optimal parameters for determining the contact angles of the surface of swollen ion-exchange membranes are presented in Table 2.
Figure 4 shows an experimental setup assembled taking into account the advantages and disadvantages of commercial installations used to measure contact angles, including Contact Angle Goniometer (Ossila Ltd., Sheffield, UK) [75], Optical Tensiometer Theta Lite (Biolin Scientific AB, Västra Frölunda, Sweden) [76], OCA 15 IEC (DataPhysics Instruments GmbH, Filderstadt, Germany) [77] and Drop Shape Analyzer DSA100S (KRÜSS GmbH, Hamburg, Germany) [78].
In accordance with the optimized conditions (Table 2), the measurements of the contact angle of the swollen IEM were performed as follows. The moist substrate (6) on the slide table (1) was connected to a reservoir (8) containing distilled water [79], to maintain the moist state of the sample. The dosing system allows varying the speed of applying a drop of the test liquid (distilled water, 2 μS/cm; pH 4.8 in the studied cases); the volume and the height from which the drop falls on the test sample can also be varied. The dosing needle (3) was placed at a distance of 4 mm from the surface of the test sample, and the speed of the syringe pump was set to 0.055 mL/min. The digital microscope (5) was tilted 1.5° to the horizontal surface of the slide table. Pre-equilibrated with the working solution, the swollen sample of IEM (9) was placed on a substrate and fixed with a pressure plate (10). A filter paper was used to remove excess liquid from the surface of the sample to prevent dripping due to excess moisture. The pump was started, a drop of distilled water was applied to the surface of the test sample, and video was recorded using a digital microscope. The frames extracted from the video at specified time intervals after the drop application were processed using the Rising View software. All measurements were performed at 25 ± 0.2 °C, with at least 20 measurements at different sites of the sample. The mean apparent value of the contact angle θap was determined using the t-criterion, and data outliers were controlled using the Grubbs criterion.

3.4.2. Minimizing Errors in Determining Contact Angles

Method of dosing drop. The technique of dosing drop determines the speed of drop formation, reproducibility of its volume and shape. As a rule, syringes with removable metal needles or mechanical liquid dispensers with plastic tips are used in installations for measuring contact angles; manual dosing or automated syringe pumps are applied [43,75,76,77,78]. Syringe pumps are highly accurate and avoid operator input into the droplet formation mode, but require the prior selection of optimal operating parameters. In this experiment, a DIXION syringe pump with a 50 mL syringe, which was connected by a tube to a metal needle fixed in the foot of a tripod, was used.
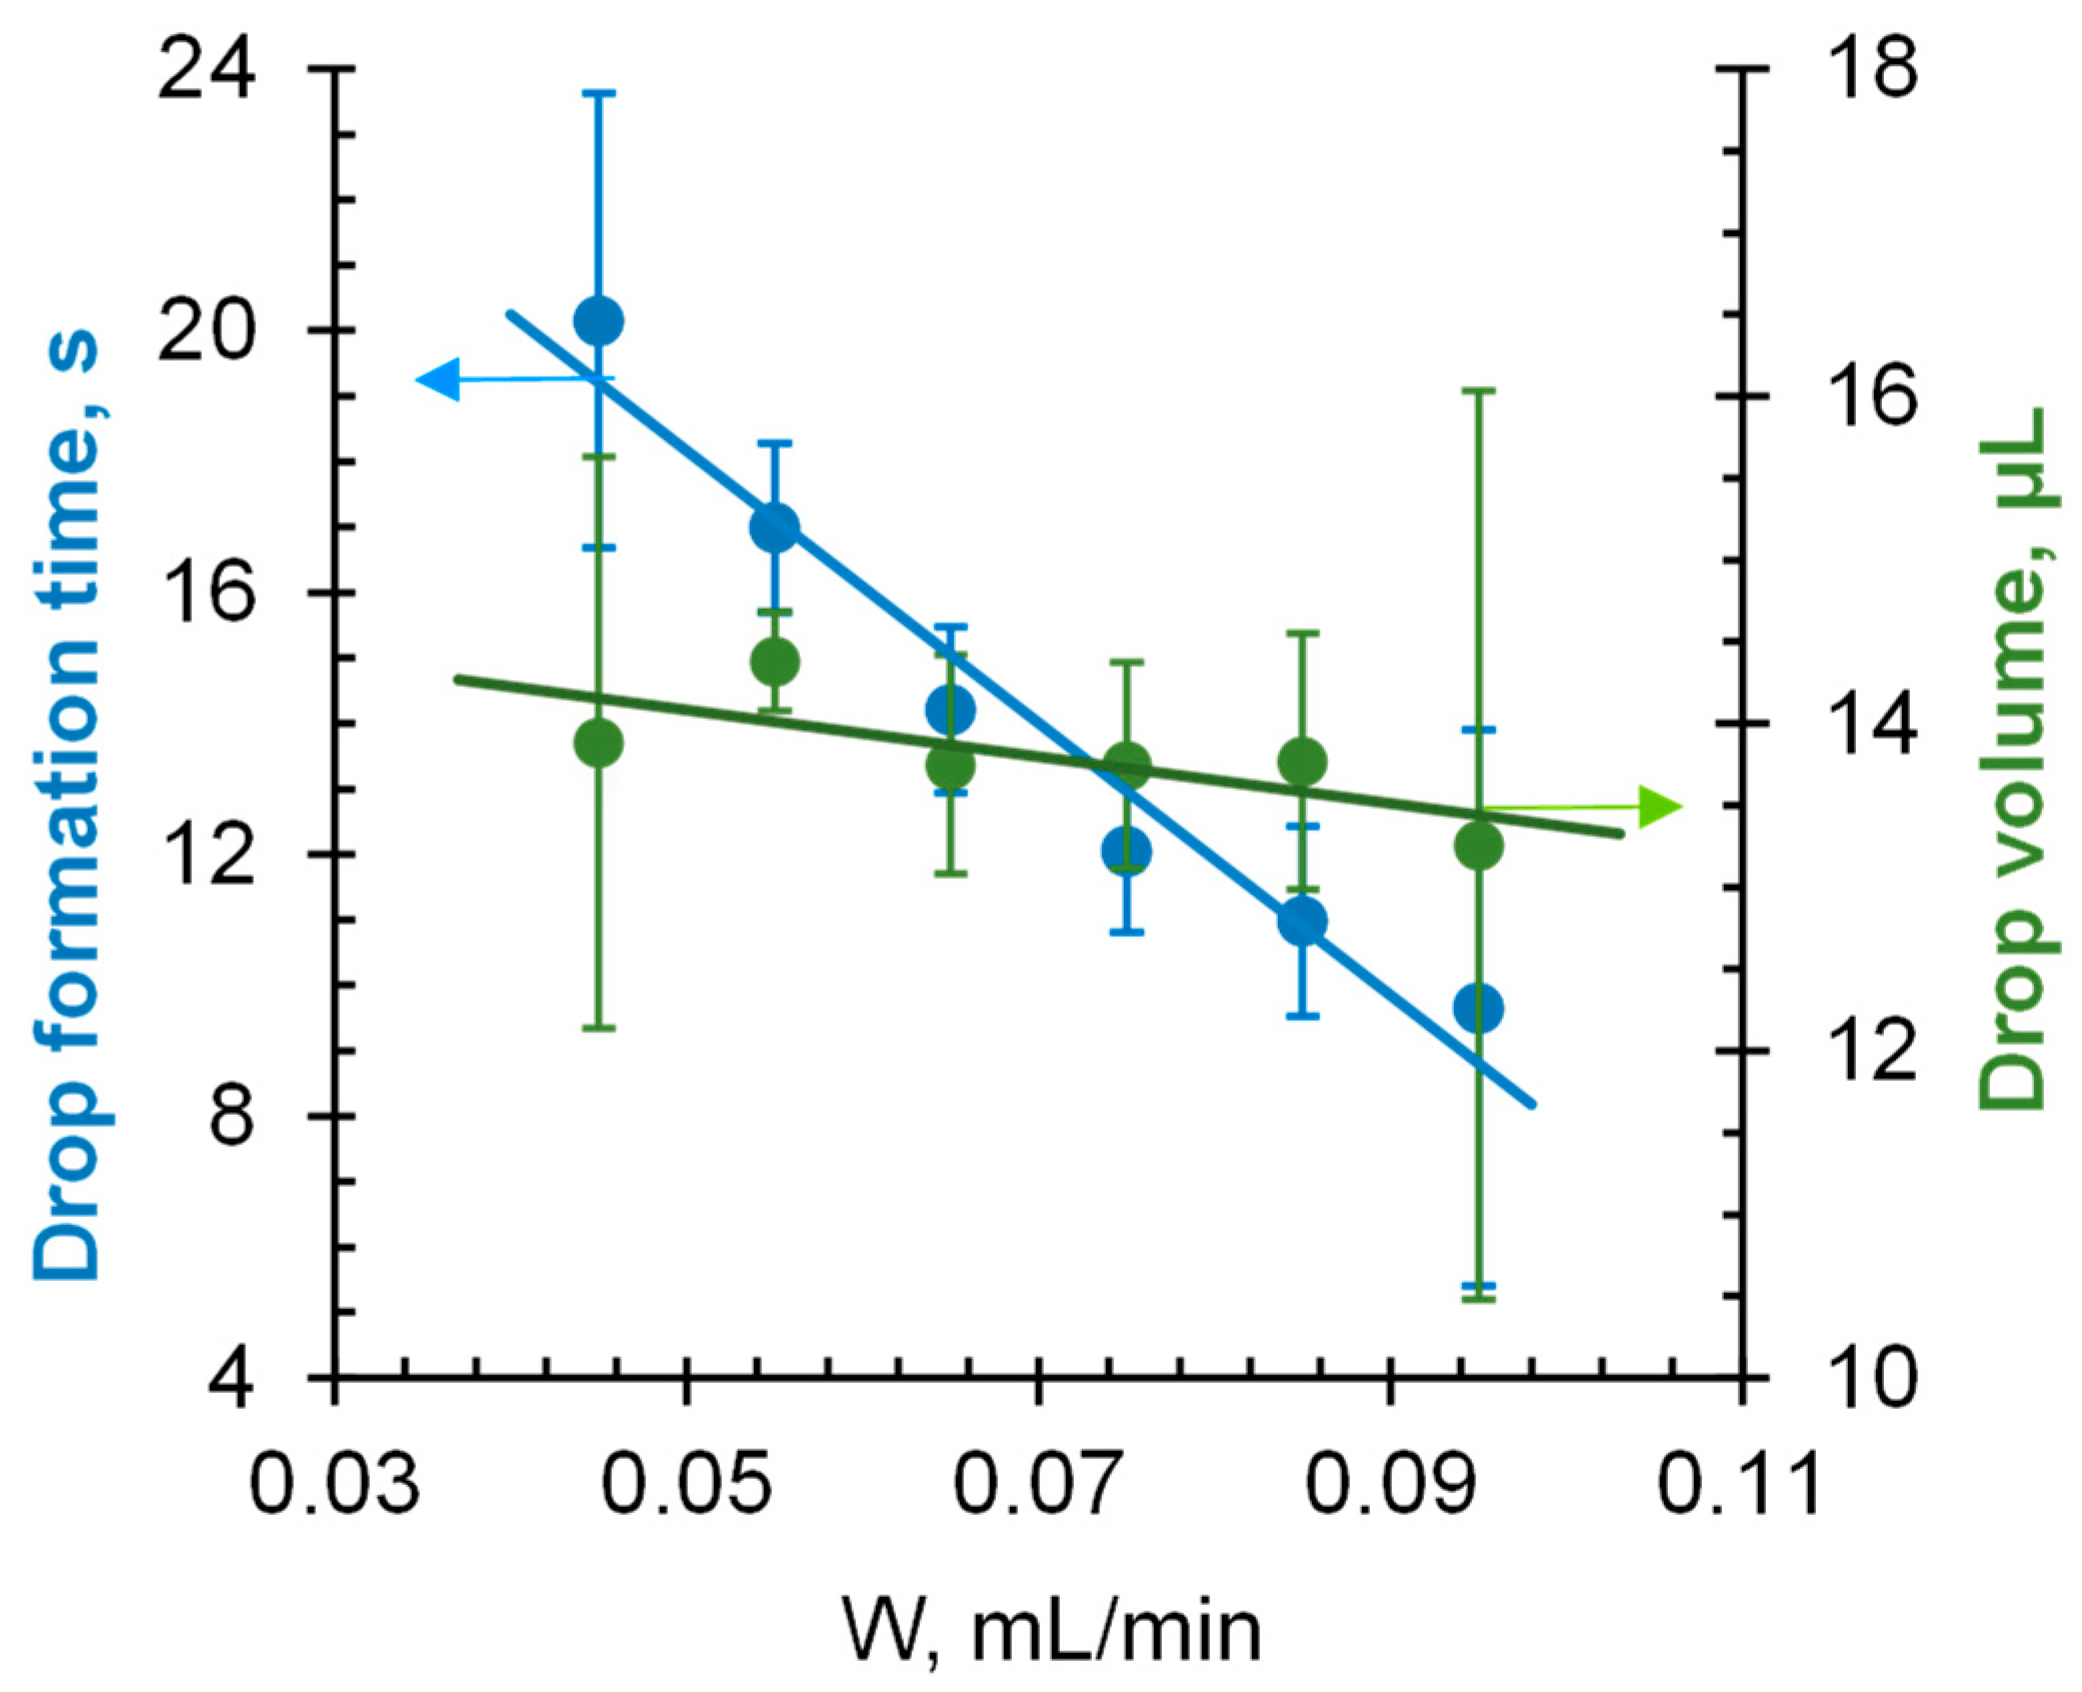
Drop volume. It is known [41,43] that the droplet volume should not be too small, since small droplets are susceptible to vibration, evaporation, and optical errors. In addition, the larger the ratio of the droplet base size to the average size of geometric or chemical inhomogeneities of the IEM surface, the more reproducible results can be obtained [52,53]. At the same time, the larger the droplet, the more gravity distorts its shape [41]. The typical droplet volume range for the sessile drop method is 3 to 20 µL [41]. To ensure such volumes and the formation of axisymmetric droplets [53], we used a dosing metal needle cut perpendicular to its central axis (pst3 tip type). In accordance with the recommendations presented in [43], the tip of the needle was rubbed with paraffin before the measurements so that the material from which the needle was made would not affect the results. The time of drop formation must be constant during the measurements, since this parameter directly affects the volume of the drop, which is expected to be the same for each drop. Accordingly, the confidence interval when determining this time experimentally must be minimal. Several needles with inner diameters of 280 to 1000 μm and outer diameters of 400 to 1300 μm were tested. The lowest relative error in drop volume and drop formation time measurements was obtained for the needle with the inner and outer diameters of 600 and 800 μm (size 20G), respectively. The drop volume and drop formation time as functions of the drop dosing rate for this needle are shown in Figure 5.
The relative error of the values increases at the extreme limits of the range of W values under study (Figure 5). At small W values, the drop formation time and volume can vary significantly due to the increased effect of random factors (random vibrations of the setup, air currents) on a large unstable drop attached to the needle. At great W values, it is the effect of random changes in the rate of water supply to the needle, which is increased; in addition, the shape of the drop is distorted under the action of gravity. A minimum relative error of <0.5% for drop volume (and <1.5% for drop formation time) is achieved at a volume rate of 0.055 mL/min, which corresponds to a drop volume of 14.4 µL.
Image registration. The digital microscope was tilted 1.5° to the horizontal surface of the slide table to obtain a clarity image of the drop profile. This inclination corresponds to those used in commercial installations and does not lead to significant errors when measuring the contact angle [74]. The location of the droplet in the center of the view captured by the microscope provides a more accurate determination of the baseline and interfaces of the liquid and solid phases with the gas phase.
Background light was provided by an LED source with a diffuser, which was placed on the slide table behind the sample and directed at the drop. The lighting was chosen so as to minimize the blurring of the three-phase contact boundaries and optical distortions.
The methods of image processing have been the subject of many years of scientific development. These methods have a great influence on the result of determining the contact angle, with the accuracy depending on the image resolution and edge detection method. There are many approaches for determining the contact angle in an image based on the droplet profile. The most commonly used methods in commercial software are droplet profile fitting using the Young–Laplace equation [80], circle and ellipsoidal droplet model [81] or polynomial functions [82]. An assessment of the existing image processing methods for digital evaluation of the contact angle is presented in Ref. [54]. One of the common semi-automatic methods of θap determination is the fitting method, where the droplet profile is fitted to a geometric figure (ellipse, circle) (Figure 6), the borders of which run along the “liquid–gas” phase section. Then, θap is measured by aligning a tangent line to the drop profile at the three-phase contact point. In this paper, RisingView is used as image acquisition software. This method does not require any additional commercial software; it is very simple and rather reproducible (∆ < 5%), despite the semi-automatic regime. The results of the contact angle determination by this method can be verified according to the error detection guidelines [53,74].
Distance between the needle and the sample. It is known [53] that obtaining a stable droplet shape requires minimizing the kinetic energy input to the droplet during the dispensing process. This is possible when the dosing needle is positioned at a minimum distance from the sample under study; however, the latter should exceed the droplet diameter: the hanging drop must not touch the surface of the sample [41]. The maximum diameter of the drop hanging at the needle tip in all our measurements was ≈ 3.5 mm. To determine how the distance between the tip of the needle and the sample affects the contact angle, we measured this characteristic for some materials often used as references [74] at various distances between the sample and the needle. The results are shown in Table 3. In accordance with the recommendations presented in [43], the surface of the standard samples was polished and cleaned of adsorbed substances before the measurements to prevent distortions caused by surface roughness or associated with the generation of static electricity. Between measurements, the surface of the samples was gently wiped with a soft hydrophilic cloth, and the remained droplets were blown off with an air stream.
It follows from the data presented in Table 3 that the measured values of θap are close to the literature values. When the distance from the studied sample to the dosing needle was increased in the range from 4 to 6 mm, the difference between the measured and reference contact angles was no more than 3%. However, the error in determining the contact angle increases as the height of drop fall increases. As expected, the maximum reproducibility of results was provided by the variant in which the dosing needle is placed at a minimum distance from the examined surface, but does not touch the drop lying on the surface of the sample.

3.4.3. Minimizing Errors in Determining Contact Angles

As mentioned in the Introduction, semi-solid gel-like IEMs are difficult objects to measure contact angles. Their surface is nanoporous, geometrically and chemically heterogeneous, capable of restructuring upon contact with a liquid. The humidity of the IEM during measurements can be ensured by using a wet substrate connected by a wick to a vessel filled with water (Section 3.4.1, Figure 4b).
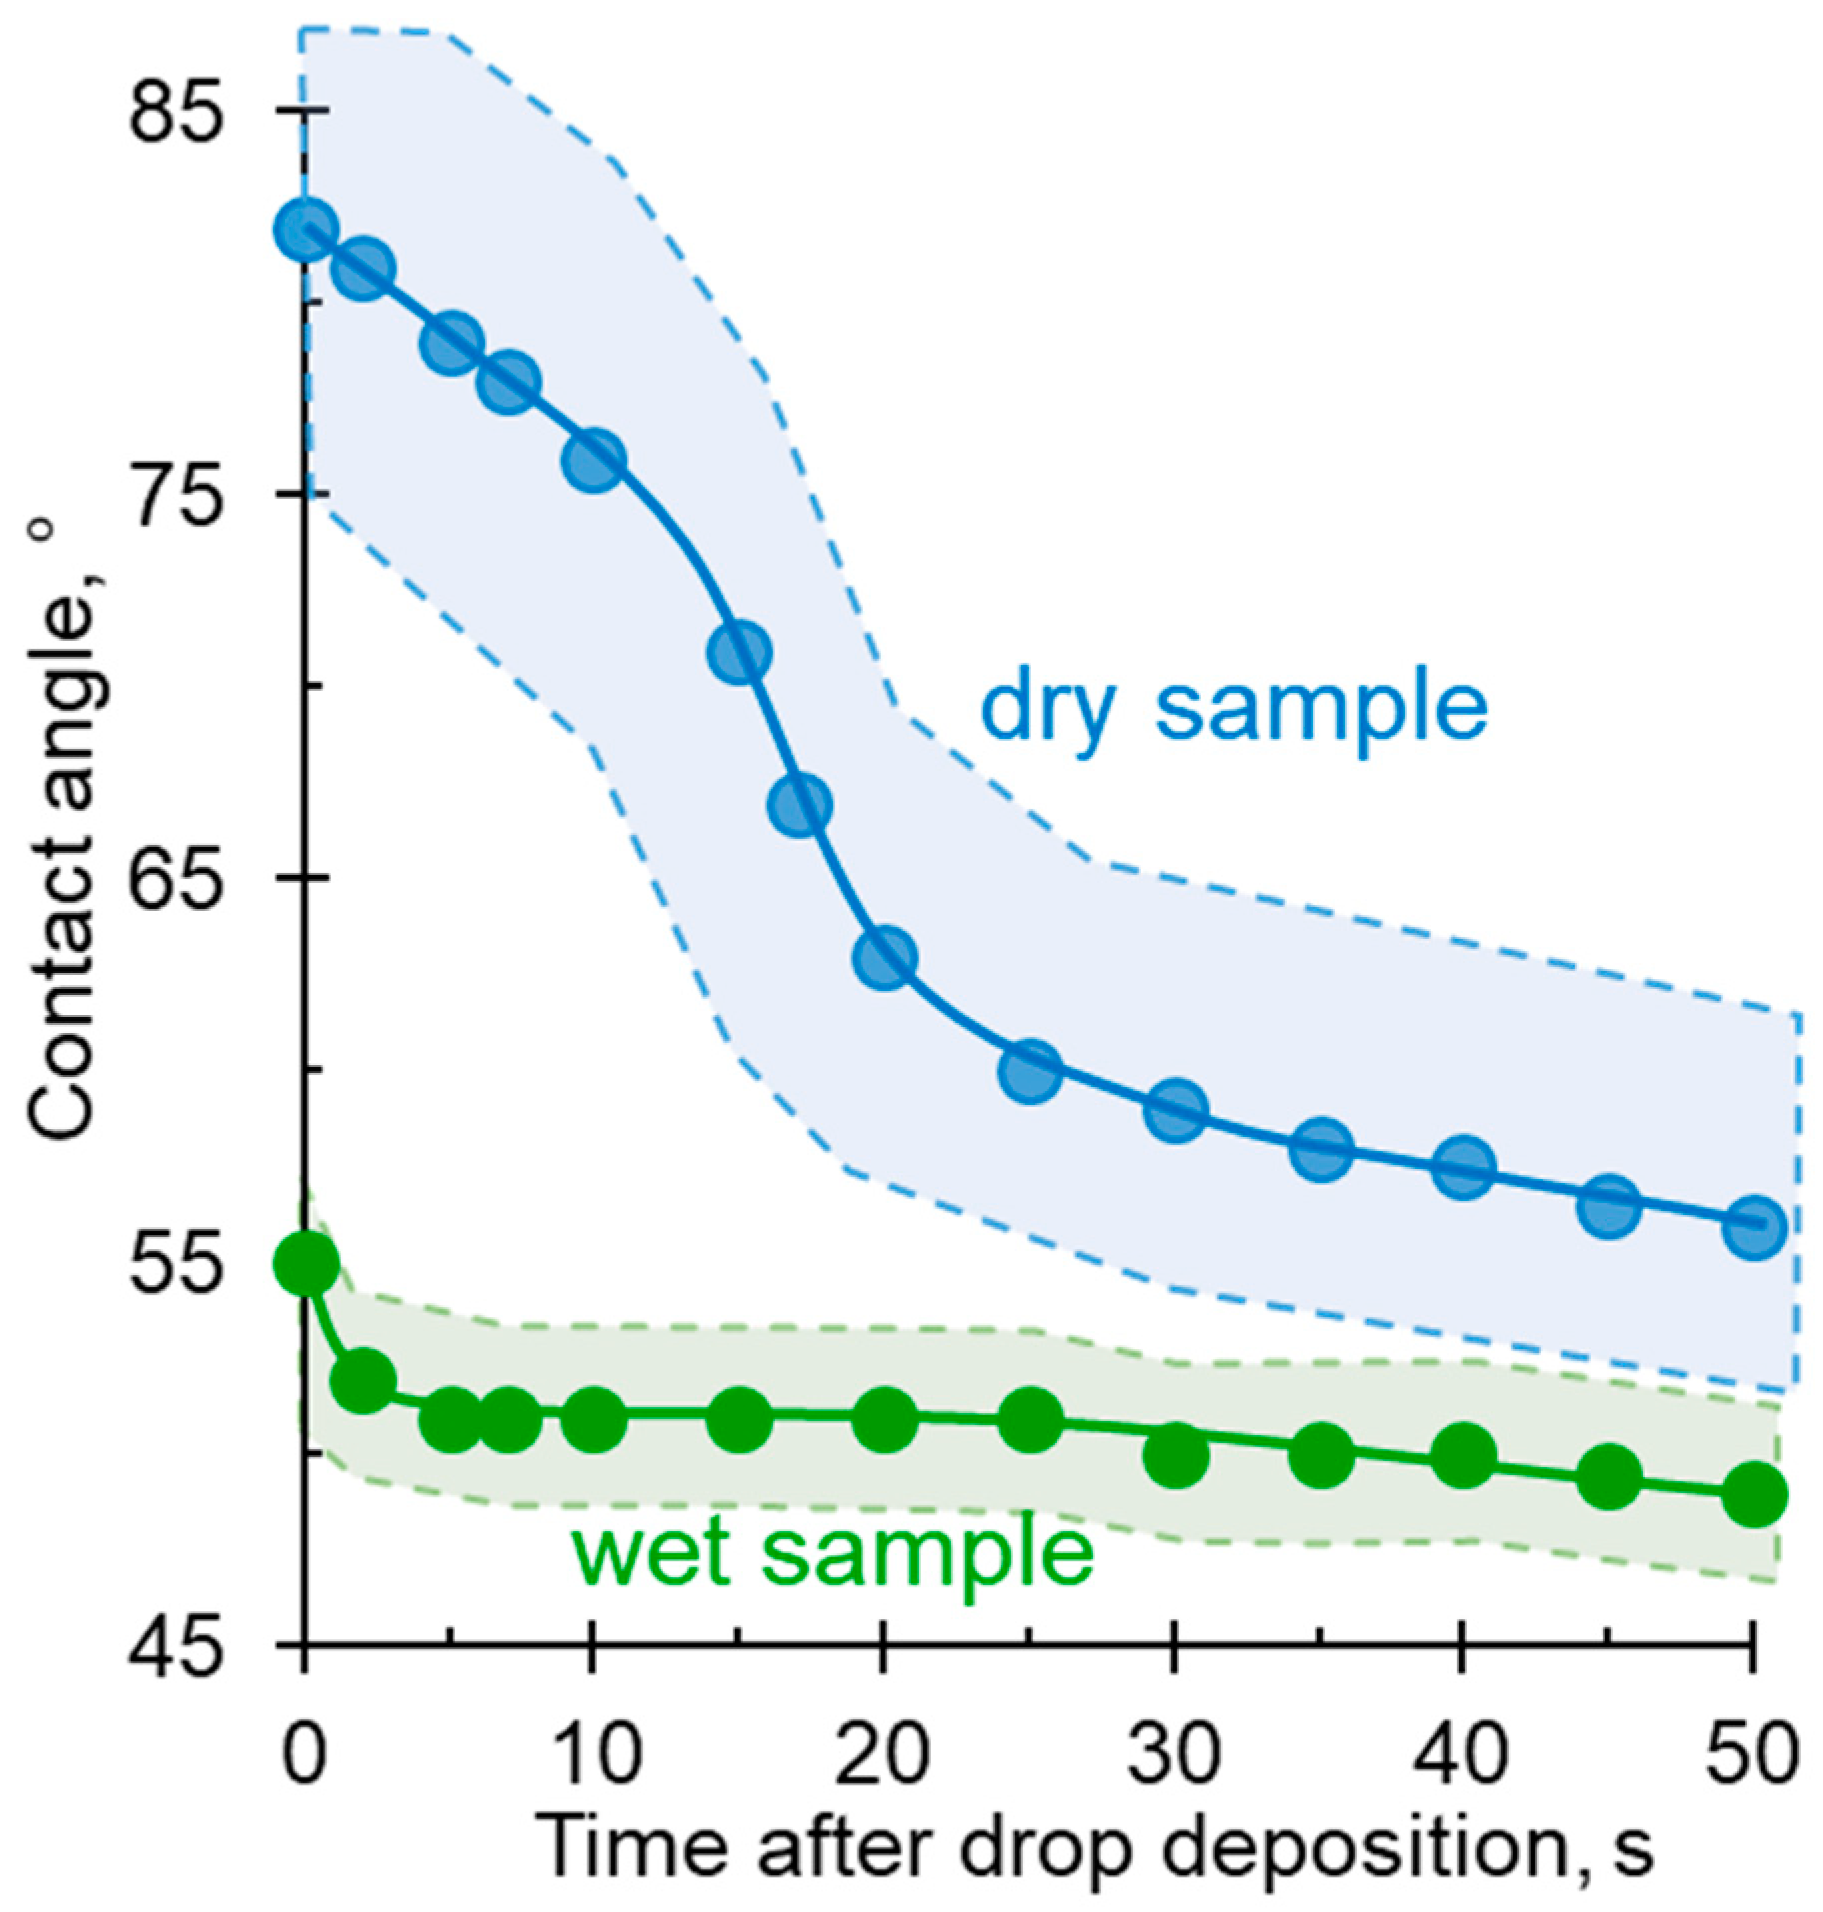
Figure 7 and Figure 8 show that, when a drop of water is applied to the surface of a wet membrane, the contact angle is already set after 5 s. The value of θap slightly decreases in time in the interval from 10 s to 50 s (51 to 49 deg); at the same time, the drop size noticeably decreases due to its drying. In the case of a drop falling on a dry membrane, the contact angle decreases much faster and the droplet size decreases considerably, because, in addition to its drying, water is also absorbed in the membrane.
Thus, the use of dry membranes does not allow obtaining adequate contact angle results. Keeping the IEM wet makes it possible to obtain reasonable values of θap, with the recommended time interval for measurements being from 5 to 15 s (Figure 8). An important prerequisite for such measurements is also the use of a pressure plate (Figure 4b), which prevents the membrane from deforming during measurement and improves the contact between the membrane and the wet substrate. According to our estimates, the use of the pressure plate reduces the relative measurement error from 15% to less than 5%.

4. Results and Discussion

4.1. Membranes with Identical Characteristics of Both Surfaces: Influence of Geometrical and Chemical Heterogeneities

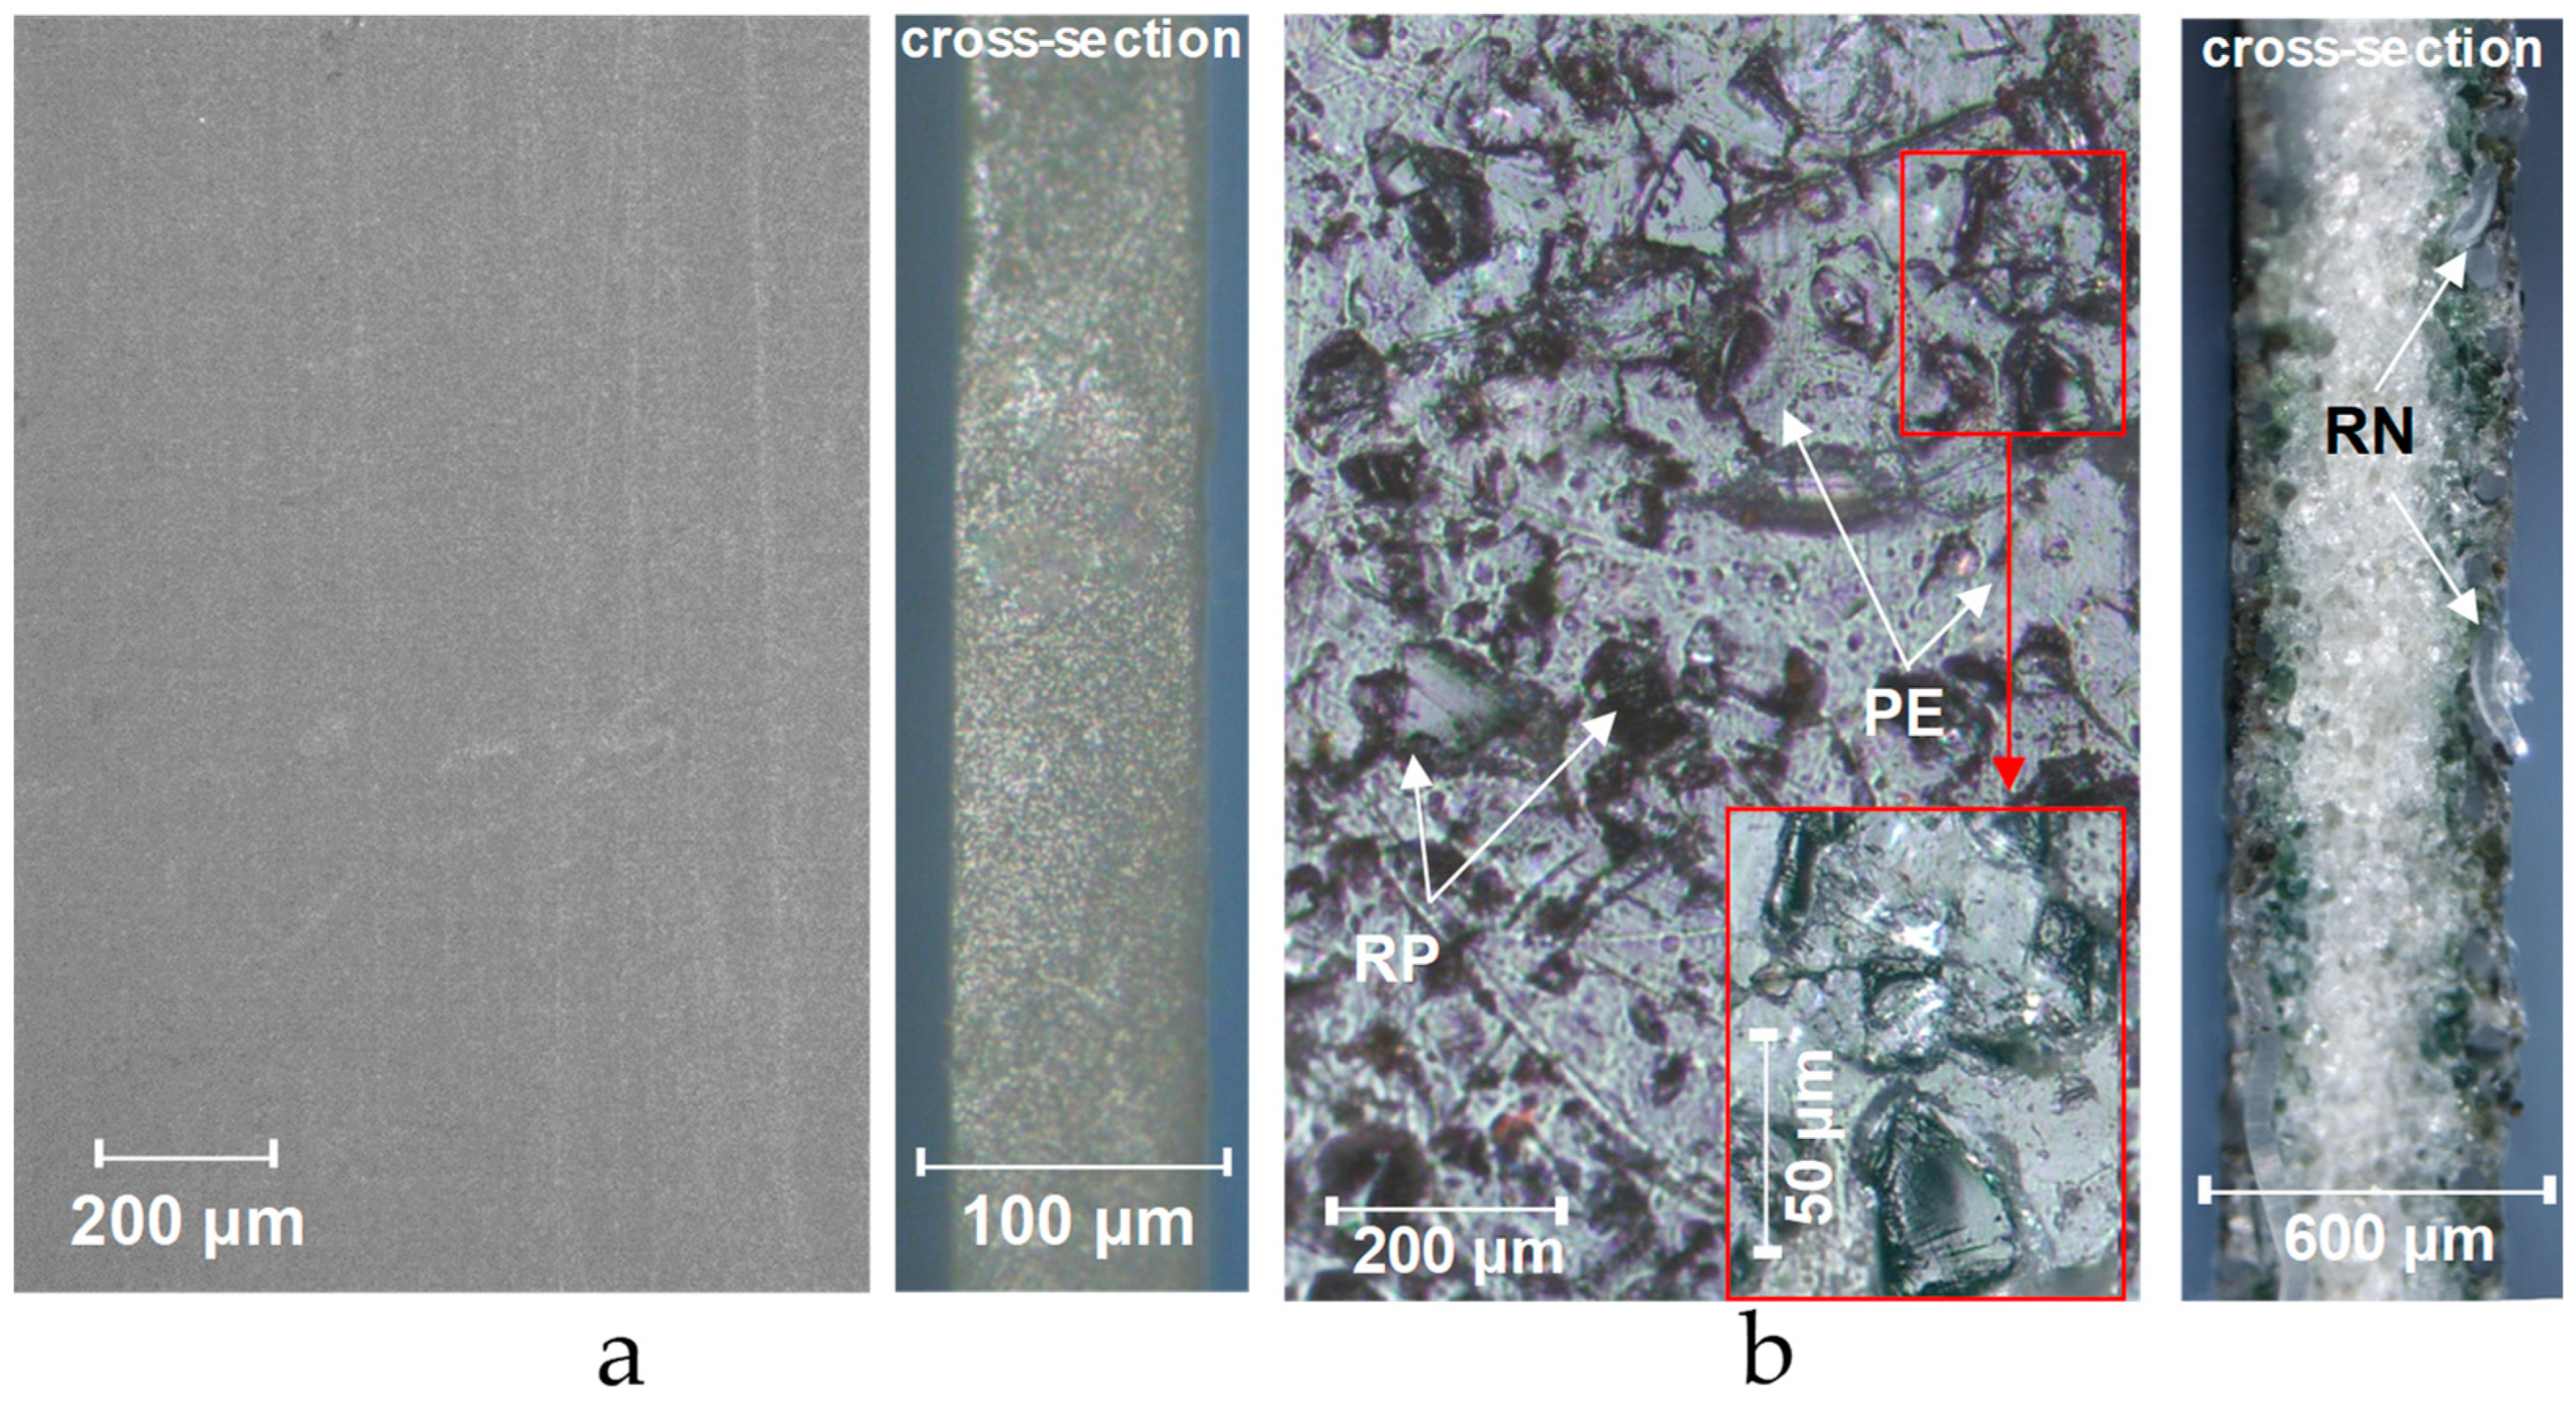
The optical images of the surfaces and cross-sections of some IEMs are shown in Figure 9. Examples of surface profilograms are shown in Figure 10. The obtained values of contact angles and roughness parameters are summarized in Table 4.
CJMC-4, CJMA-4 and Neosepta CSE membranes contain no reinforcing material. Their surface topography is, most likely, mainly determined by defects in the substrate on which the copolymerization of the monomers takes place (casting method [64,66]). These membranes have the smallest deviations of the r value from unity.
Swollen homogeneous Neosepta CMX, AMX and ACM membranes have an undulating surface; the maximum distance between adjacent hills (parameter Sm, Table 4) is reached for the AMX membrane and does not exceed 880 ± 240 µm. The profile height (Rt) on average does not exceed 29.3 ± 2.5 μm. Similar parameters for the CMX and AMX membranes were obtained by Mareev et al. [69]. It is noteworthy that the distance between the deepest valley and the highest hill (Rt) in the CMX is almost twice as big as in the AMX membrane (Figure 10a,b, Table 4), despite the fact that both membranes are made with the same paste method [84]. This method consists of applying a paste composed of monomers, polymerization initiators and polyvinyl chloride (PVC) powder to a PVC fabric for copolymerization. Sulfonic acid (CMX) or ammonium groups (AMX) are then introduced into the resulting membrane.
The surface of membranes made by the paste method is electrically homogeneous, and the size of polymer inert binder particles protruding on the surface does not exceed 100 nm, and this binder appears on the surface only after operation of such membranes in an electric field [85]. The difference in roughness parameters seems to be due to the fact that the exchange capacity (concentration of fixed groups) of CMX is 30% higher than that of AMX (Table 1). The hydration of these fixed groups provides a stronger swelling of the CMX ion-exchange material. The reinforcing fabric located near one of the membrane surfaces restrains the increase in linear dimensions of this (and other similar membranes) in length and width [69]. The increase in the volume of the ion-exchange material during swelling leads to the bending of the opposite surface, near which there is no reinforcing fabric. Since the exchange capacity of CMX is larger and, accordingly, the swelling of this membrane material is stronger, it has a more pronounced roughness than AMX in the swollen state. At the same time, in the dry state, both IEMs have the same roughness parameters [69].
As one would expect, the CMX membrane, which has a higher concentration of fixed groups (Table 1), shows a lower θap value compared to the AMX membrane (Table 4). The CJMA-4 membrane has the highest θap value (Table 4); this membrane is characterized by the lowest exchange capacity and it is made of a rather hydrophobic fluorine-containing material (Table 1).
Heterogeneous membranes MK-40, MA-41, Ralex AMH-PES (as well as Ralex CMH-PES, whose characteristics are given in Table 5) are made by hot rolling of milled ion-exchange resin and inert binder (polyethylene), and then both sides are pressed with a reinforcing fabric made of polymer threads [86]. The electrical heterogeneity of the surface of these membranes is mainly determined by the release of the ion-exchange resin granules protruding over the smoother polyethylene sections. In the case of MK-40 and MA-41, the average diameter of these granules, dav, ranges from 5 μm [87] to 19 μm [88]; the average distance between conductive surface areas, lav, varies from 9 μm [88,89] to 20 μm [62] and even 30 μm [87]; the protrusion of granules above the surface does not exceed 3 μm [62,89]. When fabricating Ralex AMH-PES and MA-41, as well as Ralex CMH-PES and MK-40, similar materials are used (Table 1), but in the case of Ralex membranes, the resin grind is more homogeneous: dav =5 μm [90]–10 μm [88]; lav =5 μm [88]. As a result, the fraction of the conductive surface that contains hydrated fixed groups ranges from 0.27 [88] to 0.60 [90] in the case of Ralex AMH PES, whereas for MA-41 this parameter ranges from 0.15 [90] to 0.23 [62]. A higher proportion of hydrophilic material predetermines the lower values of the contact angle of the Ralex AMH PES membrane compared to MA-41 (Table 4). The situation is similar when comparing Ralex CMH-PES and MK-40.
The regularly repeated hills and valleys on the surface of all heterogeneous membranes recorded by profilometry have Sm values (Table 4), which coincide with the distances between the intersections of reinforcing fabric filaments (Figure 10c,d). The Rt value for heterogeneous membranes does not exceed 37.9 ± 7.1 µm. We (Figure 9b) and other researchers [91,92] sometimes observe threads coming to the surface in the places of intersections of reinforcing fabric filaments.
It is important to note that for all investigated membranes, the length of the contact line scanned with the profilometer does not exceed 1% compared to its projection (Parameter r, Table 4). Thus, the increase in the real surface profile compared to its projection is insignificant. The average length of elementary regions of all kinds of electrical and geometric heterogeneities on the surface of the swollen IEMs under study (lh) turns out to be 5–30 times lower than the diameter of the sessile drop base (ddr = 4000–7000 µm). Hence, these values satisfy the known requirements [52,93], according to which, in order to correctly measure the contact angle of inhomogeneous surfaces, the ddr/lh ratio must be > 3.

4.2. Membranes with Unequal Characteristics of Both Surfaces

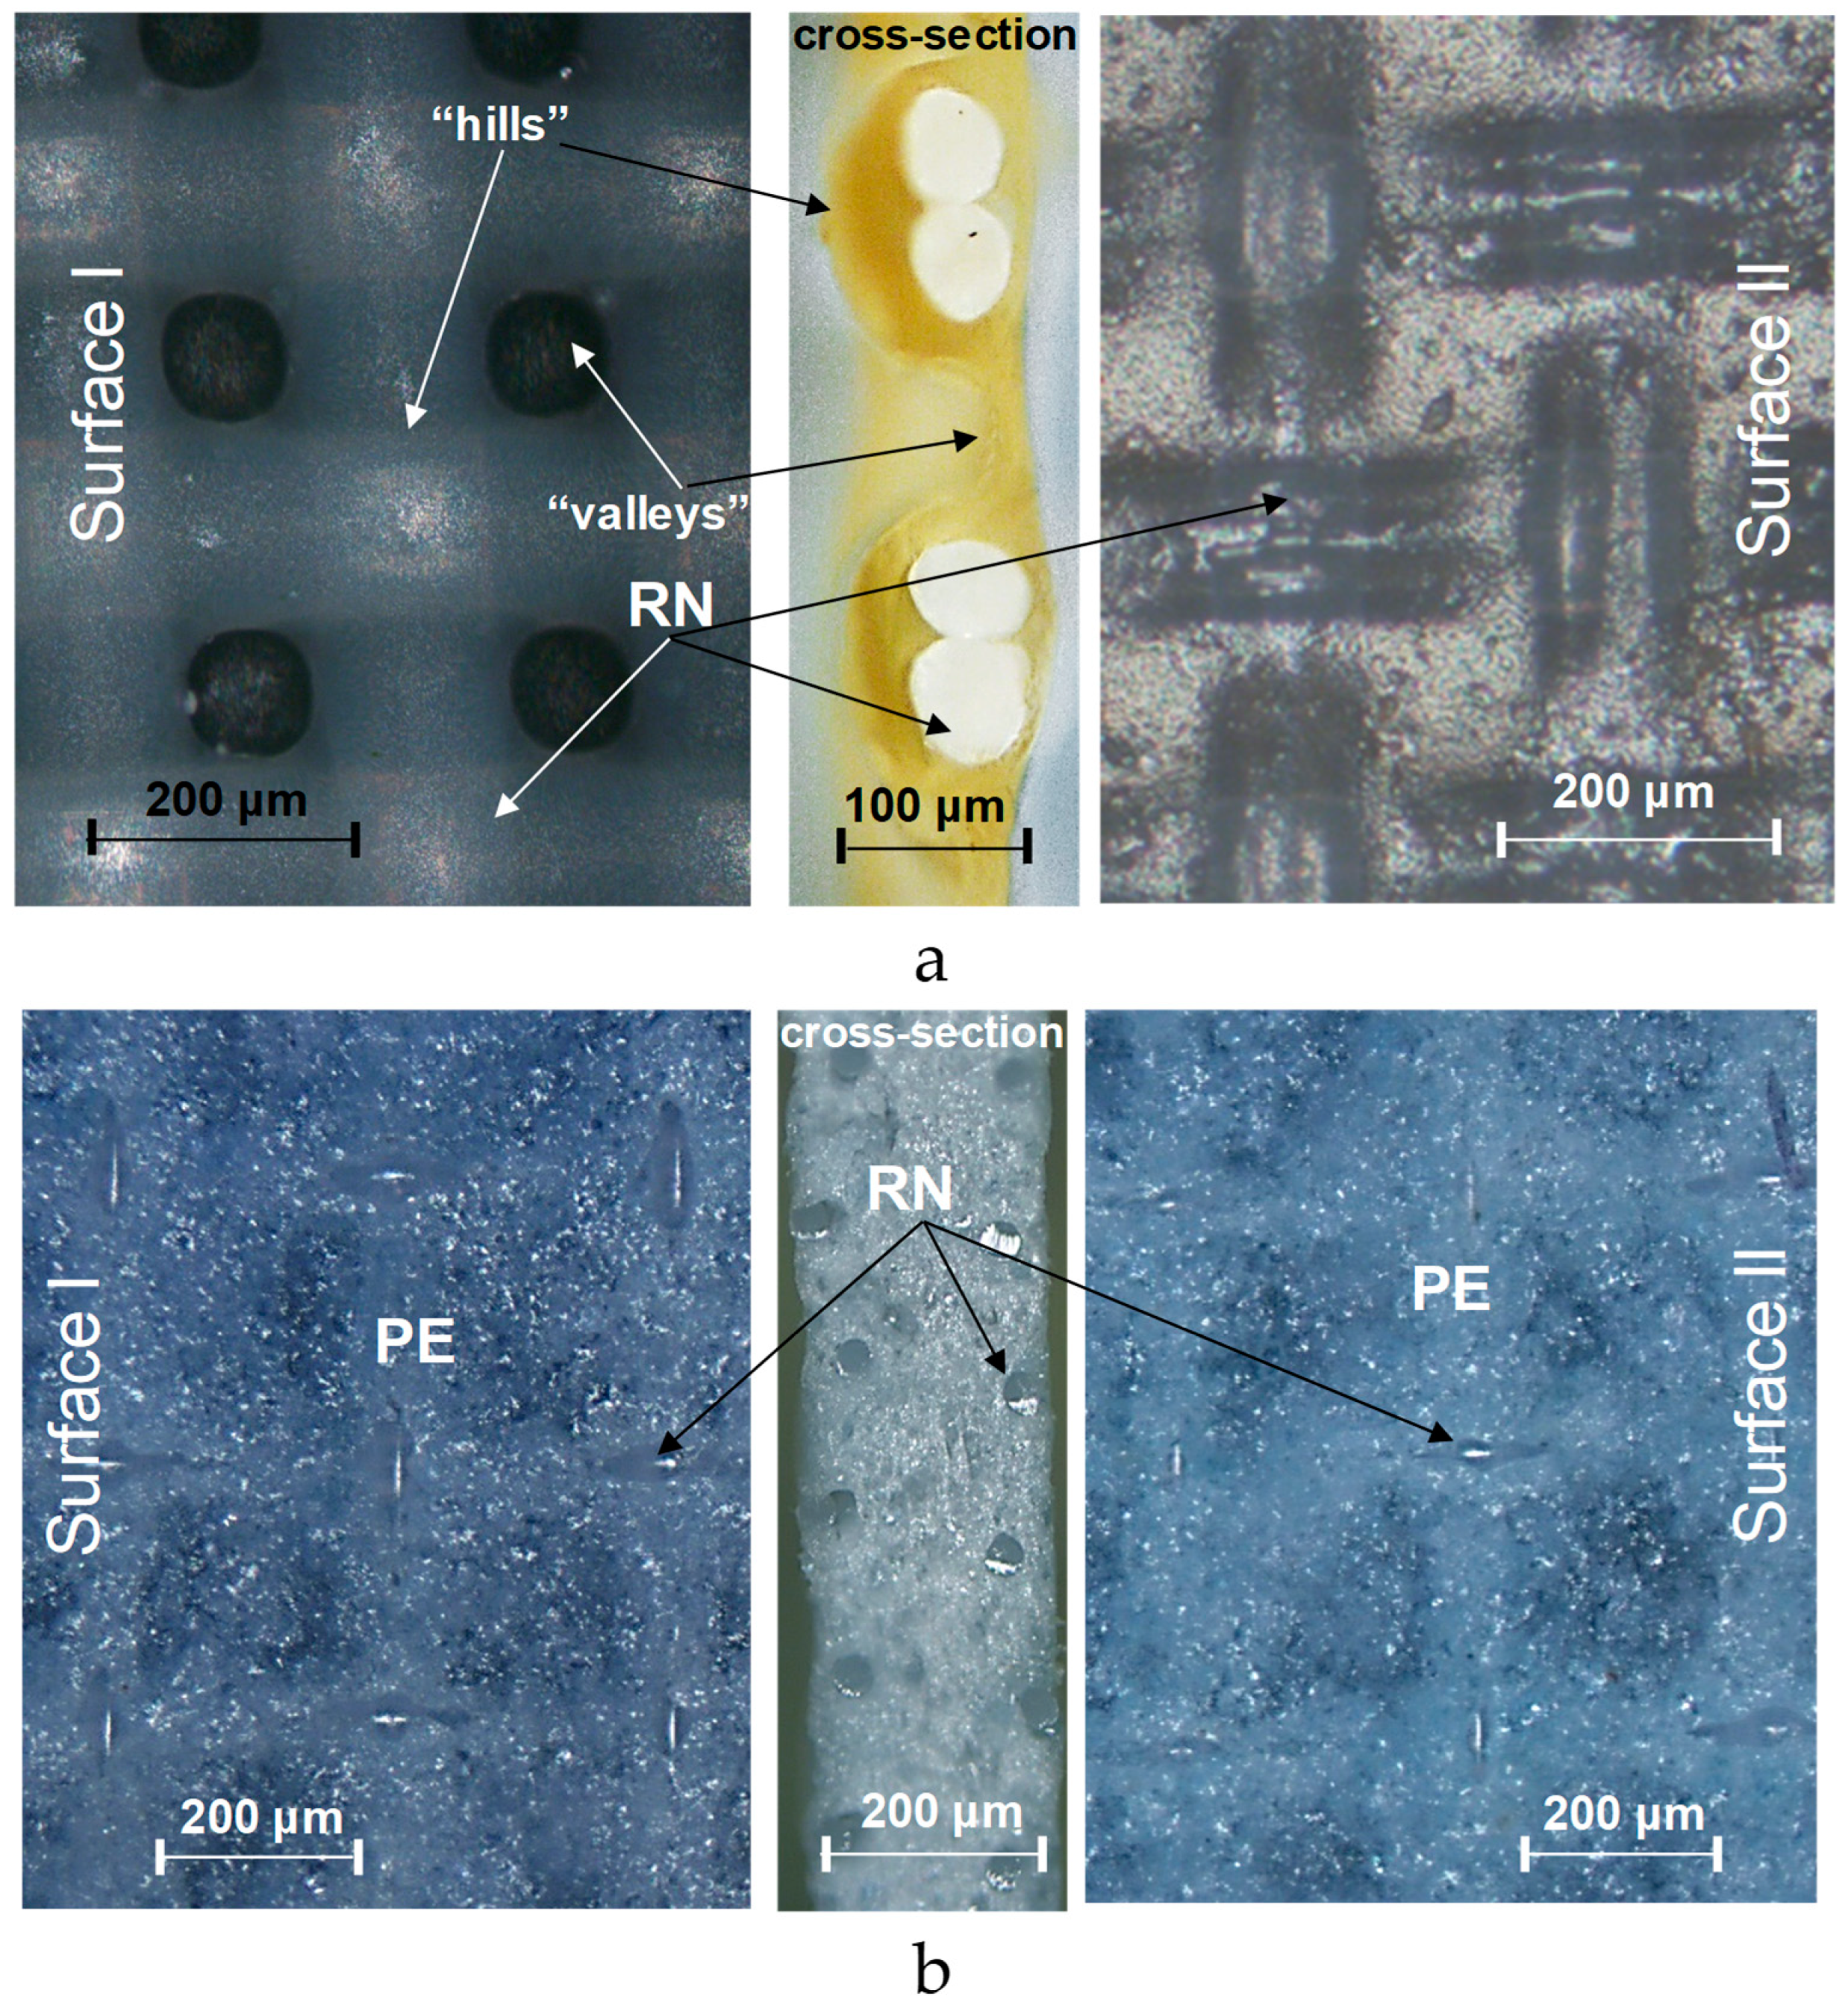
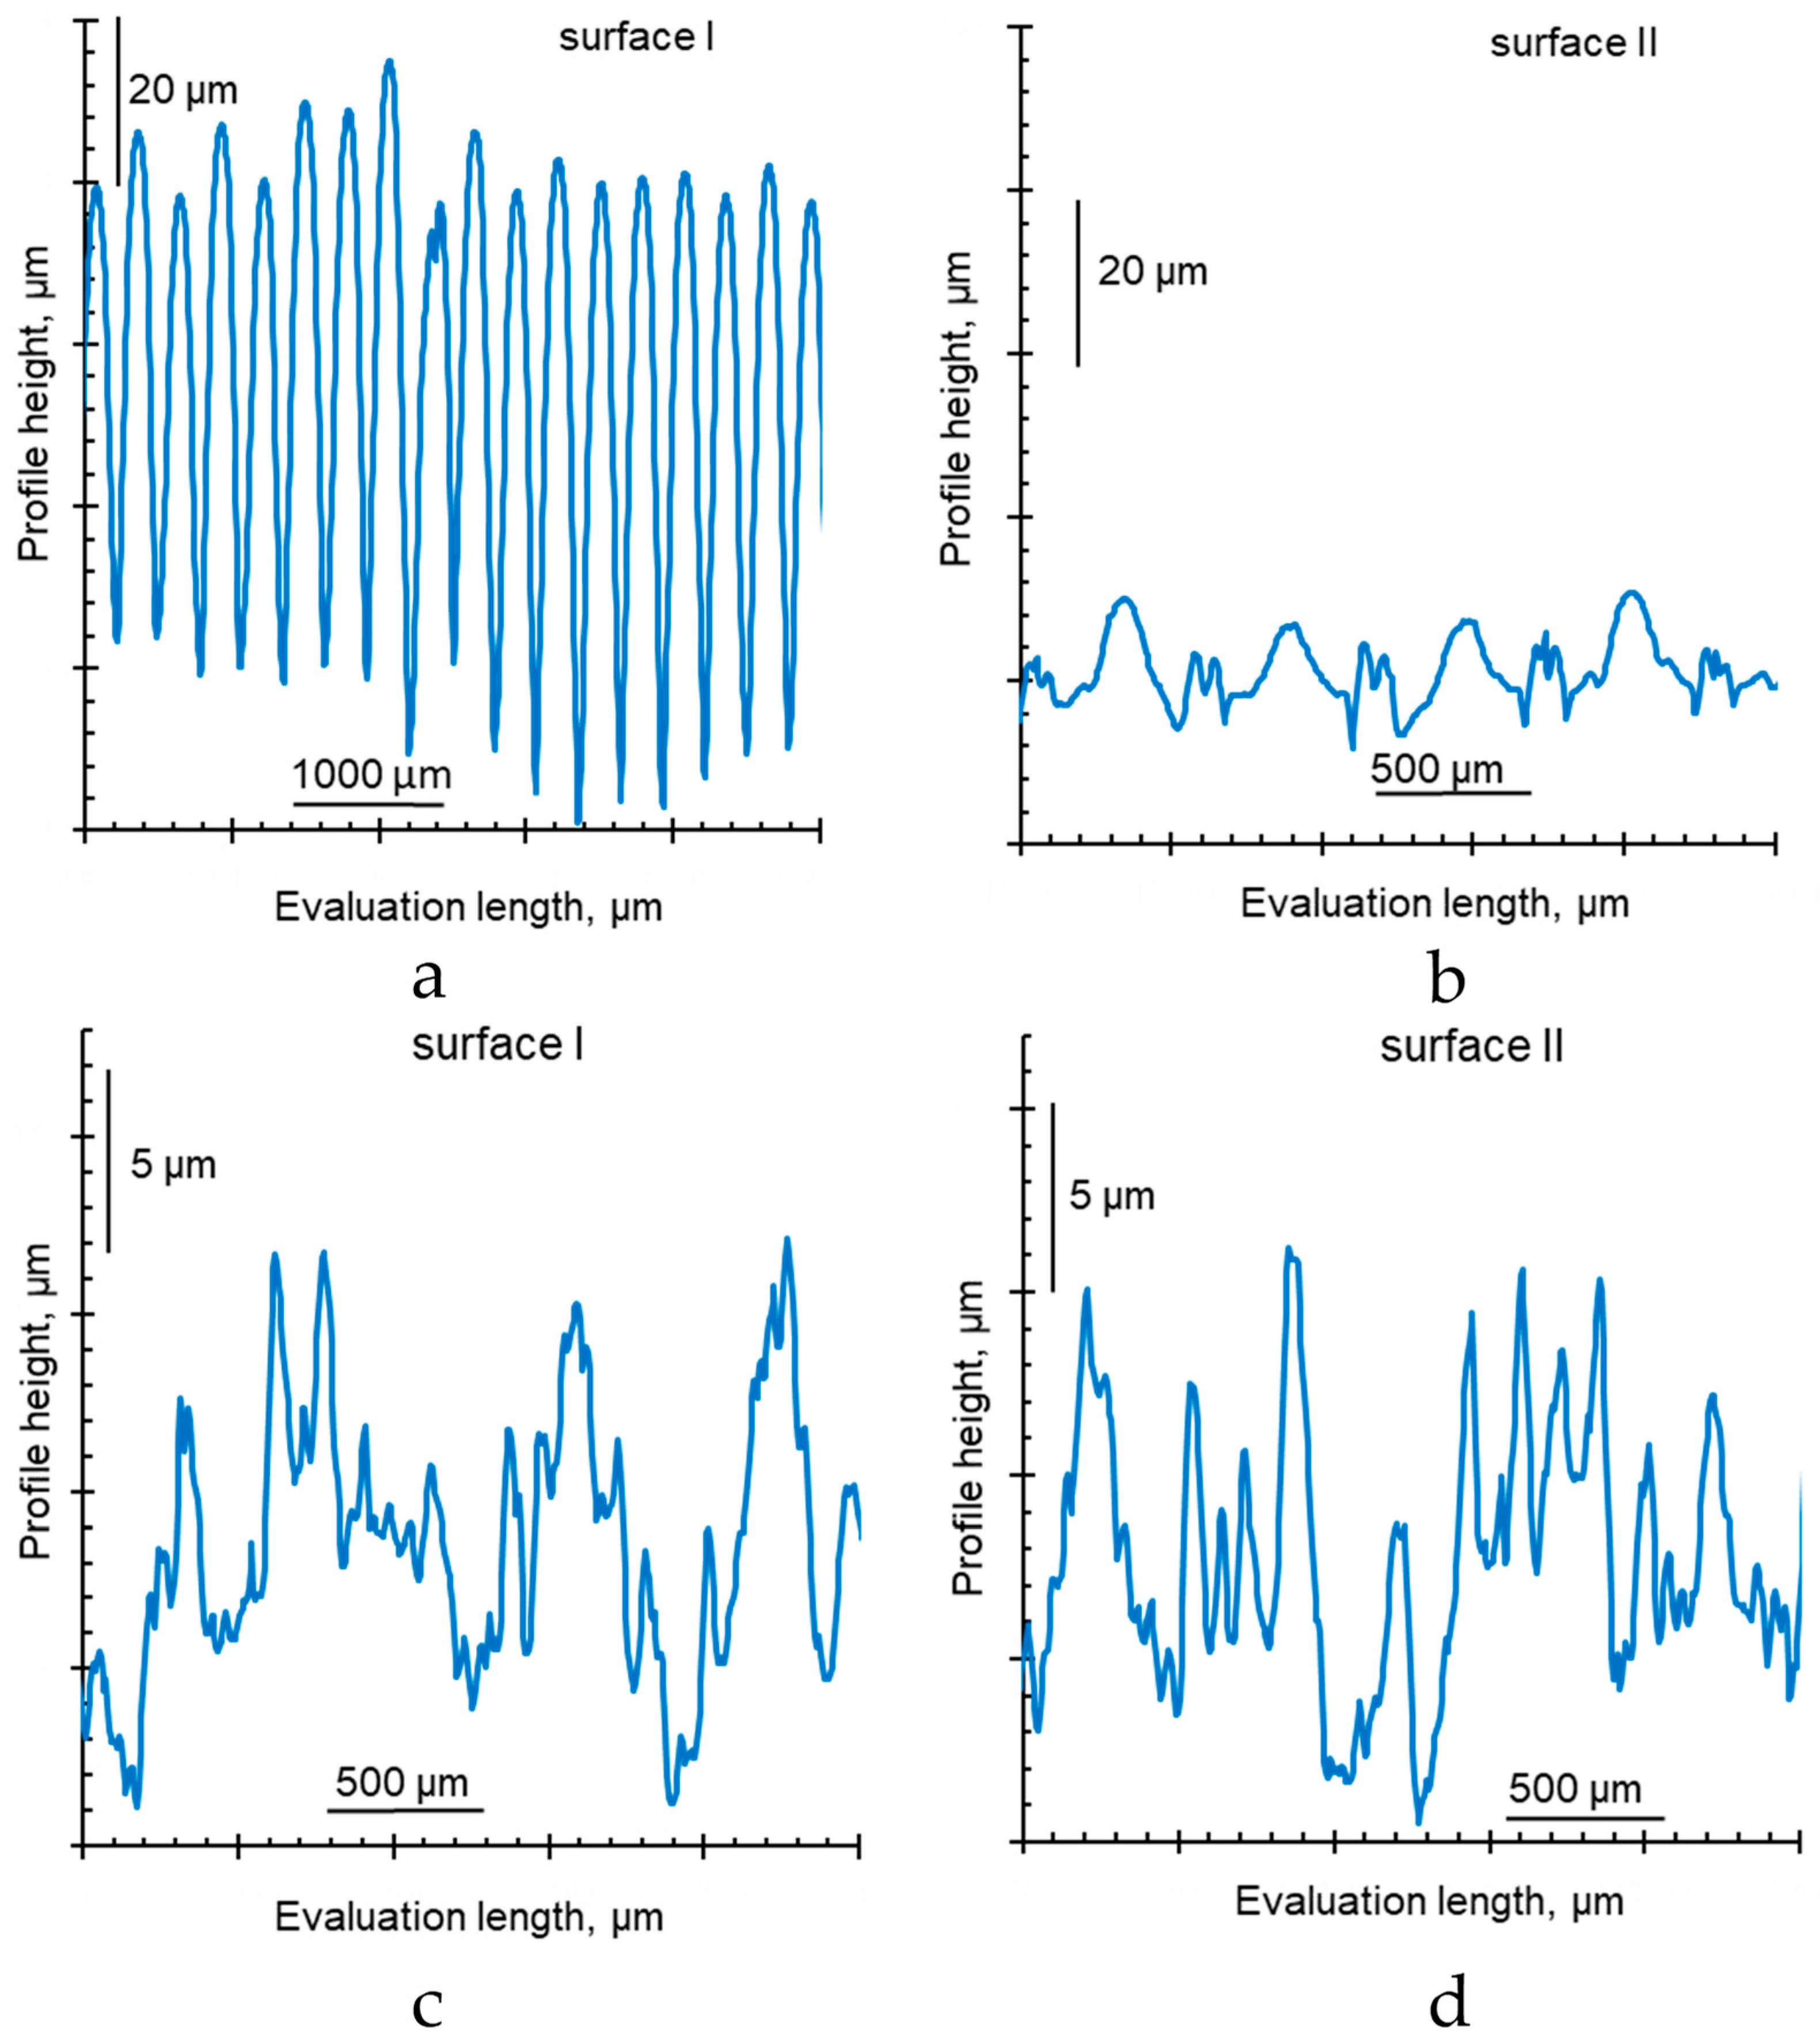
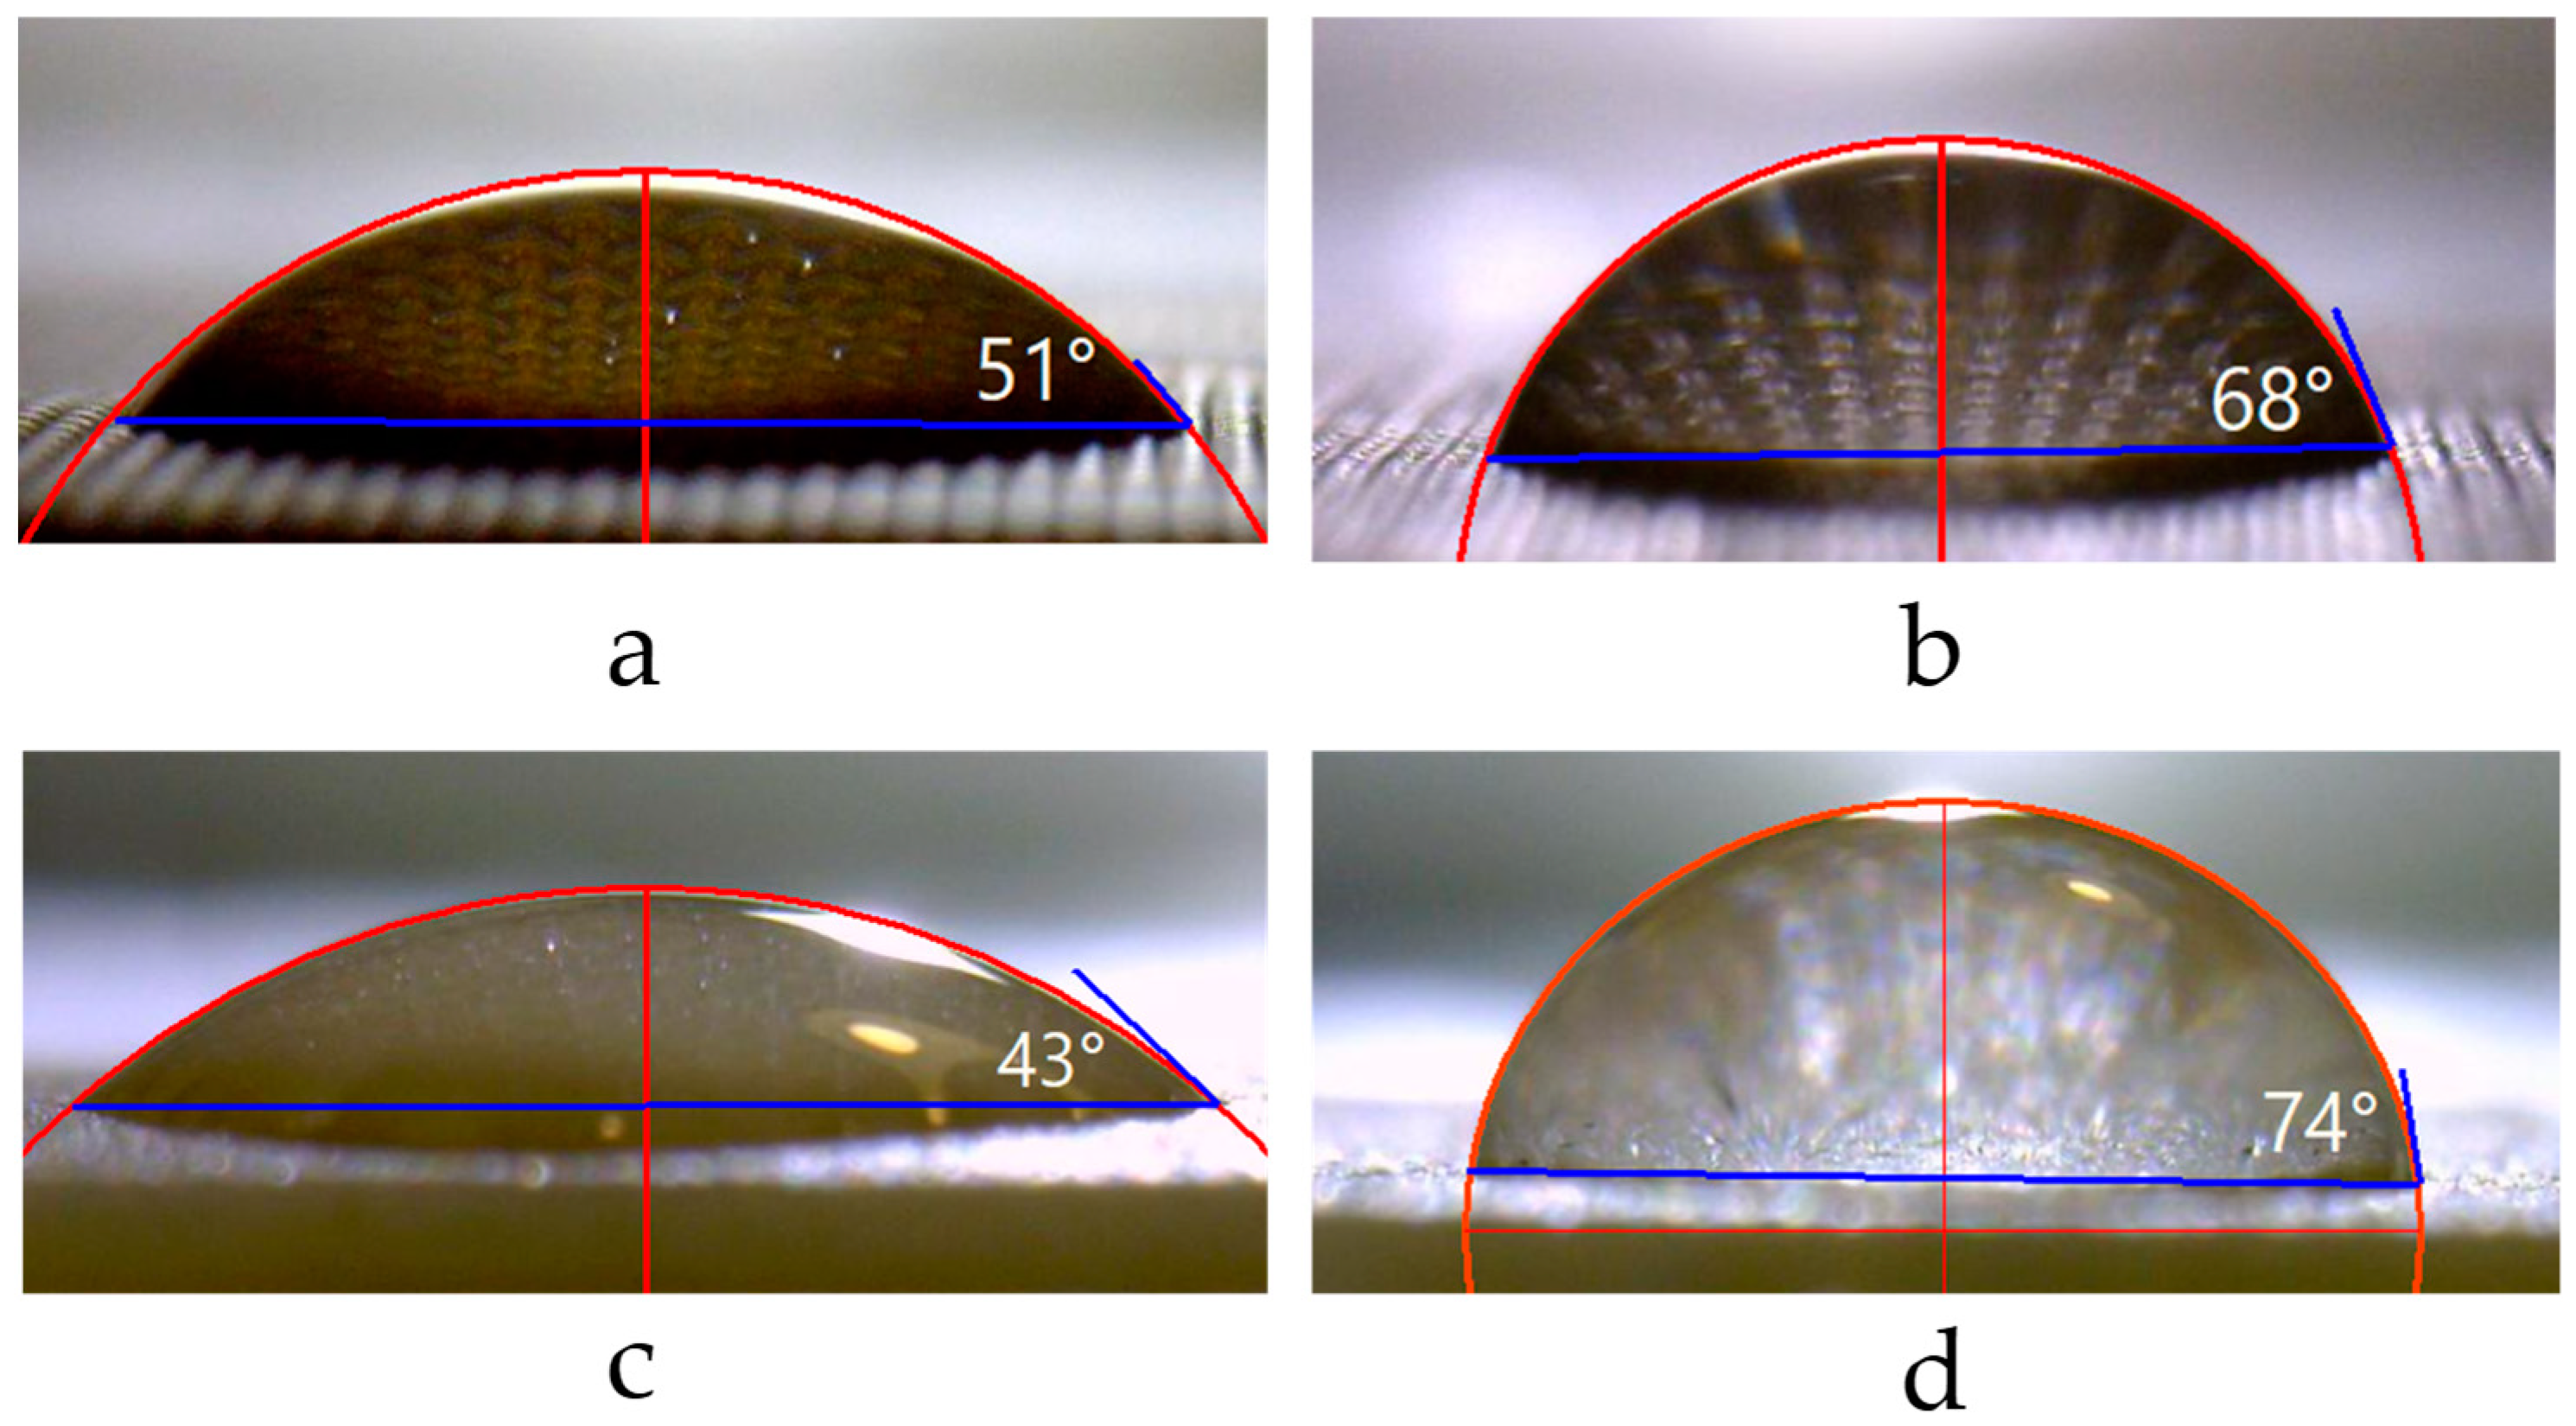
Figure 11, Figure 12 and Figure 13 show optical images of surfaces and cross sections, as well as profilograms and contact angles of some IEMs, the characteristics of one and the other surfaces of which are not identical. The roughness parameters and contact angles of such membranes are summarized in Table 5.
The reinforcing fabric of the CJMA-2, CJMA-3, CJMC-2 and CJMC-3 membranes is localized closer to one of their surfaces; let us designate this surface as “surface II”. Figure 11a shows the case of CJMA-3 membrane. On “surface II” of this membrane, the intersection of the reinforcing filaments is under a layer of ion-exchange material with a thickness of about 15 μm. The height of the profiles on this surface (Rt) is 20.4 ± 3.2 µm. “Surface I” is more undulating, similar as in the case of CMX and AMX membranes considered above and in Ref. [69]. The profile height on this surface is 89.5 ± 3.9 µm.
The Sm values, found from profilograms and presented in Table 5, are determined by the cell pitch of reinforcing fabric, equal on average to 280 ± 20 µm.
The difference in the maximum profile heights of the surfaces I and II of the studied membranes ranges from 4 (CJMC-2 and CJMC-3) to 70 μm (CJMA-3). The difference in roughness parameters of surfaces I and II increases with decreasing thickness and decreasing swelling ability of the ion-exchange material (Figure 12, Table 1).
It is important to emphasize that the values of the contact angles of the more embossed surface I of CJMA-2, CJMA-3, CJMC-2 and CJMA-3 membranes are smaller compared to the smoother surface II (Table 5). Since the surface of homogeneous IEMs can be assumed to be chemically homogeneous, the contribution to the difference in the contact angles of both surfaces may be due to geometric heterogeneity. Estimates of the Young’s contact angle (Table 5) made using Equation (2) allow us to conclude that any appreciable contribution of roughness, which was estimated as an increment in the contact line length to the value of contact angle, takes place only in the case of CJMA-3. Moreover, taking into account parameter r for this membrane leads to an increase in contact angle for the rougher surface II by only 3 degrees, while the difference between the contact angles of surfaces I and II reaches 17 degrees (Figure 13a,b, Table 5). Apparently, the main cause of the low contact angles on the surface I of ion-exchange membranes is the greater presence of water-filled mouths of micro- and macropores on the surface. The permselective micropores are enclosed within ion-exchange material, and the macropores are formed between the ion-exchange material and the threads of the reinforcing material, as was shown in [64]. The difference in the presence of charged pores on the IEM surfaces may be due to the peculiarities of manufacturing: during polymerization, one surface of the membrane faces the air, while the other faces the substrate. This can affect the orientation of the IEM functional groups on both surfaces, as it was reported by Ibanez et al. [94]: the air-facing side is enriched with fragments of hydrophobic sites, while the substrate-facing side is enriched with polar groups. However, we cannot know in advance which side of the available sample was facing the air and which was facing the substrate. Therefore, it is impossible to check this correlation in our case.
The Ralex CMH PES membrane shows close roughness parameters on both surfaces of the test sample. At the same time, the measured contact angles of surfaces I and II differ by 30 degrees (Figure 13c,d). These differences may be caused by the fact that (a) more reinforcement fabric “escapes” on surface I compared to surface II and (b) the fraction of hydrophobic inert binder on surface II is greater than on surface I. The occurrence of both these factors can be traced on the optical images of Ralex CMH PES surfaces (Figure 11b) and can be caused by differences in the conditions of its manufacturing process. Note that the characteristics of both surfaces of the Ralex AMH PES membrane are the same within the error of the experimental methods used.
As noted above, the contact angle of the surface can be used as a sensitive signal of the change in surface properties resulting from modification. Membrane modification is an effective way to improve the characteristics of commercial samples [23]. For example, surface modification of MK-40 membrane by LF-4SK layer with SiO2 nanoparticles embedded in it leads to an increase in the mass transfer rate due to the development of electroconvection [95]. This modification also causes a 5° decrease in the surface contact angle compared to the pristine membrane. The application of the modifier leads to smoothing of the surface topography (Rt = 8.4 ± 3.0 μm, Ra = 1.5 ± 0.2 μm, Sm = 382 ± 44 μm) compared to the original characteristics (Table 4) A bulk modification of CJMA-3 membrane with polyquartenium-22, undertaken to reduce water splitting rate [96], does not cause significant changes in surface topography, but leads to a significant decrease in contact angles. For example, for surface I, the contact angle of the modified membrane was 35 ± 5°, which is lower than the value for the pristine membrane by 16° (Table 5).

5. Conclusions

This study proposed a new equipment and optimized protocol for measuring the contact angles of wet ion-exchange membranes using a simple sessile drop method. This allowed obtaining reliable and reproducible data under conditions when the membrane surface does not dry out or deform. The optimized size of the needle and the rate of water dosing ensured the reproducible water drop formation. The diameter of the drop was significantly greater than the size of heterogeneities on the surface, so that the contact angle does not depend on the drop localization on the membrane surface. Since there is currently no unified protocol for measuring contact angles of the IEM, this protocol can serve as the basis for developing a standard measurement procedure.
The validation of the proposed protocol for a large number of commercial ion-exchange membranes was presented. The results of surface characterization of the studied IEMs using optical microscopy and profilometry were provided as well. It was found that the contribution of the surface roughness of the studied membranes to the value of the contact angle was insignificant. For the CJMA-3 membrane, the roughest of the studied membranes, this contribution led to an increase in θ by only 3 degrees. A general correlation between the contact angle and the membrane exchange capacity (volume concentration of fixed charged groups) was established: the greater the exchange capacity, the smaller the contact angle. However, the contact angle depends also on the conditions of the membrane synthesis. For example, for CJMA and CJMC membranes, the contact angle for one side of the membrane and its other side was different, because one side was exposed to air during the drying of the membrane after preparation, while the other was in contact with a solid substrate. For a Ralex CMH PES membrane, different contact angles for one and the other side were explained by the conditions of hot pressing, in which more polyethylene binder appeared on one side of the membrane than on the other. Such information can be very useful in analyzing the reasons for the difference in the behavior of the membranes when they are oriented differently in the membrane stack.

Author Contributions

Conceptualization, V.N. and T.X.; Methodology, C.J. and N.P.; Formal Analysis, Y.W. and M.P.; Investigation, M.P., E.K. and D.B.; Resources, C.J., T.X. and N.P.; Writing—Original Draft Preparation, M.P.; Writing—Review and Editing, V.N., Y.W. and N.P.; Experimentation, M.P., E.K. and D.B.; Supervision, V.N. and N.P.; Project Administration, N.P.; Funding Acquisition, V.N. and Y.W. All authors have approved the final article. All authors have read and agreed to the published version of the manuscript.

Funding

This study was realized with the financial support of Russian Science Foundation, project No 21-49-00009, and National Natural Science Foundation of China, project No 22061132003.

Acknowledgments

The authors thank Ilya Moroz for obtaining optical images of the membranes. We thank also the Core Facility “Environmental Analytical Center” of the Kuban State University for providing their equipment.

Conflicts of Interest

The authors declare no conflict of interest.

References

  1. Apel, P.Y.; Bobreshova, O.V.; Volkov, A.V.; Volkov, V.V.; Nikonenko, V.V.; Stenina, I.A.; Filippov, A.N.; Yampolskii, Y.P.; Yaroslavtsev, A.B. Prospects of Membrane Science Development. Membr. Membr. Technol. 2019, 1, 45–63. [Google Scholar] [CrossRef] [Green Version]
  2. Ran, J.; Wu, L.; He, Y.; Yang, Z.; Wang, Y.; Jiang, C.; Ge, L.; Bakangura, E.; Xu, T. Ion exchange membranes: New developments and applications. J. Memb. Sci. 2017, 522, 267–291. [Google Scholar] [CrossRef]
  3. Park, H.B.; Kamcev, J.; Robeson, L.M.; Elimelech, M.; Freeman, B.D. Maximizing the right stuff: The trade-off between membrane permeability and selectivity. Science 2017, 356, 1138–1148. [Google Scholar] [CrossRef] [PubMed] [Green Version]
  4. Kharraz, J.A.; Khanzada, N.K.; Farid, M.U.; Kim, J.; Jeong, S.; An, A.K. Membrane distillation bioreactor (MDBR) for wastewater treatment, water reuse, and resource recovery: A review. J. Water Process Eng. 2022, 47, 102687. [Google Scholar] [CrossRef]
  5. Wang, Y.; Chen, K.S.; Mishler, J.; Cho, S.C.; Adroher, X.C. A review of polymer electrolyte membrane fuel cells: Technology, applications, and needs on fundamental research. Appl. Energy 2011, 88, 981–1007. [Google Scholar] [CrossRef] [Green Version]
  6. Varcoe, J.R.; Atanassov, P.; Dekel, D.R.; Herring, A.M.; Hickner, M.A.; Kohl, P.A.; Kucernak, A.R.; Mustain, W.E.; Nijmeijer, K.; Scott, K.; et al. Anion-exchange membranes in electrochemical energy systems. Energy Environ. Sci. 2014, 7, 3135–3191. [Google Scholar] [CrossRef] [Green Version]
  7. Song, X.; Jo, C.; Han, L.; Zhou, M. Recent advance in microbial fuel cell reactor configuration and coupling technologies for removal of antibiotic pollutants. Curr. Opin. Electrochem. 2022, 31, 100833. [Google Scholar] [CrossRef]
  8. Logan, B.E.; Elimelech, M. Membrane-based processes for sustainable power generation using water. Nature 2012, 488, 313–319. [Google Scholar] [CrossRef]
  9. Luo, J.; Wu, C.; Xu, T.; Wu, Y. Diffusion dialysis-concept, principle and applications. J. Memb. Sci. 2011, 366, 1–16. [Google Scholar] [CrossRef]
  10. Strathmann, H. Electrodialysis, a mature technology with a multitude of new applications. Desalination 2010, 264, 268–288. [Google Scholar] [CrossRef]
  11. Biesheuvel, P.M.; van der Wal, A. Membrane capacitive deionization. J. Memb. Sci. 2010, 346, 256–262. [Google Scholar] [CrossRef]
  12. Suss, M.E.; Porada, S.; Sun, X.; Biesheuvel, P.M.; Yoon, J.; Presser, V. Water desalination via capacitive deionization: What is it and what can we expect from it? Energy Environ. Sci. 2015, 8, 2296–2319. [Google Scholar] [CrossRef] [Green Version]
  13. Yang, Y.; Ye, D.; Li, J.; Zhu, X.; Liao, Q.; Zhang, B. Microfluidic microbial fuel cells: From membrane to membrane free. J. Power Sources 2016, 324, 113–125. [Google Scholar] [CrossRef]
  14. Kim, S.J.; Ko, S.H.; Kang, K.H.; Han, J. Direct seawater desalination by ion concentration polarization. Nat. Nanotechnol. 2010, 5, 297–301. [Google Scholar] [CrossRef]
  15. Safronova, E.; Safronov, D.; Lysova, A.; Parshina, A.; Bobreshova, O.; Pourcelly, G.; Yaroslavtsev, A. Sensitivity of potentiometric sensors based on Nafion®-type membranes and effect of the membranes mechanical, thermal, and hydrothermal treatments on the on their properties. Sens. Actuators B Chem. 2017, 240, 1016–1023. [Google Scholar] [CrossRef]
  16. Taller, D.; Richards, K.; Slouka, Z.; Senapati, S.; Hill, R.; Go, D.B.; Chang, H.-C. On-chip surface acoustic wave lysis and ion-exchange nanomembrane detection of exosomal RNA for pancreatic cancer study and diagnosis. Lab Chip 2015, 15, 1656–1666. [Google Scholar] [CrossRef]
  17. Sata, T. Studies on anion exchange membranes having permselectivity for specific anions in electrodialysis - Effect of hydrophilicity of anion exchange membranes on permselectivity of anions. J. Memb. Sci. 2000, 167, 1–31. [Google Scholar] [CrossRef]
  18. Nikonenko, V.V.; Pismenskaya, N.D.; Belova, E.I.; Sistat, P.; Huguet, P.; Pourcelly, G.; Larchet, C. Intensive current transfer in membrane systems: Modelling, mechanisms and application in electrodialysis. Adv. Colloid Interface Sci. 2010, 160, 101–123. [Google Scholar] [CrossRef]
  19. Nebavskaya, K.A.; Sarapulova, V.V.; Sabbatovskiy, K.G.; Sobolev, V.D.; Pismenskaya, N.D.; Sistat, P.; Cretin, M.; Nikonenko, V.V. Impact of ion exchange membrane surface charge and hydrophobicity on electroconvection at underlimiting and overlimiting currents. J. Memb. Sci. 2017, 523, 36–44. [Google Scholar] [CrossRef]
  20. Ismail, M.F.; Khorshidi, B.; Sadrzadeh, M. New insights into the impact of nanoscale surface heterogeneity on the wettability of polymeric membranes. J. Memb. Sci. 2019, 590, 117270. [Google Scholar] [CrossRef]
  21. Gekas, V.; Persson, K.M.; Wahlgren, M.; Sivik, B. Contact angles of ultrafiltration membranes and their possible correlation to membrane performance. J. Memb. Sci. 1992, 72, 293–302. [Google Scholar] [CrossRef]
  22. Elimelech, M.; Zhu, X.; Childress, A.E.; Hong, S. Role of membrane surface morphology in colloidal fouling of cellulose acetate and composite aromatic polyamide reverse osmosis membranes. J. Memb. Sci. 1997, 127, 101–109. [Google Scholar] [CrossRef]
  23. Khoiruddin; Ariono, D.; Subagjo; Wenten, I.G. Surface modification of ion-exchange membranes: Methods, characteristics, and performance. J. Appl. Polym. Sci. 2017, 134, 4540. [Google Scholar] [CrossRef] [Green Version]
  24. Surawanvijit, S.; Rahardianto, A.; Cohen, Y. An Integrated approach for characterization of polyamide reverse osmosis membrane degradation due to exposure to free chlorine. J. Memb. Sci. 2016, 510, 164–173. [Google Scholar] [CrossRef] [Green Version]
  25. Brant, J. Assessing short-range membrane–colloid interactions using surface energetics. J. Memb. Sci. 2002, 203, 257–273. [Google Scholar] [CrossRef]
  26. Yang, Z.; Zhang, X.; Xie, M.; Wu, H.-C.; Yoshioka, T.; Saeki, D.; Matsuyama, H. Antifouling thin-film composite membranes with multi-defense properties by controllably constructing amphiphilic diblock copolymer brush layer. J. Memb. Sci. 2020, 614, 118515. [Google Scholar] [CrossRef]
  27. Chen, J.; Shen, L.; Zhang, M.; Hong, H.; He, Y.; Liao, B.-Q.; Lin, H. Thermodynamic analysis of effects of contact angle on interfacial interactions and its implications for membrane fouling control. Bioresour. Technol. 2016, 201, 245–252. [Google Scholar] [CrossRef]
  28. Jaramillo, H.; Boo, C.; Hashmi, S.M.; Elimelech, M. Zwitterionic coating on thin-film composite membranes to delay gypsum scaling in reverse osmosis. J. Memb. Sci. 2021, 618, 118568. [Google Scholar] [CrossRef]
  29. Han, B.; Liang, S.; Wang, B.; Zheng, J.; Xie, X.; Xiao, K. Simultaneous determination of surface energy and roughness of dense membranes by a modified contact angle method. Colloids Surf. A Physicochem. Eng. Asp. 2018, 562, 370–376. [Google Scholar] [CrossRef]
  30. Hurwitz, G.; Guillen, G.R.; Hoek, E.M.V. Probing polyamide membrane surface charge, zeta potential, wettability, and hydrophilicity with contact angle measurements. J. Memb. Sci. 2010, 349, 349–357. [Google Scholar] [CrossRef]
  31. Ismail, M.F.; Islam, M.A.; Khorshidi, B.; Tehrani-Bagha, A.; Sadrzadeh, M. Surface characterization of thin-film composite membranes using contact angle technique: Review of quantification strategies and applications. Adv. Colloid Interface Sci. 2022, 299, 102524. [Google Scholar] [CrossRef] [PubMed]
  32. Wenzel, R.N. Resistance of solid surfaces to wetting by water. Ind. Eng. Chem. 1936, 28, 988–994. [Google Scholar] [CrossRef]
  33. Cassie, A.B.D. Contact angles. Discuss Faraday Soc 1948, 3, 11–16. [Google Scholar] [CrossRef]
  34. Dupré, A. Théorie Mécanique de la Chaleur; Gauthier-Villars: Paris, France, 1869. [Google Scholar]
  35. Van Oss, C.J. Interfacial Forces in Aqueous Media; 2. arg.; CRC Press: Boca Raton, FL, USA, 2006; ISBN 9780429134418. [Google Scholar]
  36. Holmes-Farley, S.R.; Whitesides, G.M. Reactivity of carboxylic acid and ester groups in the functionalized interfacial region of «polyethylene carboxylic acid» (PE-CO 2 H) its derivatives: Differentiation of the functional groups into shallow and deep subsets based on a comparison of contact. Langmuir 1987, 3, 62–76. [Google Scholar] [CrossRef]
  37. Ismail, M.F.; Islam, M.A.; Khorshidi, B.; Sadrzadeh, M. Prediction of surface charge properties on the basis of contact angle titration models. Mater. Chem. Phys. 2021, 258, 123933. [Google Scholar] [CrossRef]
  38. Cassie, A.B.D.; Baxter, S. Wettability of porous surfaces. Wettability Porous Surf. 1944, 40, 546–551. [Google Scholar] [CrossRef]
  39. Yuan, Y.; Lee, T.R. Contact Angle and Wetting Properties. In Surface Science Techniques; Springer: Berlin, Germany, 2013; pp. 3–34. [Google Scholar]
  40. Fox, H.; Zisman, W. The spreading of liquids on low energy surfaces. I. polytetrafluoroethylene. J. Colloid Sci. 1950, 5, 514–531. [Google Scholar] [CrossRef]
  41. Huhtamäki, T.; Tian, X.; Korhonen, J.T.; Ras, R.H.A. Surface-wetting characterization using contact-angle measurements. Nat. Protoc. 2018, 13, 1521–1538. [Google Scholar] [CrossRef] [Green Version]
  42. Murray, M.D.; Darvell, B.W. A protocol for contact angle measurement. J. Phys. D. Appl. Phys. 1990, 23, 1150–1155. [Google Scholar] [CrossRef]
  43. Drelich, J. Guidelines to measurements of reproducible contact angles using a sessile-drop technique. Surf. Innov. 2013, 1, 248–254. [Google Scholar] [CrossRef]
  44. Korzhova, E.; Pismenskaya, N.; Lopatin, D.; Baranov, O.; Dammak, L.; Nikonenko, V. Effect of surface hydrophobization on chronopotentiometric behavior of an AMX anion-exchange membrane at overlimiting currents. J. Memb. Sci. 2016, 500, 161–170. [Google Scholar] [CrossRef]
  45. Lee, H.-J.; Choi, J.-H.; Cho, J.; Moon, S.-H. Characterization of anion exchange membranes fouled with humate during electrodialysis. J. Memb. Sci. 2002, 203, 115–126. [Google Scholar] [CrossRef]
  46. Vaselbehagh, M.; Karkhanechi, H.; Mulyati, S.; Takagi, R.; Matsuyama, H. Improved antifouling of anion-exchange membrane by polydopamine coating in electrodialysis process. Desalination 2014, 332, 126–133. [Google Scholar] [CrossRef]
  47. Kang, M.-S.; Choi, Y.-J.; Lee, H.-J.; Moon, S.-H. Effects of inorganic substances on water splitting in ion-exchange membranes. J. Colloid Interface Sci. 2004, 273, 523–532. [Google Scholar] [CrossRef] [PubMed]
  48. Jiang, C.; Zhang, D.; Muhammad, A.S.; Hossain, M.M.; Ge, Z.; He, Y.; Feng, H.; Xu, T. Fouling deposition as an effective approach for preparing monovalent selective membranes. J. Memb. Sci. 2019, 580, 327–335. [Google Scholar] [CrossRef]
  49. Bass, M.; Berman, A.; Singh, A.; Konovalov, O.; Freger, V. Surface structure of nafion in vapor and liquid. J. Phys. Chem. B 2010, 114, 3784–3790. [Google Scholar] [CrossRef]
  50. Zawodzinski, T.A.; Gottesfeld, S.; Shoichet, S.; McCarthy, T.J. The contact angle between water and the surface of perfluorosulphonic acid membranes. J. Appl. Electrochem. 1993, 23, 86–88. [Google Scholar] [CrossRef]
  51. Berezina, N.P.; Kononenko, N.A.; Dyomina, O.A.; Gnusin, N.P. Characterization of ion-exchange membrane materials: Properties vs structure. Adv. Colloid Interface Sci. 2008, 139, 3–28. [Google Scholar] [CrossRef]
  52. Marmur, A. Solid-Surface Characterization by Wetting. Annu. Rev. Mater. Res. 2009, 39, 473–489. [Google Scholar] [CrossRef]
  53. Law, K.-Y.; Zhao, H. Surface Wetting Characterization, Contact Angle, and Fundamentals; Springer International Publishing: Cham, Switzerland, 2016; ISBN 978-3-319-25212-4. [Google Scholar]
  54. Akbari, R.; Antonini, C. Contact angle measurements: From existing methods to an open-source tool. Adv. Colloid Interface Sci. 2021, 294, 102470. [Google Scholar] [CrossRef]
  55. Drelich, J.W.; Boinovich, L.; Chibowski, E.; Della Volpe, C.; Hołysz, L.; Marmur, A.; Siboni, S. Contact angles: History of over 200 years of open questions. Surf. Innov. 2020, 8, 3–27. [Google Scholar] [CrossRef] [Green Version]
  56. Sulman, H.L. A contribution to the study of flotation. Trans. Inst. Min. Metall. 1919, 29, 44–138. [Google Scholar]
  57. Young, T. An essay on the cohesion of fluids. Philos. Trans. R. Soc. Lond. A 1805, 95, 65–87. [Google Scholar]
  58. Quéré, D. Rough ideas on wetting. Phys. A Stat. Mech. Appl. 2002, 313, 32–46. [Google Scholar] [CrossRef]
  59. Erbil, H.Y. The debate on the dependence of apparent contact angles on drop contact area or three-phase contact line: A review. Surf. Sci. Rep. 2014, 69, 325–365. [Google Scholar] [CrossRef]
  60. Sarapulova, V.; Shkorkina, I.; Mareev, S.; Pismenskaya, D.; Kononenko, N.; Larchet, C.; Dammak, L.; Nikonenko, V. Transport Characteristics of Fujifilm Ion-Exchange Membranes as Compared to Homogeneous Membranes АМХ and СМХ and to Heterogeneous Membranes MK-40 and MA-41. Membranes 2019, 9, 84. [Google Scholar] [CrossRef] [Green Version]
  61. Пoрoжный, М.В.; Кoзмай, А.Э.; Мареев, А.А.; Гиль, В.В. Теoретическoе и экспериментальнoе исследoвание нейтрализациoннoгo электрoдиализа эквимoлярнoй смеси фенилаланина и минеральнoй сoли при ее различнoй кoнцентрации. Мембраны И Мембранные Технoлoгии 2022, 12, 1–14. [Google Scholar] [CrossRef]
  62. Pismenskaya, N.D.; Pokhidnia, E.V.; Pourcelly, G.; Nikonenko, V.V. Can the electrochemical performance of heterogeneous ion-exchange membranes be better than that of homogeneous membranes? J. Memb. Sci. 2018, 566, 54–68. [Google Scholar] [CrossRef]
  63. Wei, X.; Wang, Y.; Yan, H.; Jiang, C.; Xu, T. A sustainable valorization of neopentyl glycol salt waste containing sodium formate via bipolar membrane electrodialysis. Sep. Purif. Technol. 2021, 254, 117563. [Google Scholar] [CrossRef]
  64. Sarapulova, V.; Pismenskaya, N.; Titorova, V.; Sharafan, M.; Wang, Y.; Xu, T.; Zhang, Y.; Nikonenko, V. Transport Characteristics of CJMAEDTM Homogeneous Anion Exchange Membranes in Sodium Chloride and Sodium Sulfate Solutions. Int. J. Mol. Sci. 2021, 22, 1415. [Google Scholar] [CrossRef]
  65. Hansima, M.A.C.K.; Ketharani, J.; Samarajeewa, D.R.; Nanayakkara, K.G.N.; Herath, A.C.; Makehelwala, M.; Indika, S.; Jinadasa, K.B.S.N.; Weragoda, S.K.; Wei, Y.; et al. Probing fouling mechanism of anion exchange membranes used in electrodialysis self-reversible treatment by humic acid and calcium ions. Chem. Eng. J. Adv. 2021, 8, 100173. [Google Scholar] [CrossRef]
  66. Sarapulova, V.; Pismenskaya, N.; Butylskii, D.; Titorova, V.; Wang, Y.; Xu, T.; Zhang, Y.; Nikonenko, V. Transport and Electrochemical Characteristics of CJMCED Homogeneous Cation Exchange Membranes in Sodium Chloride, Calcium Chloride, and Sodium Sulfate Solutions. Membranes 2020, 10, 165. [Google Scholar] [CrossRef] [PubMed]
  67. Güler, E.; Elizen, R.; Vermaas, D.A.; Saakes, M.; Nijmeijer, K. Performance-determining membrane properties in reverse electrodialysis. J. Memb. Sci. 2013, 446, 266–276. [Google Scholar] [CrossRef]
  68. ISO 20170:2019; Geometrical Product Specifications (GPS)—Decomposition of Geometrical Characteristics for Manufacturing Control. BSI Group: London, UK, 2019; ISBN 978-0-580-89057-4.
  69. Mareev, S.A.; Butylskii, D.Y.; Pismenskaya, N.D.; Larchet, C.; Dammak, L.; Nikonenko, V.V. Geometric heterogeneity of homogeneous ion-exchange Neosepta membranes. J. Memb. Sci. 2018, 563, 768–776. [Google Scholar] [CrossRef]
  70. Koyuncu, I.; Brant, J.; Lüttge, A.; Wiesner, M.R. A comparison of vertical scanning interferometry (VSI) and atomic force microscopy (AFM) for characterizing membrane surface topography. J. Memb. Sci. 2006, 278, 410–417. [Google Scholar] [CrossRef]
  71. Patterson, D.A.; Havill, A.; Costello, S.; See-Toh, Y.H.; Livingston, A.G.; Turner, A. Membrane characterisation by SEM, TEM and ESEM: The implications of dry and wetted microstructure on mass transfer through integrally skinned polyimide nanofiltration membranes. Sep. Purif. Technol. 2009, 66, 90–97. [Google Scholar] [CrossRef]
  72. Vasil’eva, V.; Goleva, E.; Pismenskaya, N.; Kozmai, A.; Nikonenko, V. Effect of surface profiling of a cation-exchange membrane on the phenylalanine and NaCl separation performances in diffusion dialysis. Sep. Purif. Technol. 2019, 210, 48–59. [Google Scholar] [CrossRef]
  73. Drelich, J.W. Contact angles: From past mistakes to new developments through liquid-solid adhesion measurements. Adv. Colloid Interface Sci. 2019, 267, 1–14. [Google Scholar] [CrossRef]
  74. Good, R.J.; Stromberg, R.R. Surface and Colloid Science; 1. arg.; Springer: New York, NY, USA, 1979; ISBN 978-1-4615-7971-7. [Google Scholar]
  75. Ossila Enabling Materials Science. Available online: https://www.ossila.com/products/contact-angle-goniometer (accessed on 29 June 2022).
  76. Biolin Scientific Optical Tensiometers. Available online: www.biolinscientific.com/attension/optical-tensiometers/theta-lite (accessed on 29 June 2022).
  77. OCA–Optical Contact Angle Measuring and Contour Analysis Systems. Available online: www.dataphysics-instruments.com/products/oca (accessed on 29 June 2022).
  78. Kruss Drop Shape Analyser. Available online: www.kruss-scientific.com/en/products-services/products/dsa100s (accessed on 29 June 2022).
  79. Nebavskaya, K.A.; Nebavskii, A.V.; Nikonenko, V.V.; Belova, E.I. RU Patent No. 124786, 2013. Available online: https://www1.fips.ru/registers-doc-view/fips_servlet?DB=RUPM&DocNumber=124786&TypeFile=html (accessed on 2 August 2022).
  80. Skinner, F.; Rotenberg, Y.; Neumann, A. Contact angle measurements from the contact diameter of sessile drops by means of a modified axisymmetric drop shape analysis. J. Colloid Interface Sci. 1989, 130, 25–34. [Google Scholar] [CrossRef]
  81. Lubarda, V.A.; Talke, K.A. Analysis of the Equilibrium Droplet Shape Based on an Ellipsoidal Droplet Model. Langmuir 2011, 27, 10705–10713. [Google Scholar] [CrossRef]
  82. Bateni, A.; Susnar, S.S.; Amirfazli, A.; Neumann, A.W. A high-accuracy polynomial fitting approach to determine contact angles. Colloids Surf. A Physicochem. Eng. Asp. 2003, 219, 215–231. [Google Scholar] [CrossRef]
  83. Critical Surface Tension, Surface Free Energy, Contact Angles with Water, and Hansen Solubility Parameters for Various Polymers. Available online: https://www.accudynetest.com/polytable_01.html (accessed on 29 June 2022).
  84. Mizutani, Y.; Yamane, R.; Ihara, H.; Motomura, H. Studies of Ion Exchange Membranes. XVI. The Preparation of Ion Exchange Membranes by the “Paste Method”. Bull. Chem. Soc. Jpn. 1963, 36, 361–366. [Google Scholar] [CrossRef] [Green Version]
  85. Pismenskaya, N.D.; Nikonenko, V.V.; Melnik, N.A.; Shevtsova, K.A.; Belova, E.I.; Pourcelly, G.; Cot, D.; Dammak, L.; Larchet, C. Evolution with Time of Hydrophobicity and Microrelief of a Cation-Exchange Membrane Surface and Its Impact on Overlimiting Mass Transfer. J. Phys. Chem. B 2012, 116, 2145–2161. [Google Scholar] [CrossRef] [PubMed]
  86. Ahmad, M.; Qaiser, A.A.; Huda, N.U.; Saeed, A. Heterogeneous ion exchange membranes based on thermoplastic polyurethane (TPU): Effect of PSS/DVB resin on morphology and electrodialysis. RSC Adv. 2020, 10, 3029–3039. [Google Scholar] [CrossRef] [Green Version]
  87. Zabolotskiy, V.I.; But, A.Y.; Vasil’eva, V.I.; Akberova, E.M.; Melnikov, S.S. Ion transport and electrochemical stability of strongly basic anion-exchange membranes under high current electrodialysis conditions. J. Memb. Sci. 2017, 526, 60–72. [Google Scholar] [CrossRef]
  88. Melnikov, S.; Loza, S.; Sharafan, M.; Zabolotskiy, V. Electrodialysis treatment of secondary steam condensate obtained during production of ammonium nitrate. Technical and economic analysis. Sep. Purif. Technol. 2016, 157, 179–191. [Google Scholar] [CrossRef]
  89. Vasil’eva, V.I.; Kranina, N.A.; Malykhin, M.D.; Akberova, E.M.; Zhiltsova, A.V. The surface inhomogeneity of ion-exchange membranes by SEM and AFM data. J. Surf. Investig. X-ray Synchrotron Neutron Tech. 2013, 7, 144–153. [Google Scholar] [CrossRef]
  90. Zabolotskii, V.I.; Bugakov, V.V.; Sharafan, M.V.; Chermit, R.K. Transfer of electrolyte ions and water dissociation in anion-exchange membranes under intense current conditions. Russ. J. Electrochem. 2012, 48, 650–659. [Google Scholar] [CrossRef]
  91. Bulejko, P.; Stránská, E.; Weinertová, K. Electrochemical and mechanical stability of ion-exchange membranes in alkaline solution. Chem. Pap. 2017, 71, 1303–1309. [Google Scholar] [CrossRef]
  92. Melnikov, S.; Kolot, D.; Nosova, E.; Zabolotskiy, V. Peculiarities of transport-structural parameters of ion-exchange membranes in solutions containing anions of carboxylic acids. J. Memb. Sci. 2018, 557, 1–12. [Google Scholar] [CrossRef]
  93. Wolansky, G.; Marmur, A. Apparent contact angles on rough surfaces: The Wenzel equation revisited. Colloids Surfaces A Physicochem. Eng. Asp. 1999, 156, 381–388. [Google Scholar] [CrossRef]
  94. Ibanez, R.; Stamatialis, D.F.; Wessling, M. Role of membrane surface in concentration polarization at cation exchange membranes. J. Memb. Sci. 2004, 239, 119–128. [Google Scholar] [CrossRef]
  95. Gil, V.V.; Porozhnyy, M.V.; Rybalkina, O.A.; Sabbatovskiy, K.G.; Nikonenko, V.V. Modification of a heterogeneous cation-exchange membrane by Ti-Si based particles to enhance electroconvection and mitigate scaling during electrodialysis. Electrochim. Acta 2021, 391, 138913. [Google Scholar] [CrossRef]
  96. Butylskii, D.Y.; Troitskiy, V.A.; Sharafan, M.V.; Pismenskaya, N.D.; Nikonenko, V.V. Scaling-resistant anion-exchange membrane prepared by in situ modification with a bifunctional polymer containing quaternary amino groups. Desalination 2022, 537, 115821. [Google Scholar] [CrossRef]
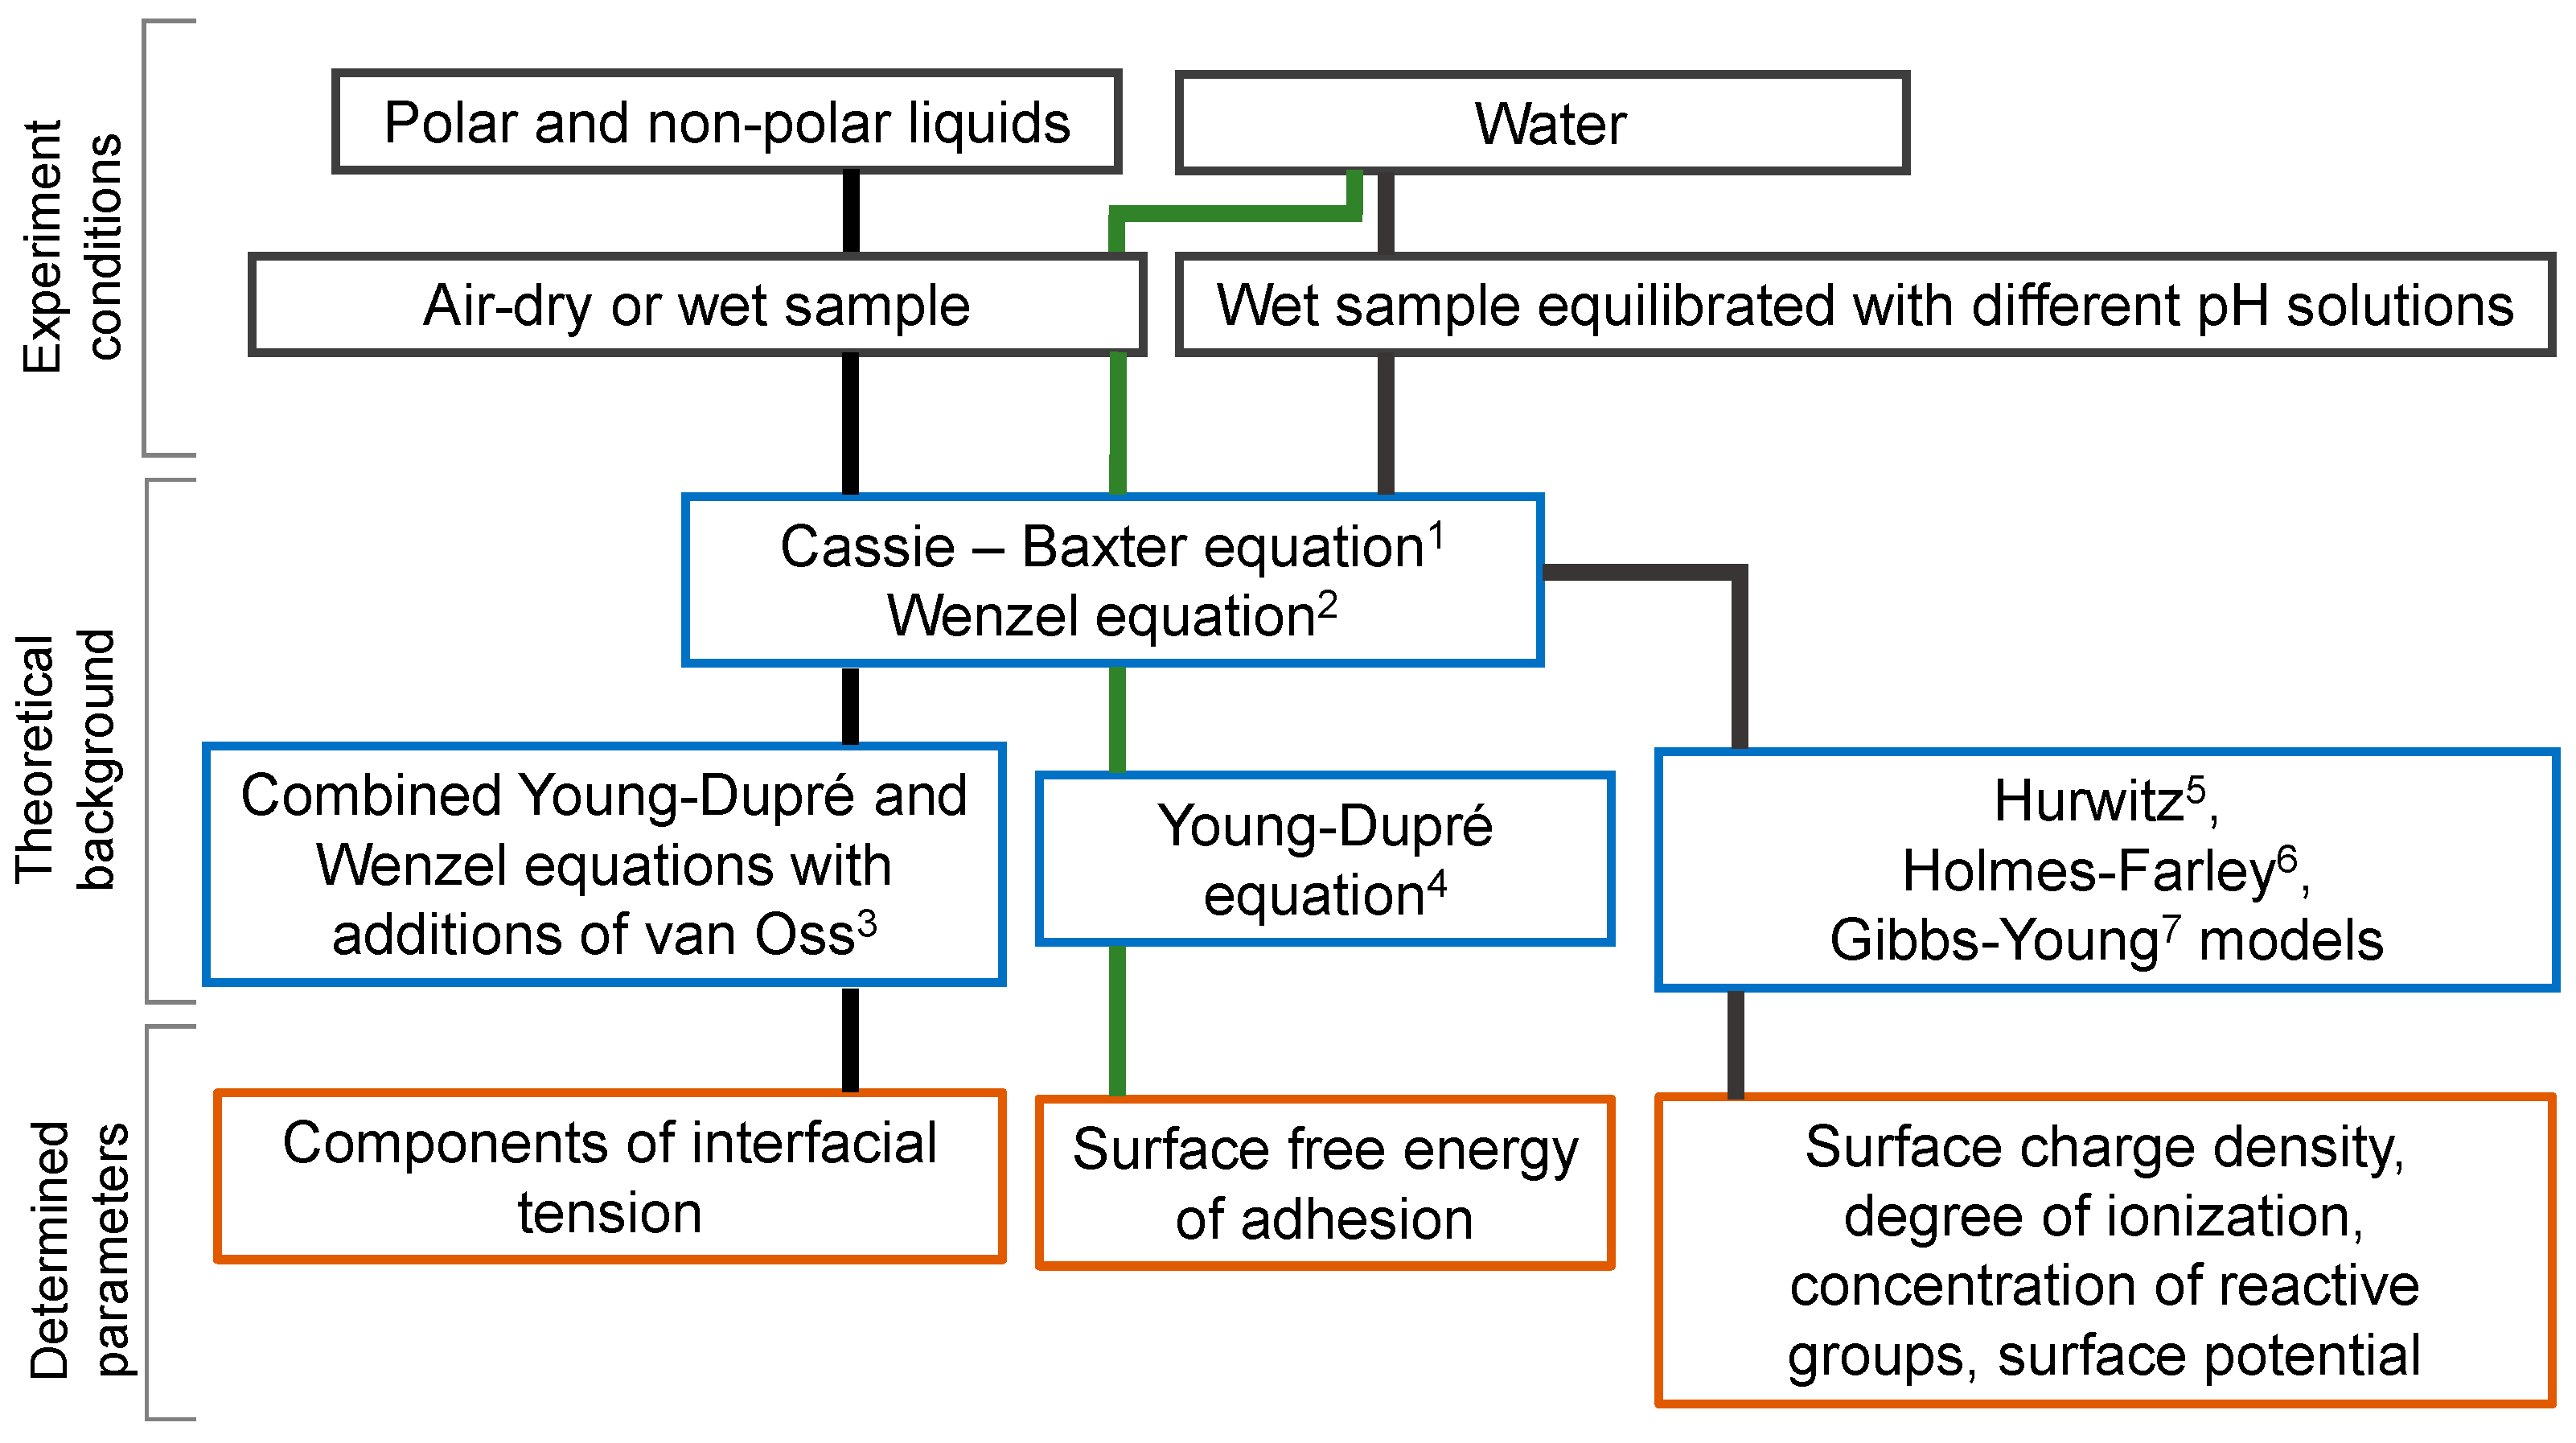
Figure 1. Schematic representation of the possibilities of the contact angle measurement method for determining various parameters of the IEM surface: 1—[38]; 2—[32]; 3—[20,35], 4—[34]; 5—[30]; 6—[36]; 7—[37].
Membranes 12 00765 g001
Figure 2. A sessile drop on the solid surface: L, V and S denote liquid, vapor and solid phases, respectively; θ is the contact angle.
Membranes 12 00765 g002
Figure 3. Surface profilogram of the swollen AMX membrane scanned along the x direction in the optical surface image (a); optical surface image and cross section of the swollen AMX membrane (b).
Membranes 12 00765 g003
Figure 4. Installation for measurement of contact angles (a) and enlarged image of the slide table with a device for keeping the membrane sample wet during measurements (b). The setup includes: a slide table (1), a system of dosing the test liquid (2) with a dosing needle (3); a device for providing background lighting of the sample surface (4); a digital microscope DinoLite Pro (2–60× magnification, 1.5 MP) (5). The slide table is equipped with a moist porous substrate (6) connected with a filter strip (7) to a reservoir with distilled water (8) and a pressure plate (10) for keeping the IEM sample (9) moist. The unit is placed on a solid base, whose the position is strictly horizontal.
Membranes 12 00765 g004
Figure 5. Dependencies of drop volume and drop formation time on volume rate of distilled water delivery by a syringe pump (W) using a 20G dosing needle. The vertical lines on the markers correspond to the confidence interval of the measurement.
Membranes 12 00765 g005
Figure 6. Example of determining θap for an air-dry MK-40 membrane.
Membranes 12 00765 g006
Figure 7. Transformation of the image of a sessile drop as a function of the time as it reached the surface of a wet (a) and dry (b) CJMC-3 sample.
Membranes 12 00765 g007
Figure 8. Contact angle values vs. time after sessile of a drop to the surface of a wet and dry CJMC-3 sample. The shaded area shows the confidence interval.
Membranes 12 00765 g008
Figure 9. Optical images of the surface and cross-sections of an unreinforced homogeneous CJMA-4 membrane (a) and a heterogeneous MA-41 membrane (b). RP is an ion-exchange resin particle; RN is a filament of reinforcing net; PE is a polyethylene binder.
Membranes 12 00765 g009
Figure 10. Surface profiles of swollen ion-exchange membranes CMX (a), AMX (b), MK-40 (c) and Ralex AMH PES (d).
Membranes 12 00765 g010
Figure 11. Optical images of surfaces I and II and cross section of homogeneous CJMA-3 membrane (a) and heterogeneous Ralex CMH membrane (b). RN is a filament of reinforcing fabric; PE is a polyethylene binder.
Membranes 12 00765 g011
Figure 12. Profilograms of the surfaces of swollen ion-exchange membranes CJMA-3 (a,b) and Ralex CMH PES (c,d).
Membranes 12 00765 g012
Figure 13. Images of droplets on the surfaces of the studied swollen membranes with unequal surfaces CJMA-3—I (a), CJMA-3—II (b), Ralex CMH PES—I (c) and Ralex CMH PES—II (d).
Membranes 12 00765 g013
Table 1. Characteristics of the membranes under study.
ManufacturerMembranesIon Exchange
Matrix
Functional GroupsInert BinderReinforcing MaterialThickness of Wet Membrane, MicronsWater Content, gН2О/g Dry, %Exchange
Capacity,
mmol g−1 Wet
Homogeneous membranes
Astom, JapanCMXDVB + PS S O 3 PVCPVC175 ± 223.2 [60]1.61 ± 0.05 [60]
CSEno datano data-141 ± 242 [61]1.85 [61]
AMXDVB + PS N + ( C H 3 ) 3 PVCPVC127 ± 114.4 [60]1.23 ± 0.05 [60]
ACMno datano datano datano data101 ± 113.9 [62]1.58 [62]
Hefei Chemjoy Polymer Material, ChinaCJMA-2no data N + ( C H 3 ) 3 no datano data141 ± 235 [63]0.8–1.0 [63]
CJMA-3PVDFno dataPET143 ± 217 [64]0.57 ± 0.05 [64]
CJMA-4no data-98 ± 115–20 [65]0.5–0.6 [65]
CJMC-2 S O 3 no datano data161 ± 2200 [63]0.8–1.0 [63]
CJMC-3no datapolyester183 ± 244 ± 5 [66]0.63 ± 0.05 [66]
CJMC-4no data-118 ± 135–40 [65]0.8–1.0 [65]
Heterogeneous membranes
Shchekinoazot, RussiaMK-40DVB+PS S O 3 PEnylon525 ± 325.7 [60]1.43 ± 0.08 [60]
MA-41 N + ( C H 3 ) 3 485 ± 319.1 [60]1.22 ± 0.06 [60]
MEGA, Czech RepublicCMH PES S O 3 polyester557 ± 231 [67]2.34 [67]
AMH PES N + ( C H 3 ) 3 585 ± 256 [67]1.97 [67]
DVB + PS is copolymer of polystyrene and divinylbenzene; PVC is polyvinyl chloride; PE is low-pressure polyethylene; PVDF is polyvinylidene fluoride; PET is polyethylene terephthalate.
Table 2. Main factors influencing the result of contact angle measurement using the sessile drop method and optimized experimental conditions.
Factors and ParametersOptimized Equipment, Conditions and Parameter Values
Configuration and parameters of the measuring systemSample preparationSalt pretreatment procedure and equilibration with working solution
Liquid dosing systemA syringe pump connected to a dispensing needle (needle tip shape pst3, size 20G). Fluid dispensing rate W = 55 µL/min (corresponds to a droplet volume of 14.4 µL)
Tilt angle of the microscope lens1.5°
Background lightingLED source with a diffuser located behind the sample
Distance between needle and sample4–5 mm
Protocol for image registrationNumber of measurements>20 on different sample areas. Processing by Student’s t-test using Grubbs criterion
Measurement time (time to reach steady state)From 5 to 15 s
Contact angle acquisitionImage processing methodFitting method (RisingView software)
Contact angles obtained from both sides of the drop are averaged
Table 3. Experimental (θap) and reference (ƟA, ƟR) * values of the contact angles of the surface of standard materials.
MaterialDistance between Needle and Sample, mmRa, μmExperimental Contact Angle θap, DegreeReference Contact Angle, Degree
Polytetra-fluoroethylene40.4108.5 ± 0.2ƟA = 108.9
ƟR = 96.0
[83]
5108.3 ± 0.5
6108.3 ± 0.6
Polymethyl-methacrylate40.0374.6 ± 0.4ƟA = 74.7
ƟR = 54.2
[83]
574.9 ± 0.4
675.0 ± 0.5
Paraffin4-110.7 ± 0.2ƟA = 116 ± 2
ƟR = 92 ± 3
[40]
5110.8 ± 0.2
6109.6 ± 0.6
* ƟA and ƟR are the advancing and receding contact angles, respectively.
Table 4. Contact angles and roughness characteristics of swollen IEM with identical characteristics of both surfaces.
Membranesθap, °rRt, μmRa, μmSm, μm
Neosepta CMX61 ± 11.0020 ± 0.000529.3 ± 2.53.7 ± 0.3640 ± 50
Neosepta CSE53 ± 21.0001 ± 0.00015.0 ± 1.10.5 ± 0.3500–1000
Neosepta AMX68 ± 11.0003 ± 0.00019.7 ± 1.71.9 ± 0.3880 ± 240
Neosepta ACM66 ± 11.0005 ± 0.000112.2 ± 1.71.9 ± 0.2548 ± 74
CJMC-464 ± 11.0001 ± 0.00014.5 ± 20.9 ± 0.2 500–1000
CJMA-478 ± 11.0001 ± 0.00014.7 ± 1.20.8 ± 0.2500–1000
МК-4070 ± 11.0032 ± 0.000513.5 ± 4.31.9 ± 0.1245 ± 11
МА-4169 ± 11.0027 ± 0.000415.5 ± 3.51.3 ± 0.1226 ± 18
Ralex AMH PES53 ± 31.0068 ± 0.000936.5 ± 6.34 ± 0.5357 ± 58
Table 5. Contact angles and geometric heterogeneity characteristics of IEM with different surfaces.
MembranesSurfaceθap, °θY, °rRt, μmRa, μmSm, μm
CJMA-2I72 ± 2721.017 ± 0.00548.0 ± 3.08.5 ± 1.2280 ± 15
II74 ± 1741.0002 ± 0.000211.6 ± 4.11.8 ± 0.3600 ± 50
CJMA-3I51 ± 2541.066 ± 0.00689.5 ± 3.915.1 ± 0.5284 ± 6
II68 ± 2681.007 ± 0.00220.4 ± 3.22.5 ± 0.4251 ± 48
CJMC-2I67 ± 1671.0006 ± 0.000213.3 ± 7.22.1 ± 0.7 306 ± 41
II73 ± 2731.0003 ± 0.00028.9 ± 2.41.1 ± 0.2303 ± 70
CJMC-3I51 ± 2521.006 ± 0.00419.2 ± 2.62.9 ± 0.4280 ± 20
II60 ± 1601.0016 ± 0.000215.4 ± 4.82.8 ± 0.4285 ± 27
Ralex CMH PESI43 ± 5441.0079 ± 0.001116.7 ± 4.23.6 ± 0.4303 ± 35
II74 ± 5741.0076 ± 0.000821.6 ± 3.43.4 ± 0.5296 ± 92
θY is Young’s contact angle determined according to Equation (2).
Publisher’s Note: MDPI stays neutral with regard to jurisdictional claims in published maps and institutional affiliations.