
Comparative Evaluation of Commercial Protein A Membranes for the Rapid Purification of Antibodies


Abstract
1. Introduction
2. Materials and Methods
2.1. Materials
2.2. Physical Properties
2.2.1. Surface Area Measurements
2.2.2. Pore Diameter Measurements
2.2.3. Permeability and Pressure Drop Measurements
2.3. Performance Measurements
2.3.1. Buffer Preparation
2.3.2. Breakthrough Behavior and Dynamic Binding Capacity (DBC10) Measurements
2.3.3. Static Mode Equilibrium Binding Capacity Measurements and Application of the Langmuir Adsorption Isotherm
2.3.4. Dynamic Mode Equilibrium Binding Capacity Measurements
2.3.5. Elution Volume (EV)
2.3.6. Clean-in-Place (CIP) Study
2.3.7. Capture from Clarified Cell Culture Harvest
3. Results
3.1. Breakthrough Behavior and Dynamic Binding Capacity
3.2. Equilibrium Binding Capacity Measured in Static and Dynamic Modes
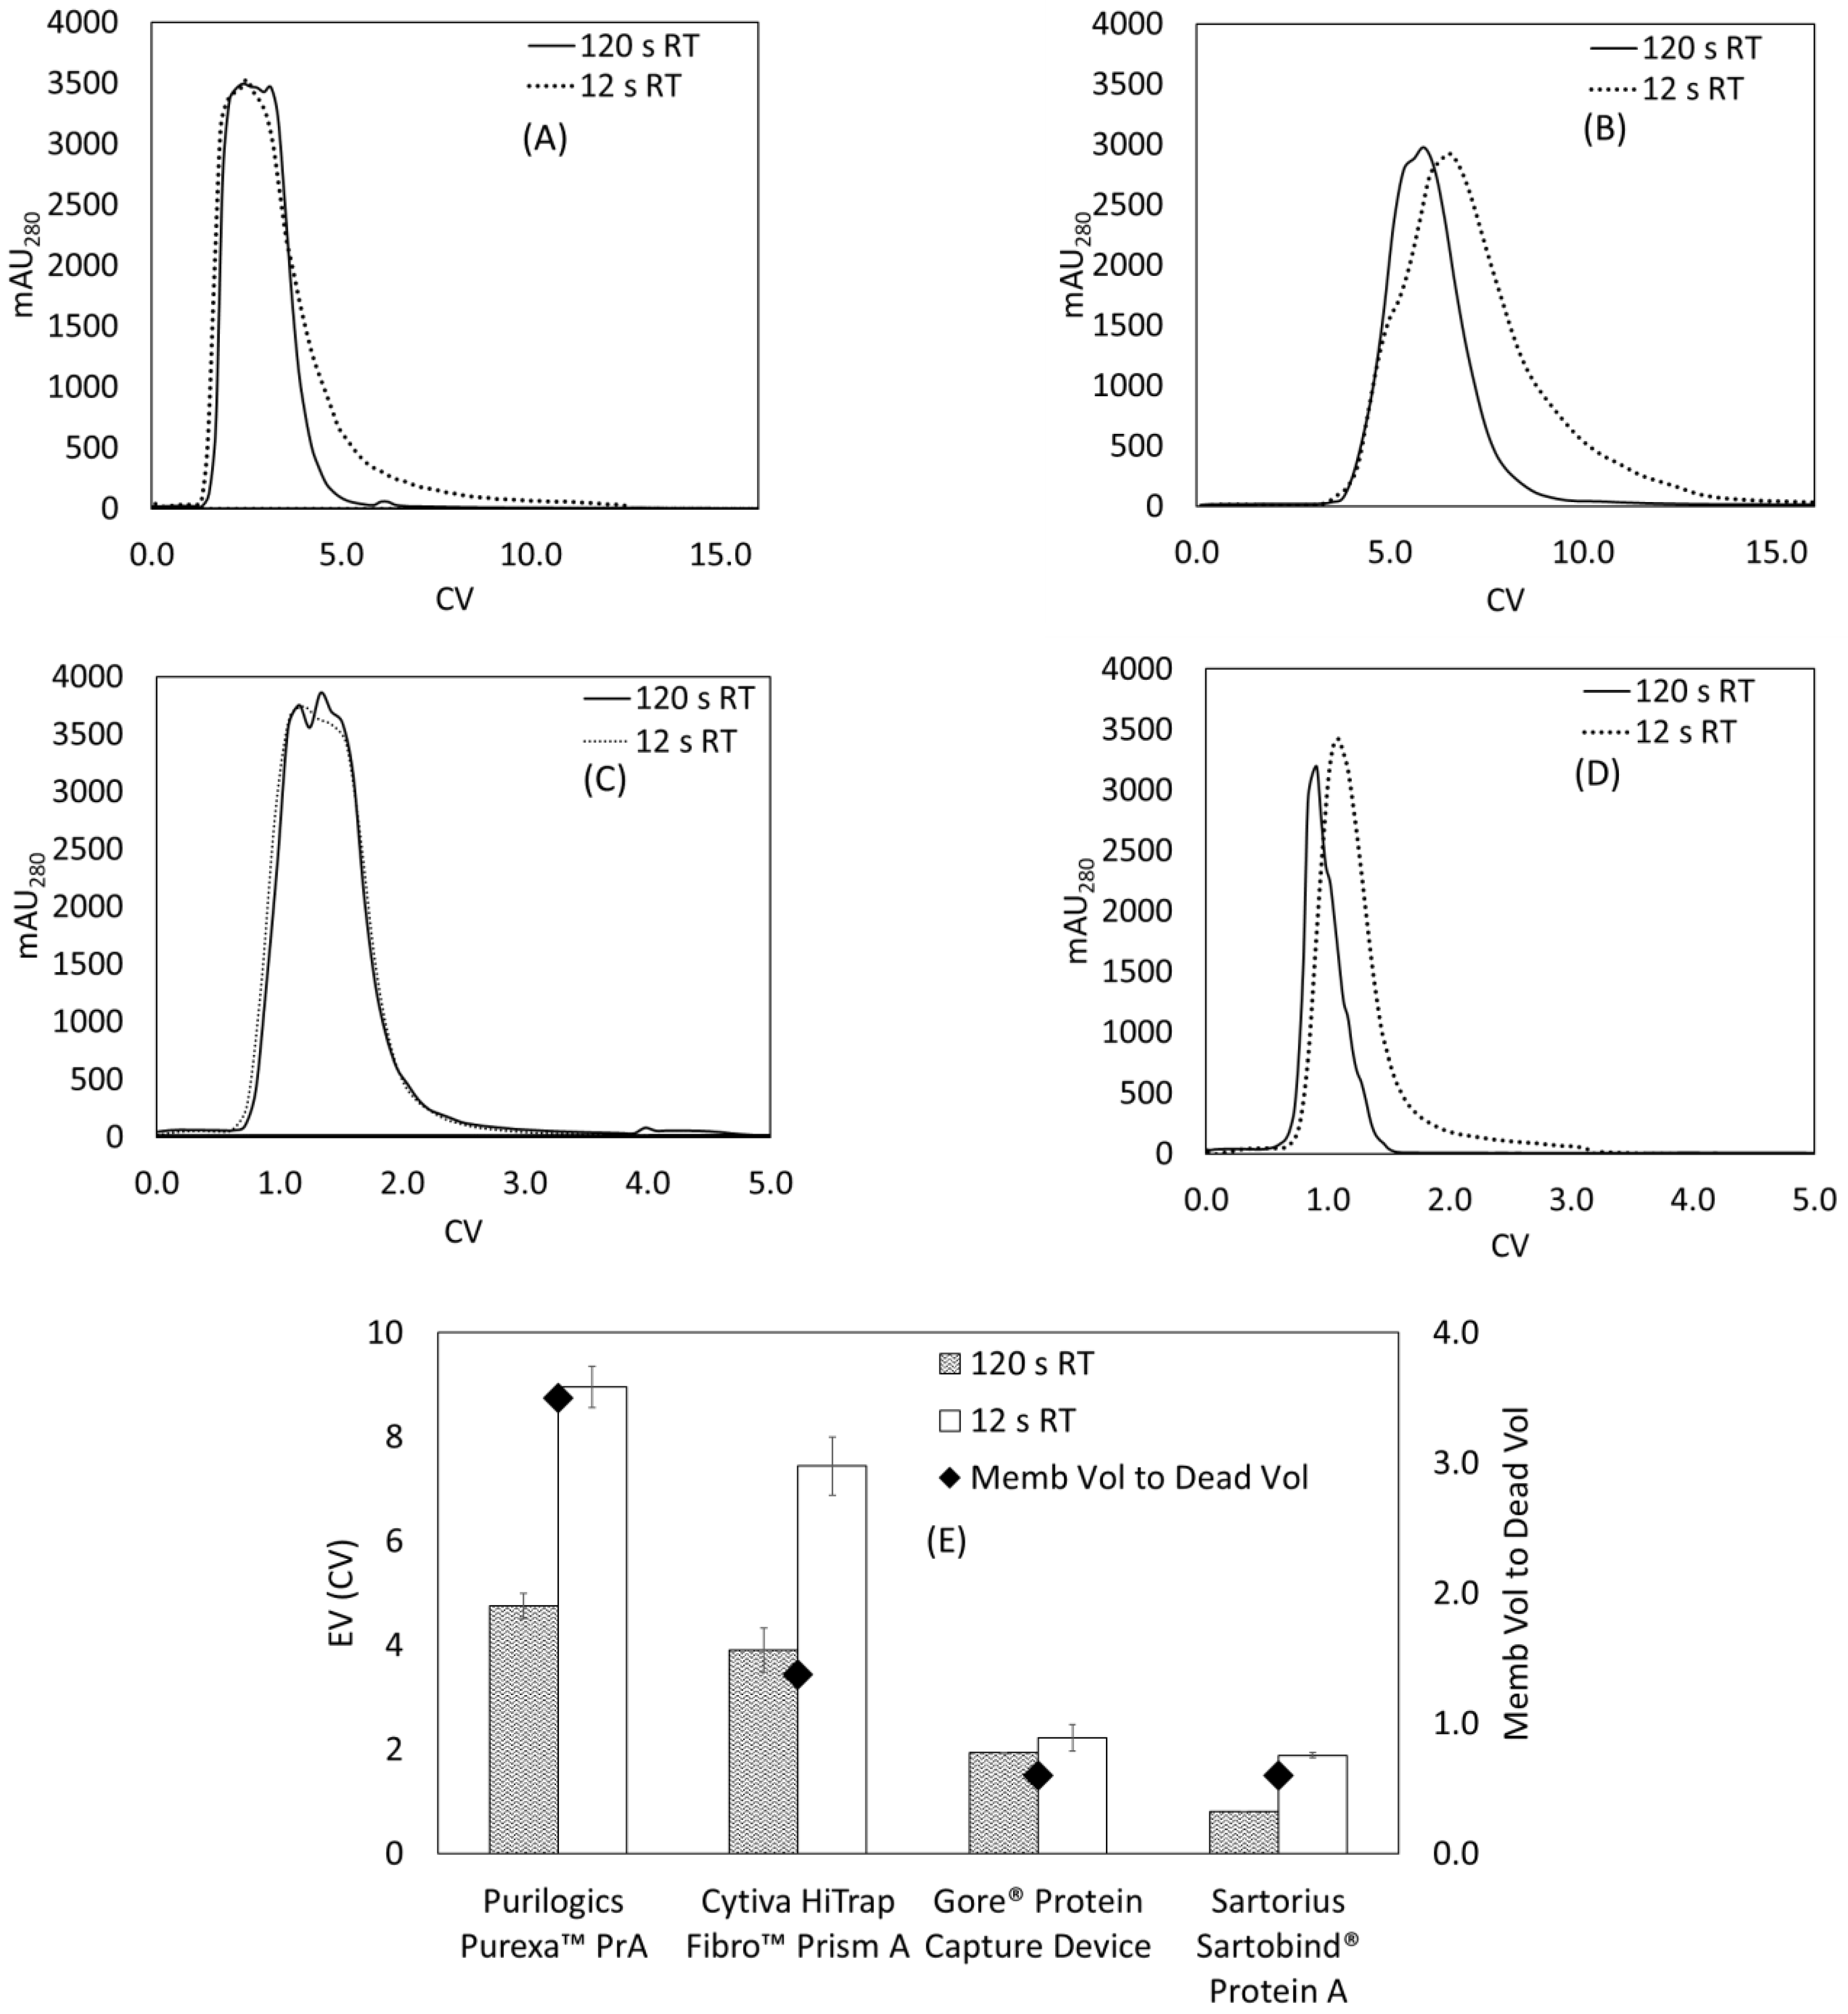
3.3. Elution Behavior
3.4. Clean-in-Place (CIP) Study
3.5. Permeability and Pressure Drop
3.6. Capture from Clarified Cell Culture Harvest
4. New Membrane Product
5. Conclusions
Supplementary Materials
Author Contributions
Funding
Institutional Review Board Statement
Data Availability Statement
Acknowledgments
Conflicts of Interest
References
- Łącki, K.M.; Riske, F.J. Affinity Chromatography: An Enabling Technology for Large-Scale Bioprocessing. Biotechnol. J. 2019, 15, 1800397. [Google Scholar] [CrossRef]
- Bolton, G.R.; Mehta, K.K. The role of more than 40 years of improvement in protein A chromatography in the growth of the therapeutic antibody industry. Biotechnol. Prog. 2016, 32, 1193–1202. [Google Scholar] [CrossRef]
- Pollock, J.; Bolton, G.; Coffman, J.; Ho, S.V.; Bracewell, D.; Farid, S. Optimising the design and operation of semi-continuous affinity chromatography for clinical and commercial manufacture. J. Chromatogr. A 2013, 1284, 17–27. [Google Scholar] [CrossRef]
- Baur, D.; Angarita, M.; Müller-Späth, T.; Steinebach, F.; Morbidelli, M. Comparison of batch and continuous multi-column protein A capture processes by optimal design. Biotechnol. J. 2016, 11, 920–931. [Google Scholar] [CrossRef]
- Girard, V.; Hilbold, N.-J.; Ng, C.K.; Pegon, L.; Chahim, W.; Rousset, F.; Monchois, V. Large-scale monoclonal antibody purification by continuous chromatography, from process design to scale-up. J. Biotechnol. 2015, 213, 65–73. [Google Scholar] [CrossRef] [PubMed]
- Somasundaram, B.; Pleitt, K.; Shave, E.; Baker, K.; Lua, L.H.L. Progression of continuous downstream processing of monoclonal antibodies: Current trends and challenges. Biotechnol. Bioeng. 2018, 115, 2893–2907. [Google Scholar] [CrossRef] [PubMed]
- Knudsen, H.L.; Fahrner, R.L.; Xu, Y.; Norling, L.A.; Blank, G.S. Membrane ion-exchange chromatography for process-scale antibody purification. J. Chromatogr. A 2001, 907, 145–154. [Google Scholar] [CrossRef]
- Trnovec, H.; Doles, T.; Hribar, G.; Furlan, N.; Podgornik, A. Characterization of membrane adsorbers used for impurity removal during the continuous purification of monoclonal antibodies. J. Chromatogr. A 2019, 1609, 460518. [Google Scholar] [CrossRef] [PubMed]
- Hahn, R.; Shimahara, K.; Steindl, F.; Jungbauer, A. Comparison of protein A affinity sorbents III. Life time study. J. Chromatogr. A 2006, 1102, 224–231. [Google Scholar] [CrossRef]
- Hahn, R.; Bauerhansl, P.; Shimahara, K.; Wizniewski, C.; Tscheliessnig, A.; Jungbauer, A. Comparison of protein A affinity sorbents: II. Mass transfer properties. J. Chromatogr. A 2005, 1093, 98–110. [Google Scholar] [CrossRef]
- Hahn, R.; Schlegel, R.; Jungbauer, A. Comparison of protein A affinity sorbents. J. Chromatogr. B 2003, 790, 35–51. [Google Scholar] [CrossRef] [PubMed]
- Ghose, S.; Hubbard, B.; Cramer, S.M. Binding capacity differences for antibodies and Fc-fusion proteins on protein A chromatographic materials. Biotechnol. Bioeng. 2006, 96, 768–779. [Google Scholar] [CrossRef] [PubMed]
- Pabst, T.M.; Thai, J.; Hunter, A.K. Evaluation of recent Protein A stationary phase innovations for capture of biotherapeutics. J. Chromatogr. A 2018, 1554, 45–60. [Google Scholar] [CrossRef]
- Liu, Z.; Mostafa, S.S.; Shukla, A.A. A comparison of Protein A chromatographic stationary phases: Performance characteristics for monoclonal antibody purification. Biotechnol. Appl. Biochem. 2014, 62, 37–47. [Google Scholar] [CrossRef]
- Herigstad, M.O.; Dimartino, S.; Boi, C.; Sarti, G.C. Experimental characterization of the transport phenomena, adsorption, and elution in a protein A affinity monolithic medium. J. Chromatogr. A 2015, 1407, 130–138. [Google Scholar] [CrossRef]
- Klaubert, S.R.; Chitwood, D.G.; Dahodwala, H.; Williamson, M.; Kasper, R.; Lee, K.H.; Harcum, S.W. Method to transfer Chinese hamster ovary (CHO) batch shake flask experiments to large-scale, computer-controlled fed-batch bioreactors. Methods Enzymol. 2021, 660, 297–320. [Google Scholar] [CrossRef] [PubMed]
- Ghosh, R. Protein separation using membrane chromatography: Opportunities and challenges. J. Chromatogr. A 2002, 952, 13–27. [Google Scholar] [CrossRef] [PubMed]
- Boi, C.; DiMartino, S. Advances in Membrane Chromatography for the Capture Step of Monoclonal Antibodies. Curr. Org. Chem. 2017, 21, 1753–1759. [Google Scholar] [CrossRef]
- Roper, D.; Lightfoot, E.N. Separation of biomolecules using adsorptive membranes. J. Chromatogr. A 1995, 702, 3–26. [Google Scholar] [CrossRef]
- Suen, S.-Y.; Etzel, M.R. A mathematical analysis of affinity membrane bioseparations. Chem. Eng. Sci. 1992, 47, 1355–1364. [Google Scholar] [CrossRef]
- Michael, M.C.; Swetlin, B.J.; Zukor, K.S.; de Grace, H. Affinity Chromatography Devices. US Patent 10,526,367 B2, 7 January 2020. [Google Scholar]
- Westman, D.; Forss, A.; Rodrigo, G.; Björkman, T.; Vasic, J. A Next-Generation Protein A Resin for Improved Productivity and Bioburden Control. 2017. Available online: https://www.processdevelopmentforum.com/ppts/posters/ProteinA-resin-improv-prod-bioburden-ctrl-CY15160-12Jul20-PT.pdf (accessed on 1 November 2021).
- Grünberg, M.; Kuchemüller, K.B.; Töppner, K.; Busse, R.A. Scalable, Robust and Highly Productive Novel Convecdiff Membrane Platform for mAb Capture. Membranes 2022, 12, 677. [Google Scholar] [CrossRef] [PubMed]
- Katrin, T.; Goodwine, C.; Busse, R.A.; Thom, V.; Adametz, P. Purification of Antibodies Using Novel Convecdiff Mem-branes Part 1: Providing High Binding Capacity at Short Residence Time and Low Pressure Drops. BioPharm Int. 2023, 36, 22–27. [Google Scholar]
- Teepakorn, C.; Fiaty, K.; Charcosset, C. Effect of geometry and scale for axial and radial flow membrane chromatography—Experimental study of bovin serum albumin adsorption. J. Chromatogr. A 2015, 1403, 45–53. [Google Scholar] [CrossRef]
- Lalli, E.; Silva, J.S.; Boi, C.; Sarti, G.C. Affinity Membranes and Monoliths for Protein Purification. Membranes 2019, 10, 1. [Google Scholar] [CrossRef]
- Van Beijeren, P.; Kreis, P.; Zeiner, T. Ion exchange membrane adsorption of bovine serum albumin—Impact of operating and buffer conditions on breakthrough curves. J. Membr. Sci. 2012, 415–416, 568–576. [Google Scholar] [CrossRef]
- Natarajan, V.; Zydney, A.L. Protein a chromatography at high titers. Biotechnol. Bioeng. 2013, 110, 2445–2451. [Google Scholar] [CrossRef]
- Müller, E.; Vajda, J. Routes to improve binding capacities of affinity resins demonstrated for Protein A chromatography. J. Chromatogr. B 2016, 1021, 159–168. [Google Scholar] [CrossRef]
- Swinnen, K.; Krul, A.; Van Goidsenhoven, I.; Van Tichelt, N.; Roosen, A.; Van Houdt, K. Performance comparison of protein A affinity resins for the purification of monoclonal antibodies. J. Chromatogr. B 2007, 848, 97–107. [Google Scholar] [CrossRef]
- Dhanumalayan, E.; Joshi, G.M. Performance properties and applications of polytetrafluoroethylene (PTFE)—A review. Adv. Compos. Hybrid Mater. 2018, 1, 247–268. [Google Scholar] [CrossRef]
- Jin, W.; Li, A.; Li, Y.; Yu, Y.; Shen, J.; Zhou, J.; Chen, W. Enhancing high-frequency dielectric and mechanical properties of SiO2/PTFE composites from the interface fluorination. Ceram. Int. 2022, 48, 28512–28518. [Google Scholar] [CrossRef]
- Boi, C.; DiMartino, S.; Sarti, G.C. Performance of a New Protein A Affinity Membrane for the Primary Recovery of Antibodies. Biotechnol. Prog. 2008, 24, 640–647. [Google Scholar] [CrossRef] [PubMed]
- Ghose, S.; Allen, M.; Hubbard, B.; Brooks, C.; Cramer, S.M. Antibody variable region interactions with Protein A: Implications for the development of generic purification processes. Biotechnol. Bioeng. 2005, 92, 665–673. [Google Scholar] [CrossRef]
- Zhu, J.; Sun, G. Bio-functionalized nanofibrous membranes as a hybrid platform for selective antibody recognition and capturing. RSC Adv. 2015, 5, 28115–28123. [Google Scholar] [CrossRef]
- Ma, Z.; Lan, Z.; Matsuura, T.; Ramakrishna, S. Electrospun polyethersulfone affinity membrane: Membrane preparation and performance evaluation. J. Chromatogr. B 2009, 877, 3686–3694. [Google Scholar] [CrossRef]
- Krifa, M.; Yuan, W. Morphology and pore size distribution of electrospun and centrifugal forcespun nylon 6 nanofiber membranes. Text. Res. J. 2015, 86, 1294–1306. [Google Scholar] [CrossRef]
- Hardick, O.; Dods, S.; Stevens, B.; Bracewell, D.G. Nanofiber adsorbents for high productivity downstream processing. Biotechnol. Bioeng. 2012, 110, 1119–1128. [Google Scholar] [CrossRef]
- Ghosh, R. Ultrahigh-speed, ultrahigh-resolution preparative separation of protein biopharmaceuticals using membrane chromatography. J. Sep. Sci. 2022, 45, 2024–2033. [Google Scholar] [CrossRef] [PubMed]
- Hagemann, F.; Wypysek, D.; Baitalow, K.; Adametz, P.; Thom, V.; Wessling, M. Why device design is crucial for membrane adsorbers. J. Chromatogr. Open 2022, 2, 100029. [Google Scholar] [CrossRef]
- Madadkar, P.; Wu, Q.; Ghosh, R. A laterally-fed membrane chromatography module. J. Membr. Sci. 2015, 487, 173–179. [Google Scholar] [CrossRef]
- Ghosh, R.; Madadkar, P.; Wu, Q. On the workings of laterally-fed membrane chromatography. J. Membr. Sci. 2016, 516, 26–32. [Google Scholar] [CrossRef]
- Umatheva, U.; Madadkar, P.; Selvaganapathy, P.R.; Ghosh, R. Computational fluid dynamic (CFD) simulation of laterally-fed membrane chromatography. Chem. Eng. Res. Des. 2018, 137, 412–420. [Google Scholar] [CrossRef]
- Madadkar, P.; Ghosh, R. High-resolution protein separation using a laterally-fed membrane chromatography device. J. Membr. Sci. 2016, 499, 126–133. [Google Scholar] [CrossRef]
- Cabrera, J. From Particles to Columns and Processes. Genet. Eng. Biotechnol. News 2015, 35, 30–31. [Google Scholar] [CrossRef]
- Flatman, S.; Alam, I.; Gerard, J.; Mussa, N. Process analytics for purification of monoclonal antibodies. J. Chromatogr. B 2007, 848, 79–87. [Google Scholar] [CrossRef] [PubMed]
- Ma, J.; Kilby, G.W. Sensitive, Rapid, Robust, and Reproducible Workflow for Host Cell Protein Profiling in Biopharmaceutical Process Development. J. Proteome Res. 2020, 19, 3396–3404. [Google Scholar] [CrossRef]


| Chromatography Step | Buffer | Volume Used |
|---|---|---|
| Equilibrate | 1X PBS pH 7.4 (B1) | 20 CVs |
| Load | hIgG in 1X PBS pH 7.4 | varies |
| Wash | 1X PBS pH 7.4 (B1) | 5 mL |
| Elute | 0.1 M citric acid pH 3.0 (E1) | varies |
| CIP | 0.1 M NaOH | 2 CVs |
| RT (s) | Flow Rate (mL/min) | |||
|---|---|---|---|---|
| Purilogics Purexa™ PrA | Gore® Protein Capture Device | Cytiva HiTrap Fibro™ PrismA | Sartorius Sartobind® Protein A | |
| 120 | 0.1 | 0.5 | 0.2 | 1.0 |
| 60 | 0.2 | 1.0 | 0.4 | 2.0 |
| 30 | 0.4 | 2.0 | 0.8 | 4.0 |
| 12 | 1.0 | 5.0 | 2.0 | 10.0 |
| 5 | 2.4 | 12.0 | 4.8 | 24.0 |
| Name | Isotype | Isoelectric Point | Molecular Weight (g/mol) |
|---|---|---|---|
| Anti-HIV mAb | IgG1 | 8.42 * | 154,475 * |
| Fitted Parameters | Statistical Metrics | ||
|---|---|---|---|
| qmax (mg/mL) | Kd (mg/mL) | r2 | |
| Purilogics Purexa™ PrA | 83.95 ± 3.44 | 7.07 × 10⁻² ± 1.80 × 10⁻² | 0.95 |
| Sartorius Sartobind® Protein A | 14.23 ± 0.63 | 7.63 × 10⁻² ± 2.48 × 10⁻² | 0.91 |
| Membrane | Commercial Membrane Matrix | Memb. Vol (mL) | Thickness (mm) | Permeability (m2 × 10−15) | Specific Surface Area (m2/g) | Pore Diameter (um) | |
|---|---|---|---|---|---|---|---|
| Measured | Manufacturer | ||||||
| Purilogics Purexa™ PrA | Regenerated cellulose | 0.2 | 0.4 | 0.65 | 10.54 ± 0.33 | 0.28 ± 0.05 | 0.20 |
| Cytiva HiTrap Fibro™ Prism A | Derivatized electrospun cellulose | 0.4 | 0.7 | 0.62 | 6.23 ± 0.97 | 0.25 ± 0.03 | n.a. |
| Sartorius Sartobind® Protein A | Stabilized cellulose | 2.0 | 4.0 | 6.91 | 4.90 ± 0.17 | 0.37 ± 0.03 | 0.45 |
| Gore® Protein Device | porous silica in expanded polytetrafluoroethylene | 1.0 | 3.5 | 5.14 | 27.72 ± 0.61 | n.a. | 0.1 * |
| Tailing Ratio (T) | ||
|---|---|---|
| 12 s RT | 120 s RT | |
| Purilogics Purexa™ PrA | 1.56 ± 0.07 | 1.16 ± 0.06 |
| Cytiva HiTrap Fibro™ Prism A | 3.28 ± 0.33 | 1.18 ± 0.13 |
| Gore® Protein Device | 1.50 ± 0.03 | 1.53 ± 0.02 |
| Sartorius Sartobind® Protein A | 2.52 ± 0.09 | 1.45 ± 0.04 |
Disclaimer/Publisher’s Note: The statements, opinions and data contained in all publications are solely those of the individual author(s) and contributor(s) and not of MDPI and/or the editor(s). MDPI and/or the editor(s) disclaim responsibility for any injury to people or property resulting from any ideas, methods, instructions or products referred to in the content. |
© 2023 by the authors. Licensee MDPI, Basel, Switzerland. This article is an open access article distributed under the terms and conditions of the Creative Commons Attribution (CC BY) license (https://creativecommons.org/licenses/by/4.0/).
Share and Cite
Osuofa, J.; Husson, S.M. Comparative Evaluation of Commercial Protein A Membranes for the Rapid Purification of Antibodies. Membranes 2023, 13, 511. https://doi.org/10.3390/membranes13050511
Osuofa J, Husson SM. Comparative Evaluation of Commercial Protein A Membranes for the Rapid Purification of Antibodies. Membranes. 2023; 13(5):511. https://doi.org/10.3390/membranes13050511
Chicago/Turabian StyleOsuofa, Joshua, and Scott M. Husson. 2023. "Comparative Evaluation of Commercial Protein A Membranes for the Rapid Purification of Antibodies" Membranes 13, no. 5: 511. https://doi.org/10.3390/membranes13050511
APA StyleOsuofa, J., & Husson, S. M. (2023). Comparative Evaluation of Commercial Protein A Membranes for the Rapid Purification of Antibodies. Membranes, 13(5), 511. https://doi.org/10.3390/membranes13050511