
Identification of Fouling Occurring during Coupled Electrodialysis and Bipolar Membrane Electrodialysis Treatment for Tofu Whey Protein Recovery


Abstract
1. Introduction
2. Materials and Methods
2.1. Materials
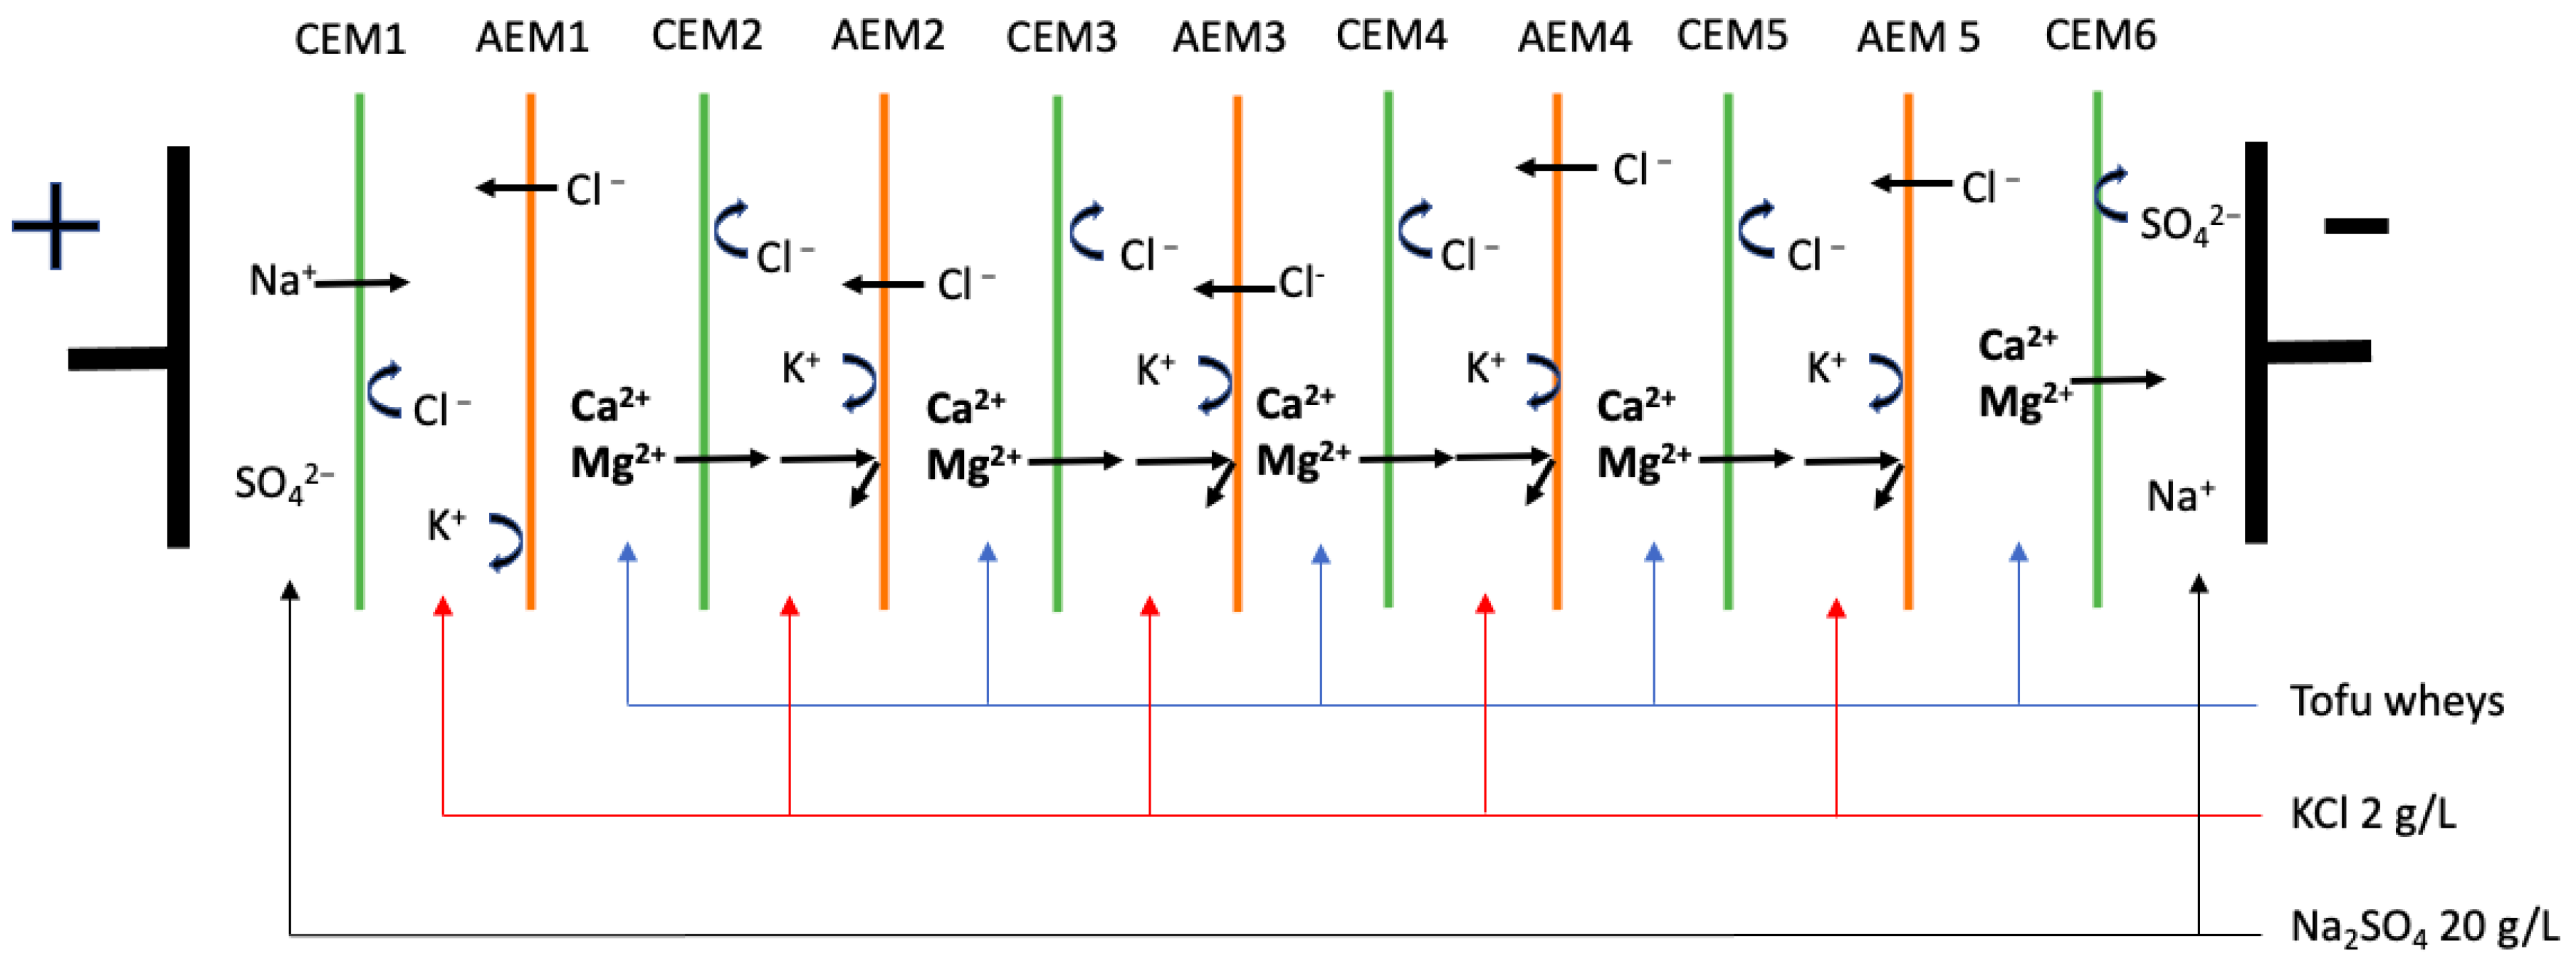
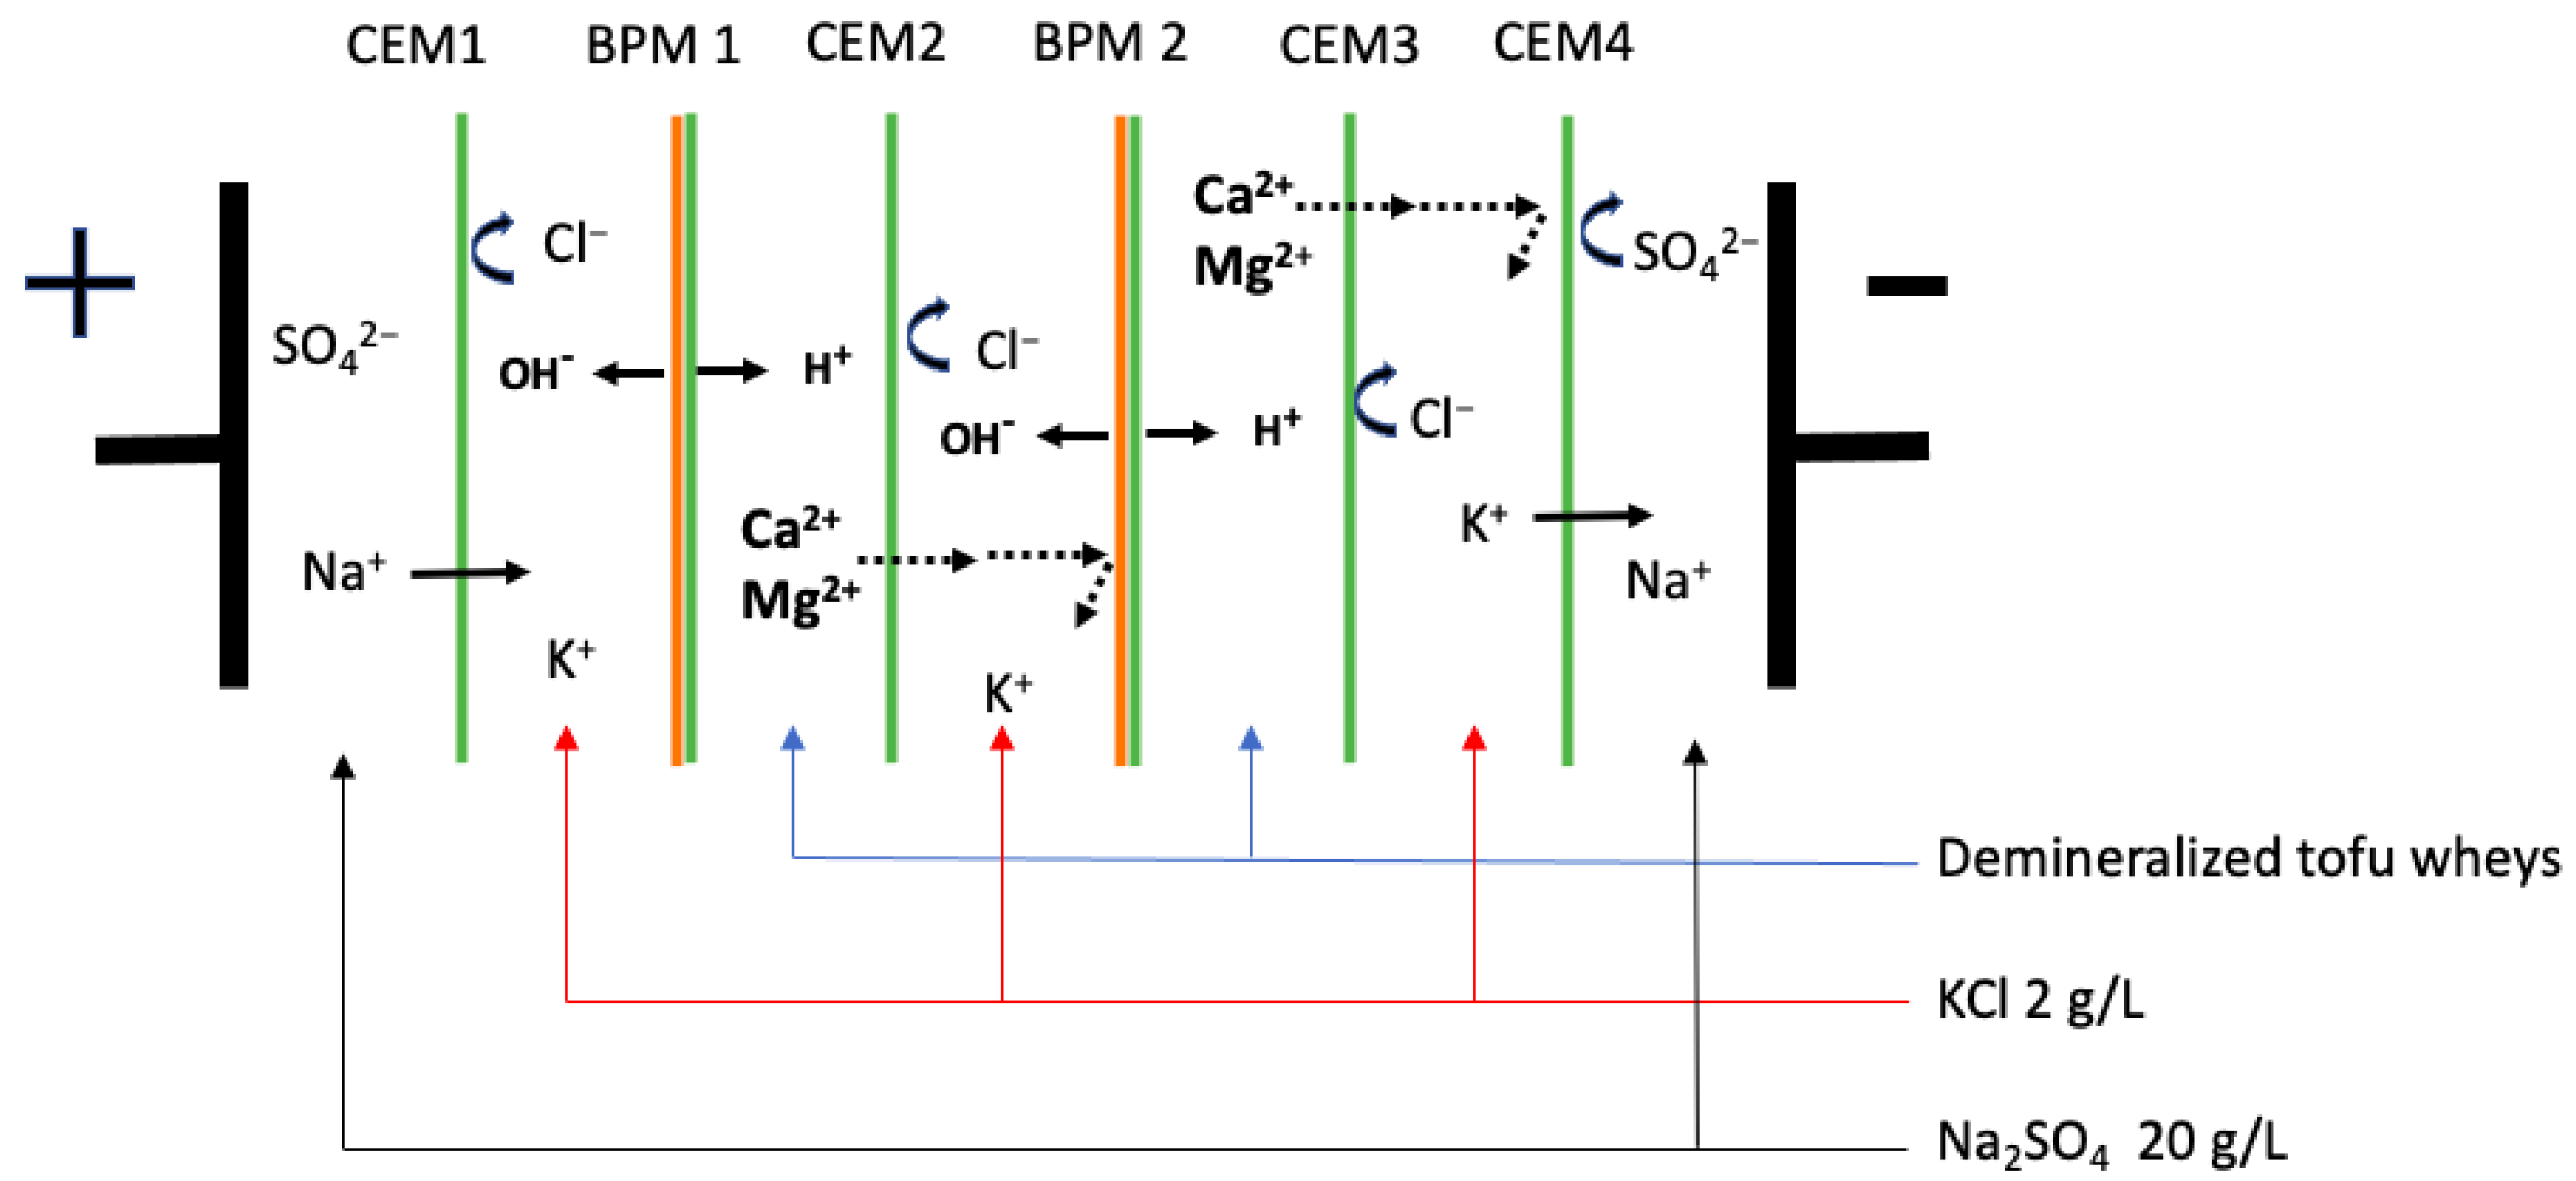
2.2. Protocol
2.3. Membrane Characterization
2.3.1. Membrane Thickness and Electrical Conductivity
2.3.2. Ash and Mineral Contents
2.3.3. Ion-Exchange Capacity
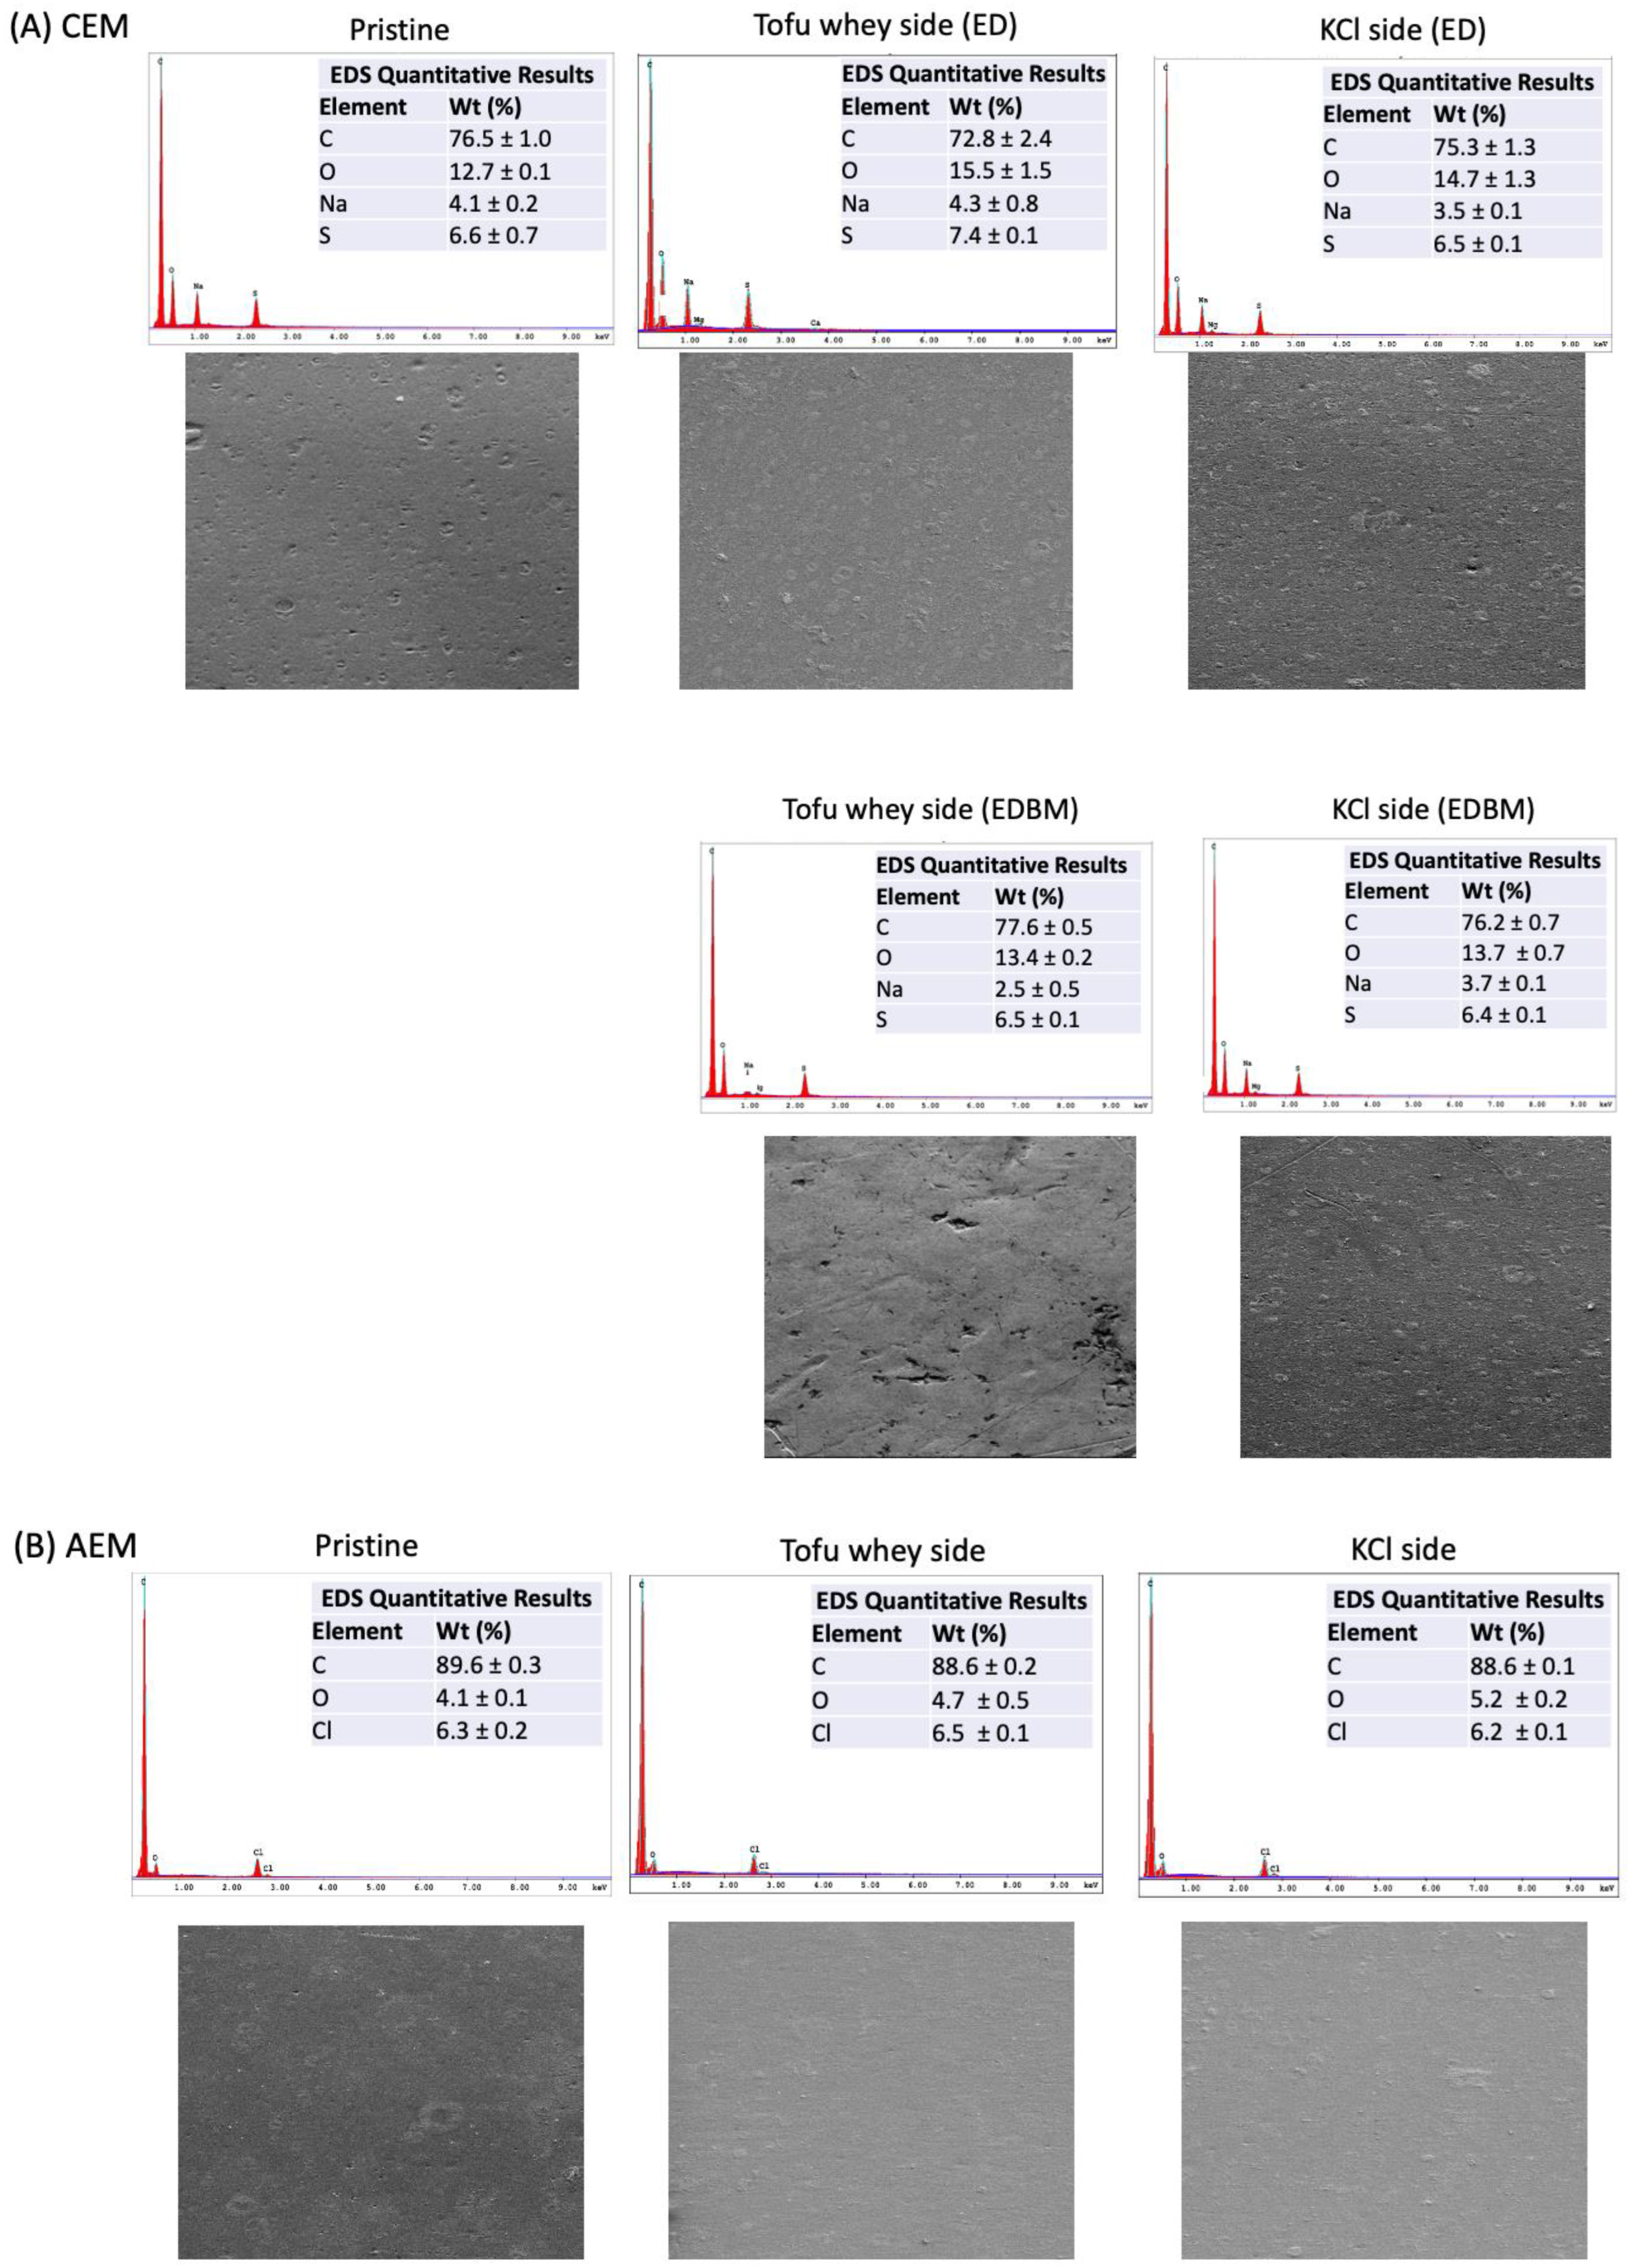
2.3.4. Scanning Electron Microscopy and X-ray Elemental Analysis (SEM/EDX)
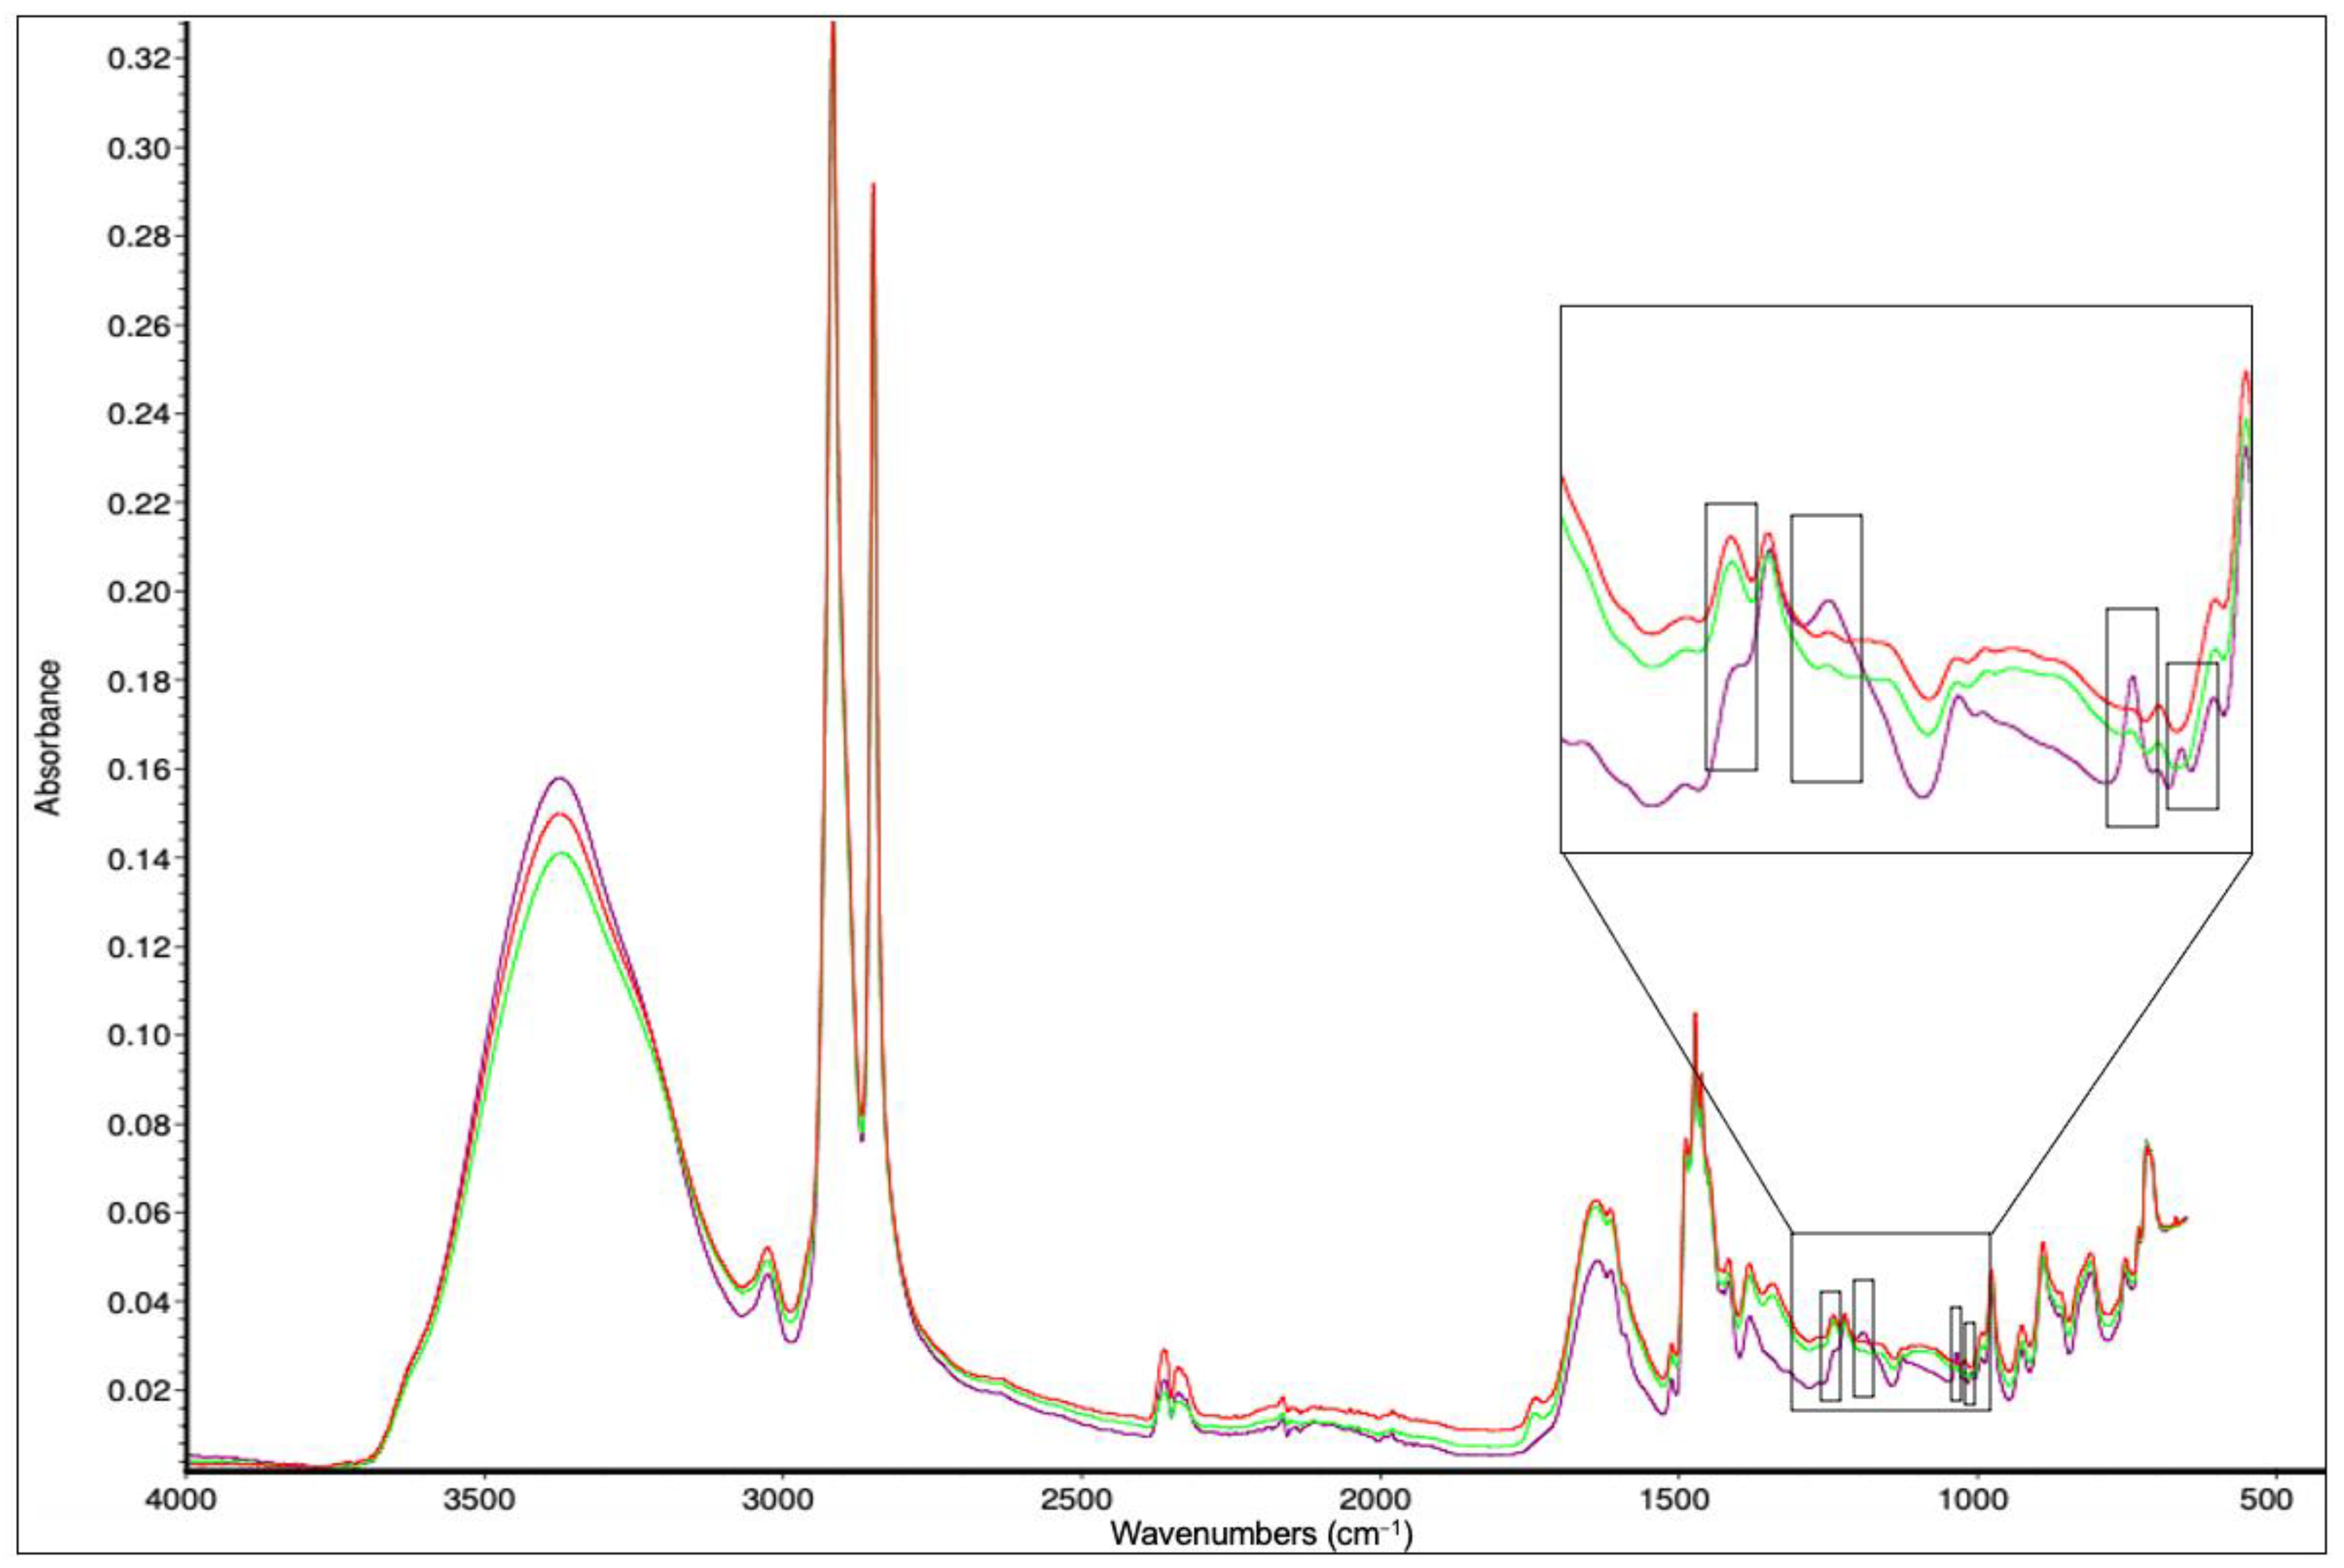
2.3.5. ATR-FTIR Analysis
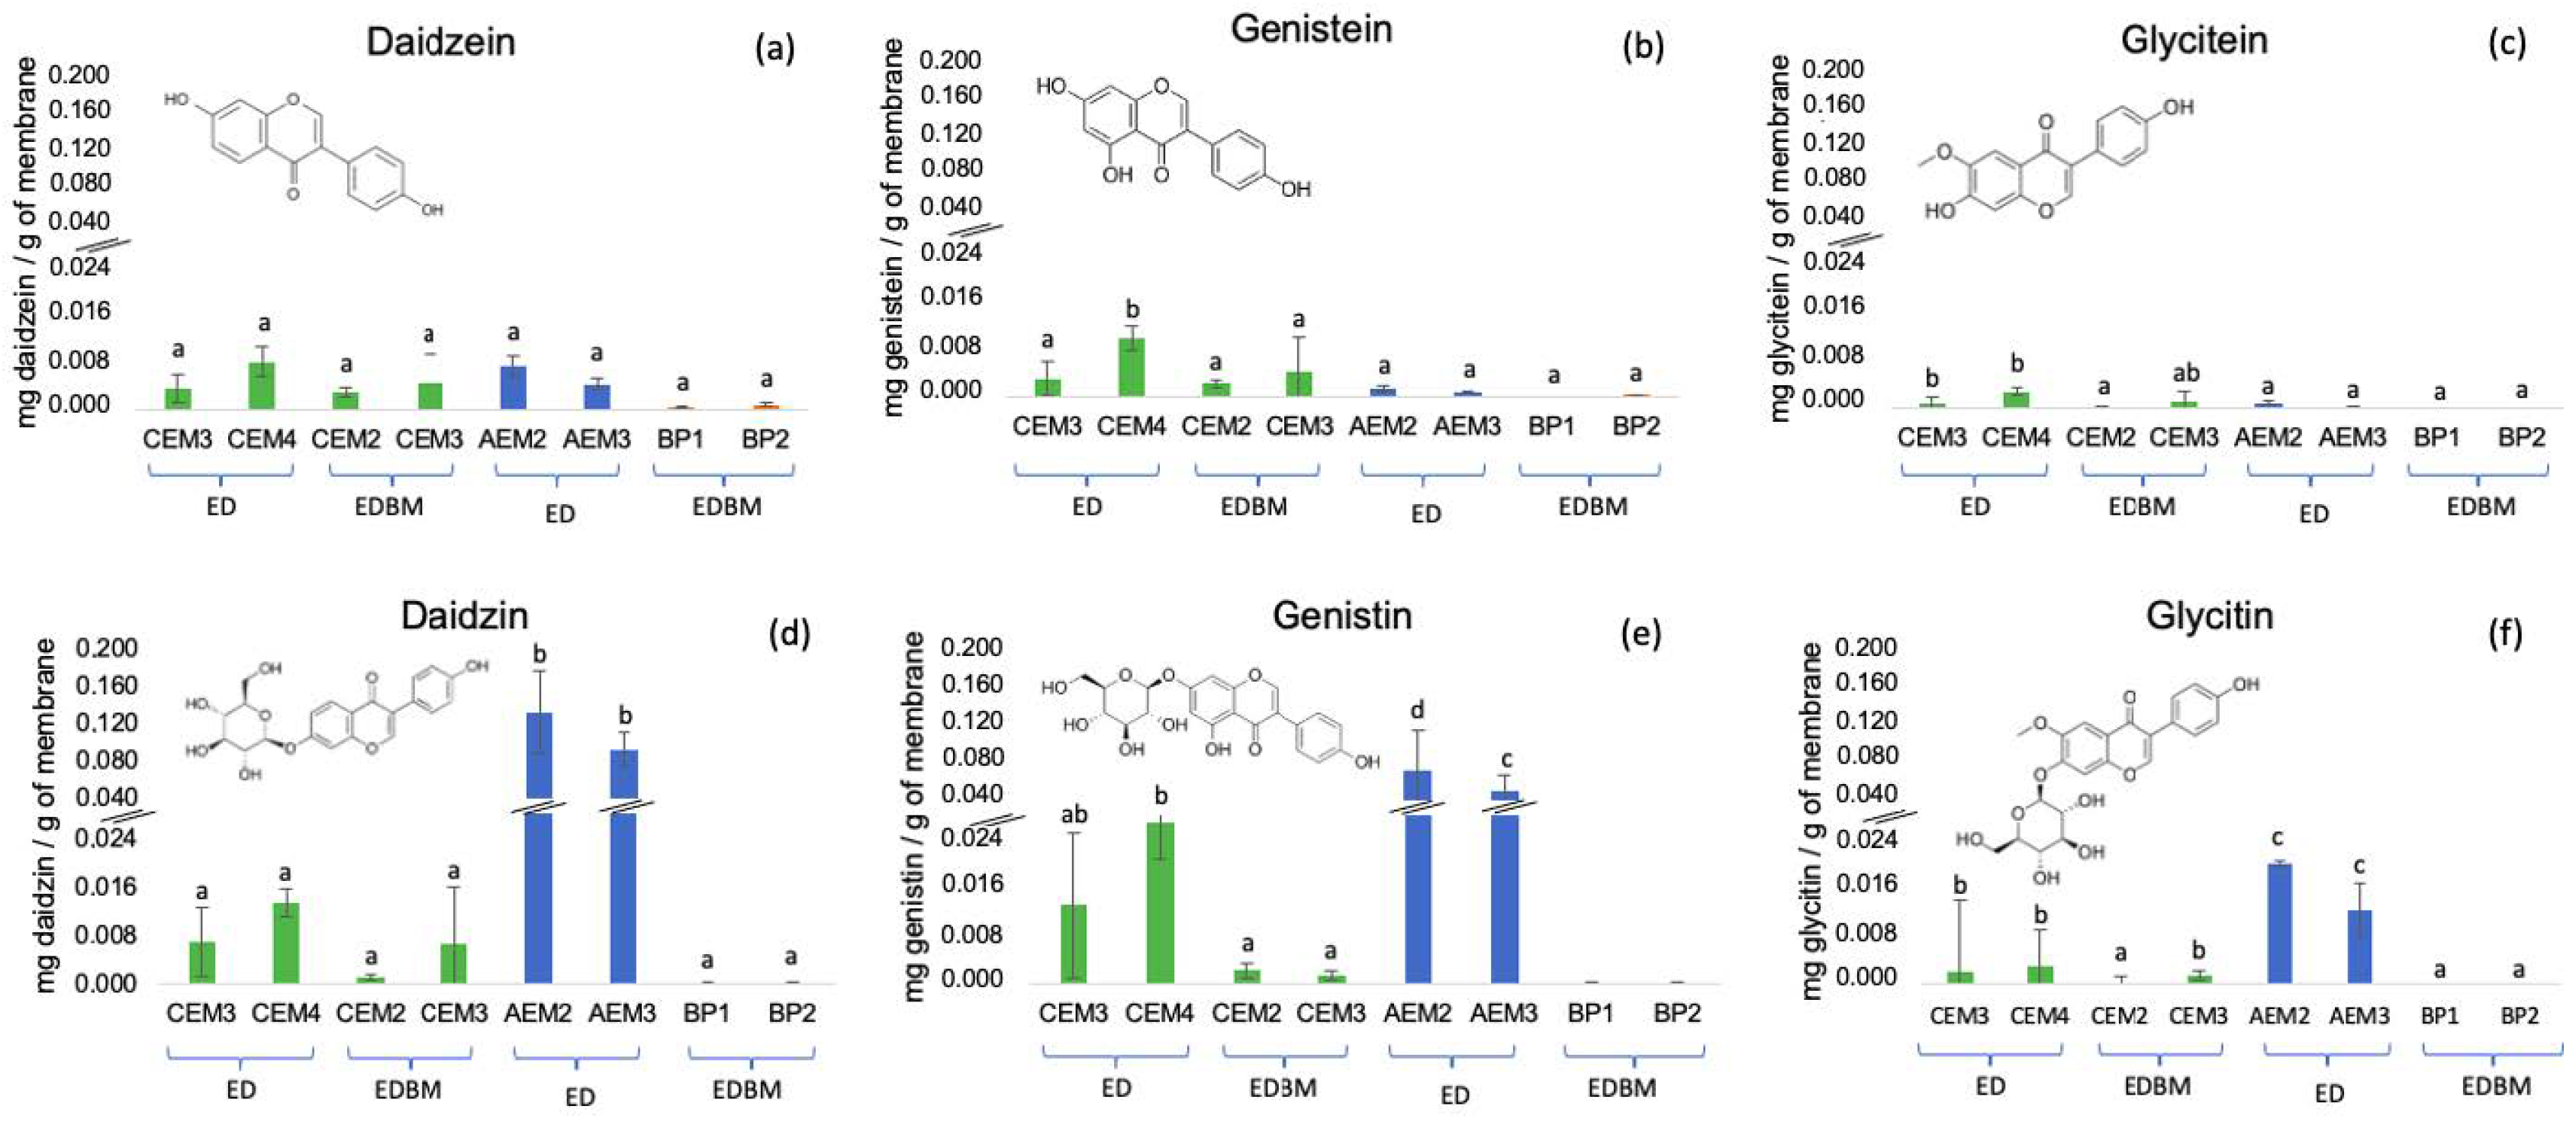
2.3.6. Isoflavone Contents
3. Results
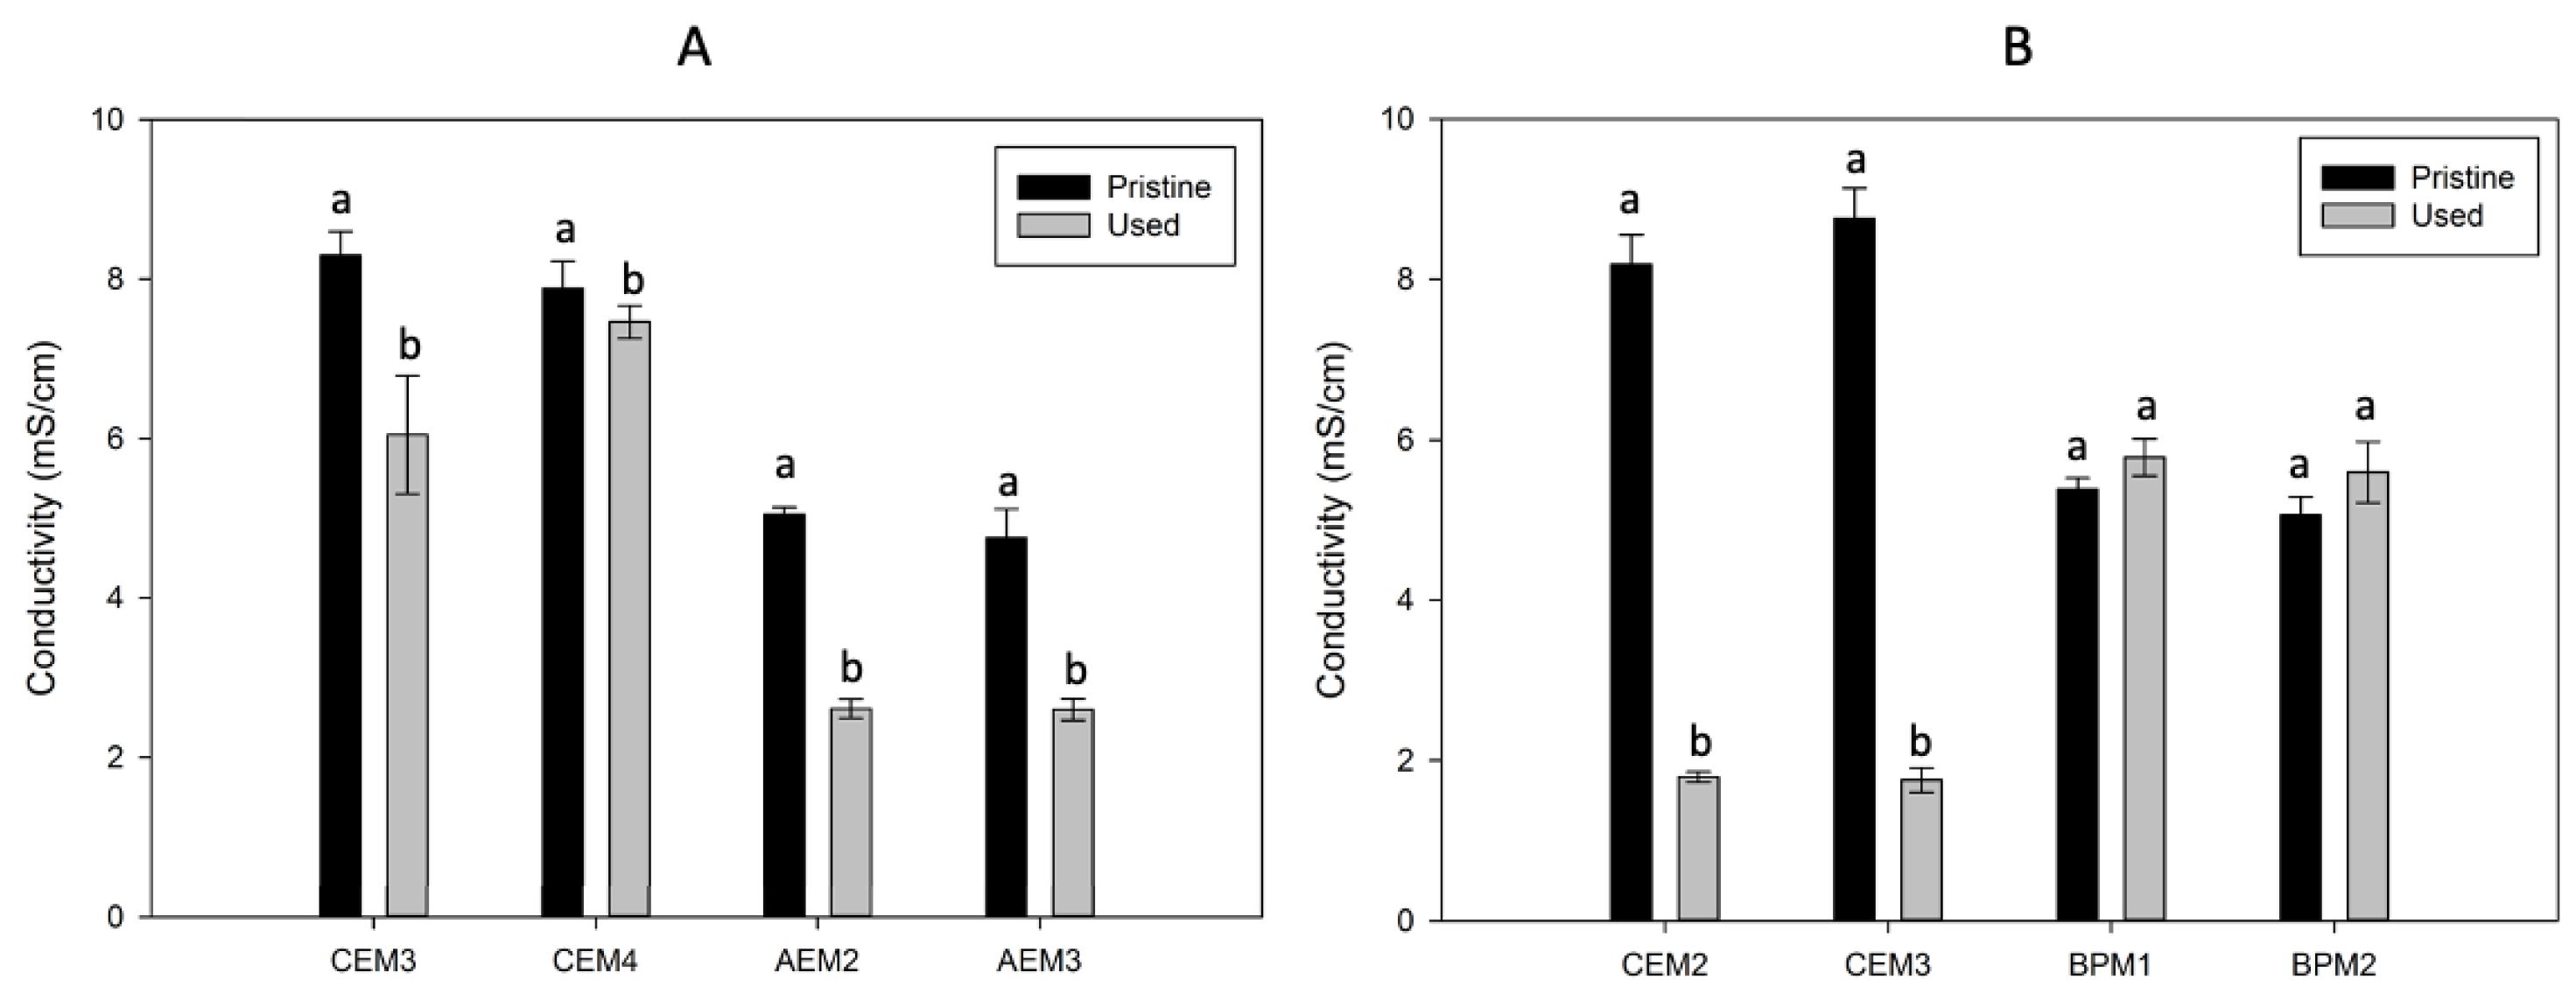
3.1. Membrane Thickness and Conductivity
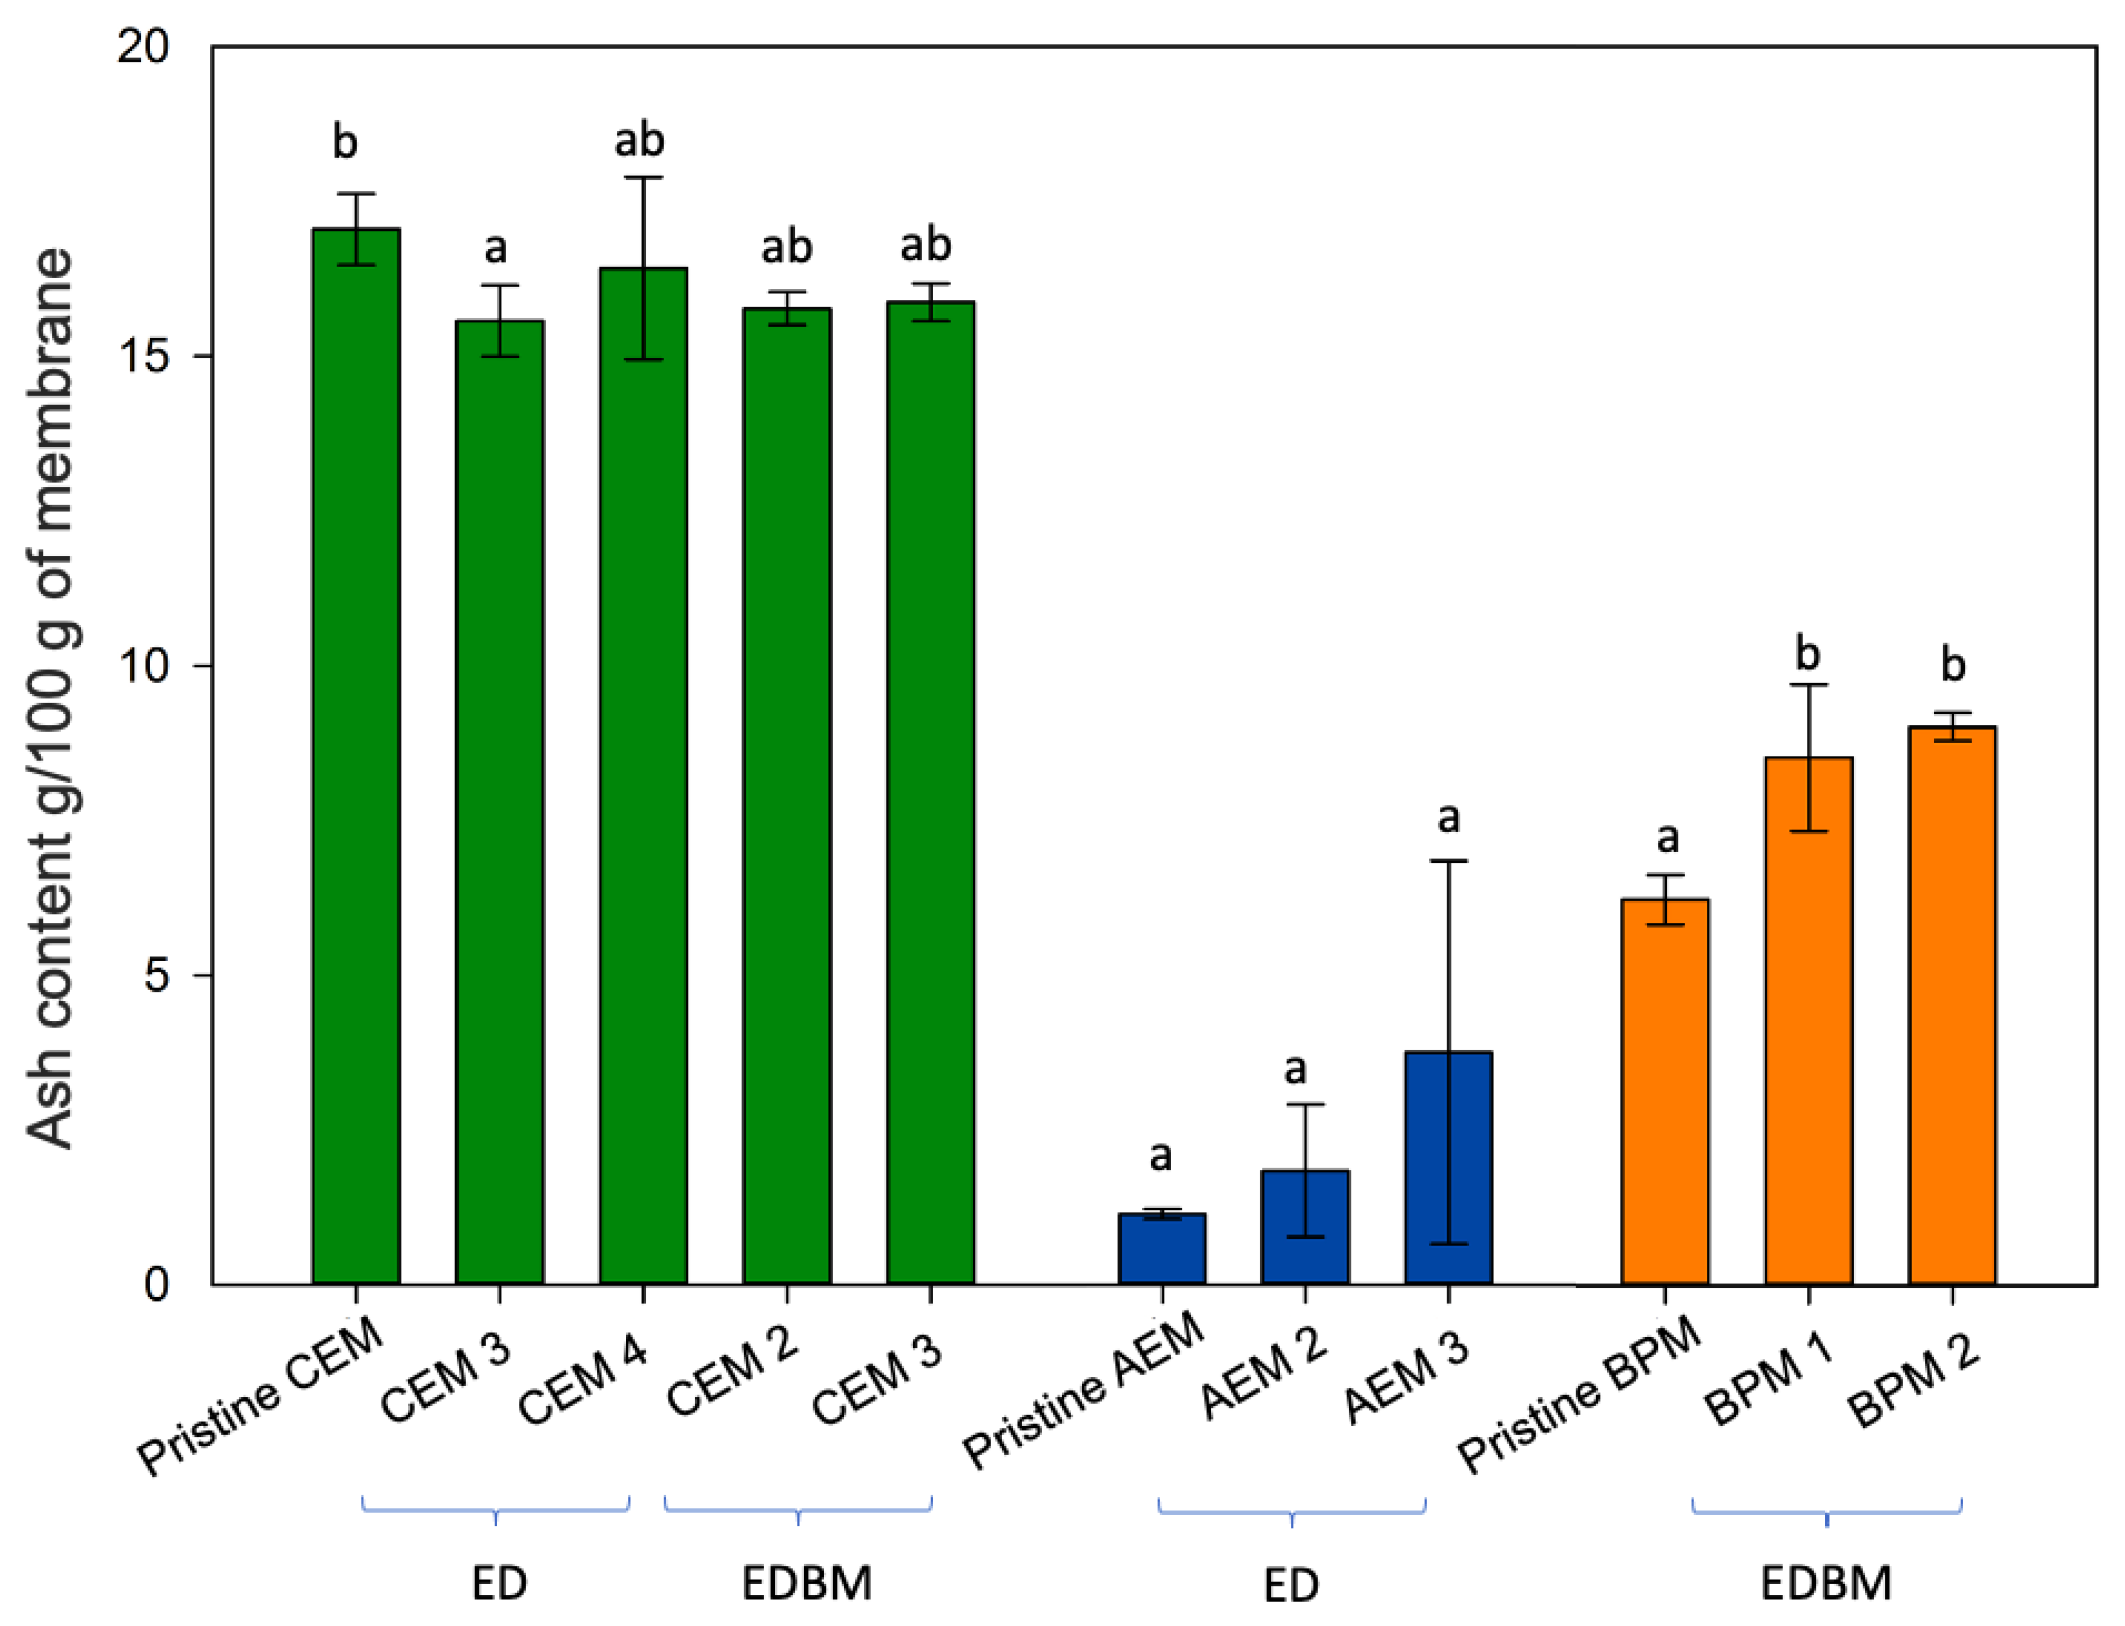
3.2. Ash and Mineral Contents
3.3. Ion-Exchange Capacity
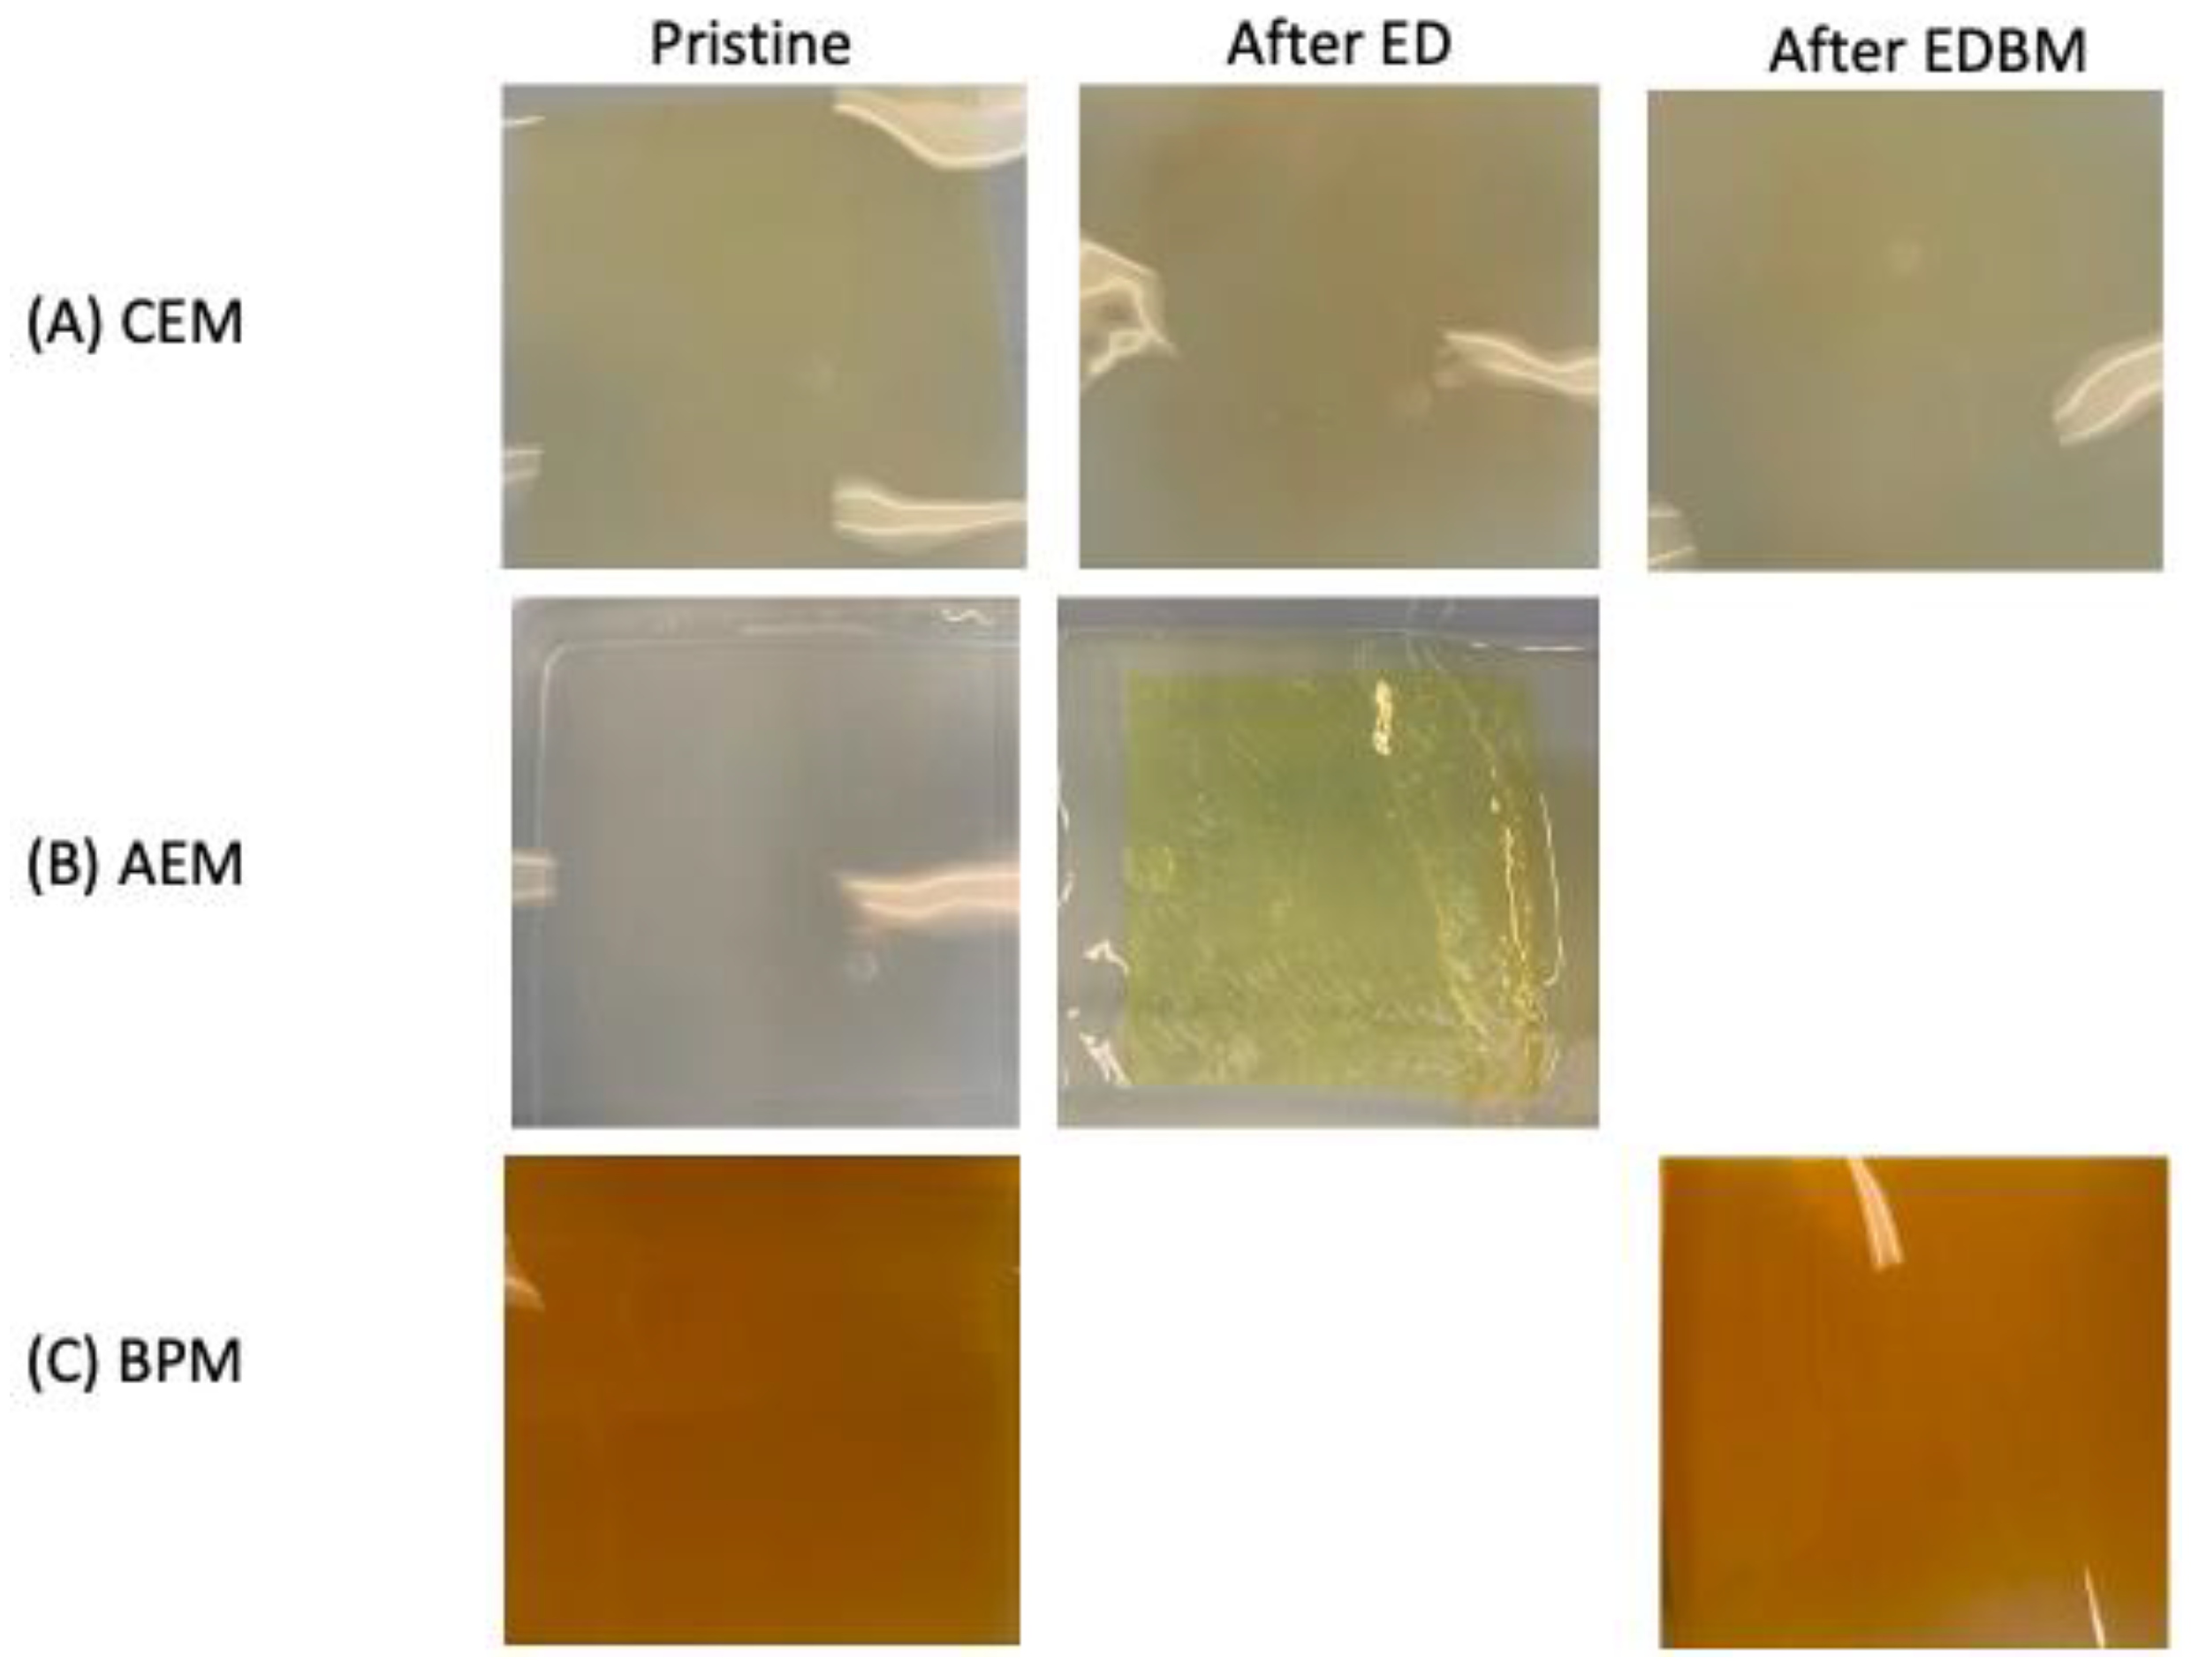
3.4. Scanning Electron Microscope and Elemental Analysis
3.5. FTIR Spectra
3.6. Isoflavone Concentration
4. Discussion
4.1. Scaling
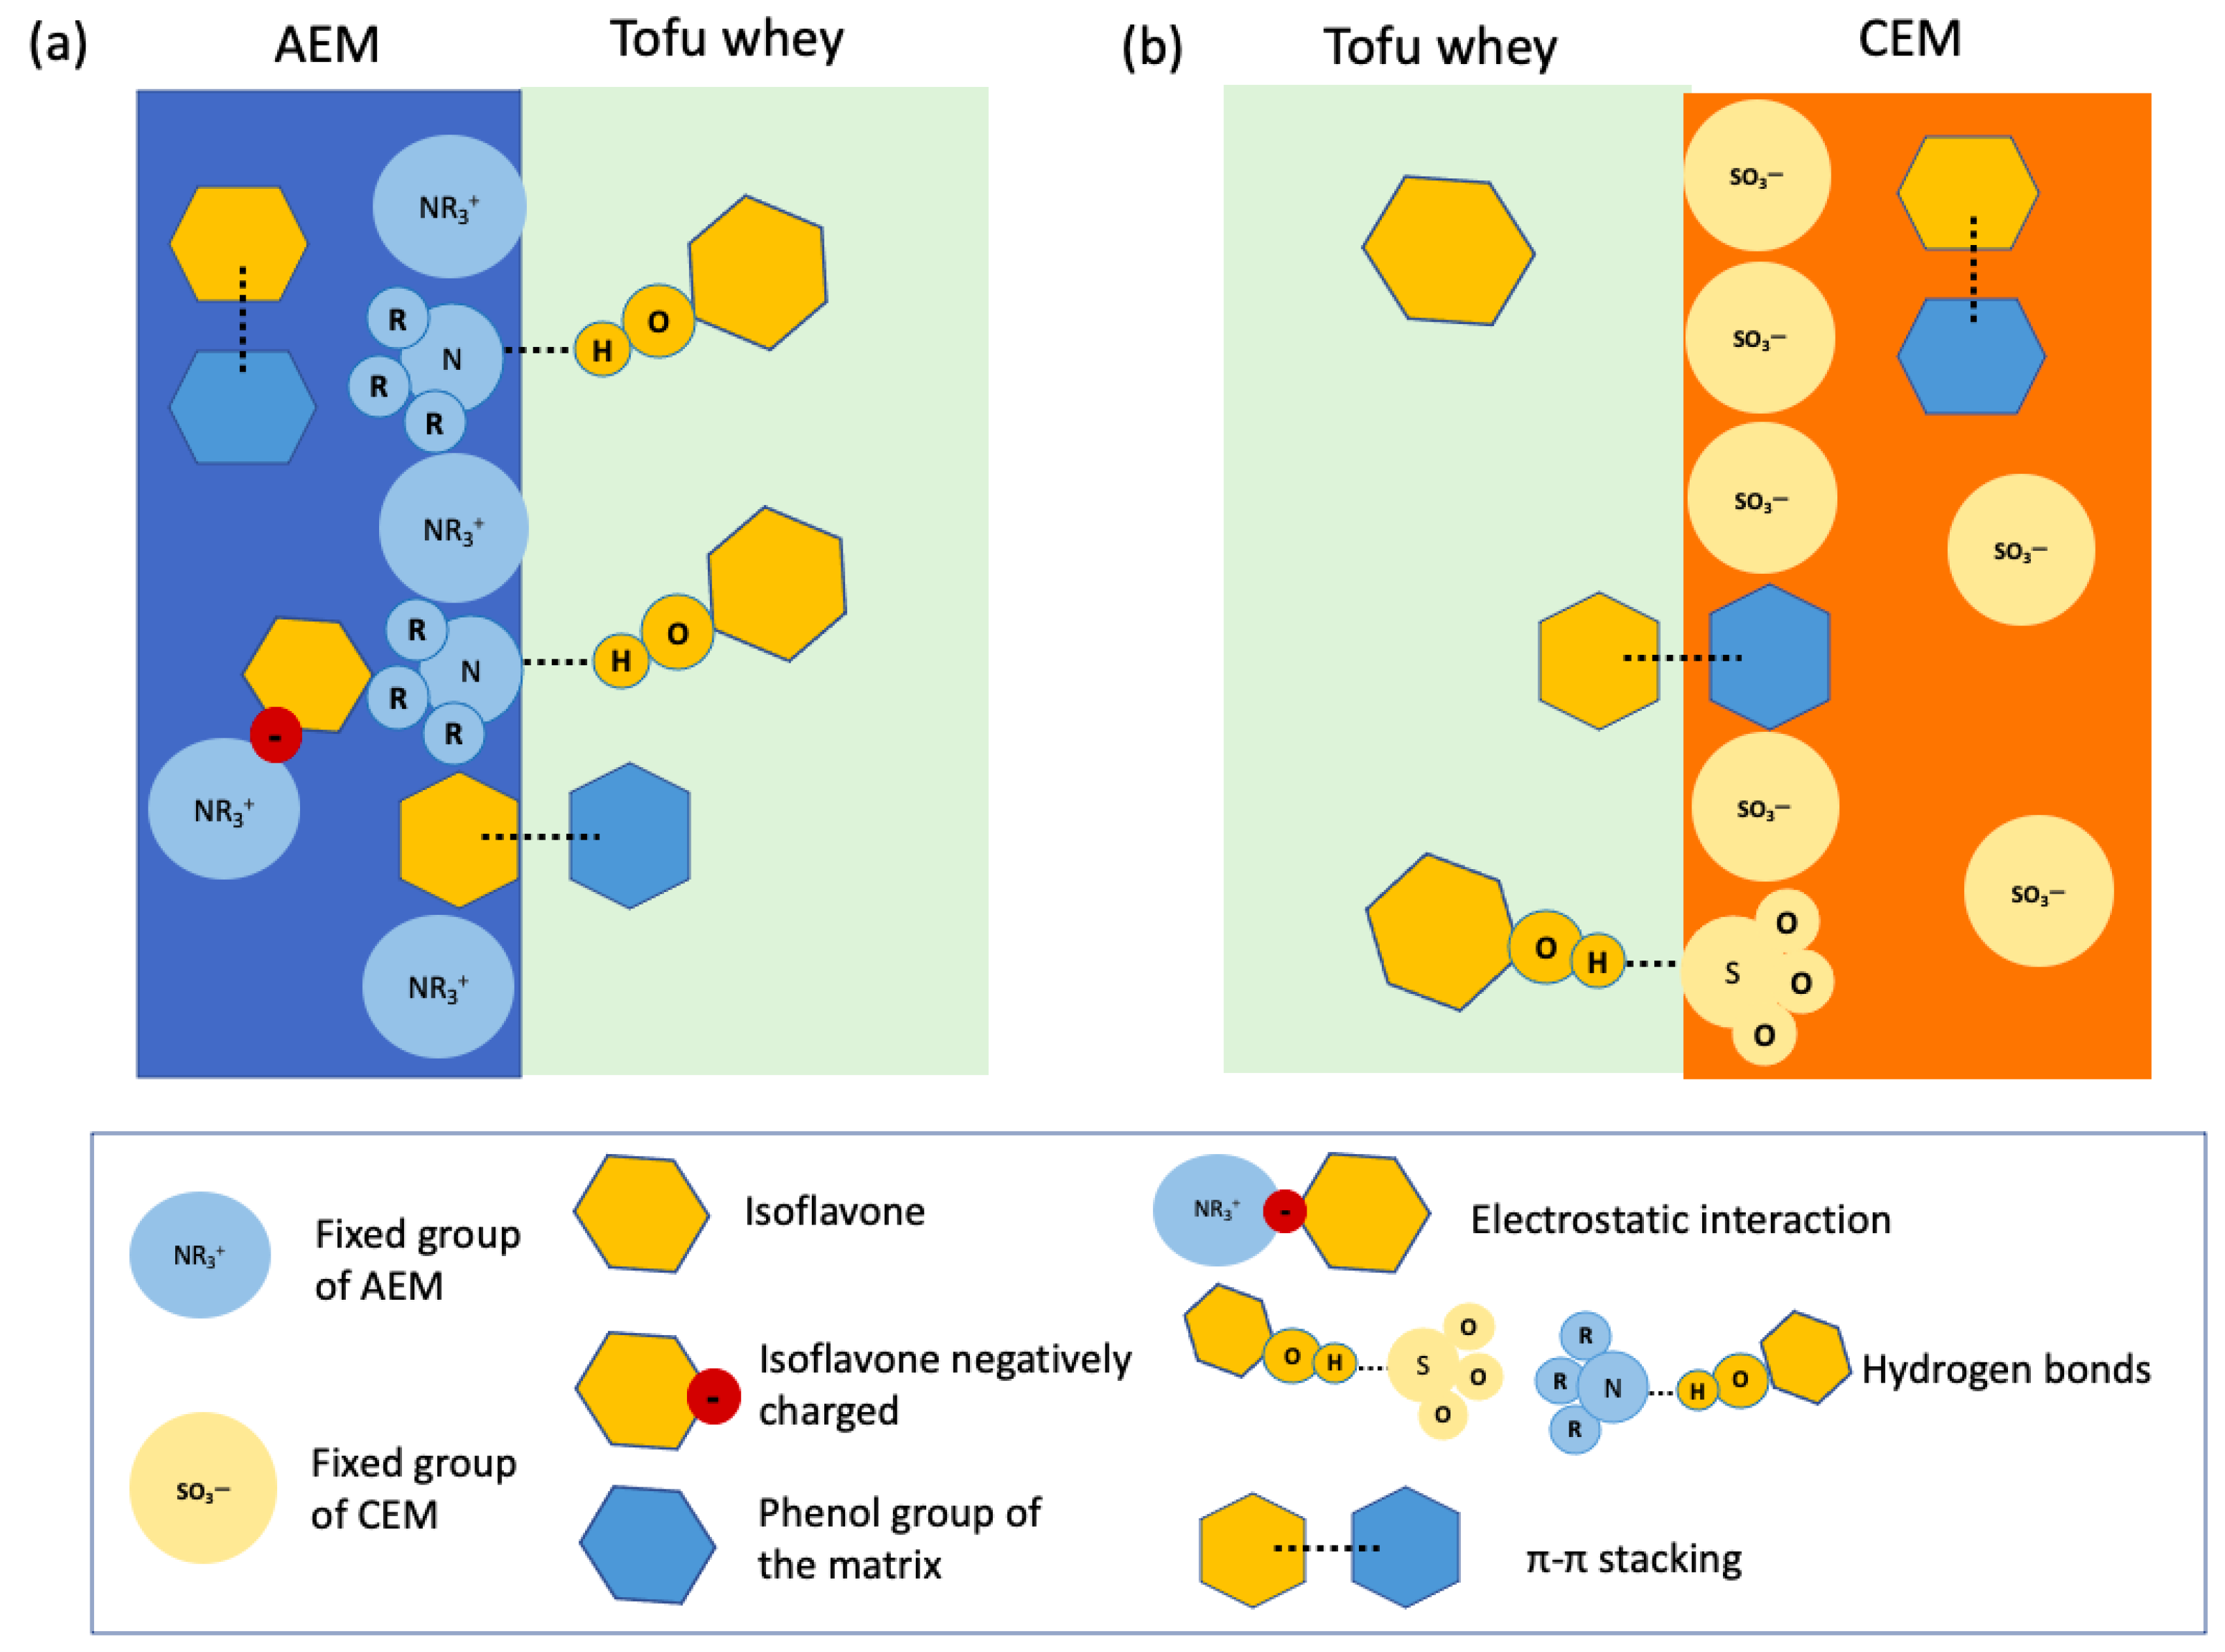
4.2. Fouling
5. Conclusions
Author Contributions
Funding
Institutional Review Board Statement
Data Availability Statement
Acknowledgments
Conflicts of Interest
References
- Yu, S.S.; Ahn, H.S.; Park, S.H. Potential application of electrical conductivity measurement for freshness assessment of tofu. Sens. Actuators A Phys. 2023, 352, 114202. [Google Scholar] [CrossRef]
- Bazinet, L.; Ippersiel, D.; Lamarche, F. Recovery of magnesium and protein from soy tofu whey by electrodialytic configurations. J. Chem. Technol. Biotechnol. 1999, 74, 663–668. [Google Scholar] [CrossRef]
- Deschênes-Gagnon, R.; Langevin, M.; Lutin, F.; Bazinet, L. Impact of nanofiltration pre-concentration prior to a combination of electrodialytic processes on the extraction of proteins from tofu whey. Future Foods 2023, 8, 100258. [Google Scholar] [CrossRef]
- Dufton, G.; Mikhaylin, S.; Gaaloul, S.; Bazinet, L. How electrodialysis configuration influences acid whey deacidification and membrane scaling. J. Dairy Sci. 2018, 101, 7833–7850. [Google Scholar] [CrossRef] [PubMed]
- Gazigil, L.; Er, E.; Kestioğlu, O.E.; Yonar, T. Pilot-Scale Test Results of Electrodialysis Bipolar Membrane for Reverse-Osmosis Concentrate Recovery. Membranes 2022, 12, 83. [Google Scholar] [CrossRef] [PubMed]
- Spettmann, D.; Eppmann, S.; Flemming, H.-C.; Wingender, J. Simultaneous visualisation of biofouling, organic and inorganic particle fouling on separation membranes. Water Sci. Technol. 2007, 55, 207–210. [Google Scholar] [CrossRef] [PubMed]
- Sadr, S.M.K.; Saroj, D.P. 14-Membrane technologies for municipal wastewater treatment. In Advances in Membrane Technologies for Water Treatment; Basile, A., Cassano, A., Rastogi, N.K., Eds.; Woodhead Publishing: Oxford, UK, 2015; pp. 443–463. [Google Scholar] [CrossRef]
- Pal, P. (Ed.) Chapter 1—Introduction to membrane materials, processes, and modules. In Membrane-Based Technologies for Environmental Pollution Control; Butterworth-Heinemann: Oxford, UK, 2020; pp. 3–69. [Google Scholar] [CrossRef]
- Guo, H.; Kim, Y. Membrane Scaling in Electrodialysis Fed with High-Strength Wastewater. Environ. Eng. Sci. 2021, 38, 832–840. [Google Scholar] [CrossRef]
- Lee, H.-J.; Hong, M.-K.; Han, S.-D.; Cho, S.-H.; Moon, S.-H. Fouling of an anion exchange membrane in the electrodialysis desalination process in the presence of organic foulants. Desalination 2009, 238, 60–69. [Google Scholar] [CrossRef]
- Bdiri, M.; Bensghaier, A.; Chaabane, L.; Kozmai, A.; Baklouti, L.; Larchet, C. Preliminary Study on Enzymatic-Based Cleaning of Cation-Exchange Membranes Used in Electrodialysis System in Red Wine Production. Membranes 2019, 9, 114. [Google Scholar] [CrossRef] [PubMed]
- Tsygurina, K.; Pasechnaya, E.; Chuprynina, D.; Melkonyan, K.; Rusinova, T.; Nikonenko, V.; Pismenskaya, N. Electrodialysis Tartrate Stabilization of Wine Materials: Fouling and a New Approach to the Cleaning of Aliphatic Anion-Exchange Membranes. Membranes 2022, 12, 1187. [Google Scholar] [CrossRef]
- Thompson, D.; Tremblay, A. Fouling in steady and unsteady state electrodialysis. Desalination 1983, 47, 181–188. [Google Scholar] [CrossRef][Green Version]
- Bleha, M.; Tishchenko, G.; Šumberová, V.; Kůdela, V. Characteristic of the critical state of membranes in ED-desalination of milk whey. Desalination 1992, 86, 173–186. [Google Scholar] [CrossRef]
- Dammak, L.; Pismenskaya, N. In-Depth on the Fouling and Antifouling of Ion-Exchange Membranes. Membranes 2021, 11, 962. [Google Scholar] [CrossRef]
- Bdiri, M.; Dammak, L.; Larchet, C.; Hellal, F.; Porozhnyy, M.; Nevakshenova, E.; Pismenskaya, N.; Nikonenko, V. Characterization and cleaning of anion-exchange membranes used in electrodialysis of polyphenol-containing food industry solutions; comparison with cation-exchange membranes. Sep. Purif. Technol. 2019, 210, 636–650. [Google Scholar] [CrossRef]
- Bdiri, M.; Perreault, V.; Mikhaylin, S.; Larchet, C.; Hellal, F.; Bazinet, L.; Dammak, L. Identification of phenolic compounds and their fouling mechanisms in ion-exchange membranes used at an industrial scale for wine tartaric stabilization by electrodialysis. Sep. Purif. Technol. 2020, 233, 115995. [Google Scholar] [CrossRef]
- Mikhaylin, S.; Sion, A.-V. Improvement of a sustainable hybrid technology for caseins isoelectric precipitation (electrodialysis with bipolar membrane/ultrafiltration) by mitigation of scaling on cation-exchange membrane. Innov. Food Sci. Emerg. Technol. 2016, 33, 571–579. [Google Scholar] [CrossRef]
- Ge, S.; Zhang, Z.; Yan, H.; Irfan, M.; Xu, Y.; Li, W.; Wang, H.; Wang, Y. Electrodialytic Desalination of Tobacco Sheet Extract: Membrane Fouling Mechanism and Mitigation Strategies. Membranes 2020, 10, 245. [Google Scholar] [CrossRef]
- Pismenskaya, N.; Rybalkina, O.; Solonchenko, K.; Pasechnaya, E.; Sarapulova, V.; Wang, Y.; Jiang, C.; Xu, T.; Nikonenko, V. How Chemical Nature of Fixed Groups of Anion-Exchange Membranes Affects the Performance of Electrodialysis of Phosphate-Containing Solutions? Polymers 2023, 15, 2288. [Google Scholar] [CrossRef] [PubMed]
- Sarapulova, V.; Shkorkina, I.; Mareev, S.; Pismenskaya, N.; Kononenko, N.; Larchet, C.; Dammak, L.; Nikonenko, V. Transport Characteristics of Fujifilm Ion-Exchange Membranes as Compared to Homogeneous Membranes AMX and CMX and to Heterogeneous Membranes MK-40 and MA-41. Membranes 2019, 9, 84. [Google Scholar] [CrossRef]
- Ozkul, S.; van Daal, J.J.; Kuipers, N.J.; Bisselink, R.J.; Bruning, H.; Dykstra, J.E.; Rijnaarts, H.H. Transport mechanisms in electrodialysis: The effect on selective ion transport in multi-ionic solutions. J. Membr. Sci. 2023, 665, 121114. [Google Scholar] [CrossRef]
- Perreault, V.; Sarapulova, V.; Tsygurina, K.; Pismenskaya, N.; Bazinet, L. Understanding of Adsorption and Desorption Mechanisms of Anthocyanins and Proanthocyanidins on Heterogeneous and Homogeneous Cation-Exchange Membranes. Membranes 2021, 11, 136. [Google Scholar] [CrossRef] [PubMed]
- Luo, T.; Roghmans, F.; Wessling, M. Ion mobility and partition determine the counter-ion selectivity of ion exchange membranes. J. Membr. Sci. 2020, 597, 117645. [Google Scholar] [CrossRef]
- Pärnamäe, R.; Mareev, S.; Nikonenko, V.; Melnikov, S.; Sheldeshov, N.; Zabolotskii, V.; Hamelers, H.V.M.; Tedesco, M. Bipolar membranes: A review on principles, latest developments, and applications. J. Membr. Sci. 2021, 617, 118538. [Google Scholar] [CrossRef]
- Casademont, C.; Pourcelly, G.; Bazinet, L. Effect of magnesium/calcium ratios in solutions treated by electrodialysis: Morphological characterization and identification of anion-exchange membrane fouling. J. Colloid Interface Sci. 2008, 322, 215–223. [Google Scholar] [CrossRef]
- Lemay, N.; Mikhaylin, S.; Bazinet, L. Voltage spike and electroconvective vortices generation during electrodialysis under pulsed electric field: Impact on demineralization process efficiency and energy consumption. Innov. Food Sci. Emerg. Technol. 2019, 52, 221–231. [Google Scholar] [CrossRef]
- Lteif, R.; Dammak, L.; Larchet, C.; Auclair, B. Conductivitéélectrique membranaire: Étude de l’effet de la concentration, de la nature de l’électrolyte et de la structure membranaire. Eur. Polym. J. 1999, 35, 1187–1195. [Google Scholar] [CrossRef]
- Lebrun, L.; Da Silva, E.; Pourcelly, G.; Métayer, M. Elaboration and characterisation of ion-exchange films used in the fabrication of bipolar membranes. J. Membr. Sci. 2003, 227, 95–111. [Google Scholar] [CrossRef]
- AOAC. Method 945.46: Ash in Milk. In Official Methods of Analysis of AOAC International; AOAC Publications: Gaithersburg, MD, USA, 1995. [Google Scholar]
- Ayala-Bribiesca, E.; Boucher, M.; Bazinet, L. Ultrathin Sicopion Composite Cation-Exchange Membranes: Characteristics and Electrodialytic Performance following a Conditioning Procedure. Int. J. Chem. Eng. 2012, 2012, 1–12. [Google Scholar] [CrossRef]
- Sneddon, J.; Vincent, M.D. ICP-OES and ICP-MS for the Determination of Metals: Application to Oysters. Anal. Lett. 2008, 41, 1291–1303. [Google Scholar] [CrossRef]
- Guo, H.; You, F.; Yu, S.; Li, L.; Zhao, D. Mechanisms of chemical cleaning of ion exchange membranes: A case study of plant-scale electrodialysis for oily wastewater treatment. J. Membr. Sci. 2015, 496, 310–317. [Google Scholar] [CrossRef]
- Ayala-Bribiesca, E.; Pourcelly, G.; Bazinet, L. Nature identification and morphology characterization of cation-exchange membrane fouling during conventional electrodialysis. J. Colloid Interface Sci. 2006, 300, 663–672. [Google Scholar] [CrossRef] [PubMed]
- Zhang, S.; Zheng, Z.-P.; Zeng, M.-M.; He, Z.-Y.; Tao, G.-J.; Qin, F.; Chen, J. A novel isoflavone profiling method based on UPLC-PDA-ESI-MS. Food Chem. 2017, 219, 40–47. [Google Scholar] [CrossRef] [PubMed]
- Kravtsov, V.; Kulikova, I.; Mikhaylin, S.; Bazinet, L. Alkalinization of acid whey by means of electrodialysis with bipolar membranes and analysis of induced membrane fouling. J. Food Eng. 2019, 277, 109891. [Google Scholar] [CrossRef]
- Gence, N.; Ozbay, N. pH dependence of electrokinetic behavior of dolomite and magnesite in aqueous electrolyte solutions. Appl. Surf. Sci. 2006, 252, 8057–8061. [Google Scholar] [CrossRef]
- Mikhaylin, S.; Nikonenko, V.; Pourcelly, G.; Bazinet, L. Hybrid bipolar membrane electrodialysis/ultrafiltration technology assisted by a pulsed electric field for casein production. Green Chem. 2016, 18, 307–314. [Google Scholar] [CrossRef]
- Speight, J. Lange’s Handbook of Chemistry; McGraw-Hill Education: New York, NY, USA, 2005. [Google Scholar]
- Chua, J.-Y.; Liu, S.-Q. Soy whey: More than just wastewater from tofu and soy protein isolate industry. Trends Food Sci. Technol. 2019, 91, 24–32. [Google Scholar] [CrossRef]
- Costello, A.J.; Glonek, T.; Myers, T.C. 31P Nuclear magnetic resonance pH titrations of myo-inositol hexaphosphate. Carbohydr. Res. 1976, 46, 159–171. [Google Scholar] [CrossRef] [PubMed]
- Cheryan, M.; Rackis, J.J. Phytic acid interactions in food systems. C R C Crit. Rev. Food Sci. Nutr. 1980, 13, 297–335. [Google Scholar] [CrossRef] [PubMed]
- Nassar, M.; Nassar, R.; Maki, H.; Al-Yagoob, A.; Hachim, M.; Senok, A.; Williams, D.; Hiraishi, N. Phytic Acid: Properties and Potential Applications in Dentistry. Front. Mater. 2021, 8, 638909. [Google Scholar] [CrossRef]
- Veerman, J.; Vermaas, D.A. 4—Reverse electrodialysis: Fundamentals. In Sustainable Energy from Salinity Gradients; Cipollina, A., Micale, G., Eds.; Woodhead Publishing: Cambridge, UK, 2016; pp. 77–133. [Google Scholar] [CrossRef]
- Pismenskaya, N.; Bdiri, M.; Sarapulova, V.; Kozmai, A.; Fouilloux, J.; Baklouti, L.; Larchet, C.; Renard, E.; Dammak, L. A Review on Ion-Exchange Membranes Fouling during Electrodialysis Process in Food Industry, Part 2: Influence on Transport Properties and Electrochemical Characteristics, Cleaning and Its Consequences. Membranes 2021, 11, 811. [Google Scholar] [CrossRef]
- Marie, E.; Torbjörn, W. 4—Surface Analytical Techniques Applied to Cleaning Processes. In Handbook for Cleaning/Decontamination of Surfaces; Johansson, I., Somasundaran, P., Eds.; Elsevier Science B.V.: Amsterdam, The Netherland, 2007; pp. 747–789. [Google Scholar] [CrossRef]
- Firdaous, L.; Malériat, J.; Schlumpf, J.; Quéméneur, F. Transfer of Monovalent and Divalent Cations in Salt Solutions by Electrodialysis. Sep. Sci. Technol. 2007, 42, 931–948. [Google Scholar] [CrossRef]
- Dufton, G.; Mikhaylin, S.; Gaaloul, S.; Bazinet, L. Positive Impact of Pulsed Electric Field on Lactic Acid Removal, Demineralization and Membrane Scaling during Acid Whey Electrodialysis. Int. J. Mol. Sci. 2019, 20, 797. [Google Scholar] [CrossRef]
- Pasechnaya, E.; Tsygurina, K.; Ponomar, M.; Chuprynina, D.; Nikonenko, V.; Pismenskaya, N. Comparison of the Electrodialysis Performance in Tartrate Stabilization of a Red Wine Using Aliphatic and Aromatic Commercial and Modified Ion-Exchange Membranes. Membranes 2023, 13, 84. [Google Scholar] [CrossRef]
- Nandiyanto, A.B.D.; Oktiani, R.; Ragadhita, R. How to Read and Interpret FTIR Spectroscope of Organic Material. Indones. J. Sci. Technol. 2019, 4, 97–118. [Google Scholar] [CrossRef]
- Garcia-Vasquez, W.; Dammak, L.; Larchet, C.; Nikonenko, V.; Pismenskaya, N.; Grande, D. Evolution of anion-exchange membrane properties in a full scale electrodialysis stack. J. Membr. Sci. 2013, 446, 255–265. [Google Scholar] [CrossRef]
- Luo, Q.; Zhang, H.; Chen, J.; Qian, P.; Zhai, Y. Modification of Nafion membrane using interfacial polymerization for vanadium redox flow battery applications. J. Membr. Sci. 2008, 311, 98–103. [Google Scholar] [CrossRef]
- Rostagno, M.; Manchón, N.; Guillamón, E.; García-Lafuente, A.; Garicochea, A.; Alfredo, M. Methods and Techniques for the Analysis of Isoflavones in Foods. In Chromatography Types, Techniques and Methods; Nova Science Publishers Inc.: Hauppauge, NY, USA, 2009. [Google Scholar]
- Kim, I.-S. Current Perspectives on the Beneficial Effects of Soybean Isoflavones and Their Metabolites for Humans. Antioxidants 2021, 10, 1064. [Google Scholar] [CrossRef]
- Schalenbach, M.; Keller, L.; Janotta, B.; Bauer, A.; Tempel, H.; Kungl, H.; Bonnet, M.; Eichel, R.-A. The Effect of Ion Exchange Poisoning on the Ion Transport and Conduction in Polymer Electrolyte Membranes (PEMs) for Water Electrolysis. J. Electrochem. Soc. 2022, 169, 094510. [Google Scholar] [CrossRef]
- Bdiri, M.; Dammak, L.; Chaabane, L.; Larchet, C.; Hellal, F.; Nikonenko, V.; Pismenskaya, N. Cleaning of cation-exchange membranes used in electrodialysis for food industry by chemical solutions. Sep. Purif. Technol. 2018, 199, 114–123. [Google Scholar] [CrossRef]
- Sarapulova, V.V.; Klevtsova, A.V.; Pismenskaya, N.D. Electrostatic Interactions of Ion-Exchange Materials with Anthocyanins in the Processes of Their Sorption and Electrodialysis Extraction from Liquid Media. Membr. Membr. Technol. 2020, 2, 272–282. [Google Scholar] [CrossRef]
- Sarapulova, V.; Nevakshenova, E.; Nebavskaya, X.; Kozmai, A.; Aleshkina, D.; Pourcelly, G.; Nikonenko, V.; Pismenskaya, N. Characterization of bulk and surface properties of anion-exchange membranes in initial stages of fouling by red wine. J. Membr. Sci. 2018, 559, 170–182. [Google Scholar] [CrossRef]
- Xu, T. Ion exchange membranes: State of their development and perspective. J. Membr. Sci. 2005, 263, 1–29. [Google Scholar] [CrossRef]
- Nan, G.; Shi, J.; Huang, Y.; Sun, J.; Lv, J.; Yang, G.; Li, Y. Dissociation Constants and Solubilities of Daidzein and Genistein in Different Solvents. J. Chem. Eng. Data 2014, 59, 1304–1311. [Google Scholar] [CrossRef]
- Alongi, K.S.; Shields, G.C. Theoretical calculations of acid dissociation constants: A review article. Annu. Rep. Comput. Chem. 2010, 6, 113–138. [Google Scholar]
- Ghafari, M.; Cui, Y.; Alali, A.; Atkinson, J.D. Phenol adsorption and desorption with physically and chemically tailored porous polymers: Mechanistic variability associated with hyper-cross-linking and amination. J. Hazard. Mater. 2019, 361, 162–168. [Google Scholar] [CrossRef]
- Adandé, S. Séparation des Isoflavones de Soja par Électrodialyse; Sciences des Aliments et Nutrition Université Laval: Ottawa, ON, USA, 2006. [Google Scholar]
- Zhuang, W.-R.; Wang, Y.; Cui, P.-F.; Xing, L.; Lee, J.; Kim, D.; Jiang, H.-L.; Oh, Y.-K. Applications of π-π stacking interactions in the design of drug-delivery systems. J. Control. Release 2019, 294, 311–326. [Google Scholar] [CrossRef] [PubMed]
- Pismenskaya, N.; Sarapulova, V.; Klevtsova, A.; Mikhaylin, S.; Bazinet, L. Adsorption of Anthocyanins by Cation and Anion Exchange Resins with Aromatic and Aliphatic Polymer Matrices. Int. J. Mol. Sci. 2020, 21, 7874. [Google Scholar] [CrossRef]
- Soyata, A.; Hasanah, A.N.; Rusdiana, T. Isoflavones in Soybean as a Daily Nutrient: The Mechanisms of Action and How They Alter the Pharmacokinetics of Drugs. Turk. J. Pharm. Sci. 2021, 18, 799–810. [Google Scholar] [CrossRef] [PubMed]
- Zhao, C.-C.; Lu, J.-K.; Ameer, K. Effects of tofu whey powder on the quality attributes, isoflavones composition and antioxidant activity of wheat flour pan bread. LWT 2021, 143, 111166. [Google Scholar] [CrossRef]
- Zhu, Y.; Wang, Z.; Zhang, L. Optimization of lactic acid fermentation conditions for fermented tofu whey beverage with high-isoflavone aglycones. LWT 2019, 111, 211–217. [Google Scholar] [CrossRef]


| Component | Unit | Initial Tofu Whey | 3× Tofu Whey |
|---|---|---|---|
| Protein | g/100 g liquid basis | 0.42 ± 0.01 a | 1.18 ± 0.01 b |
| Ash | 0.51 ± 0.01 a | 0.81 ± 0.01 c | |
| Ca2+ | 0.02 ± 0.01 a | 0.05 ± 0.01 b | |
| K+ | 0.14 ± 0.01 a | 0.21 ± 0.02 b | |
| Mg2+ | 0.03 ± 0.01 a | 0.08 ± 0.01 b | |
| Na+ | 0.03 ± 0.01 a | 0.04 ± 0.01 a | |
| P | 0.01 ± 0.01 a | 0.02 ± 0.01 b | |
| Stachyose | 0.40 ± 0.01 a | 1.16 ± 0.04 b | |
| Raffinose | 0.13 ± 0.01 a | 0.27 ± 0.08 b | |
| Sucrose | 0.28 ± 0.01 a | 0.69 ± 0.03 b | |
| Lipid | 0.10 ± 0.01 | ||
| Dry matter | 2.79 | 7.03 | |
| pH | 6.1 ± 0.1 a | 6.1 ± 0.1 a | |
| Conductivity | mS/cm | 5.9 ± 0.4 a | 7.0 ± 0.2 b |
| Fixed Groups | Matrix | Type | Ion Exchange Capacity (mmol/g) | Thickness (mm) | ||
|---|---|---|---|---|---|---|
| AMX-Fg [20,21,22] | NR3+ | Polystyrene and Divinylbenzene (PS + DVB) | Homogeneous | 1.5–1.8 | 120–180 | |
| CMX-Fg [21,22,23,24] | SO3− | Polystyrene and Divinylbenzene (PS + DVB) | Homogeneous | 1.4–1.7 | 140–200 | |
| BP-1E [25] | Anion-exchange layer | NR3+ | Polysulfone | Homogeneous | - | 0.22 |
| Cation-exchange layer | SO3− | Reinforced Neosepta CM-1 | ||||
| mg/g of Membrane | Na | K | P | Ca | Mg | ||
|---|---|---|---|---|---|---|---|
| ED | CEM | Pristine | 24.2 ± 1.3 a | 1.9 ± 0.7 a | 0.03 ± 0.03 a | 0.7 ± 0.2 a | 0.0 ± 0.0 a |
| CEM 3 | 22.5 ± 1.2 a | 1.9 ± 2.1 a | 0.06 ± 0.03 a | 1.9 ± 0.2 b | 0.6 ± 0.6 b | ||
| CEM 4 | 25.2 ± 1.3 a | 0.9 ± 0.3 a | 0.07 ± 0.09 a | 1.7 ± 0.1 b | 0.7 ± 0.6 b | ||
| AEM | Pristine | 0.4 ± 0.1 a | 0.2 ± 0.2 a | 0.01± 0.00 a | 0.1 ± 0.1 a | 0.0 ± 0.0 a | |
| AEM 2 | 0.7 ± 0.2 a | 0.1 ± 0.1 a | 0.08 ± 0.02 b | 0.1 ± 0.1 a | 0.0 ± 0.0 a | ||
| AEM 3 | 0.4 ± 0.4 a | 0.1 ± 0.1 a | 0.09 ± 0.04 b | 0.1 ± 0.1 a | 0.0 ± 0.0 a | ||
| EDBM | CEM | CEM 2 | 19.8 ± 2.4 a | 1.5 ± 0.6 a | 0.02 ± 0.01 a | 1.4 ± 0.1 c | 1.9 ± 0.3 b |
| CEM 3 | 14.4 ± 3.5 a | 1.4 ± 0.7 a | 0.03 ± 0.03 a | 1.2 ± 0.2 b | 1.8 ± 0.1 b | ||
| BPM | Pristine | 18.8 ± 0.7 b | 2.6 ± 1.2 a | 0.02 ± 0.02 a | 0.2 ± 0.0 a | 0.0 ± 0.0 a | |
| BPM 1 | 10.7 ± 2.5 a | 1.8 ± 0.2 a | 0.13 ± 0.18 a | 1.0 ± 0.1 b | 1.2 ± 0.2 b | ||
| BPM 2 | 12.8 ± 2.0 a | 2.4 ± 0.8 a | 0.16 ± 0.24 a | 1.4 ± 0.1 c | 1.8 ± 0.2 c | ||
| (meq/g) | Pristine | Used | |
|---|---|---|---|
| ED | CEM | 2.6 ± 0.6 a | 2.0 ± 0.7 a |
| AEM | 1.9 ± 0.1 a | 1.6 ± 0.2 a | |
| EDBM | CEM | 2.6 ± 0.6 a | 2.5 ± 0.7 a |
Disclaimer/Publisher’s Note: The statements, opinions and data contained in all publications are solely those of the individual author(s) and contributor(s) and not of MDPI and/or the editor(s). MDPI and/or the editor(s) disclaim responsibility for any injury to people or property resulting from any ideas, methods, instructions or products referred to in the content. |
© 2024 by the authors. Licensee MDPI, Basel, Switzerland. This article is an open access article distributed under the terms and conditions of the Creative Commons Attribution (CC BY) license (https://creativecommons.org/licenses/by/4.0/).
Share and Cite
Deschênes Gagnon, R.; Langevin, M.-È.; Lutin, F.; Bazinet, L. Identification of Fouling Occurring during Coupled Electrodialysis and Bipolar Membrane Electrodialysis Treatment for Tofu Whey Protein Recovery. Membranes 2024, 14, 88. https://doi.org/10.3390/membranes14040088
Deschênes Gagnon R, Langevin M-È, Lutin F, Bazinet L. Identification of Fouling Occurring during Coupled Electrodialysis and Bipolar Membrane Electrodialysis Treatment for Tofu Whey Protein Recovery. Membranes. 2024; 14(4):88. https://doi.org/10.3390/membranes14040088
Chicago/Turabian StyleDeschênes Gagnon, Rosie, Marie-Ève Langevin, Florence Lutin, and Laurent Bazinet. 2024. "Identification of Fouling Occurring during Coupled Electrodialysis and Bipolar Membrane Electrodialysis Treatment for Tofu Whey Protein Recovery" Membranes 14, no. 4: 88. https://doi.org/10.3390/membranes14040088
APA StyleDeschênes Gagnon, R., Langevin, M.-È., Lutin, F., & Bazinet, L. (2024). Identification of Fouling Occurring during Coupled Electrodialysis and Bipolar Membrane Electrodialysis Treatment for Tofu Whey Protein Recovery. Membranes, 14(4), 88. https://doi.org/10.3390/membranes14040088