Article

Removal of Microplastics in a Hybrid Treatment Process of Ceramic Microfiltration and Photocatalyst-Mounted PES Spheres with Air Backwashing

Department of Environmental Sciences & Biotechnology, Hallym University, Chuncheon 24252, Republic of Korea
*
Author to whom correspondence should be addressed.
Membranes 2024, 14(8), 169; https://doi.org/10.3390/membranes14080169
Submission received: 16 July 2024 / Revised: 26 July 2024 / Accepted: 29 July 2024 / Published: 31 July 2024
(This article belongs to the Section Membrane Applications for Water Treatment)

Abstract

:
Microplastics (MPs), which are defined as plastics with a size of less than 5 mm, cannot be treated completely in wastewater treatment plants (WWTPs) and discharged to a water body because they are too small in size. It has been reported that MPs can have adverse effects on human beings and water ecosystems. There is a need to combine existing drinking water treatment plants (DWTPs) and WWTPs with the traditional treatment process and technology with high removal efficiency of MPs or to develop a new technology to separate MPs from water and wastewater. In this study, the effects of MPs (polyethylene (PE), 125 μm) and organic matter (humic acid) were researched in a hybrid treatment process of ceramic microfiltration (MF) and photocatalyst (TiO2)-mounted polyether sulfone (PES) spheres with air backwashing. The roles of the MF, photooxidation, and adsorption of PES spheres were confirmed in a single MF process (MF), an MF process with UV irradiation (MF+UV), MF and PES sphere adsorption without UV irradiation (MF+PES), and a hybrid process incorporating MF and PES spheres with UV irradiation (MF+PES+UV). The impact of the air backwashing cycle (filtration time, FT) on filtration characteristics and treatment efficiencies in the hybrid process was studied. In the MF process, membrane fouling increased with increasing organic matter (HA, humic acid). The treatment efficiency of MPs increased; however, that of dissolved organic matter (DOM) decreased with increasing HA. As MPs increased, the membrane fouling decreased; however, total filtration volume (VT) remained almost constant. The treatment efficiency of MPs increased a little, and that of DOM showed a dropping trend. In the hybrid process, the membrane fouling was controlled via the adsorption and UV photooxidation of the PES spheres, and the DOM treatment efficiency increased by combining processes from MF to MF+PES+UV. The optimal FT was 10 min at BT 10 s in this hybrid process. The results could be applied to separate MPs effectively in DWTPs/WWTPs.

1. Introduction

Since the invention of plastics, the amount of plastic used by humans has increased every year and the number of MPs generated has increased rapidly. MPs are new pollutants caused by the decomposition of various types of plastics during the use and disposal of plastics [1]. MPs are small plastics with a size of less than 5 mm and can be divided into primary and secondary plastics according to the cause of their occurrence. Primary plastics are intentionally manufactured for specific applications, such as toothpaste, spheres used in face washes and cosmetics, and industrial abrasives. Secondary plastics are produced via the decomposition of large plastics due to environmental factors such as ultraviolet radiation, physical wear, and oxidation [2]. MPs found in river water have been observed in various shapes such as pellets, fibers, and debris [3]. Today, MPs are found in water systems around the world, including marine and freshwater environments, which are sources of drinking water for human consumption [4]. Looking at the current status of MPs found in Korean freshwater, the MP concentration of the surface water of the Han River was 20~180 particles/m2, and that of its tributaries was 1.2~234.5 particles/m2 [5]. The mean (±standard deviation) MP content of Nakdong River was 293 ± 83 (upstream, February 2017)~4760 ± 5242 (downstream, August 2017) particles/m3 in water and 1970 ± 62 particles/kg in sediment. Polyethylene (PE), Polypropylene (PP), and Polystyrene (PS) were the most common MPs identified. MPs smaller than 300 μm in size accounted for 74% of the MPs in water and 81% in sediment, with the largest distribution ranging in size from 50 to 150 μm [6]. The dangers of MPs to the human body have not yet been clearly understood, but in the last 5 years, studies have been published one after another on the possibility of adverse effects on the human body if MPs enter the body, and MPs are one of the most actively researched topics. A survey that shows the number of published research papers on MP pollution in each water system shows that research on MP pollution in water systems has continued to increase over the past decade [7]. MPs with a size of 100 nm or less can reach almost all organs after entering the human body, so there is concern about the adverse effects of MPs continuously accumulating in the human body [8]. A report published by UNEP in 2021 suggested the impact of microplastics on human health by body part [9]. According to that report, MPs cause various cardiovascular, respiratory, and thyroid diseases and various problems in pregnant women and fetuses. In addition, if MPs accumulate in the body of marine organisms, it can cause malnutrition, internal organ damage, inflammation, decreased fertility, and death, and ecotoxicity can be caused by the plastic itself, reaction by-products, and additives [10].
Most MPs can be removed through conventional DWTPs and WWTPs, but some are still untreated and discharged back into the water system. Looking at the incoming route of MPs and the steps of water treatment in WWTPs, there is no distinct process for MP removal in WWTPs yet. Therefore, there is a need to combine the existing DWTPs and WWTPs with the traditional treatment process and technology, with a high removal efficiency of MPs, or to develop a new technology to separate MPs from water and wastewater. According to a literature analysis, the membrane process, which is one of the most advanced treatment technologies, may be the most effective and promising tool for removing MPs [11]. Among the membranes, ceramic membranes have the advantages of being chemically and physically strong and having a long lifetime, a higher resistance to backwashing pressure and cleaning agents than polymer membranes, and a small fouling rate. In addition, the membrane process is more efficient than other advanced processing techniques because of a smaller pore size than MPs [12].
In a domestic and international study that attempted to remove MPs using membranes, H. Takeuchi et al. [13] combined activated sludge and ceramic membrane processes on a laboratory scale and removed more than 96% of the MPs. B. Ma et al. [14] analyzed the removal behavior of PE in flocculation and ultrafiltration (UF) processes. J. Yang et al. [15] determined the MP removal efficiency by analyzing water samples from WWTPs, DWTPs, and seawater treatment plants (SWTPs) and removed about 92% of the MPs using UF membranes. A. Mohana et al. [16] effectively removed nanoparticles (NPs) and MPs using metal–organic framework (MOF)-based UF membranes. L. Li et al. [17] confirmed the performance of removing low-density micro-particulates such as MPs through the formation of a dynamic membrane on the surface of the support membrane. S. Ziajahromi et al. [18] characterized and quantified MPs in WWTP effluent using the reverse osmosis (RO) process. J. Talvitie et al. [19] removed about 99% of MPs in the wastewater treatment process using a membrane bioreactor (MBR).
A lot of research has been conducted to develop TiO2 photocatalysts capable of degrading MPs. N-doped TiO2 powder showed a 6.4% treatment rate of HDPE [20]. Mesoporous N-TiO2 prepared via evaporation-induced self-assembly showed a 56% mass loss [21]. TiO2 nanoparticle film achieved PS and PE degradation, and the weight loss was over 98% [22]. C,N-doped TiO2 powder showed remarkable performance for HDPE, and the weight loss was 71.77% [23]. Degussa P25 (TiO2) was employed for the photocatalytic degradation of polyamide 66 (mass loss of 97%) in wastewater treatment plants [24]. TiO2 prepared via the electrochemical anodization technique for Ti foils displayed a 23.50% elimination of PS [25]. Ag/TiO2/RGO prepared via photoassisted deposition and ultrasonic radiation showed a 76% degradation of PE [26]. Nano-Composite Ag/TiO2 synthesized via photoassisted deposition offered a 100% PE degradation [27]. TiO2 in amylose, polyiodide, and hydroxyethyl cellulose achieved a weight loss of over 15% for LDPE [28]. C,N-TiO2/SiO2 semiconductors achieved the degradation of the PET MPs (mass losses of 9.35 and 16.22%) [29]. With the comprehensive action of the nano-flower-shaped N-doped TiO2 catalyst (Pt@N-TiO2-1.5%) on the relatively low-molecular-weight intermediates, an approximate 29% weight loss was induced on the pretreated PET-FMPs [30]. Self-asymmetric Pac-Man TiO2 degraded up to 28% of PS particles after 70 h of UV light exposure [31]. A hybrid TiO2 synthesized using a waste natural resin as a component without any chemical modification induced the oxidative degradation of LLDPE under indirect daylight [32].
In this study, the impact of organic matter and MP concentrations on membrane contamination was confirmed in the tubular ceramic MP process alone. In addition, in the hybrid water treatment process using tubular ceramic MFs and photocatalyst-mounted PES spheres, the role of adsorption and photooxidation for each process and the membrane filtration characteristics and treatment efficiency according to the air backwashing cycle were identified, and optimal operating conditions were derived.

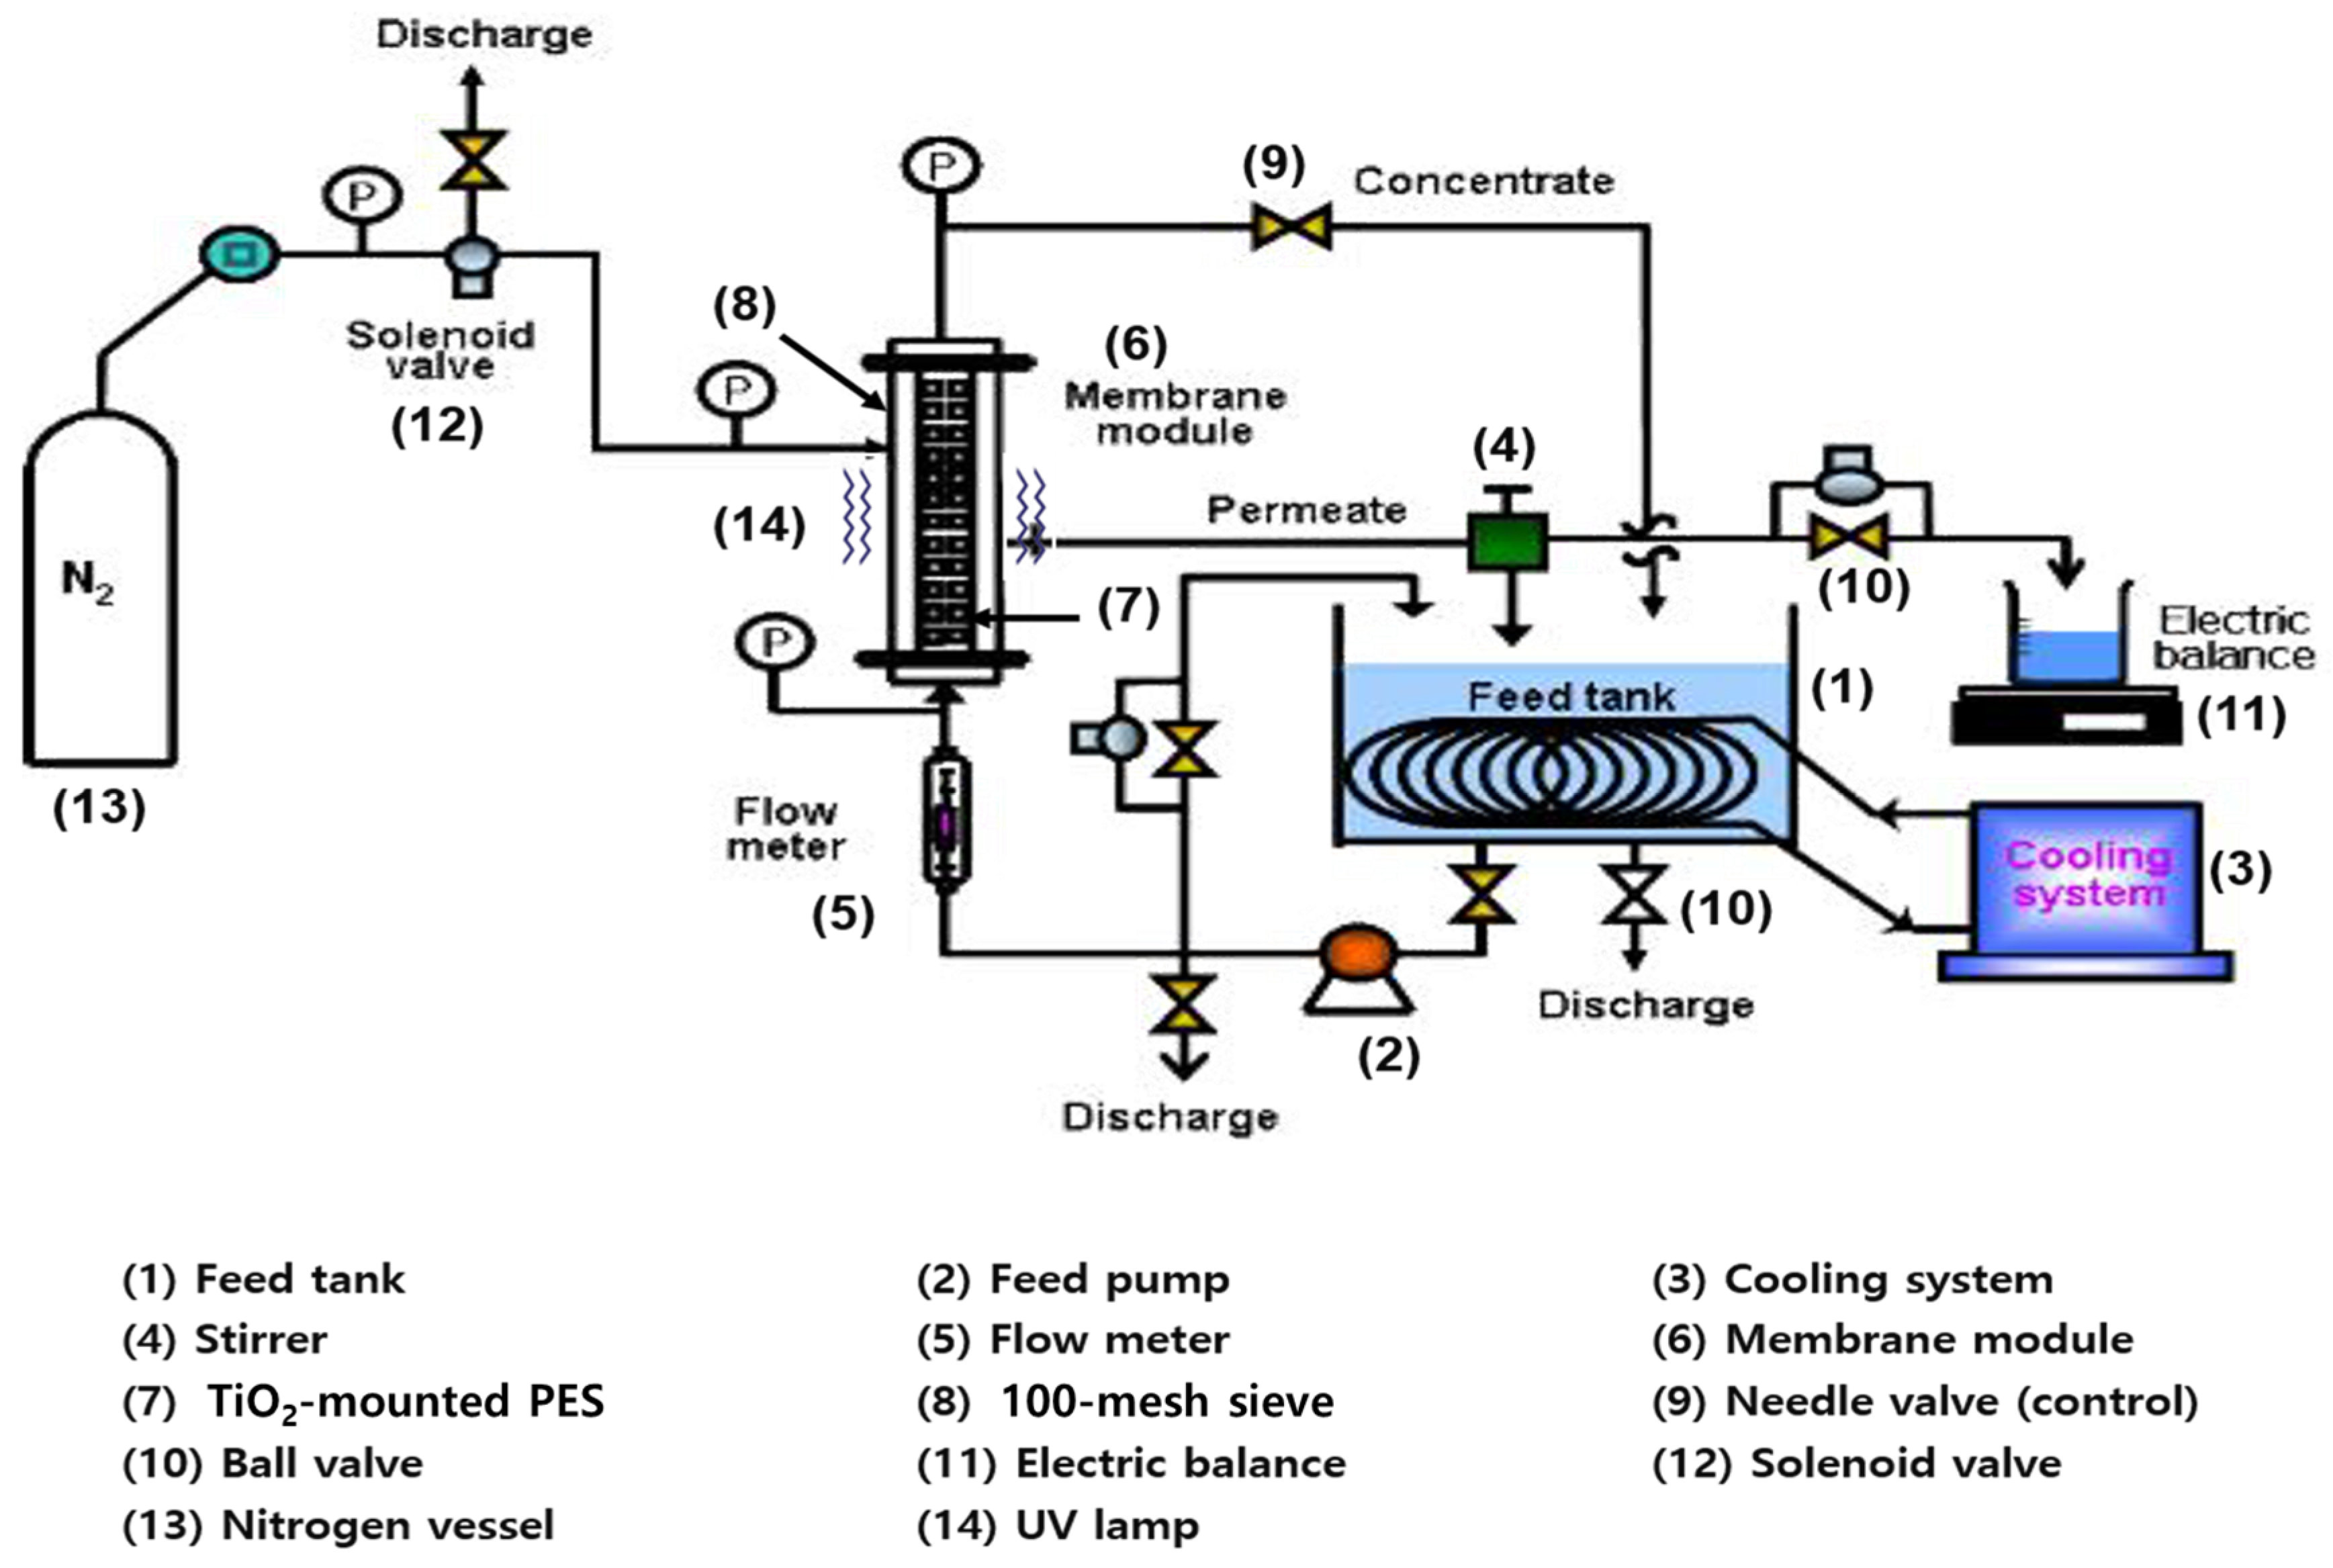
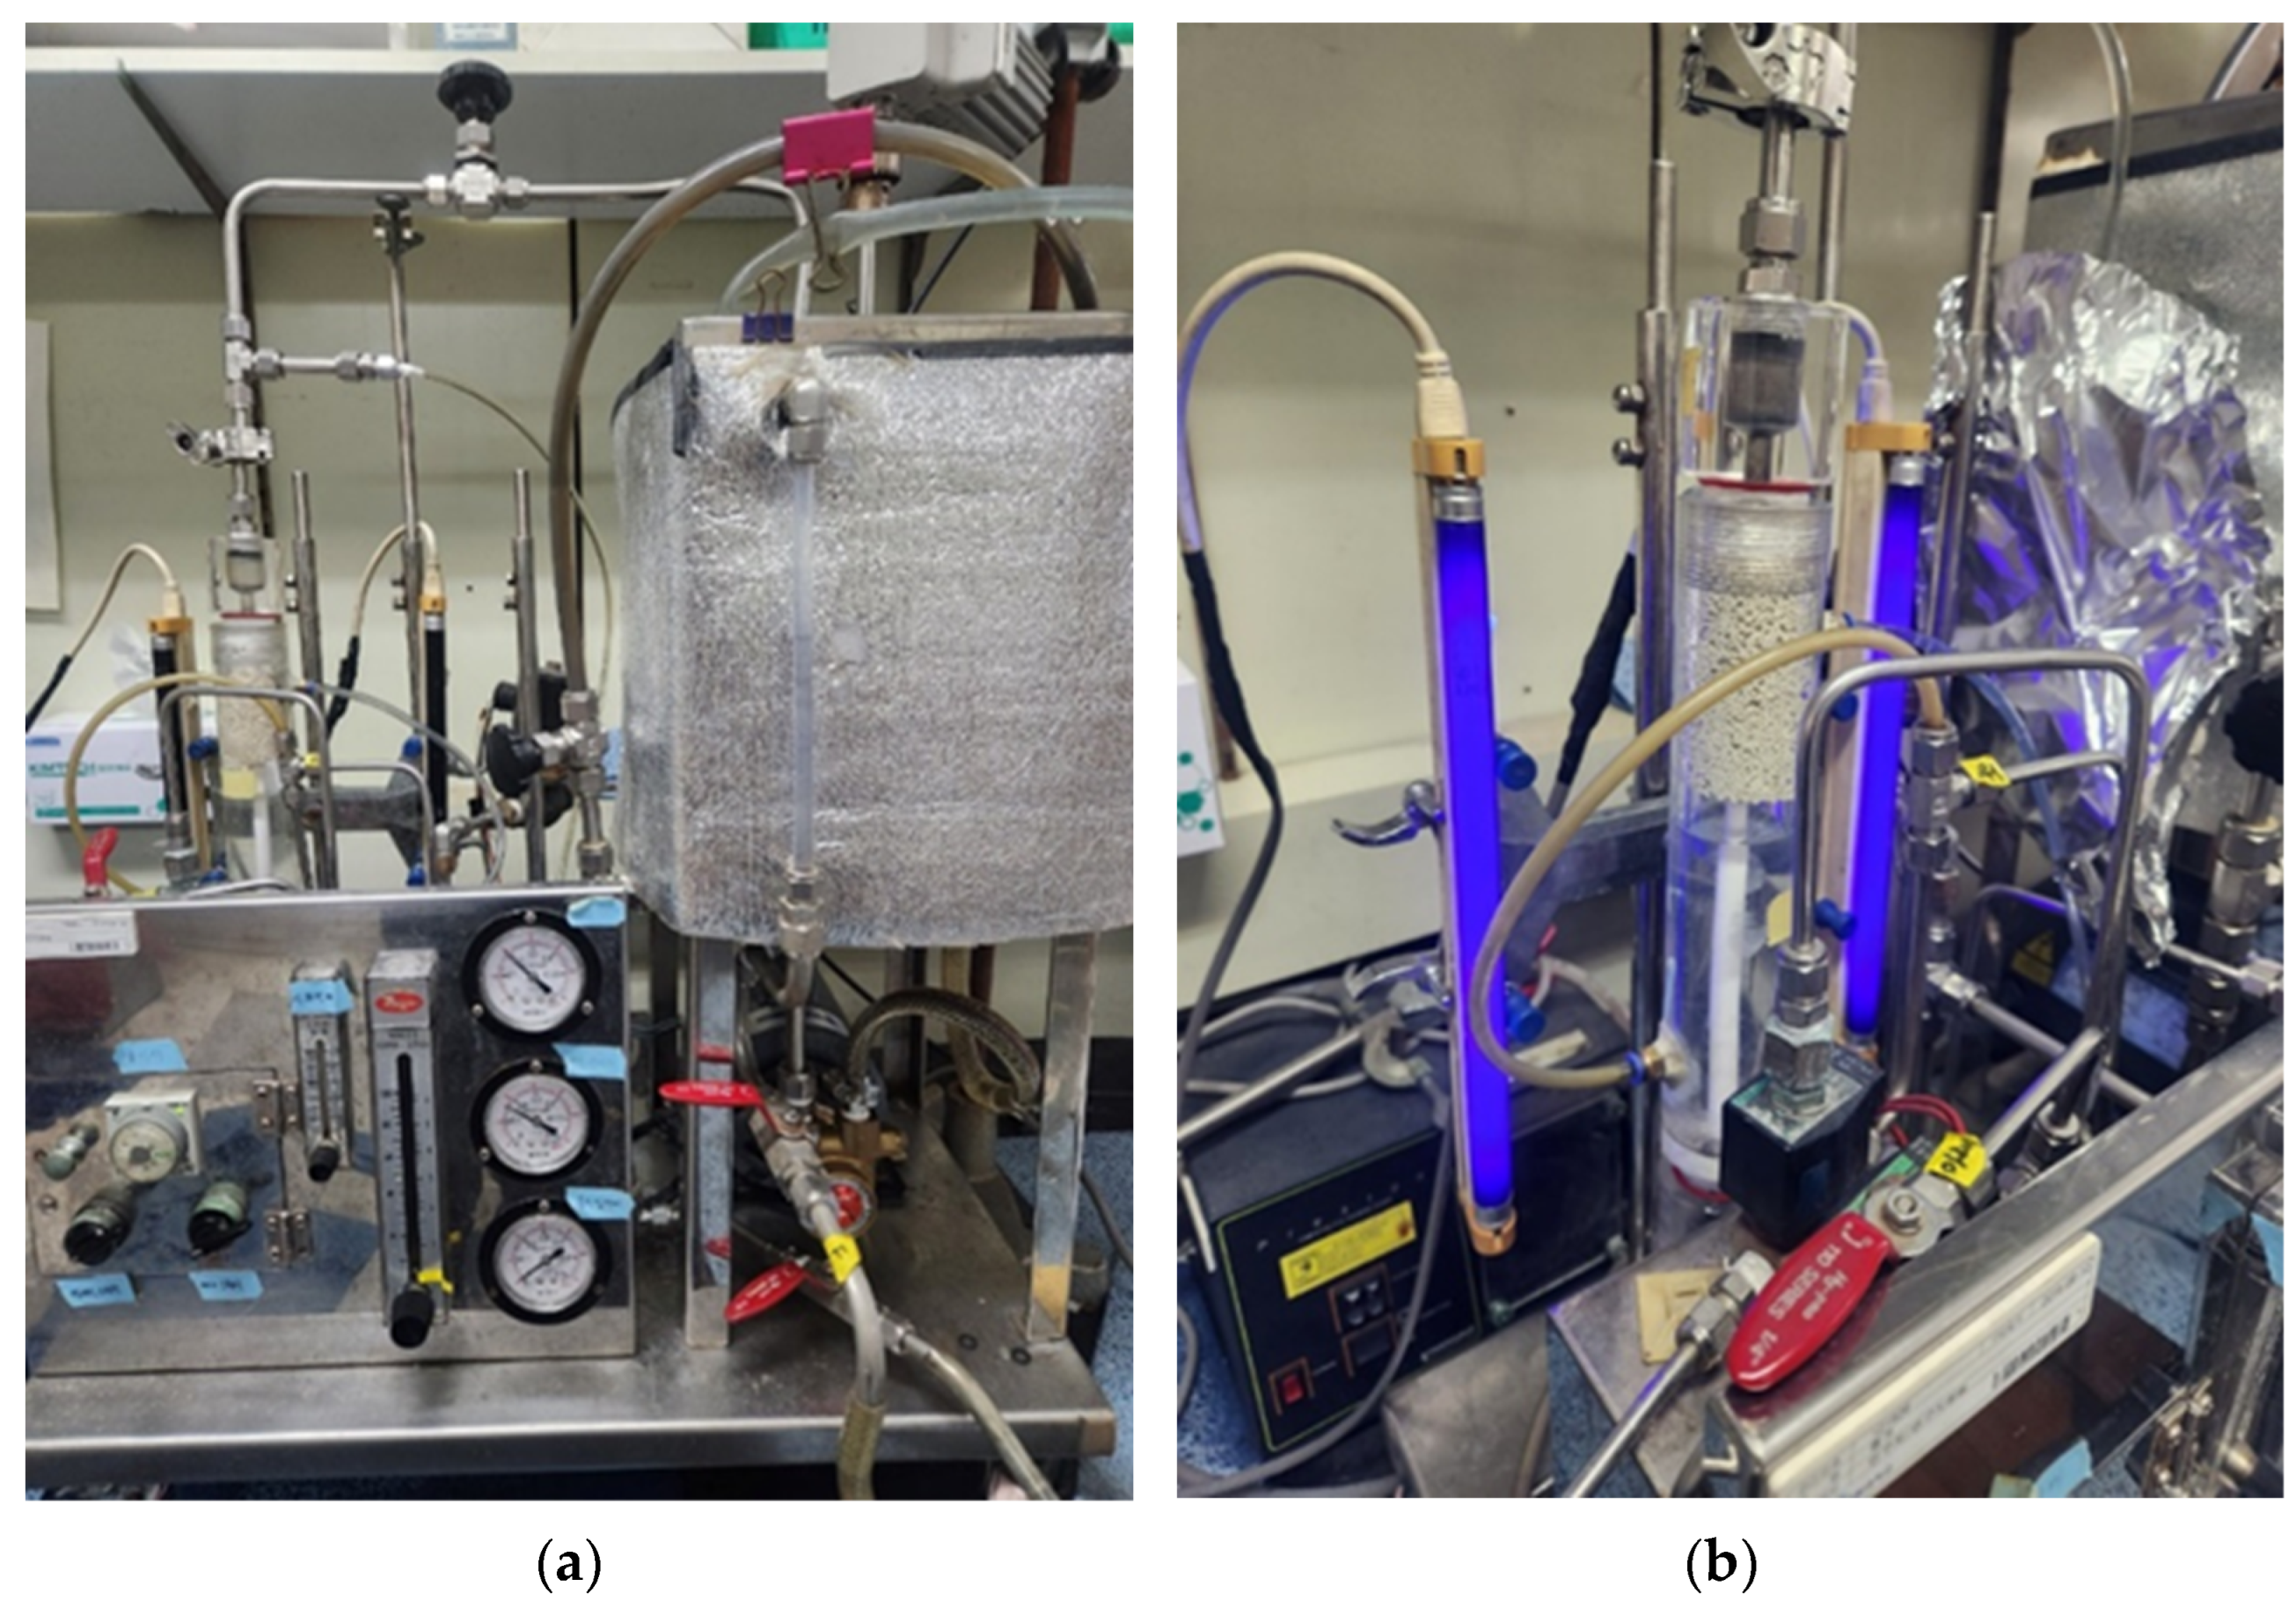
2. Materials and Methods

The ceramic microfiltration membrane used in this study was the tubular MF membrane NCMT-7231 purchased from Nano Pore Materials Co., Ltd. (Seoul, Korea), which is coated with α-alumina material on the same α-alumina support layer. The specifications of the ceramic membrane used in this research are presented in Table 1.
The photocatalysts used in this study were PES microspheres manufactured by E. Drioli [33] via the phase inversion of a mixture of titanium dioxide (TiO2) powder and polyether sulfone (PES), and the diameter of each sphere was 1.2–1.4 mm. The weight percent of TiO2 was 30% in the PES microspheres. Scheme 1 shows the TiO2-mounted PES spheres used in this research.
In order to simulate the humic substances, which account for a considerable amount of the natural organic matter subject to water purification, and MPs, the model solution was prepared using humic acid and polyethylene (PE) powder. The model solution was prepared at a certain concentration by mixing an amount of HA (humic acid sodium salt, Sigma-Aldrich, St. Louis, MO, USA) and PE (Sigma-Aldrich, St. Louis, MO, USA) powder with an average particle size of 125 μm in distilled water. The reason for using the 125 μm sized MPs is that the size of the MPs found in fresh water in Korea is mostly distributed in the 50–150 μm range, and one of the most common MPs found is PE.
Figure 1 is a microfiltration diagram showing the cross-flow filtration method, which can backwash treated water, used in this study. For the removal of MPs and dissolved organic matter (DOM), the PES spheres (7) mounted with TiO2 powder via the phase inversion method were filled between the outside of the membrane and the inside of the module, and it was composed in the form of a single module (6). In addition, the treated water, which passed through the ceramic membrane and the PES sphere mounted with TiO2, flowed through the upper outlet of the installed module with a mesh size of 8 of 100 (0.150 mm), which is much smaller than the PES sphere, to prevent the PES spheres in the membrane module from being washed out along the treated water.
Two UV lamps (14) (F8T5BLB, Sankyo, Kanagawa, Japan) were installed on the outside of the module and irradiated UV of 352 nm, which was the most effective wavelength to decompose DOM, during the experiment. The feed tank (1) was a stainless steel tank with a capacity of 20 L, and it was installed by connecting the copper pipe coil with the cooling water (3) to maintain a constant temperature of the feed model solution. In addition, a stirrer (4) was installed in the center of the upper part of the feed tank to continuously stir the feed solution so that it could be supplied in a homogeneous state. The feed solution was introduced into the membrane module from the feed tank using a pump (2) (Procon, Standex Co., Salem, NH, USA), and the inflow flow rate was measured using a flow meter (5) (NP-127, Tokyo Keiso, Tokyo, Japan). At the inlet and outlet parts of the membrane module, pressure gauges measuring up to 6.8 bar were installed to check the pressure difference in the membrane. The flow rate and pressure of the membrane module were kept constant by operating the valves (9) at the bypass of the pump (2) and the concentrated water lines, and the mass of the permeate water was treated using the ceramic membrane and the PES spheres were measured with an electronic scale (11) (Ohaus, Canton, MA, USA) to obtain the permeate flux. The treated water was circulated to the feed tank (1) to keep a persistent feed concentration during experimentation. In order to control FT and BT, the permeate water outlet, pump bypass pipe, and nitrogen inflow line were equipped with solenoid valves (12) (CKD, Aichi, Japan). All three solenoid valves were connected to a time controller (twin timer: Omron, Japan) so that the valve opened and closed at the same time, and all the water of the module was discharged through the upper and lower parts of the membrane module via the pressure of the nitrogen tank for backwashing. Scheme 2 are actual device photographs of the hybrid water treatment unit, membrane module, and UV lamps used in the experiment.
To determine the correlation between MP concentration and turbidity, distilled water was mixed with 125 μm particle-sized PE powder (MPs), and the turbidity was measured by varying PE concentrations to 0.5, 1, 2, 5, 10, and 15 mg/L. In the tubular ceramic microfiltration (NCMT-7231) process alone, the effect of organic matter on membrane fouling was checked by changing the concentration of humic acid to 10, 15, 20, and 25 mg/L at a constant concentration of 1 mg/L of MPs in the model solution. The pH of the model solution was 6.7~6.8. Using a model solution with an MP concentration of 2 mg/L and HA of 20 mg/L, the roles of the microfiltration, adsorption, and photooxidation of the photocatalyst-mounted PES spheres were examined through the ceramic microfiltration process (MF), the MF and the PES sphere process without UV irradiation (MF+PES), the MF and UV irradiation process without a photocatalyst (MF+UV), and the MF and photocatalytic-mounted PES sphere process with UV irradiation (MF+PES+UV). Lastly, in the hybrid water treatment process using ceramic microfiltration and photocatalyst-mounted PES spheres with UV irradiation, the optimal operation conditions for BT at NBF (no backwashing) were 6, 10, 15, 20, and 30 s, and this was examined at a constant 10 min FT with the model solution of the MP concentration of 2 mg/L and an HA concentration of 20 mg/L. In addition, the effect of backwash cycle FT was observed by keeping the BT constant at 10 s and changing the FT to NBF, at 6, 8, 10, 20, and 30 min. In all experiments, the transmembrane pressure (TMP) was maintained at 1.80 bar, the backwash pressure was 2.50 bar, the inlet flow rate was 1.0 L/min, and the feed water temperature was maintained at 20 ± 1.0 °C. The operation was performed for 180 min under each condition, and changes in the resistance of membrane fouling (Rf), permeate flux (J), initial permeate flux (J0), dimensionless permeate flux (J/J0), and total filtration volume (VT) were detected. After finishing each experiment after 180 min, a physical cleaning using a small brush was performed inside the membrane tube. For estimating the resistances of irreversible and reversible membrane fouling (Rif and Rrf), the treated water flux was checked after the physical cleaning.
At the end of the experiment, the model solution used as feed water was drained, and the distilled water was circulated for about 1 h to clean the experimental device and membrane. Then, after separating and collecting the TiO2-mounted PES spheres from the membrane module, the ceramic membrane was removed from the module. The membrane was desorbed and chemically cleaned in 0.25 N aqueous sodium hydroxide solution and 15% aqueous nitrate solution for 1 h and 1 day, respectively. After that, it was heated in a furnace at 550 °C for 1 h, cooled naturally for 24 h, and stored in distilled water. Before starting the experiment under other conditions, the membrane was installed in the module and the permeate flux was measured while operating normally with primary distilled water to check whether the performance of the membrane was restored. If the permeate flux was restored to less than ±5% of the standard one, the experiment was started.
In order to analyze the water quality of the supply water and treated water to check the treatment efficiency of MPs and DOM, samples were collected from the feed tank and the treated water line every 30 min after the start of operation. Turbidity to determine MP concentration was measured directly using a turbidimeter (2100N, Hach, Loveland, CO, USA). UV254 absorbance, an indicator of the DOM-like humic acid, was measured using a UV spectrophotometer (Genesys 10 UV, Thermo, Waltham, MA, USA). A photograph of the inside and outside of the membrane was taken using a Field Emission Scanning Electron Microscope (FE-SEM, JSM-7900F, JEOL, Seoul, Korea) at Kangwon University (Chuncheon, Korea) after operating the microfiltration water treatment processes several times.

3. Results and Discussions

3.1. Removal of Microplastics in Ceramic Microfiltration Water Treatment Process

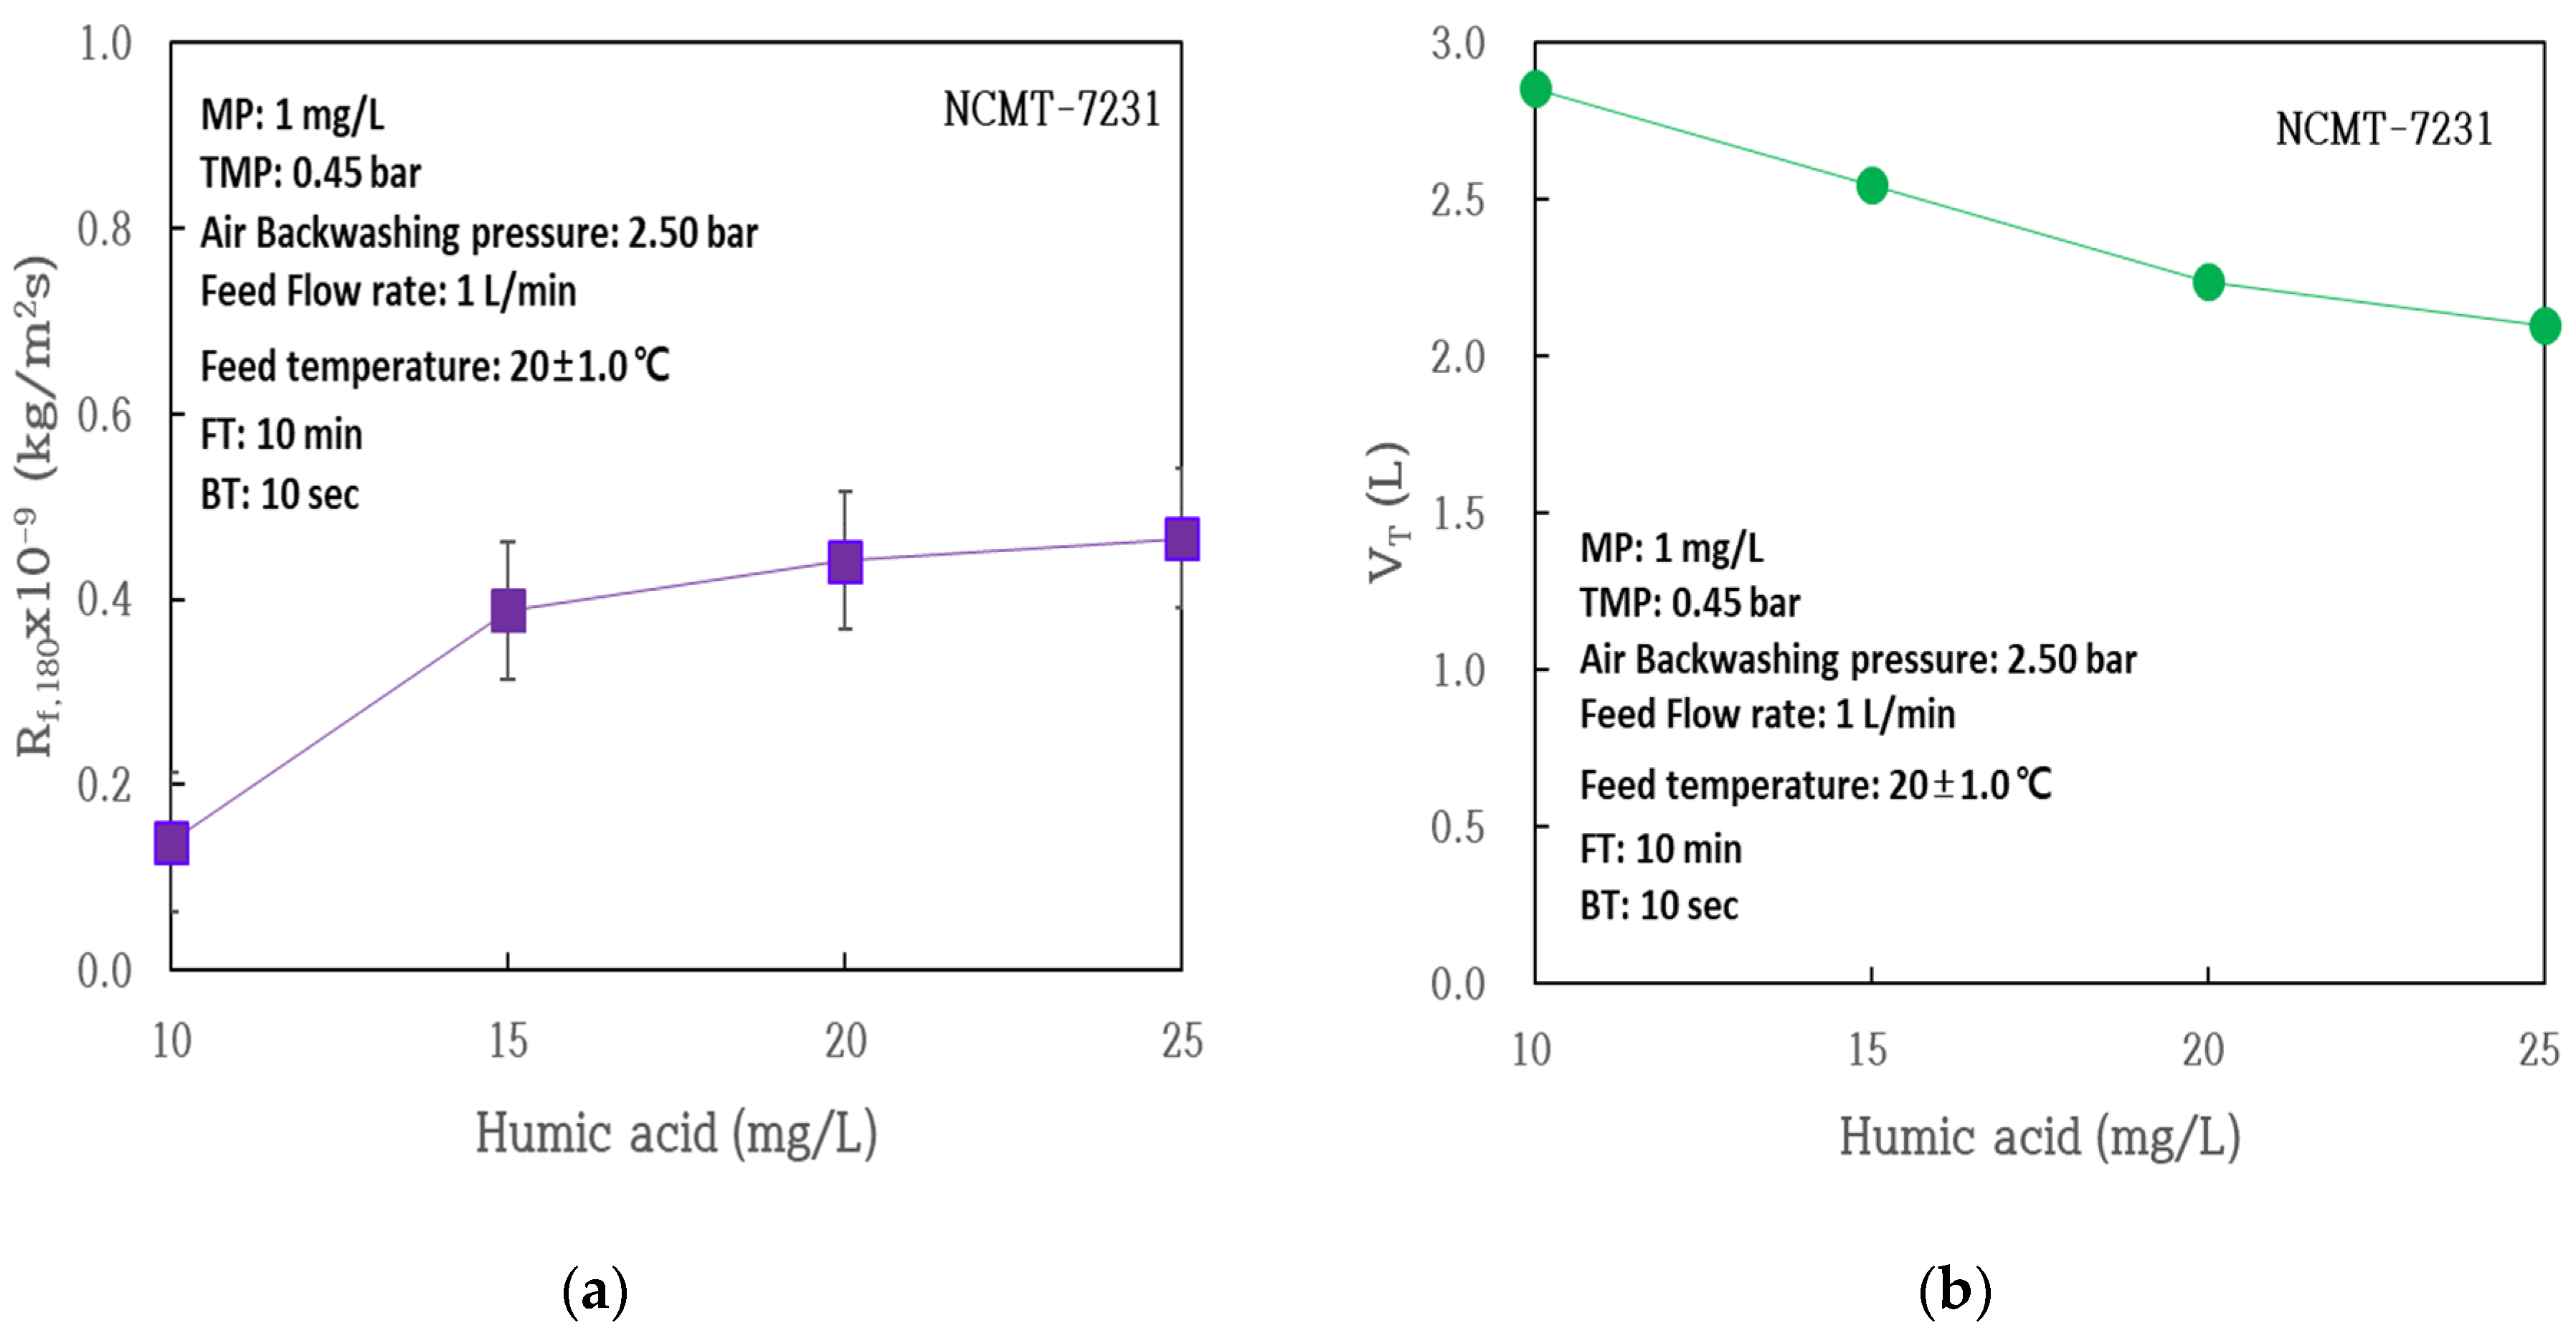
3.1.1. Impact of Organic Matter Concentration (Humic Acid, HA)

To determine the correlation between MP (PE) concentration and turbidity, the turbidity was measured by changing the MP concentrations to 0.5, 1, 2, 5, 10, and 15 mg/L. Figure 2a shows a calibration curve of turbidity for MP concentration. As a result, it was confirmed that the turbidity was proportional as the concentration of MPs increased, and based on these results, the treatment efficiency of MPs was calculated through turbidity measurement. It is difficult to measure turbidity below 0.5 mg/L PE. So, our experimental range of PE concentration was higher than in other research. In addition, to determine the correlation between humic acid (HA) concentration and UV254 absorbance, the UV254 absorbance was measured by changing the HA concentration to 10, 15, 20, and 25 mg/L. Figure 2b shows the calibration curve of UV254 absorbance for HA concentration. As a result, the UV254 absorbance increased proportionally as the concentration of HA increased. Therefore, the treatment efficiency of dissolved organic matter (DOM), which was HA in this research, was obtained through UV254 absorbance analysis.
The MP concentration of the model solution was kept the same at 1 mg/L, FT for 10 min, and BT for 10 s, during periodic nitrogen backwashing, and the HA concentration was changed to 10, 15, 20, and 25 mg/L and the effect of organic matter was examined. Backwashing with air is a common backwashing method, but the reason why we backwashed with nitrogen instead of air in this study was to minimize the possibility that the oxygen contained in the air would affect water quality. The average values of resistances of the membrane itself (Rm), the boundary layer (Rb); the final resistances of membrane fouling (Rf,180), irreversible fouling (Rif), and reversible fouling (Rrf) after 180 minutes’ operation; initial permeate flux (J0); permeate flux (J180); dimensionless permeate flux (J180/J0); and the total filtration volume (VT) after 180 minutes’ operation are summarized in Table 2, after repeated experiments.
Filtration resistance (Rm, Rb, Rf, Rif, and Rrf) and transmission line flux (J) were calculated using resistance-in-series filtration theory (J = ΔP/(Rm + Rb + Rf)), with the equivalent means utilized at the former result [34], where ΔP is TMP. After the experiments under each condition, the ceramic membrane was removed from the module, and the inside of the membrane was physically cleaned using a cleaning brush. The membrane was then reassembled into the module to measure the permeate flux of pure water. The Rif was calculated by substituting the measured permeate flux into the resistance-in-series filtration equation, and the Rif value was subtracted from the Rf,180 value to determine the Rrf. Figure 3 compares the values of Rm, Rb, Rf,180, Rif, and Rrf in a bar graph.
In Table 2 and Figure 3, Rm and Rb are the minimum values, and J180 and VT are the maximum at HA 10 mg/L, and the membrane fouling (Rf,180) is the lowest in this experimental range of HA 10~25 mg/L. Rf,180 was the highest at the maximum concentration of HA of 25 mg/L under these experimental conditions. However, Rif showed a maximum value at HA 10 mg/L and a minimum value at HA 15 mg/L, while Rrf showed a minimum value at HA 10 mg/L and a maximum value at HA 15 mg/L.
These results show that membrane fouling worsens as the concentration of organic matter increases. Under HA 10 mg/L condition, irreversible membrane fouling is judged to be the most common due to the infiltration of contaminants into the membrane. On the other hand, it was found that when the concentration was more than 15 mg/L, a thick layer of cake was formed on the surface of the membrane, which increased the reversible membrane fouling, which was easily removed with a brush.
In Figure 4, Rf and VT were examined according to organic matter concentrations. As shown in Figure 4, Rf,180 showed a slowly increasing trend after a sharp increase in HA concentrations between 10 and 15 mg/L, while VT showed a continuously decreasing trend. These results are due to the fact that as the concentration of HA increases, the membrane fouling inside and on the surface of the membrane increases.
Scheme 3 is a photograph taken with a Field Emission Scanning Electron Microscope (FE-SEM) on the inside and outside of the membrane after operating the microfiltration water treatment processes several times. Looking at Scheme 3, the outer surface of the membrane is almost clean and membrane pores can be distinguished. However, since the membrane module was operated in an in-and-out manner, it was observed that contaminants accumulated on the inner surface of the membrane and the pores were blocked by contaminated particles. These results are consistent with the previous findings of this research team [35].
Figure 5 shows the treatment efficiency of MPs and DOM according to the concentration of HA.
Even when the concentration of humic acid increased, there was no significant difference in MPs treatment efficiency; however, DOM treatment efficiency tended to decrease. These results imply that high concentrations of dissolved organic matter limit the removal of DOM using the ceramic MF process alone.

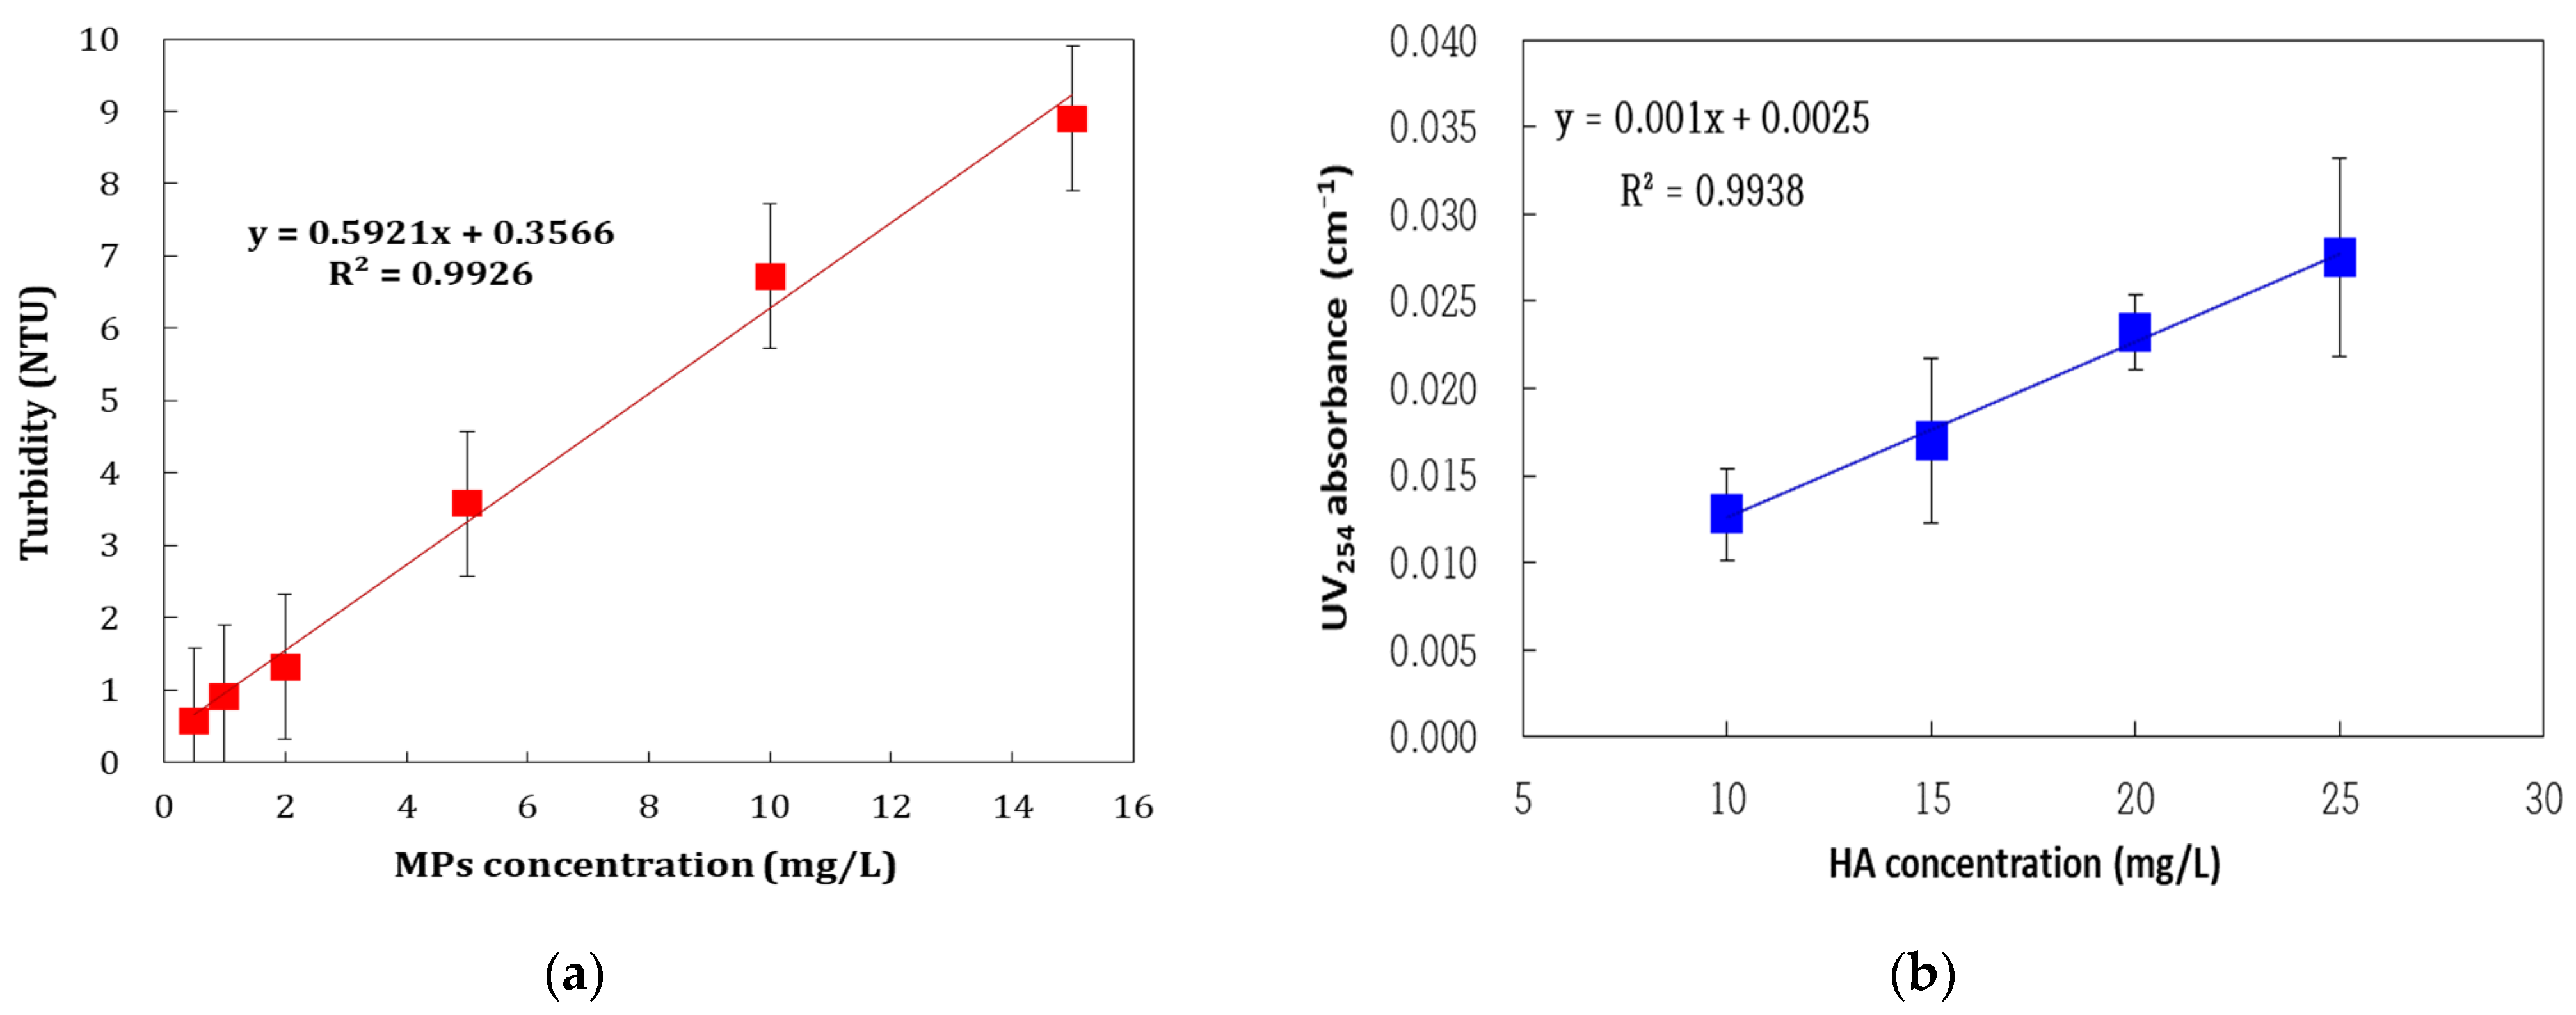
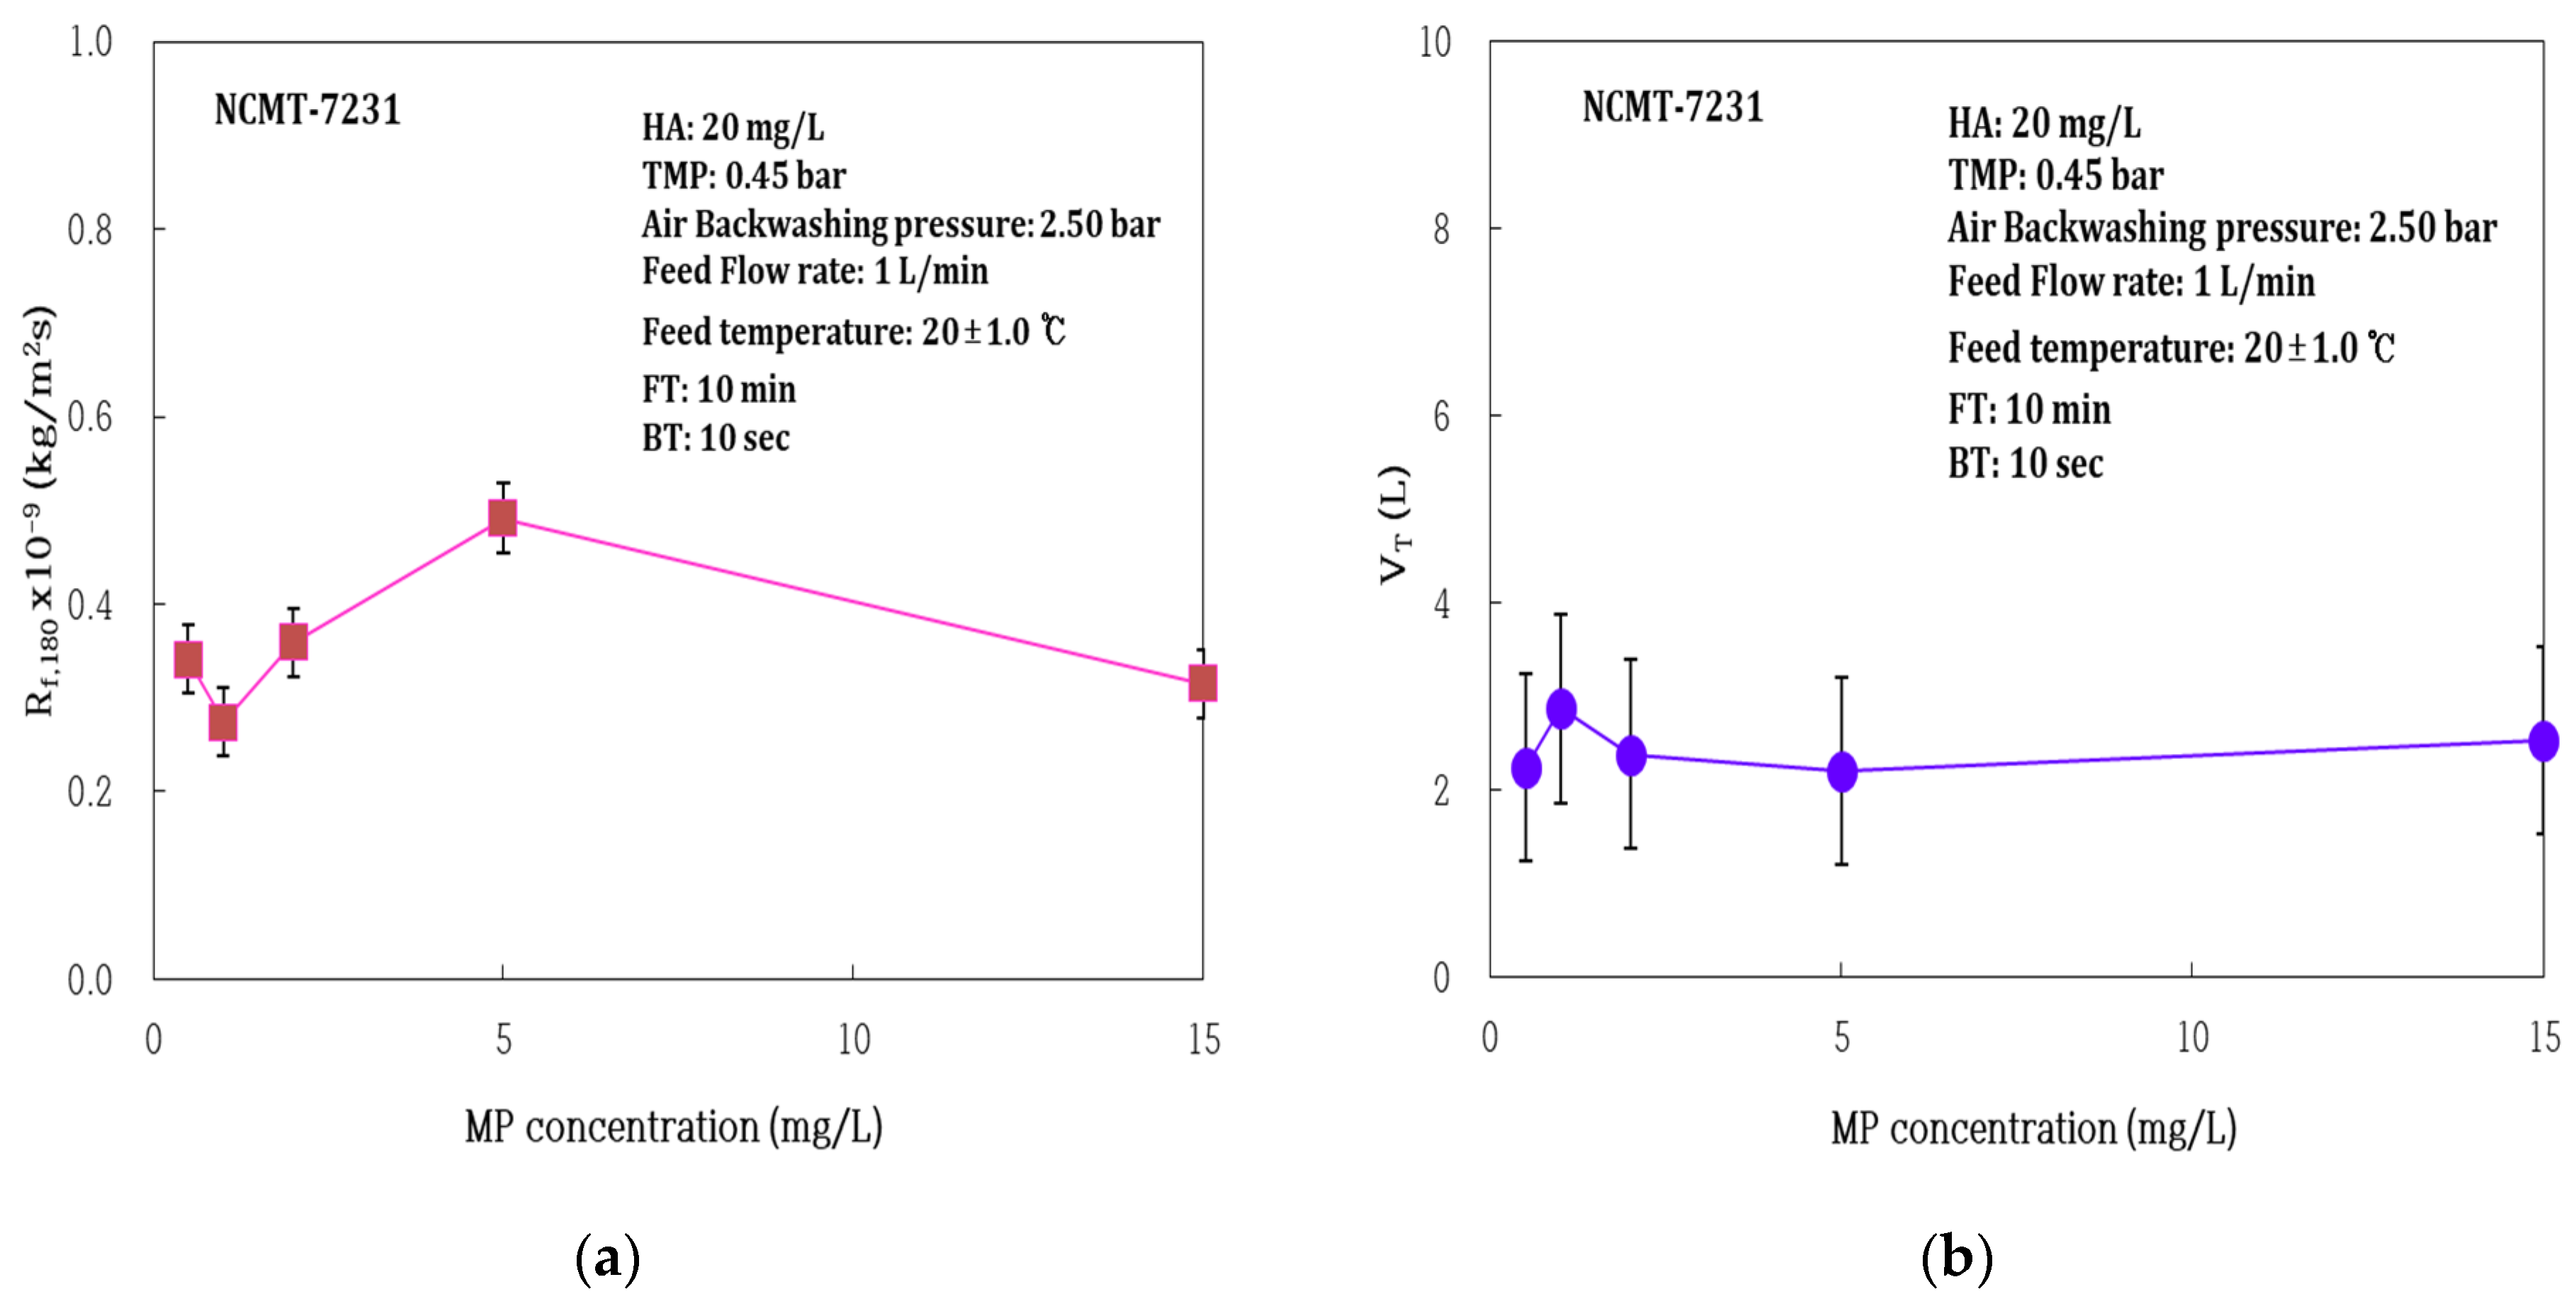
3.1.2. Impact of Microplastic (MP) Concentrations

To investigate the effect of MPs on membrane fouling in the tubular ceramic MF process alone, the effects of MPs were examined by changing the concentration of MPs to 0.5, 1, 2, 5, 10, and 15 mg/L at a constant HA 20 mg/L concentration of the model solution. In order to suppress the membrane fouling, periodic air backwashing was performed for 10 s every 10 min, which was identified as the optimal condition. After repeated experiments, the mean values of the filtration factors according to MP concentration were summarized in Table 3. Figure 6 compares the values of all filtration resistances in a bar graph. In Table 3 and Figure 6, the initial permeate flux of pure water was kept constant within the margin of error of 5% before the experiment, so the Rm was similar regardless of the MP concentration. Rf,180 and Rrf were the minimum values at MPs concentrations of 1 mg/L and the maximum at MPs 5 mg/L, while J0, J180, and VT were the maximum at MPs of 1 mg/L.
Figure 7 examines the impact of MP concentration on final membrane fouling (Rf,180) and total filtration volume (VT) after 3 h of operation. As shown in Figure 7, the Rf,180 tended to increase as MP concentrations increased, peaking at 5 mg/L and then decreasing; it showed a minimum value at 1 mg/L MPs. The VT showed the highest value at 1 mg/L of MPs, where there was a minimum of Rf,180, and it was the lowest at 5 mg/L of MPs, where there was a maximum of Rf,180. As a result of these findings, the membrane fouling did not intensify significantly even with an increase in MP concentration, and it decreased under the conditions of the highest MP concentration in the scope of this study. The reason for this is that MP particles are considerably larger than the size of the pores, so they do not penetrate into the membrane and cause irreversible membrane fouling; rather, they have the effect of cleaning the membrane surface and reducing membrane fouling.
Figure 8 shows the treatment efficiency of MPs and DOM according to the concentration of MPs in the ceramic MF process alone. As the concentration of MPs increased, the average treatment efficiency of the MPs (turbidity) tended to increase slightly; however, the treatment efficiency of the DOM (UV254 absorbance) showed a clear decreasing trend. As a result of these results, MP treatment efficiency was not significantly related to MP concentration. The reason for the decrease in the treatment efficiency of the DOM seems to be that as the MP concentration increases, the cleaning effect of the membrane surface occurs, which inhibits the formation of the cake layer.

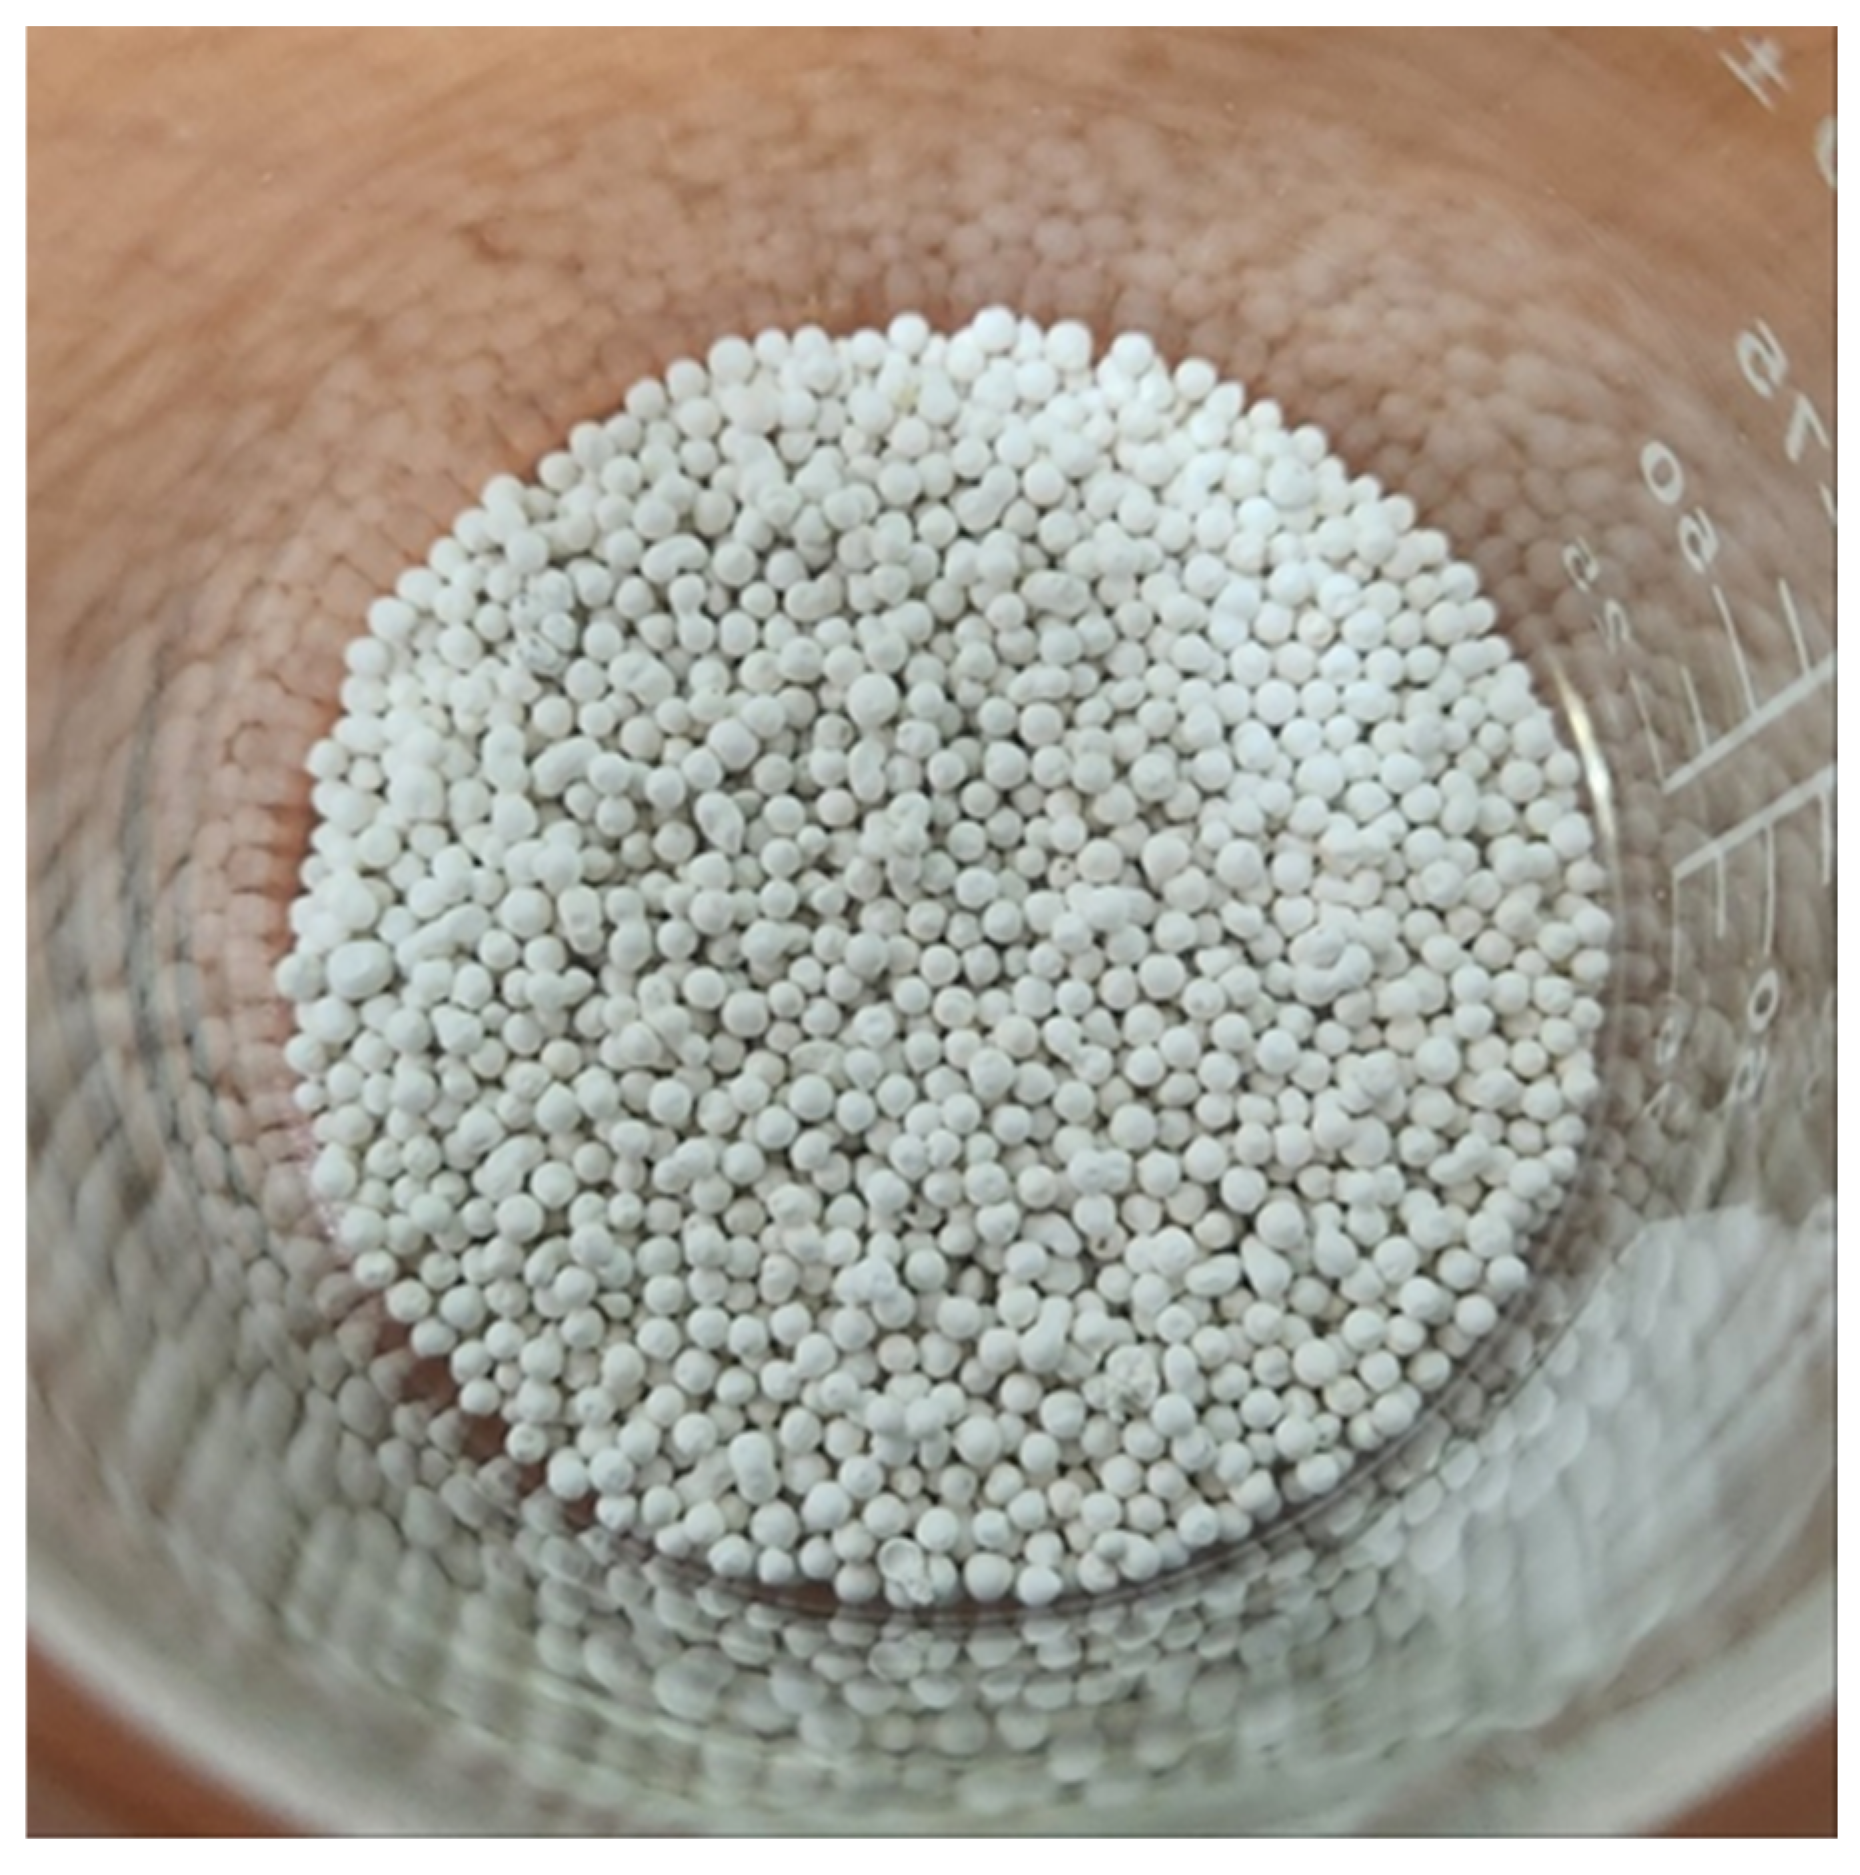
3.2. Removal of Microplastics in Hybrid Water Treatment Processes of Ceramic Microfiltration (MF) and Photocatalyst (TiO2)-Mounted PES Spheres

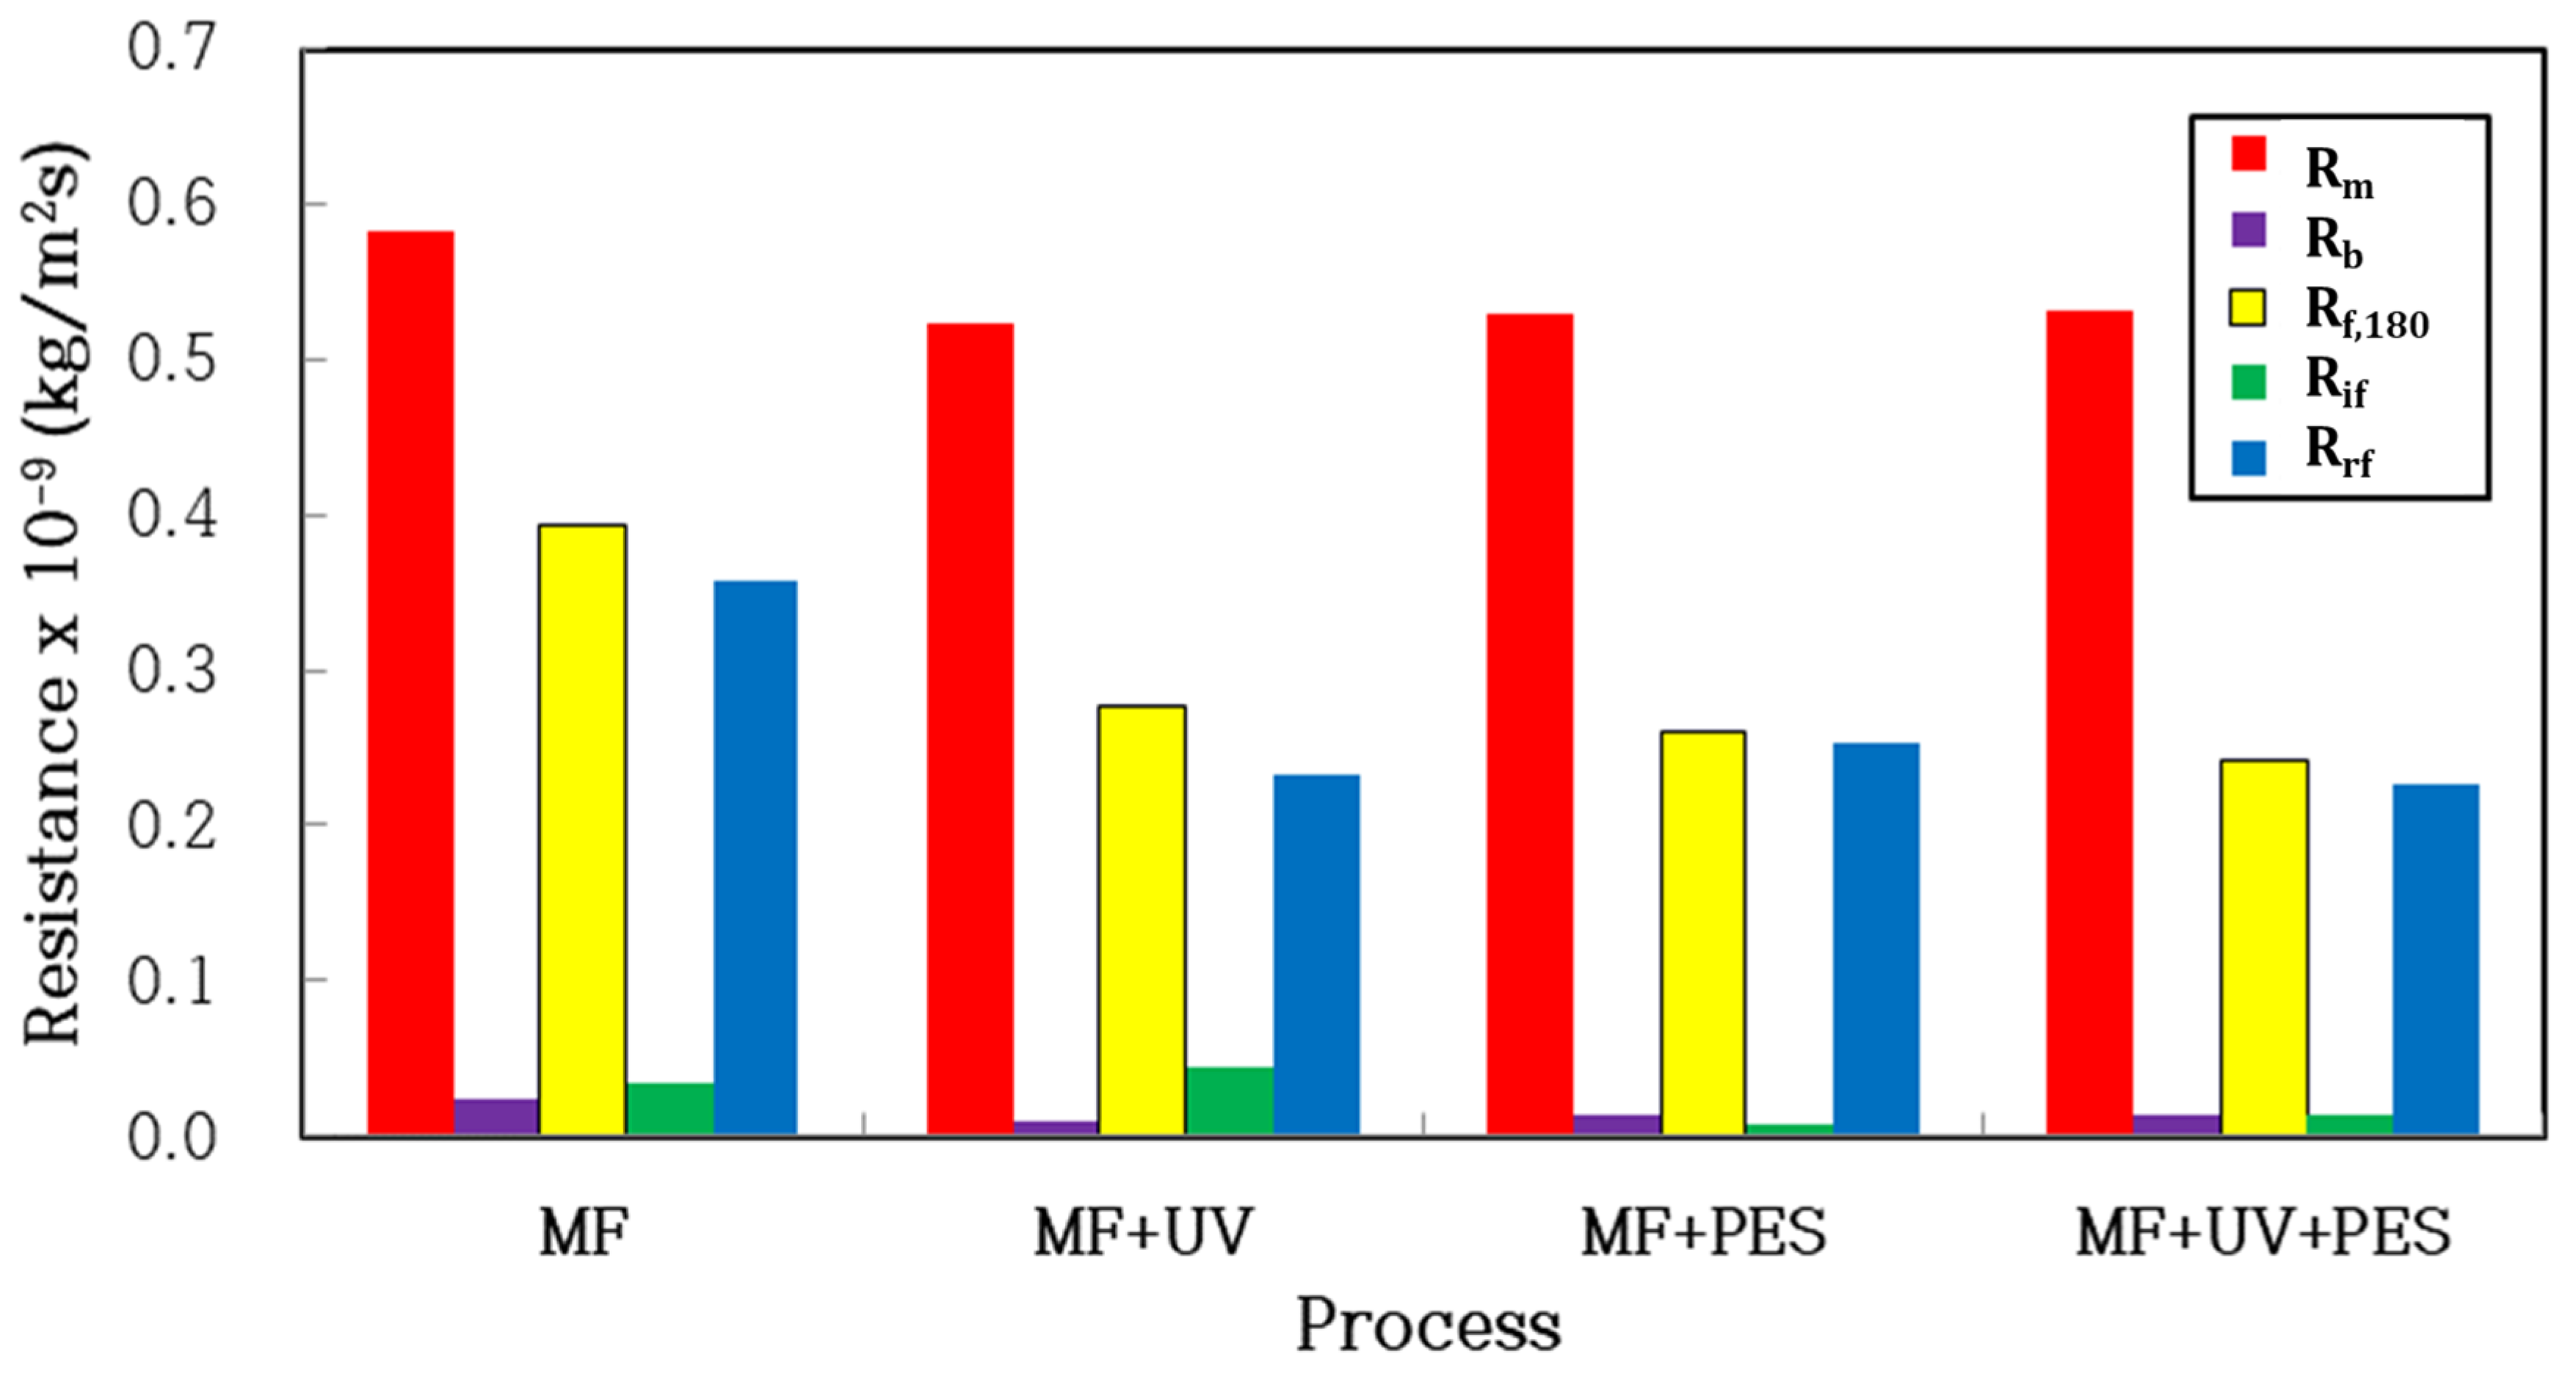
3.2.1. Roles of Microfiltration and Photocatalytic Adsorption, Photooxidation in Periodic Air Backwashing

The roles of the MF, adsorption, and photooxidation of photocatalyst (TiO2)-mounted PES spheres were investigated in the process with ceramic MF alone (MF), the process of PES spheres without UV irradiation (MF+PES), the MF process with UV irradiation (MF+UV), and the photooxidation process using ceramic MF and TiO2-mounted PES spheres with UV irradiation (MF+PES+UV) in the model solution with PE (MPs) 2 mg/L and HA 20 mg/L concentrations. After repeated experiments, the mean values of the filtration factors Rm, Rb, Rf,180, Rif, Rrf J0, J180, J180/J0, and VT are summarized in Table 4. Figure 9 compares the values of Rm, Rb, Rf,180, Rif, and Rrf in a bar graph. Table 4 and Figure 9 show that the Rf,180 value was a maximum value of 0.393 × 10⁹ kg/m2s in the MF process (MF), and it decreased as the process was more complex—from the MF to the MF+PES+UV process. In addition, J180 and VT had minimum values of 1072 L/m2h and 11.6 L, respectively, and J180 increased as the process became more complex. However, VT maximized in the MF+UV process and decreased slightly as the process became more complex. This result is due to the fact that as the process was more complex—from the MF to MF+PES+UV process—the organic matter was effectively removed due to the effects of adsorption and photooxidation, and membrane fouling was controlled. The reason for the different trends in total filtration volume VT seems to be that the initial permeate flux J0 is the maximum value in the MF+UV process.
Figure 10 shows a graph showing the change in Rf for various processes over operating time. The Rf was highest for 180 min of operation time when MF was applied alone, and the Rf value was maintained at a low value in the MF+PES+UV process. However, the Rf values were lower in the 20–60 min interval of the MF+PES process and in the 45–60 min and 150 min intervals of the MF+UV process than those in the MF+PES+UV process. These results indicate that the more complex the process, the higher the removal effect of organic substances via photocatalytic adsorption and photooxidation and, therefore, the lower the membrane fouling.
Figure 11 shows the change in dimensionless permeate flux J/J0 for each process over operating time. At the beginning of operations, there was no significant difference between the different processes and there was no steady trend, but as time passed, the J/J0 value remained high in the MF+PES+UV process. Of course, there was a section in the MF+PES process and the MF+UV process that showed a temporarily high J/J0 value. However, in general, as the process was simplified from MF+PES+UV to MF, the membrane fouling increased and the permeate flux value decreased, resulting in the lowest J/J0 value in the MF-alone process.
When the MP concentration is 2 mg/L and the HA concentration is 20 mg/L, the treatment efficiency of MPs (turbidity) and DOM (UV254 absorbance) in the MF, MF+UV, MF+PES, and MF+PES+UV processes are summarized in Table 5 and Table 6, respectively. Table 6 shows that the average turbidity of feed and treated water was 13.0~16.8 NTU and 1.051~1.255 NTU, respectively. As the process was complicated from the MF-alone to the MF+PES+UV process, the treatment efficiency of MPs tended to increase slightly. A protein-based porous N-TiO2 semiconductor, which was developed for the removal of MPs, was used to degrade HDPE, one of the MPs [20]. However, under the experimental conditions of this study, the removal effect of MPs via adsorption and photooxidation using a photocatalyst was not clearly seen. From these results, it can be seen that the TiO2-mounted PES spheres used in this study were developed to remove DOM, so there are limitations in removing MPs.
Table 6 shows that the average UV254 absorbance, which was a measure for the DOM (HA), of the feed water was almost constant, and the average UV254 absorbance of the treated water decreased significantly from 0.023 cm1 to 0.007 cm1 as the process was complexed. Therefore, the more complex the process in the order of MF+PES+UV, MF+PES, MF+UV, and MF, the greater the treatment efficiency of the DOM increased from 29.1% to 79.7%. From these results, it was confirmed that the DOM was effectively removed via the adsorption and photooxidation of TiO2-mounted PES spheres.
Table 7 summarizes the treatment fractions of membrane filtration, adsorption, and photooxidation by TiO2-mounted PES spheres obtained by sequentially subtracting the turbidity and DOM treatment efficiency of the MF, MF+UV, MF+PES, and MF+PES+UV processes, which was operated at MP 2 mg/L and HA 20 mg/L. Periodic air backwashing was performed to suppress membrane fouling in all processes. The treatment fraction of MPs identified via turbidity was 90.2%, being the most dominant in the MF process.
However, the treatment fraction of UV-induced photooxidation and adsorption by TiO2-mounted PES spheres was weak, at 0.5% and 2.3%, respectively. In addition, in the presence of TiO2-mounted PES spheres, there was no fraction of treatment by photooxidation at all. However, the DOM treatment fraction calculated using the treatment efficiency of the UV254 absorbance was the highest in the presence of TiO2-mounted PES spheres, with a treatment fraction of 46.9%. Next, the treatment fraction of membrane filtration showed a high value of 29.1%. However, the treatment fractions of adsorption by TiO2-mounted PES spheres and UV photooxidation without the PES spheres were low at 3.7% and 3.5%, respectively. These results show that the photooxidation effect caused by the UV irradiation of the TiO2-mounted PES spheres played a greater role in processing the DOM than membrane separation or adsorption by the PES spheres. Since the TiO2-mounted PES spheres used in this study were developed to remove DOMs such as HA, it was found to be ineffective in removing MPs.

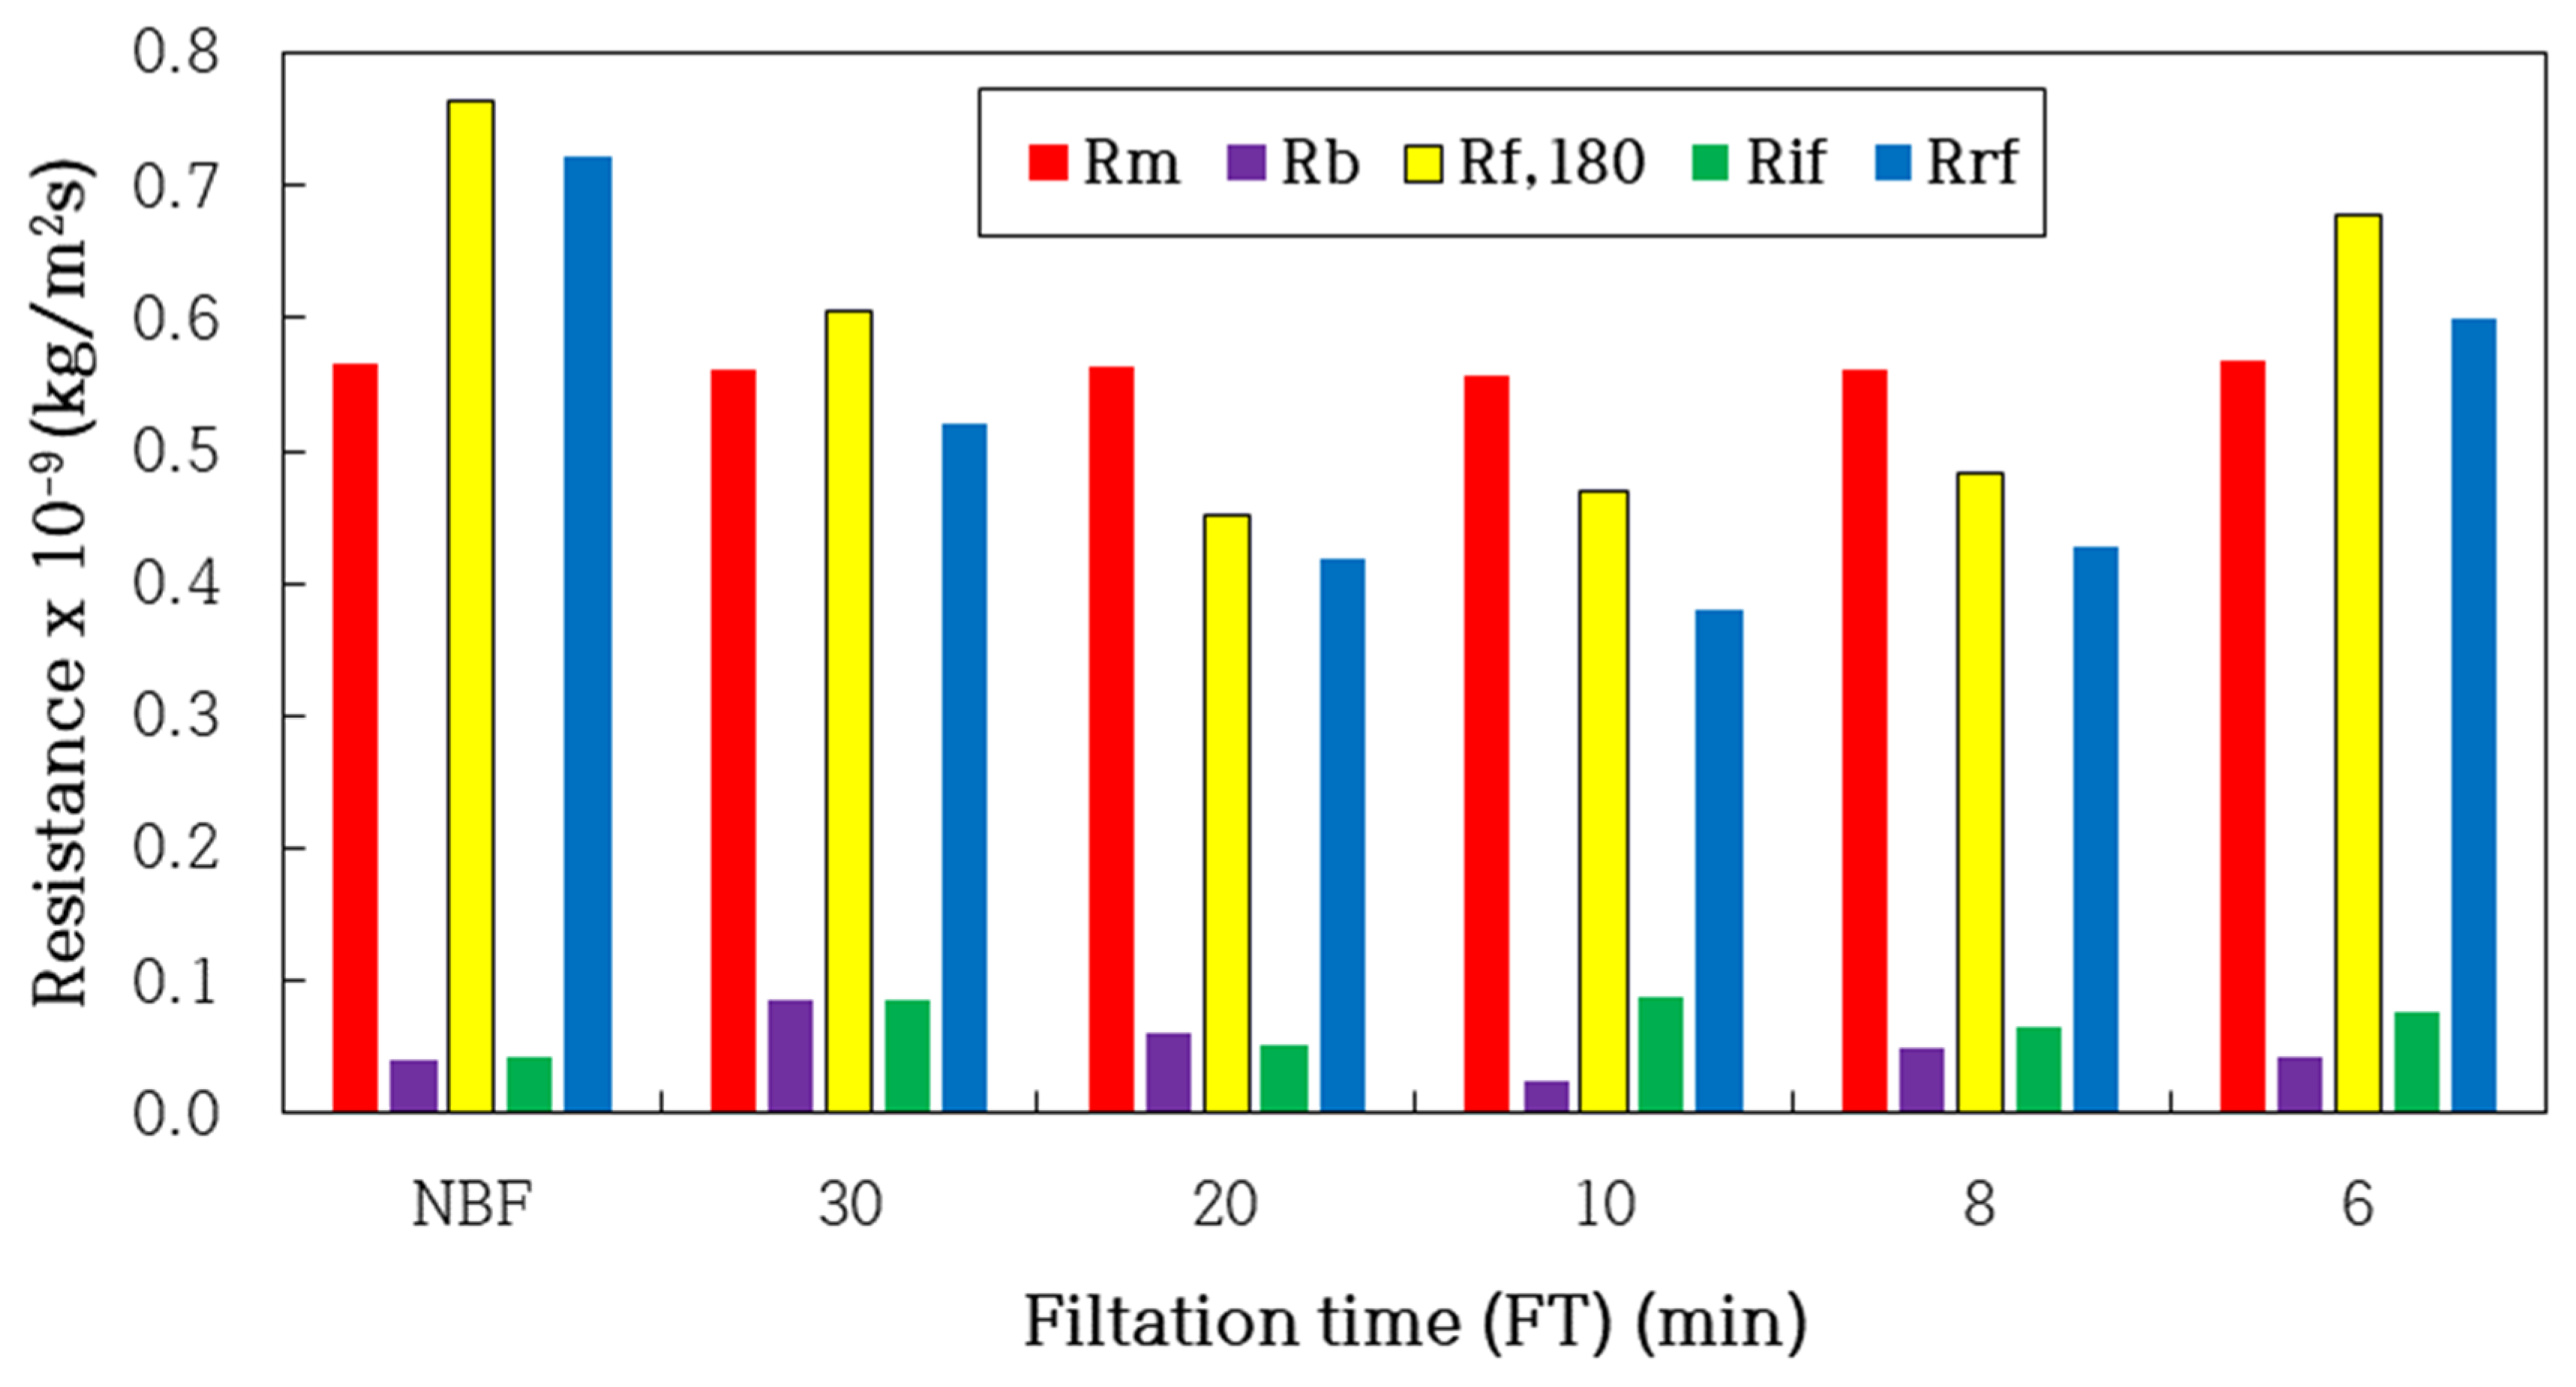
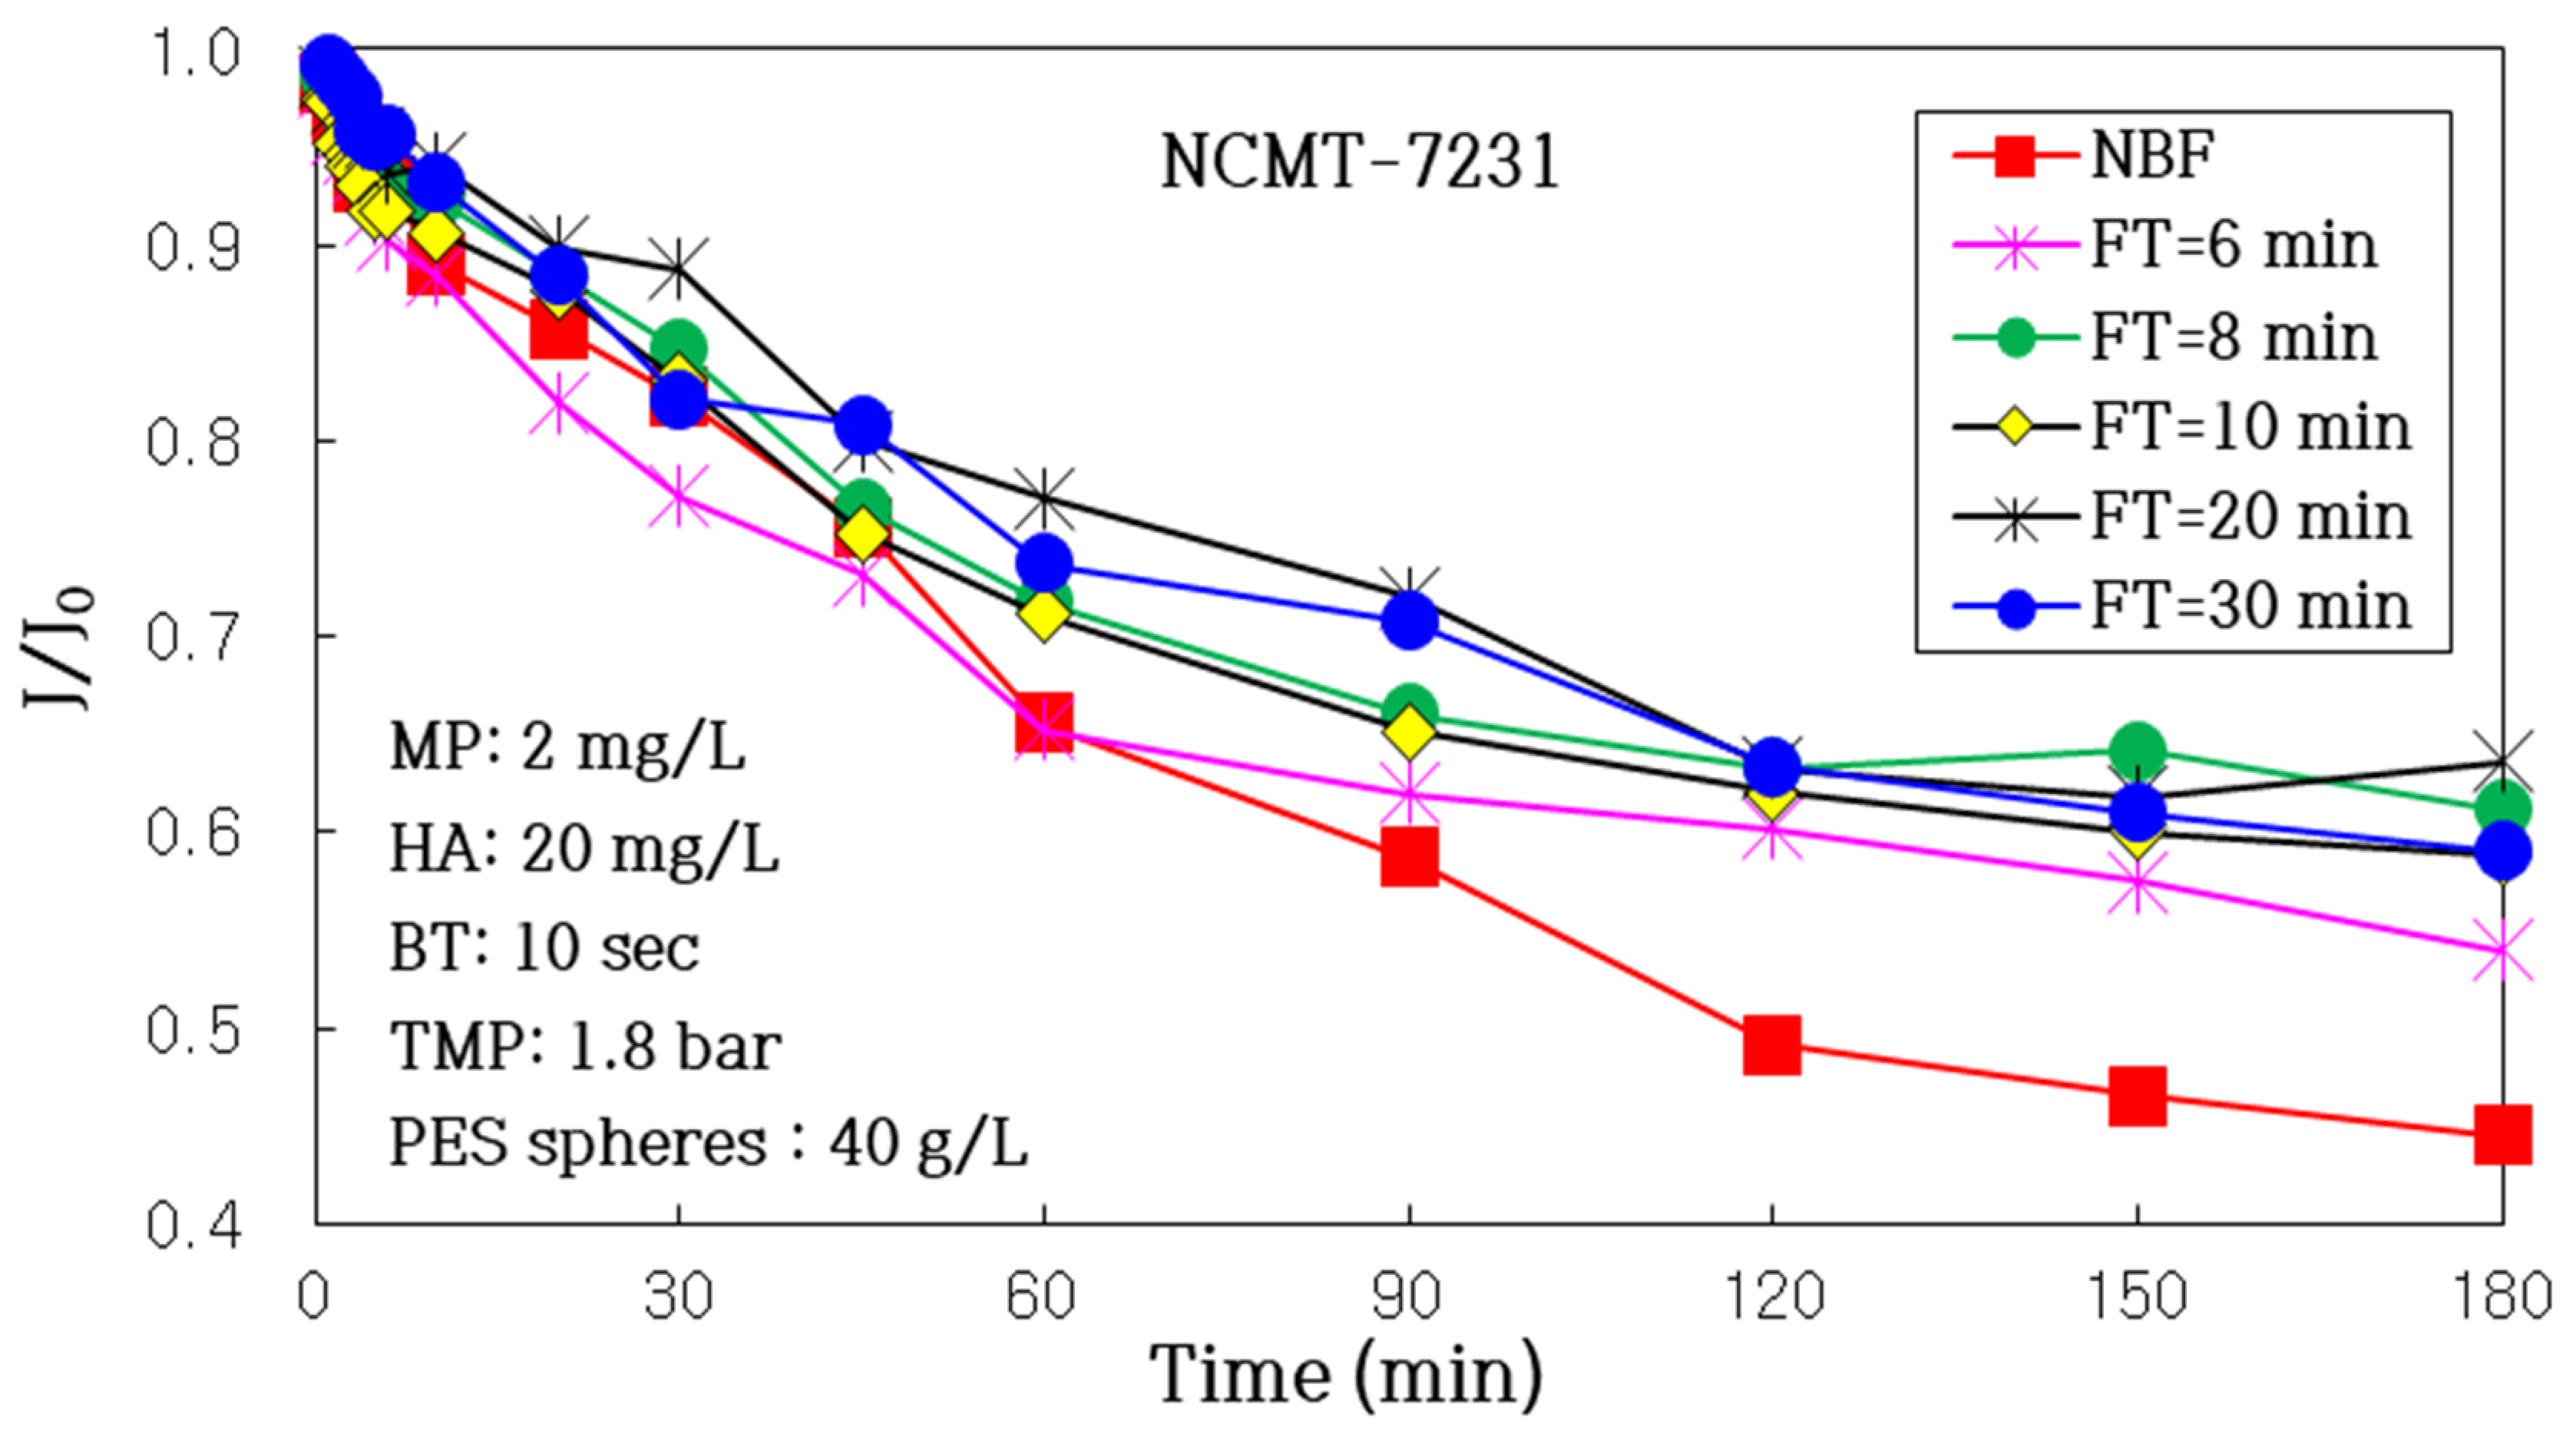
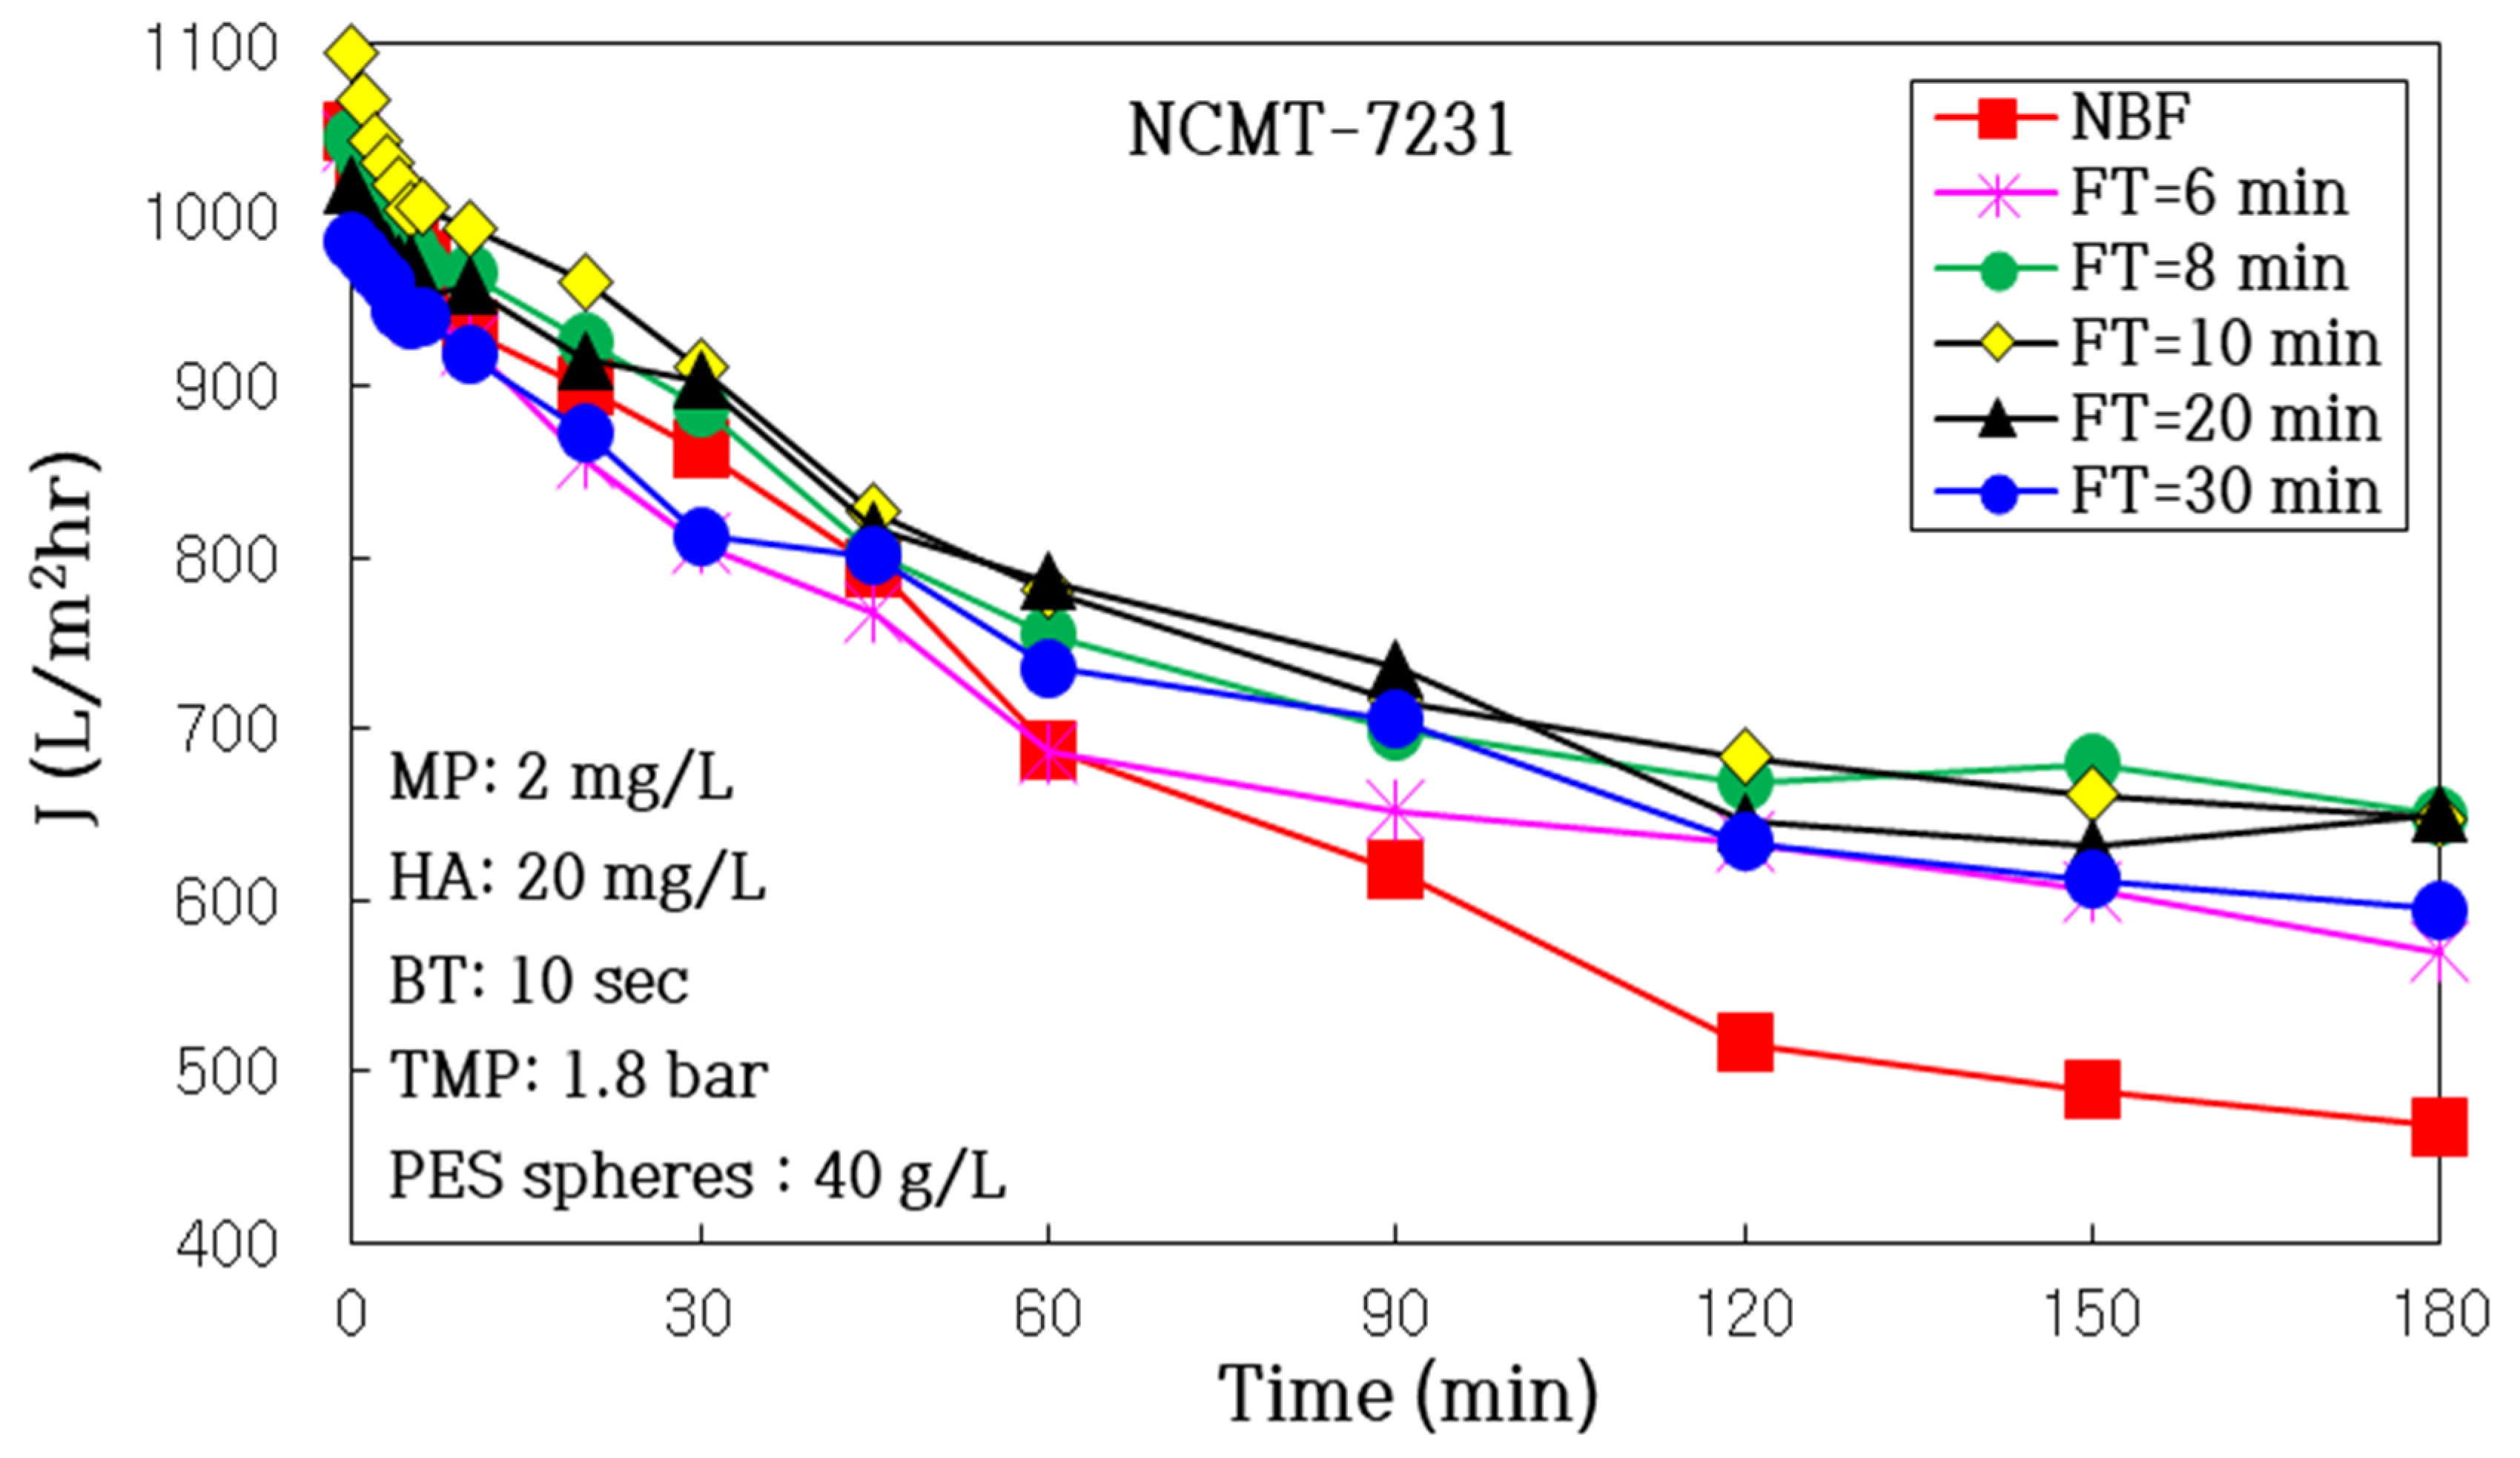
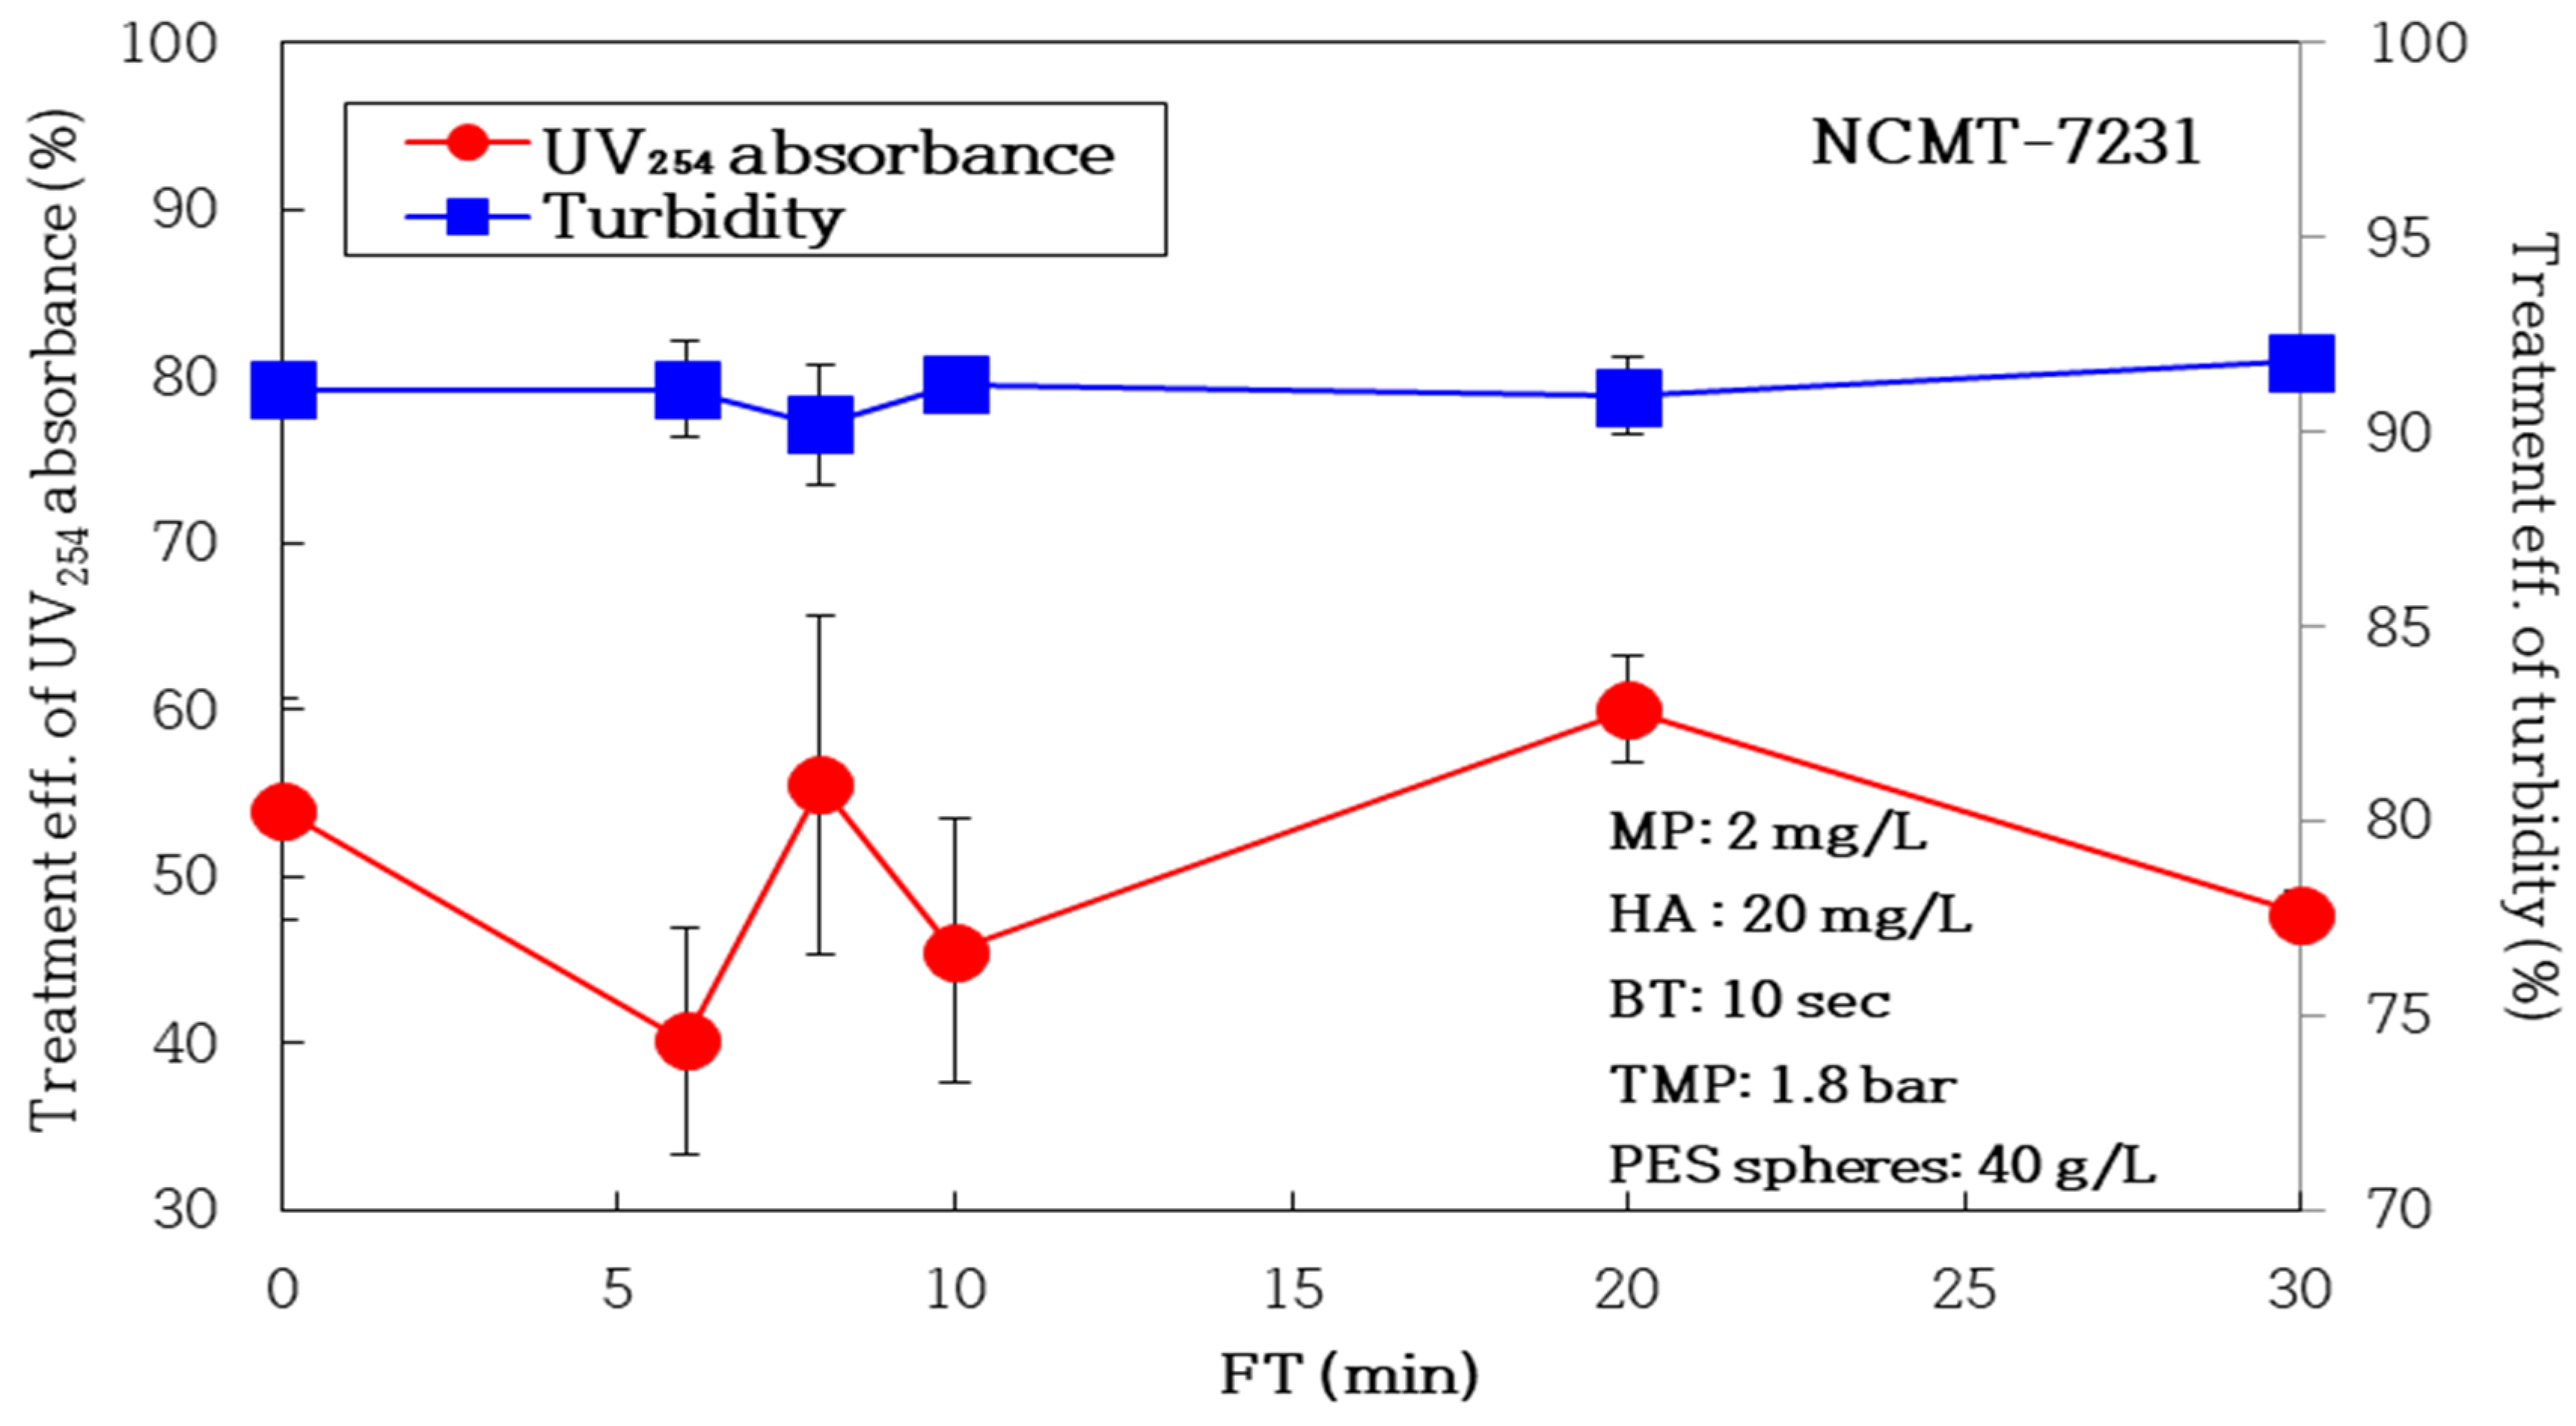
3.2.2. Impact of Air Backwashing Cycle (FT, Filtration Time)

We examined the impact of FT in the hybrid water treatment processes of ceramic microfiltration and TiO2-mounted PES spheres. After fixing the concentration of MPs at 2 mg/L, the concentration of HA at 20 mg/L, the concentration of PES spheres at 40 g/L, and the backwashing time (BT) at 10 s, the impacts of FT were inspected in terms of Rf, J/J0, and VT by changing the FT to NBF (no backwashing), 6, 8, 10, 20, and 30 min, respectively.
The filtration factors are summarized in Table 8, and Figure 12 compares the values of filtration resistances in a bar graph. By adjusting the initial permeate flux to a certain extent, the resistance of membrane Rm showed approximately the same value. The resistance of the boundary layer, Rb, showed a minimum value at an FT of 10 min and a maximum one at an FT of 30 min. These results prove that an FT of 10 min is the optimal air backwashing interval to suppress the boundary layer in the scope of this study.
As shown in Figure 12, the final resistance of membrane fouling, Rf,180, was the lowest at 0.451 × 10⁹ kg/m2s, and the final permeate flux, J180, was highest at 650 L/m2h at an FT 20 min. The resistance of reversible membrane fouling, Rrf, showed a minimum of 0.381 × 10⁹ kg/m2s at an FT of 10 min. As shown in Table 8, the VT, which is the total filtration volume, was able to obtain the maximum treated water at 11.51 L at an FT of 10 min. In summary, these results suggest that the optimal FT condition is 10 min to obtain the maximum treated water (VT).
Figure 13 shows the change in Rf during a 180 min operation time over the FT. As a result, Rf maintained generally low at FT of 20 min during 180 min’s operating time, ultimately resulting in the final lowest Rf,180 value after 180 min. The Rf of an FT of 6 min remained highest until the first 90 min of operation, after which the Rf of NBF reversed and became the highest. These results demonstrate that membrane fouling is most severe in NBF conditions without air backwashing and that air backwashing every 20 min is the most effective way to suppress membrane fouling.
Figure 14 shows the evolution of dimensionless permeate flux (J/J0) over backwashing cycles during operation. The results showed that under the FT 20 min condition, in which membrane fouling was most effectively suppressed, J/J0 generally showed the highest value during the 180 min run and the maximum value at the end of the operations. On the other hand, J/J0 at a 6 min FT was minimal until 60 min, after which J/J0 in the NBF condition decreased sharply.
Figure 15 shows the permeate flux (J) value change in the air backwashing cycle (FT) during operation. As Figure 15 shows, 10 min of FT consistently showed the highest value over the course of 180 min of operation, resulting in the highest VT gained. Therefore, 10 min of FT is considered to be the optimal air backwashing cycle condition for the largest filtration volume under the 10 s backwashing time (BT) condition.
Figure 16 compares the average treatment efficiency of MPs and DOM according to FT through the water quality analysis of turbidity and UV254 absorbance, respectively. Looking at Figure 16, the standard deviation is shown by the average treatment efficiency obtained through repeated experiments, and the treatment efficiency at some FT conditions shows unusual trends with different results from experiment to experiment. In conclusion, the average treatment efficiency of MPs was almost constant regardless of FT conditions. However, the DOM treatment efficiency was lowest at 40.2% at 6 min of FT and highest at 60.0% at 20 min of FT.

4. Conclusions

In this study, the effects of HA and MP concentrations were examined using a model solution consisting of MPs (polyethylene (PE), 125 μm) and organic matter (humic acid, HA) using only ceramic microfiltration (MF). Next, the role of the adsorption and photooxidation of the TiO2-mounted PES spheres was observed in MF, in the MF with the PES spheres without UV irradiation (MF+PES), in the MF of UV irradiation without PES (MF+UV), and in the hybrid process using ceramic microfiltration and PES (MF+PES+UV). Lastly, the membrane filtration characteristics and treatment efficiency were inspected under the influence of the air backwashing cycle (FT) in the MF+PES+UV process. The following conclusions could be obtained from this research.
When examining the effect of organic matter during air backwashing in the MF process, the resistance of membrane fouling (Rf) was the highest at the maximum concentration of HA 25 mg/L under these experimental conditions. These results show that membrane fouling worsens as the concentration of organic matter increases. Even when the concentration of HA increased, there was no significant difference in the average treatment efficiency (ATE) of the MPs; however, the ATE of DOM tended to decrease. These results imply that high concentrations of DOM limit the removal of it via the MF process alone.
As the concentration of MPs increased, the ATE of the MPs tended to increase slightly; however, the ATE of the DOM showed a clear decreasing trend. As a result, the ATE of the MPs was not significantly related to MP concentration. The reason for the decrease in the ATE of the MPs of the DOM seems to be that as the MP concentration increases, the cleaning effect of the membrane surface occurs, which inhibits the formation of the cake layer.
The Rf,180 was the maximum value in the MF process, and it decreased as the process was complex from the MF to the MF+PES+UV process. In addition, J180 and VT had minimum values and J180 increased; however, the total filtration volume (VT) maximized in the MF+UV process and decreased slightly as the process became more complex. This result is due to the fact that as the process was more complex from the MF to MF+PES+UV process, organic matter was excellently removed due to the effects of adsorption and photooxidation, and membrane fouling was controlled.
The treatment fraction of MPs was 90.2%, being the most dominant in the MF process. However, the treatment fraction of UV-induced photooxidation and adsorption via the TiO2-mounted PES spheres was weak. However, the DOM treatment fraction was the highest in the presence of the PES, with a treatment fraction of 46.9%. Next, the treatment fraction of MF showed a high value of 29.1%. These results show that the photooxidation effect caused by the UV irradiation of the PES played a greater role in removing the DOM than membrane separation or adsorption via PES.
The Rf,180 was the lowest and the J180 was the highest at 20 min of FT. The VT was at its maximum for treated water at an FT of 10 min. These results suggest that the optimal FT condition is 10 min to obtain the maximum VT. The ATE of MPs was almost constant regardless of FT. However, the ATE of DOM was highest (60.0%) at 20 min of FT.

Author Contributions

Experiments, M.S.; writing—review and editing, J.Y.P. All authors have read and agreed to the published version of the manuscript.

Funding

This research funding was reinforced by Hallym University, 2023 (HRF-202309-004).

Institutional Review Board Statement

Not applicable.

Data Availability Statement

Data is unavailable due to privacy or ethical restrictions.

Conflicts of Interest

The authors declare no conflicts of interest.

References

  1. Lu, Y.; Li, M.C.; Lee, J.; Liu, C.; Mei, C. Microplastic remediation technologies in water and wastewater treatment processes: Current status and future perspectives. Sci. Total Environ. 2023, 868, 161618. [Google Scholar] [CrossRef] [PubMed]
  2. Gao, N.; Ning, R.; Deng, X. Feasibility, challenges, and future prospects of microalgae-based bioremediation technique for removing microplastics from wastewater. Front. Bioeng. Biotechnol. 2023, 11, 1288439. [Google Scholar] [CrossRef] [PubMed]
  3. Blair, R.M.; Waldron, S.; Phoenix, V.R.; Gauchotte-Lindsay, C. Microscopy and elemental analysis characterisation of microplastics in sediment of a freshwater urban river in Scotland, UK. Environ. Sci. Pollut. Res. 2019, 26, 12491–12504. [Google Scholar] [CrossRef] [PubMed]
  4. Cherian, A.G.; Liu, Z.; McKie, M.J.; Almuhtaram, H.; Andrews, R.C. Microplastic Removal from Drinking Water Using Point-of-Use Devices. Polymers 2023, 15, 1331. [Google Scholar] [CrossRef] [PubMed]
  5. Park, T.J.; Lee, S.H.; Lee, M.S.; Lee, J.K.; Lee, S.H.; Zoh, K.D. Occurrence of microplastics in the Han River and riverine fish in South Korea. Sci. Total Environ. 2020, 708, 134535. [Google Scholar] [CrossRef] [PubMed]
  6. Eo, S.; Hong, S.H.; Song, Y.K.; Han, G.M.; Shim, W.J. Spatiotemporal distribution and annual load of microplastics in the Nakdong River, South Korea. Water Res. 2019, 160, 228–237. [Google Scholar] [CrossRef] [PubMed]
  7. D’Avignon, G.; Gregory-Eaves, I.; Ricciardi, A. Microplastics in lakes and rivers: An issue of emerging significance to limnology. Environ. Rev. 2022, 30, 228–244. [Google Scholar] [CrossRef]
  8. Violetta, G.E.C. Microplastics in Food Commodities: A Food Safety Review on Human Exposure through Dietary Sources; Food Safety and Quality Series; Food and Agriculture Organization of the United Nations: Rome, Italy, 2022; Volume 18, pp. 1–124. [Google Scholar] [CrossRef]
  9. United Nations Environment Programme (UNEP). From Pollution to Solution; United Nations Environment Programme: Nairobi, Kenya, 2021. [Google Scholar]
  10. Lei, L.; Wu, S.; Lu, S.; Liu, M.; Song, Y.; Fu, Z.; Shi, H.; Raley-Susman, K.M.; He, D. Microplastic particles cause intestinal damage and other adverse effects in zebrafish Danio rerio and nematode Caenorhabditis elegans. Sci. Total Environ. 2018, 619–620, 1–8. [Google Scholar] [CrossRef]
  11. Acarer, S. Microplastics in wastewater treatment plants: Sources, properties, removal efficiency, removal mechanisms, and interactions with pollutants. Water Sci. Technol. 2023, 87, 685–710. [Google Scholar] [CrossRef] [PubMed]
  12. Acarer, S. A review of microplastic removal from water and wastewater by membrane technologies. Water Sci. Technol. 2023, 88, 199–219. [Google Scholar] [CrossRef]
  13. Dalmau-Soler, J.; Ballesteros-Cano, R.; Boleda, M.R.; Paraira, M.; Ferrer, N.; Lacorte, S. Microplastics from headwaters to tap water: Occurrence and removal in a drinking water treatment plant in Barcelona Metropolitan area (Catalonia, NE Spain). Environ. Sci. Pollut. Res. 2021, 28, 59462–59472. [Google Scholar] [CrossRef] [PubMed]
  14. Song, Y.U.; Ha, I.H.; Park, J.H.; Go, Y.J.; Yun, J.U.; Kim, H.S. Current status of research on ceramic membrane materials for water treatment. Ceramist 2012, 15, 14–27. [Google Scholar]
  15. Takeuchi, H.; Tanaka, S.; Koyuncu, C.Z.; Nakada, N. Removal of microplastics in wastewater by ceramic microfiltration. J. Water Process Eng. 2023, 54, 104010. [Google Scholar] [CrossRef]
  16. Ma, B.; Xue, W.; Ding, Y.; Hu, C.; Liu, H.; Qu, J. Removal characteristics of microplastics by Fe-based coagulants during drinking water treatment. J. Environ. Sci. 2019, 78, 267–275. [Google Scholar] [CrossRef] [PubMed]
  17. Yang, J.; Monnot, M.; Sun, Y.; Asia, L.; Wong-Wah-Chung, P.; Doumeng, P.; Moulin, P. Microplastics in different water samples (seawater, freshwater, and wastewater): Removal efficiency of membrane treatment processes. Water Res. 2023, 232, 119673. [Google Scholar] [CrossRef] [PubMed]
  18. Mohana, A.A.; Rahman, M.; Sarker, S.K.; Haque, N.; Gao, L.; Pramanik, B.K. Nano/microplastics: Fragmentation, interaction with co-existing pollutants and their removal from wastewater using membrane processes. Chemosphere 2022, 309, 136682. [Google Scholar] [CrossRef] [PubMed]
  19. Li, L.; Xu, G.; Yu, H.; Xing, J. Dynamic membrane for micro-particle removal in wastewater treatment: Performance and influencing factors. Sci. Total Environ. 2018, 627, 332–340. [Google Scholar] [CrossRef] [PubMed]
  20. Ariza-Tarazona, M.C.; Villarreal-Chiu, J.F.; Barbieri, V.; Siligardi, C.; Cedillo-González, E.I. New strategy for microplastic degradation: Green photocatalysis using a protein-based porous N-TiO2 semiconductor. Ceram. Int. 2019, 45, 9618–9624. [Google Scholar] [CrossRef]
  21. Llorente-García, B.E.; Hernández-López, J.M.; Zaldívar-Cadena, A.A.; Siligardi, C.; Cedillo-González, E.I. First Insights into Photocatalytic Degradation of HDPE and LDPE Microplastics by a Mesoporous N–TiO2 Coating: Effect of Size and Shape of Microplastics. Coatings 2020, 10, 658. [Google Scholar] [CrossRef]
  22. Nabi, I.; Bacha, A.; Li, K.; Cheng, H.; Wang, T.; Liu, Y.; Ajmal, S.; Yang, Y.; Feng, Y.; Zhang, L. Complete Photocatalytic Mineralization of Microplastic on TiO2 Nanoparticle Film. iScience 2020, 23, 101326. [Google Scholar] [CrossRef]
  23. Ariza-Tarazona, M.C.; Villarreal-Chiu, J.F.; Hernández-López, J.M.; Rosa, J.R.D.I.; Barbieri, V.; Siligardi, C.; Cedillo-González, E.I. Microplastic pollution reduction by a carbon and nitrogen-doped TiO2: Effect of pH and temperature in the photocatalytic degradation process. J. Hazard. Mater. 2020, 395, 122632. [Google Scholar] [CrossRef]
  24. Lee, J.M.; Busquets, R.; Choi, I.C.; Lee, S.H.; Kim, J.K.; Campos, L.C. Photocatalytic Degradation of Polyamide 66; Evaluating the Feasibility of Photocatalysis as a Microfibre-Targeting Technology. Water 2020, 12, 3551. [Google Scholar] [CrossRef]
  25. Domínguez-Jaimes, L.P.; Cedillo-González, E.I.; Luévano-Hipólito, E.; Acuña-Bedoya, J.D.; Hernández-López, J.M. Degradation of primary nanoplastics by photocatalysis using different anodized TiO2 structures. J. Hazard. Mater. 2021, 413, 125452. [Google Scholar] [CrossRef]
  26. Fadli, M.H.; Ibadurrohman, M.; Slamet, S. Microplastic Pollutant Degradation in Water Using Modified TiO2 Photocatalyst Under UV-Irradiation. IOP Conf. Ser. Mater. Sci. Eng. 2021, 1011, 012055. [Google Scholar] [CrossRef]
  27. Maulana, D.A.; Ibadurrohman, M. Slamet, Synthesis of Nano-Composite Ag/TiO2 for Polyethylene Microplastic Degradation Applications. IOP Conf. Ser. Mater. Sci. Eng. 2021, 1011, 012054. [Google Scholar] [CrossRef]
  28. Zhao, Y.; Zhang, F.; Zhang, J.; Zou, K.; Zhang, J.; Chen, C.; Long, M.; Zhang, Q.; Wang, J.; Zheng, C.; et al. Preparation of composite photocatalyst with tunable and self-indicating delayed onset of performance and its application in polyethylene degradation. Appl. Catal. B Environ. 2021, 286, 119918. [Google Scholar] [CrossRef]
  29. Ariza-Tarazona, M.C.; Siligardi, C.; Carreón-López, H.A.; Valdéz-Cerda, J.E.; Pozzi, P.; Kaushik, G.; Villarreal-Chiu, J.F.; Cedillo-González, E.I. Low environmental impact remediation of microplastics: Visible-light photocatalytic degradation of PET microplastics using bio-inspired C,N-TiO2/SiO2 photocatalysts. Mar. Pollut. Bull. 2023, 193, 115206. [Google Scholar] [CrossRef] [PubMed]
  30. Zhou, D.; Luo, H.; Zhang, F.; Wu, J.; Yang, J.; Wang, H. Efficient Photocatalytic Degradation of the Persistent PET Fiber-Based Microplastics over Pt Nanoparticles Decorated N-Doped TiO2 Nanoflowers. Adv. Fiber Mater. 2022, 4, 1094–1107. [Google Scholar] [CrossRef]
  31. Chattopadhyay, P.; Ariza-Tarazona, M.C.; Cedillo-González, E.I.; Siligardi, C.; Simmchen, J. Combining photocatalytic collection and degradation of microplastics using self-asymmetric Pac-Man TiO2. Nanoscale 2023, 15, 14774–14781. [Google Scholar] [CrossRef]
  32. Amato, P.; Fantauzzi, M.; Sannino, F.; Ritacco, I.; Santoriello, G.; Camellone, M.F.; Imparato, C.; Bifulco, A.; Vitiello, G.; Caporaso, L.; et al. Indirect daylight oxidative degradation of polyethylene microplastics by a bio-waste modified TiO2-based material. J. Hazard. Mater. 2024, 463, 132907. [Google Scholar] [CrossRef]
  33. Buonomenna, M.G.; Figoli, A.; Spezzano, I.; Davoli, M.; Drioli, E. New PVDF microcapsules for application in catalysis. Appl. Catal. B Environ. 2008, 80, 185–194. [Google Scholar] [CrossRef]
  34. Amarsanaa, B.; Park, J.Y. Effect of water backwashing and PP beads in hybrid water treatment of multi-channel alumina MF and photocatalyst-coated PP beads. Desalin. Water Treat. 2015, 54, 1457–1469. [Google Scholar] [CrossRef]
  35. Park, S.; Kim, D.; Park, J.Y. The role of adsorption, photo-oxidation, and PP spheres with air backwashing in hybrid water treatment of multichannel alumina MF and PP spheres. Membranes 2020, 10, 28. [Google Scholar] [CrossRef] [PubMed]
Scheme 1. PES microspheres mounted with TiO2 photocatalyst.
Membranes 14 00169 sch001
Figure 1. Apparatus of advanced water treatment system using hybrid module of tubular ceramic MF (NCMT-7231) and TiO2-mounted PES spheres with periodic air backwashing.
Membranes 14 00169 g001
Scheme 2. Advanced water treatment system using a hybrid module of tubular ceramic MF (NCMT-7231) and TiO2-mounted PES spheres with periodic air backwashing; (a) control board (b) membrane module and UV lamps in the hybrid water treatment system.
Membranes 14 00169 sch002
Figure 2. Calibration curve: (a) turbidity vs. MPs; (b) UV254 absorption vs. HA concentration.
Membranes 14 00169 g002
Figure 3. Impact of humic acid concentration on filtration resistances for the process of tubular ceramic MF (NCMT-7231) with air backwashing in a bar graph.
Membranes 14 00169 g003
Figure 4. Impact of the humic acid concentration: (a) the final resistance of membrane fouling; (b) total filtration volume.
Membranes 14 00169 g004
Scheme 3. SEM (Scanning Electron Microscope) pictures of the alumina membrane surface: (a) Outside surface membrane (×5000 and ×20,000); (b) Inside surface membrane (×5000 and ×20,000).
Membranes 14 00169 sch003aMembranes 14 00169 sch003b
Figure 5. Impact of the humic acid concentration on treatment efficiency: (a) turbidity (MPs); (b) UV254 absorbance (DOM).
Membranes 14 00169 g005
Figure 6. Impact of microplastic concentration on filtration resistances for the process of tubular ceramic MF with air backwashing.
Membranes 14 00169 g006
Figure 7. Impact of microplastic concentration: (a) final resistance of membrane fouling; (b) total filtration volume.
Membranes 14 00169 g007
Figure 8. Impact of the microplastic concentration on treatment efficiency: (a) turbidity (MPs); (b) UV254 absorbance (DOM).
Membranes 14 00169 g008
Figure 9. Roles of MF, adsorption, and photooxidation on filtration resistances in the hybrid process of tubular ceramic MF and TiO2-mounted PES spheres at PE (MPs) 2 mg/L and HA 20 mg/L.
Membranes 14 00169 g009
Figure 10. Roles of MF, adsorption, and photooxidation on resistance of membrane fouling in the hybrid process of tubular ceramic MF and TiO2-mounted PES spheres at PE (MPs) 2 mg/L and HA 20 mg/L.
Membranes 14 00169 g010
Figure 11. Roles of MF, adsorption, and photooxidation on dimensionless permeate flux in the hybrid process of tubular ceramic MF and TiO2-mounted PES spheres at PE (MPs) 2 mg/L and HA 20 mg/L.
Membranes 14 00169 g011
Figure 12. Impact of air filtration time (FT) on filtration resistances for hybrid process of tubular ceramic MF and TiO2-mounted PES spheres.
Membranes 14 00169 g012
Figure 13. Impact of air backwashing cycle (FT) on resistance of membrane fouling in the hybrid process of tubular ceramic MF and TiO2-mounted PES spheres.
Membranes 14 00169 g013
Figure 14. Impact of air backwashing cycle (FT) on dimensionless permeate flux in the hybrid process of tubular ceramic MF and TiO2-mounted PES spheres.
Membranes 14 00169 g014
Figure 15. Impact of air backwashing cycle (FT) on permeate flux in the hybrid process of tubular ceramic MF and TiO2-mounted PES spheres.
Membranes 14 00169 g015
Figure 16. Impact of air backwashing cycle (FT) on treatment efficiency of turbidity and UV254 absorbance in the hybrid process of tubular ceramic MF and TiO2-mounted PES spheres.
Membranes 14 00169 g016
Table 1. Characteristics of the tubular ceramic MF membrane utilized in this study.
Membrane ModelNCMT-7231
Pore size (μm)0.1
No. of channels1
Outer diameter (mm)8
Inner diameter (mm)6
Length (mm)270
Surface area (cm2)50.9
Materialα-alumina
CompanyNano Pore Materials (Seoul, Korea)
Table 2. Effect of humic acid concentration on average filtration factors for the process of tubular ceramic MF (NCMT-7231) with air backwashing.
HA (mg/L)10152025
Rm × 10−9 (kg/m2s)0.4790.6670.5790.624
Rb × 10−9 (kg/m2s)0.0210.0800.0460.217
Rf,180 × 10−9 (kg/m2s)0.1390.3880.4220.465
Rif × 10−9 (kg/m2s)0.2470.0320.1080.154
Rrf × 10−9 (kg/m2s)0.1230.3560.3340.311
J0 (L/m2h)145163183146
J180 (L/m2h)247213175189
J180/J00.5890.7540.7390.772
Vt (L)2.852.542.242.10
Table 3. Impact of microplastic concentration on average filtration factors for the process of tubular ceramic MF with air backwashing.
HA (mg/L)20
MP (mg/L)0.512515
Rm × 10−9 (kg/m2s)0.6190.5790.5850.6320.594
Rb × 10−9 (kg/m2s)0.0320.0460.1170.1490.098
Rf,180 × 10−9 (kg/m2s)0.3410.2740.3590.4920.315
Rif × 10−9 (kg/m2s)0.1530.1630.0130.0460.032
Rrf × 10−9 (kg/m2s)0.1880.1110.3470.4460.283
J0 (L/m2h)165186168142178
J180 (L/m2h)244256226203230
J180/J00.6780.7320.7430.6970.768
Vt (L)2.24 2.86 2.38 2.19 2.53
Table 4. Roles of MF, adsorption, and photooxidation on average filtration factors in the hybrid process of tubular ceramic MF and TiO2-mounted PES spheres at PE (MPs) 2 mg/L and HA 20 mg/L.
ProcessMFMF+UVMF+PESMF+UV+PES
Rm × 10−9 (kg/m2s)0.5830.5240.5300.532
Rb × 10−9 (kg/m2s)0.0250.0100.0130.013
Rf,180 × 10−9 (kg/m2s)0.3930.2770.2610.242
Rif × 10−9 (kg/m2s)0.0350.0450.0080.015
Rrf × 10−9 (kg/m2s)0.3580.2320.2530.227
J180 (L/m2h)1072119011711165
J0 (L/m2h)676817810811
J180/J00.6240.6850.6910.697
VT (L)11.613.813.713.5
Table 5. Water quality and treatment efficiency of turbidity (MPs) in the hybrid process of tubular ceramic MF and TiO2-mounted PES spheres for roles of microfiltration, adsorption, and photooxidation.
Experimental ConditionTurbidity (NTU)Average Treatment
Efficiency
(%)
HA
(mg/L)
ProcessFeed WaterTreated Water
RangeAverageRangeAverage
20MF+PES+UV15.0–18.616.81.130–1.3301.22592.5
MF+PES13.2–14.713.90.880–1.3501.05192.5
MF+UV8.1–16.013.51.130–1.2701.18090.7
MF11.3–13.913.01.120–1.5801.25590.2
Table 6. Water quality and treatment efficiency of UV254 absorbance (HA) in the hybrid process of tubular ceramic MF and TiO2-mounted PES spheres for roles of microfiltration, adsorption, and photooxidation.
Experimental ConditionUV254 Absorbance (cm−1)Average Treatment
Efficiency
(%)
HA
(mg/L)
ProcessFeed WaterTreated Water
RangeAverageRangeAverage
20MF+PES+UV0.023–0.0450.0340.001–0.0100.00779.7
MF+PES0.023–0.0450.0330.017–0.0270.02332.8
MF+UV0.020–0.0370.0250.013–0.0180.01632.6
MF0.025–0.0490.0340.016–0.0270.02329.1
Table 7. A fraction of treatment efficiencies of MF, adsorption, and photooxidation in the hybrid process of tubular ceramic MF and TiO2-mounted PES spheres.
Fraction of Treatment EfficiencyMPs (Turbidity) HA (UV254 Absorbance)
Membrane filtration (%) (MF)90.229.1
Adsorption (%) (MF+PES)-(MF)2.33.7
UV photooxidation (%) (MF+UV)-(MF)0.53.5
Photooxidation with PES beads (%)
(MF+PES+UV)-(MF+PES)
046.9
Total treatment efficiency (%)
(MF+PES+UV)
92.579.7
Table 8. Impact of air filtration time (FT) on average filtration factors for hybrid process of tubular ceramic MF and TiO2-mounted PES spheres (BT 10 s).
FT (min)NBF30201086
Rm × 10−9 (kg/m2s)0.5650.5620.5630.5560.5620.568
Rb × 10−9 (kg/m2s)0.0410.0860.0620.0250.0480.042
Rf,180 × 10−9 (kg/m2s)0.7640.6060.4510.4700.4830.677
Rif × 10−9 (kg/m2s)0.0430.0860.0520.0890.0650.077
Rrf × 10−9 (kg/m2s)0.7210.5200.4190.3810.4270.600
J0 (L/m2h)10499851018109510461043
J180 (L/m2h)467594650647649570
J180/J00.4450.5900.6360.5880.6120.540
Vt (L)9.9610.8811.3711.5111.2310.32
Disclaimer/Publisher’s Note: The statements, opinions and data contained in all publications are solely those of the individual author(s) and contributor(s) and not of MDPI and/or the editor(s). MDPI and/or the editor(s) disclaim responsibility for any injury to people or property resulting from any ideas, methods, instructions or products referred to in the content.

