The Biphasic Effect of Lipopolysaccharide on Membrane Potential


Abstract
1. Introduction
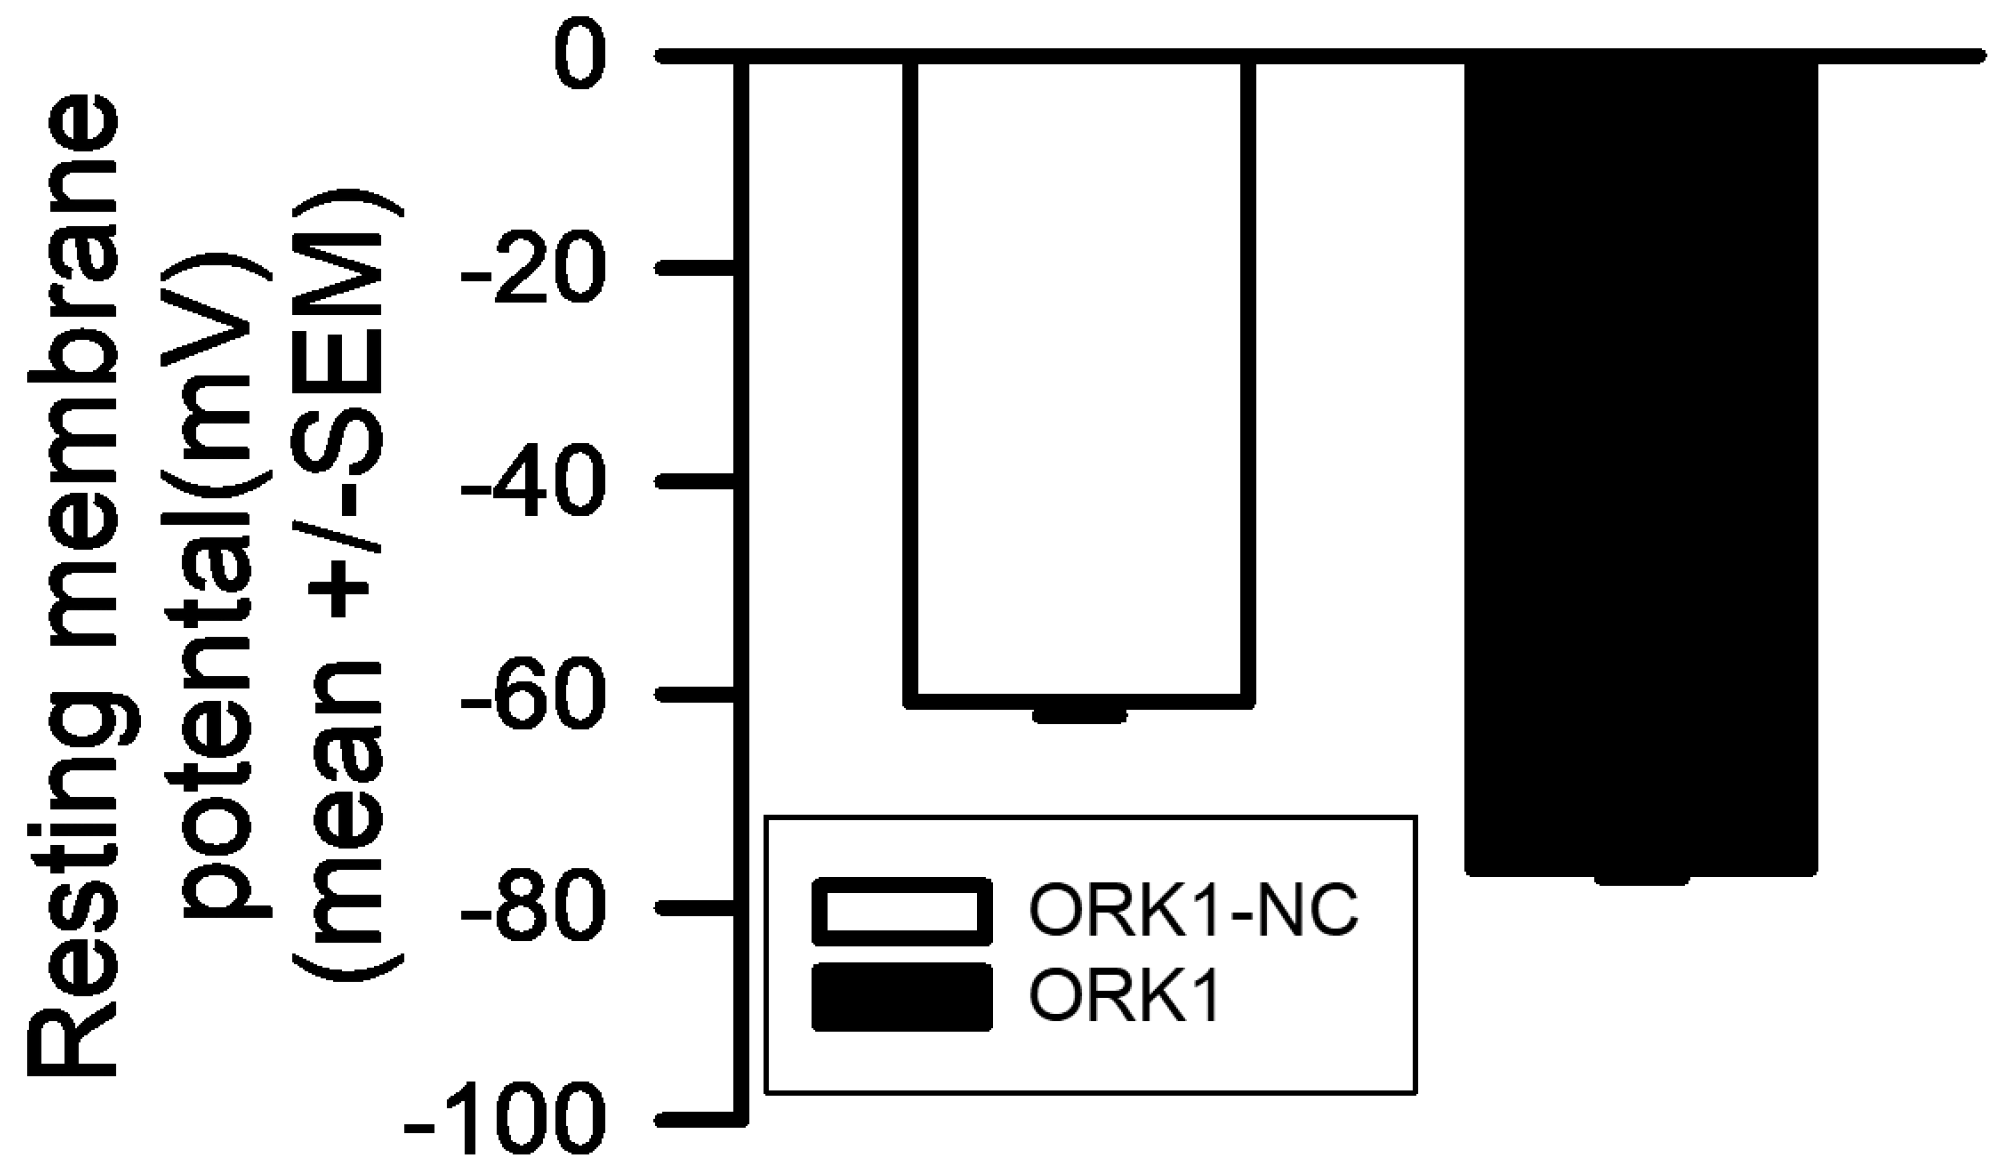
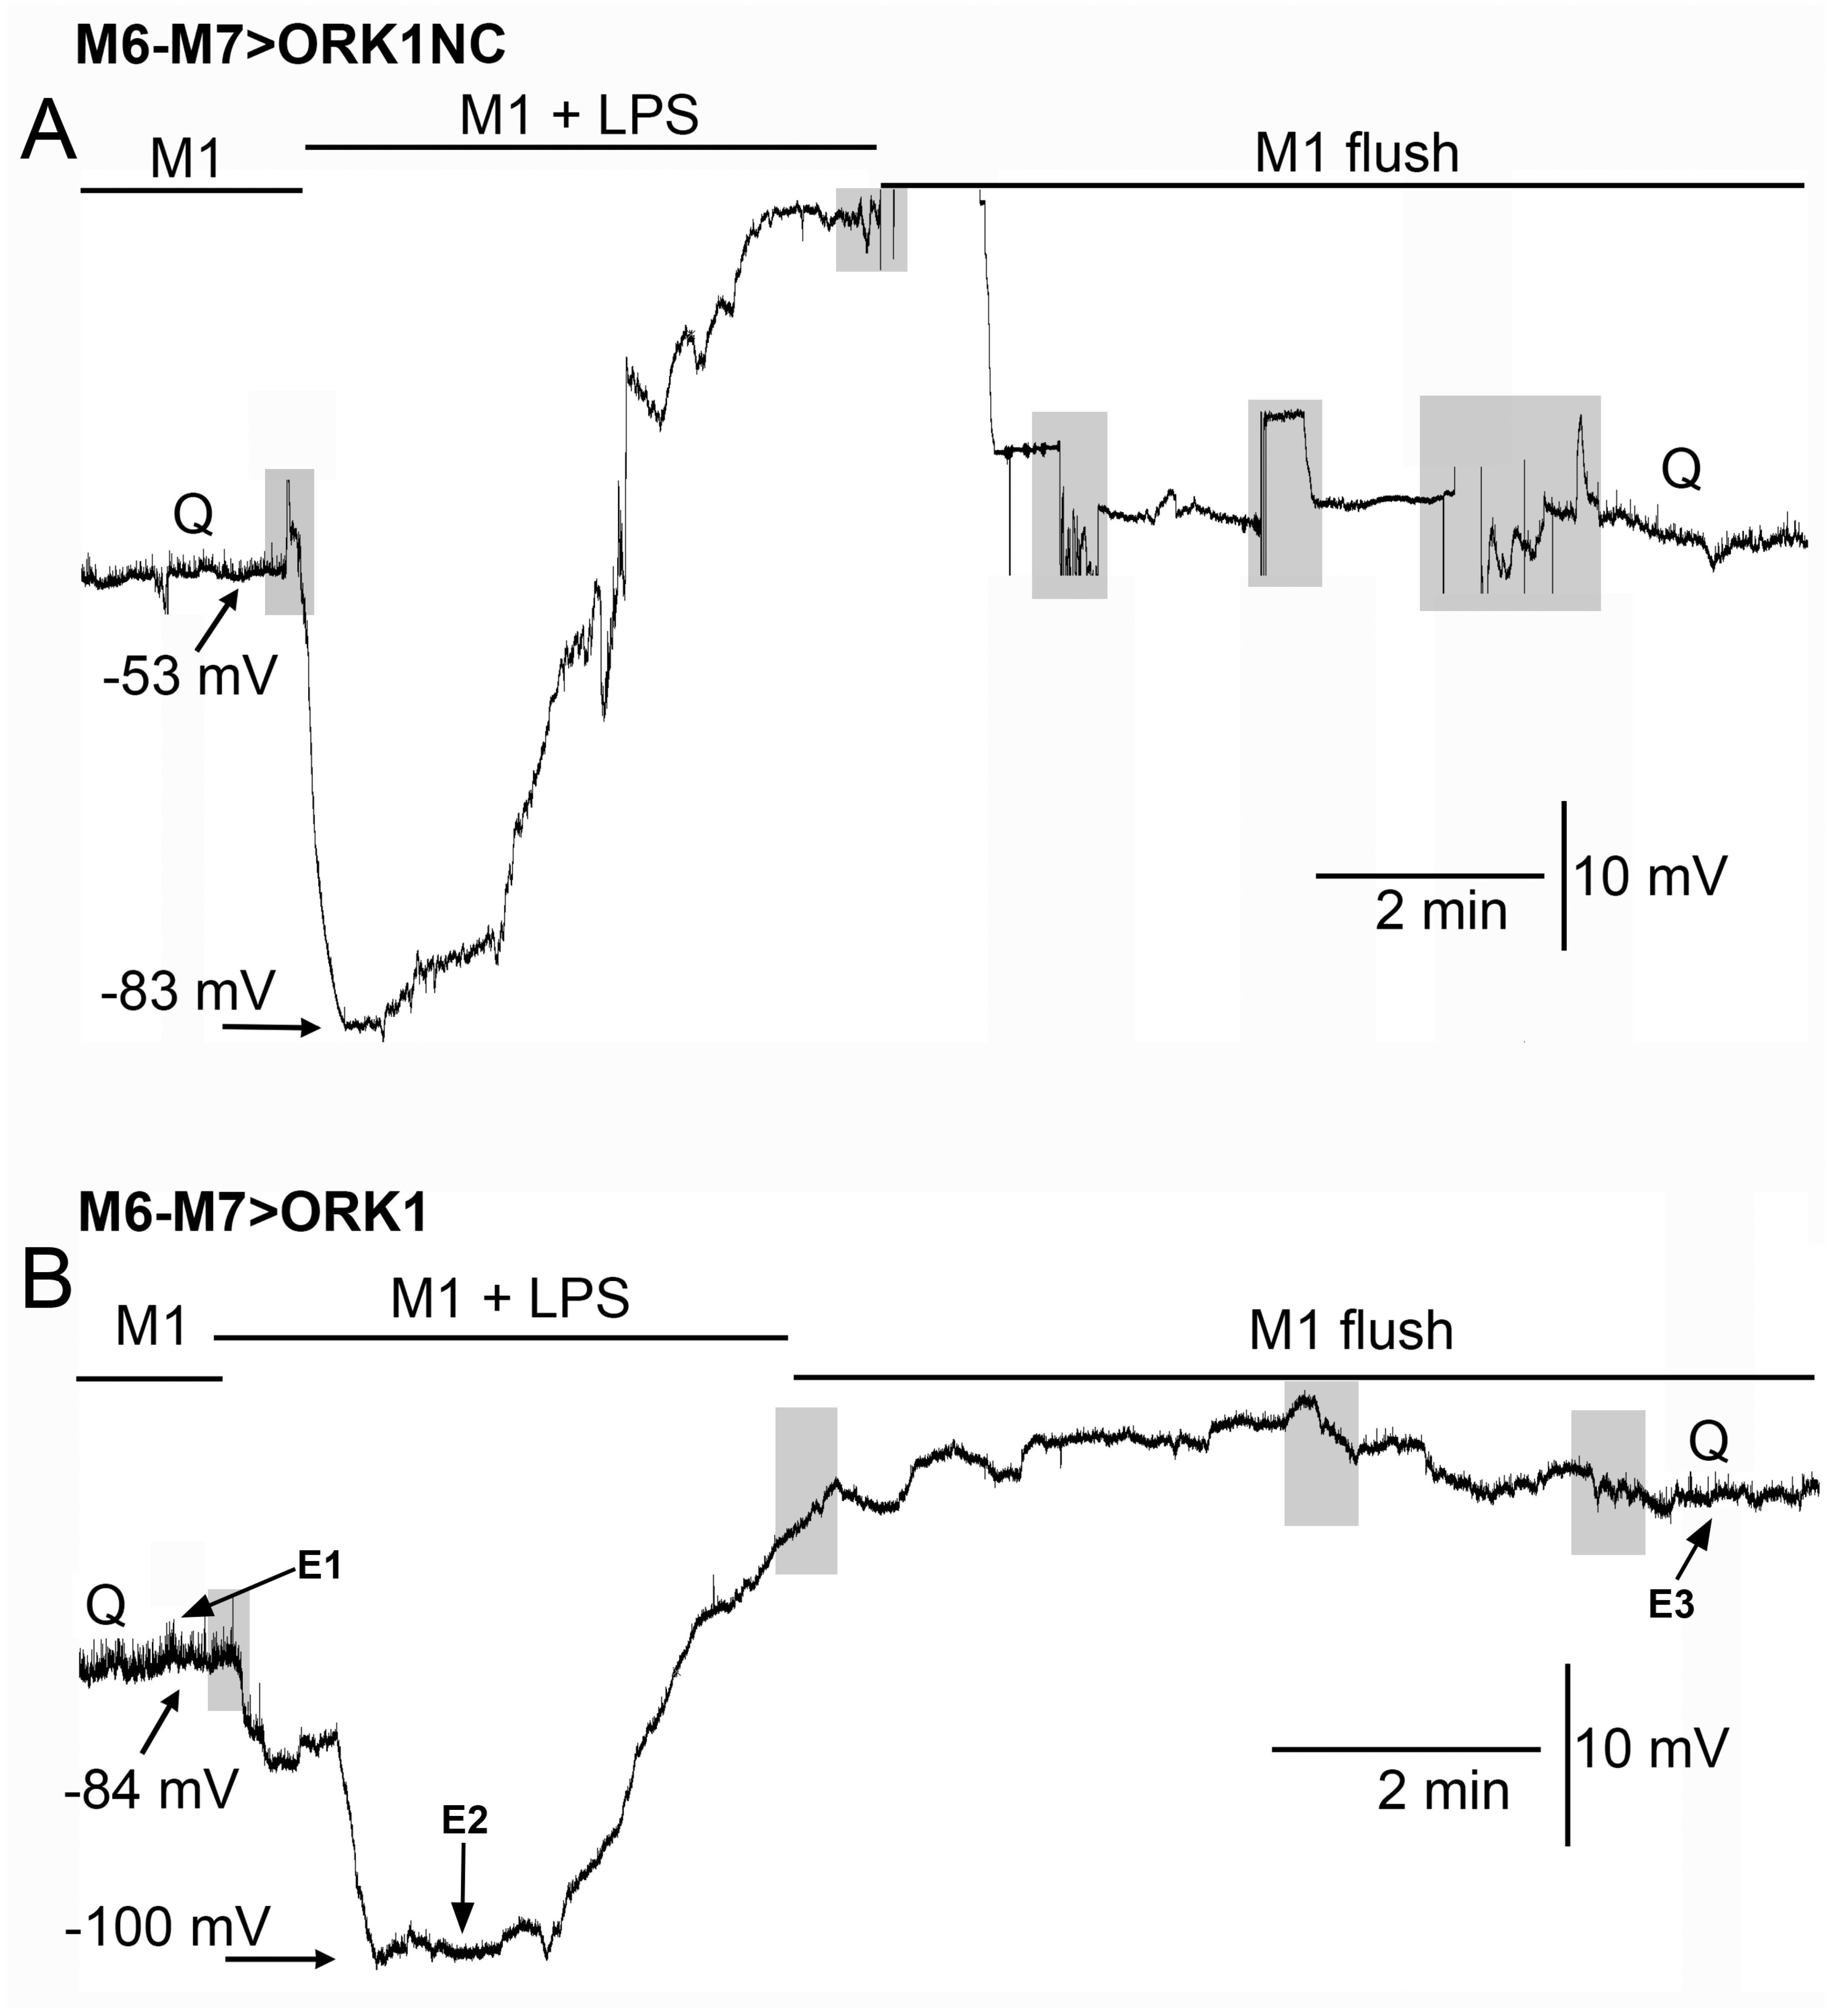
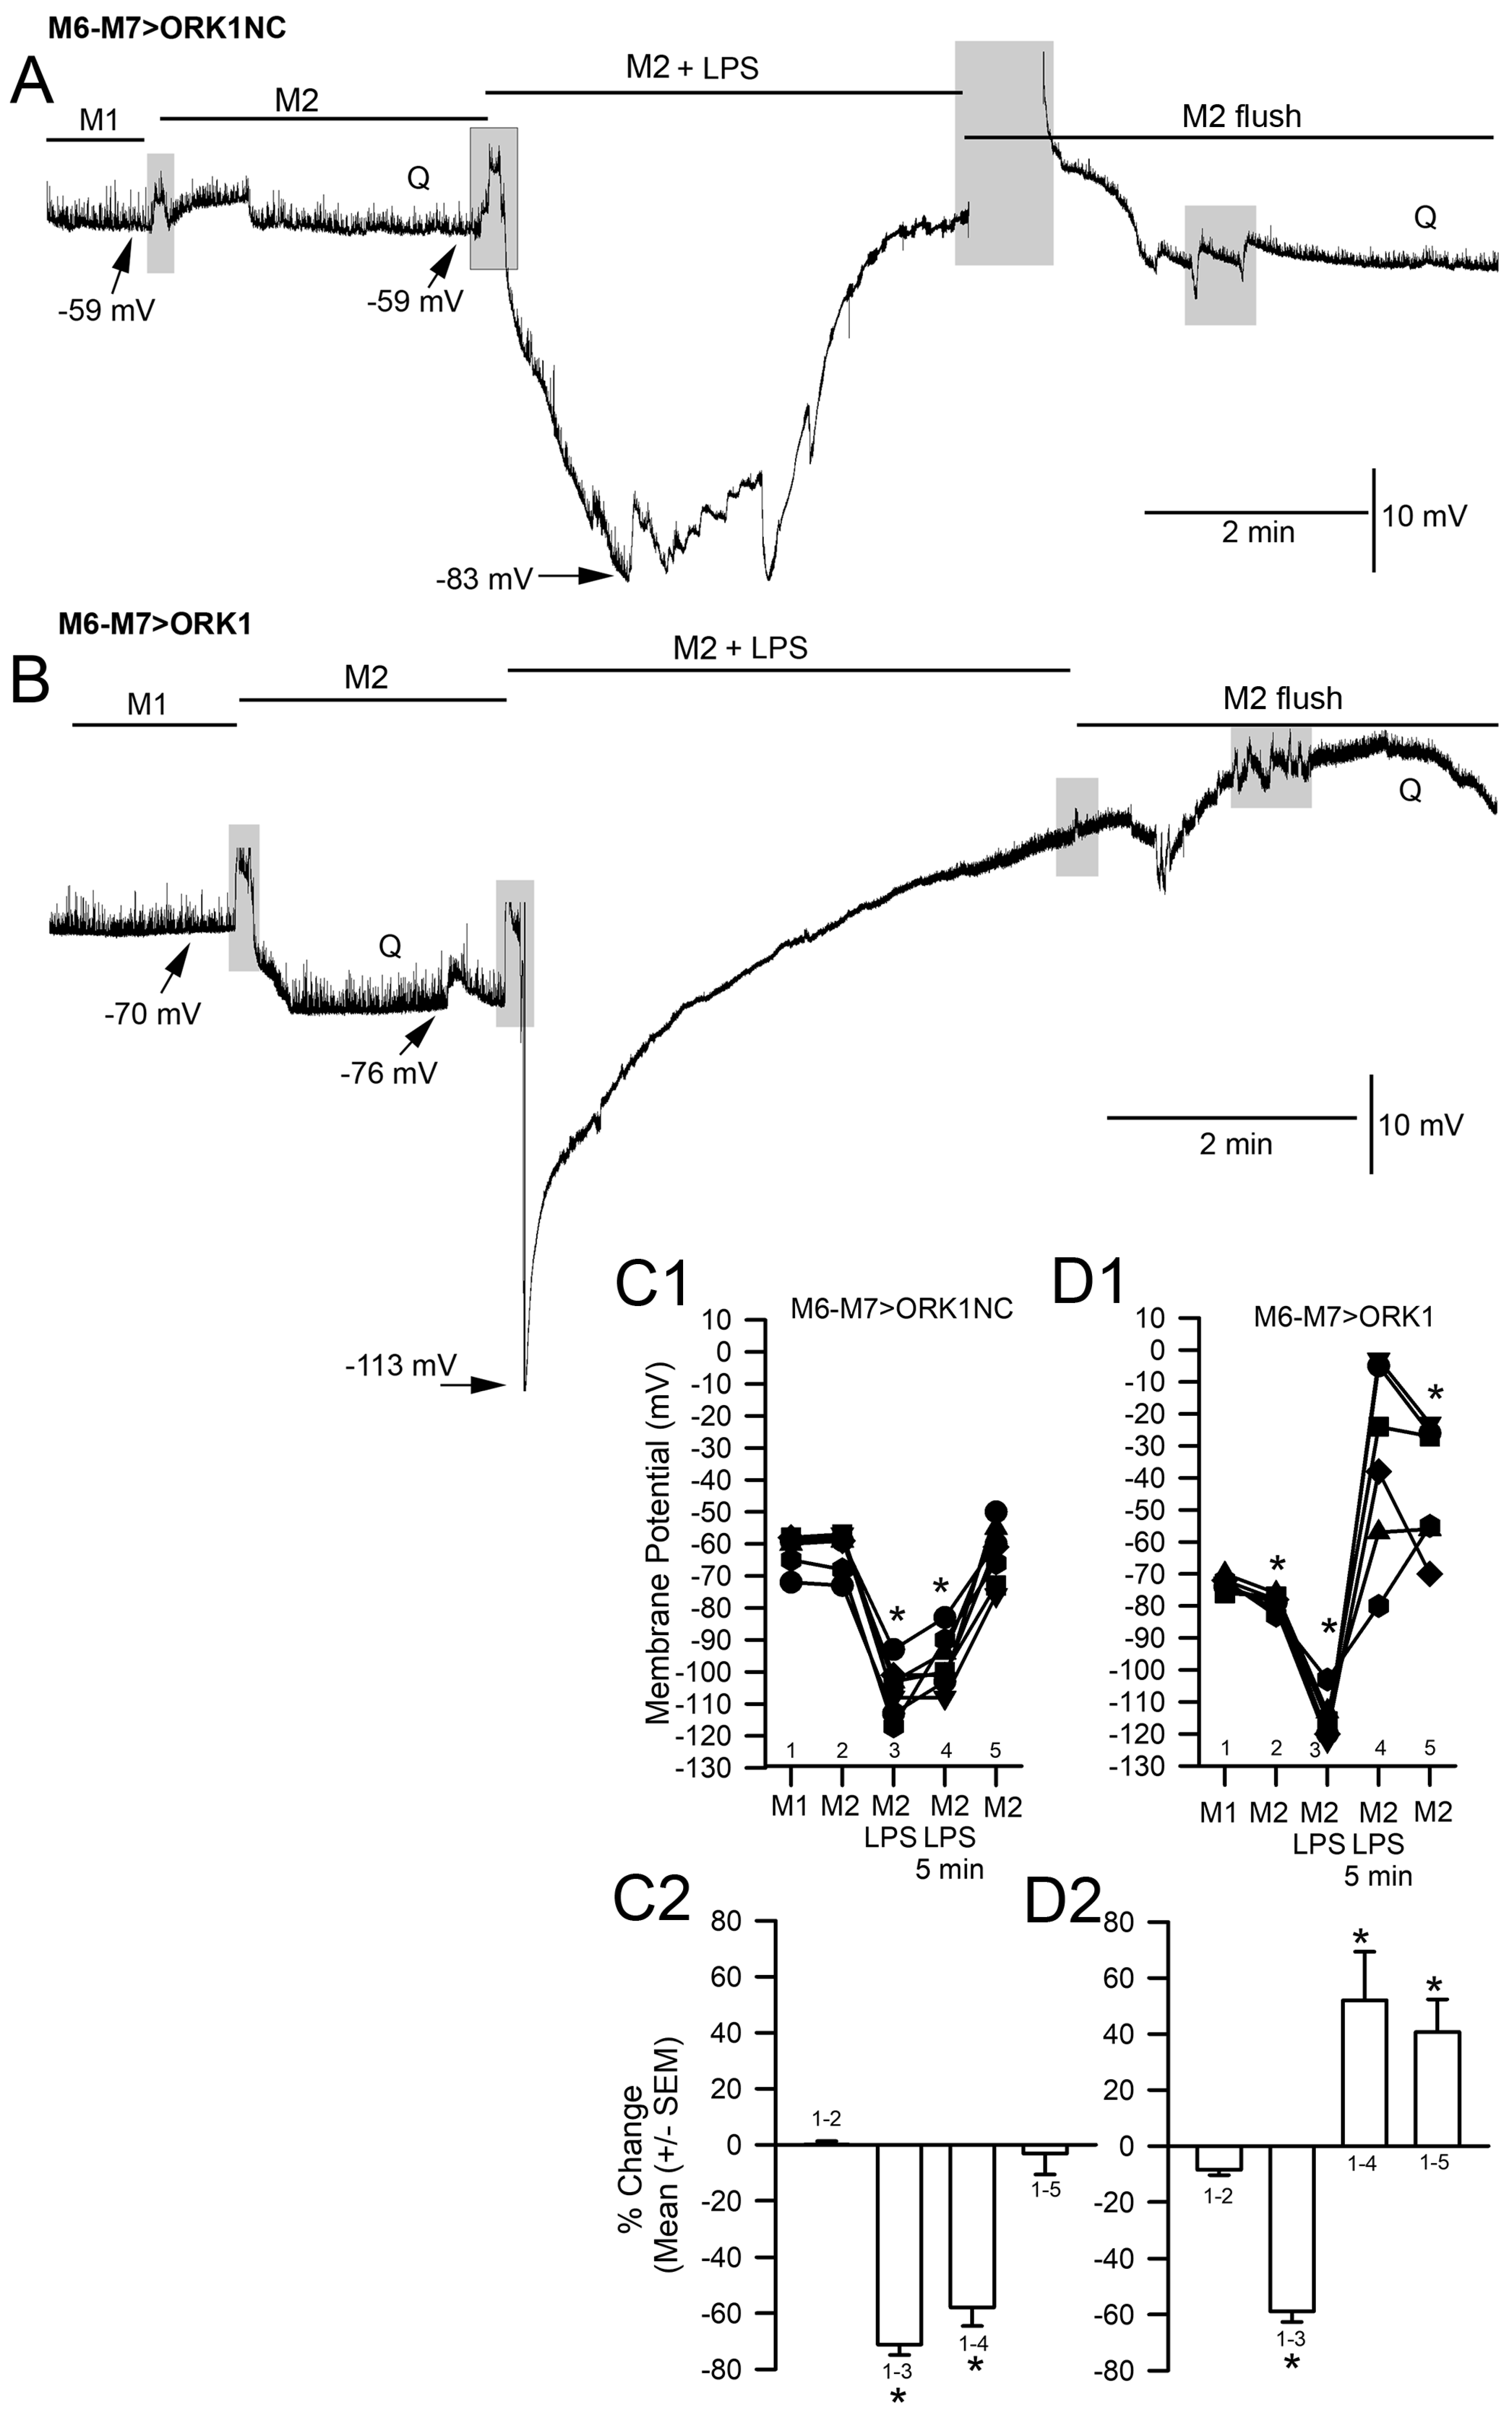
2. Results
3. Discussion
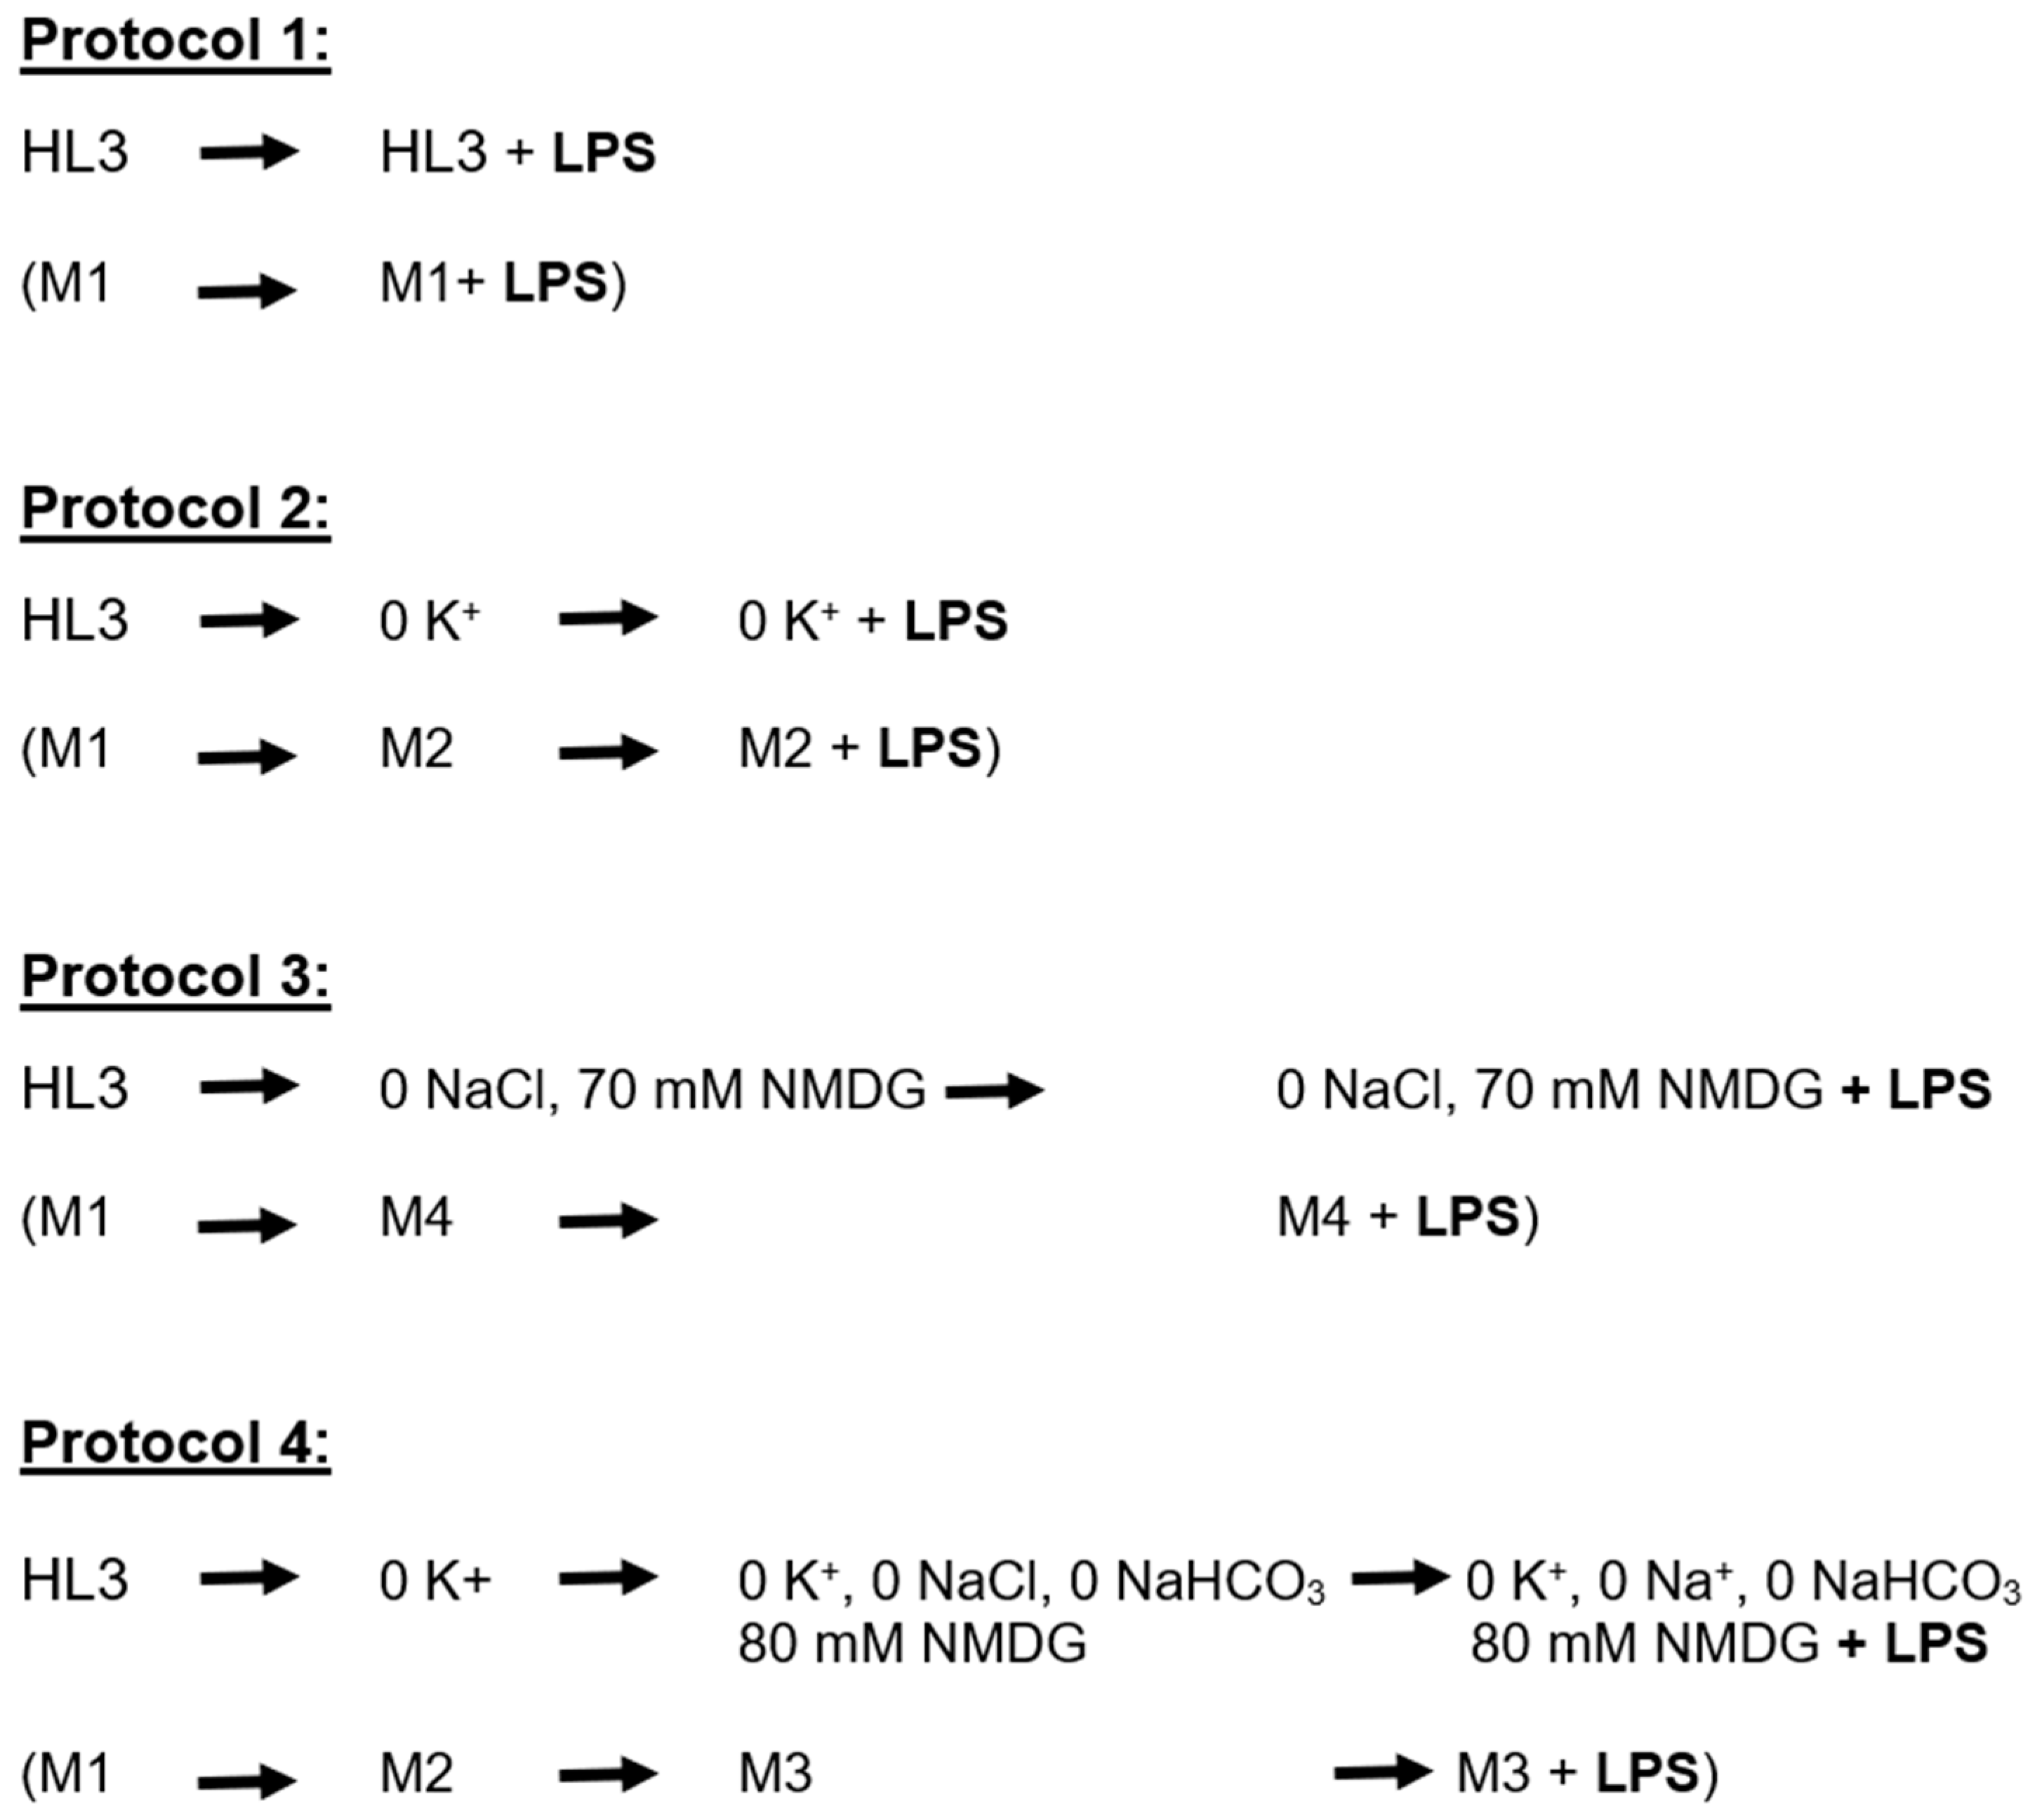
4. Materials and Methods
Author Contributions
Funding
Institutional Review Board Statement
Data Availability Statement
Acknowledgments
Conflicts of Interest
References
- Rhee, C.; Dantes, R.; Epstein, L.; Murphy, D.J.; Seymour, C.W.; Iwashyna, T.J.; Kadri, S.S.; Angus, D.C.; Danner, R.L.; Fiore, A.E.; et al. Incidence and trends of sepsis in us hospitals using clinical vs. claims data, 2009–2014. JAMA 2017, 318, 1241–1249. [Google Scholar] [CrossRef]
- Kim, S.B.; Jeon, Y.D.; Kim, J.H.; Kim, J.K.; Ann, H.W.; Choi, H.; Kim, M.H.; Song, J.E.; Ahn, J.Y.; Jeong, S.J.; et al. Risk factors for mortality in patients with Serratia marcescens Bacteremia. Yonsei Med. J. 2015, 56, 348–354. [Google Scholar] [CrossRef] [PubMed]
- Osborn, M.J.; Rosen, S.M.; Rothfield, L.; Zeleznick, L.D.; Horecker, B.L. Lipopolysaccharide of the Gram-negative cell wall. Science 1964, 145, 783–789. [Google Scholar] [CrossRef] [PubMed]
- Linhartová, I.; Bumba, L.; Mašín, J.; Basler, M.; Osicka, R.; Kamanova, J.; Procházková, K.; Adkins, I.; Hejnová-Holubová, J.; Sadílková, L.; et al. RTX proteins: A highly diverse family secreted by a common mechanism. FEMS Microbiol. Rev. 2010, 34, 1076–1112. [Google Scholar] [CrossRef] [PubMed]
- Eidelman, L.; Putterman, D.; Putterman, C.; Sprung, C. The spectrum of septic encephalopathy definitions, etiologies, and mortalities. JAMA 1996, 275, 470–473. [Google Scholar] [CrossRef] [PubMed]
- Wilson, J.X.; Young, G.B. Progress in clinical neurosciences: Sepsis-associated encephalopathy: Evolving concepts. Can. J. Neurol. Sci. 2003, 30, 98–105. [Google Scholar] [CrossRef] [PubMed]
- Friedrich, O.; Reid, M.B.; Berghe, G.V.D.; Vanhorebeek, I.; Hermans, G.; Rich, M.M.; Larsson, L. The sick and the weak: Neuropathies/Myopathies in the critically ill. Physiol. Rev. 2015, 95, 1025–1109. [Google Scholar] [CrossRef] [PubMed]
- Tong, D.-M.; Zhou, Y.-T. No awakening in supratentorial intracerebral hemorrhage is potentially caused by sepsis-associated encephalopathy. Med. Sci. Monit. 2017, 23, 4408–4414. [Google Scholar] [CrossRef]
- Costamagna, D.; Costelli, P.; Sampaolesi, M.; Penna, F. Role of inflammation in muscle homeostasis and myogenesis. Mediat. Inflamm. 2015, 2015, 805172. [Google Scholar] [CrossRef] [PubMed]
- Cohen, J. The immunopathogenesis of sepsis. Nature 2002, 420, 885–891. [Google Scholar] [CrossRef] [PubMed]
- Park, B.S.; Lee, J.-O. Recognition of lipopolysaccharide pattern by TLR4 complexes. Exp. Mol. Med. 2013, 45, e66. [Google Scholar] [CrossRef] [PubMed]
- Fomichova, O.; Oliveira, P.F.; Bernardino, R.L. Exploring the interplay between inflammation and male fertility. FEBS J. 2024. [Google Scholar] [CrossRef]
- Manoj, H.; Gomes, S.M.; Thimmappa, P.Y.; Nagareddy, P.R.; Jamora, C.; Joshi, M.B. Cytokine signalling in formation of neutrophil extracellular traps: Implications for health and diseases. Cytokine Growth Factor. Rev. 2024; online ahead of print. [Google Scholar] [CrossRef] [PubMed]
- Miyake, K. Innate recognition of lipopolysaccharide by CD14 and toll-like receptor 4-MD-2: Unique roles for MD-2. Int. Immunopharmacol. 2002, 3, 119–128. [Google Scholar] [CrossRef] [PubMed]
- Rocha, D.M.; Caldas, A.P.; Oliveira, L.L.; Bressan, J.; Hermsdorff, H.H. Saturated fatty acids trigger TLR4-mediated inflammatory response. Atherosclerosis 2016, 244, 211–215. [Google Scholar] [CrossRef]
- Skirecki, T.; Cavaillon, J.-M. Inner sensors of endotoxin—Implications for sepsis research and therapy. FEMS Microbiol. Rev. 2019, 43, 239–256. [Google Scholar] [CrossRef] [PubMed]
- Weiss, H.J.; O’neill, L.A.J. Of Flies and Men—The Discovery of TLRs. Cells 2022, 11, 3127. [Google Scholar] [CrossRef]
- Verheyen, E.M. The power of Drosophila in modeling human disease mechanisms. Dis. Model. Mech. 2022, 15, dmm049549. [Google Scholar] [CrossRef] [PubMed]
- Cotterill, S.; Yamaguchi, M. Role of Drosophila in human disease research 3.0. Int. J. Mol. Sci. 2023, 25, 292. [Google Scholar] [CrossRef] [PubMed]
- Cooper, R.L.; Krall, R.M. Hyperpolarization Induced by Lipopolysaccharides but not by chloroform is inhibited by doxapram, an inhibitor of two-p-domain k+ channel (K2P). Int. J. Mol. Sci. 2022, 23, 15787. [Google Scholar] [CrossRef] [PubMed]
- Titlow, J.S.; Cooper, R.L. Glutamatergic synthesis, recycling, and receptor pharmacology at Drosophila and crustacean neuromuscular junctions. In Biochemical Approaches for Glutamatergic Neurotransmission; Humana Press: Totowa, NJ, USA, 2018; Volume 130, pp. 263–291. [Google Scholar] [CrossRef]
- Ballinger, C.; Anyagaligb, O.; Bernard, J.; Bierbower, S.M.; Dupont-Ver, E.E.; Ghoweri, A.; Greenhalgh, A.; Harrison, D.; Istas, O.; McNabb, M.; et al. Effects of bacterial endotoxin (LPS) on cardiac and synaptic function in various animal models: Larval Drosophila, crayfish, crab and rodent. Int. J. Zool. Res. 2019, 16, 33–62. [Google Scholar] [CrossRef]
- Elliott, E.R.; Brock, K.E.; Vacassenno, R.M.; Harrison, D.A.; Cooper, R.L. The effects of doxapram and its potential interactions with K2P channels in experimental model preparations. J. Comp. Physiol. A 2024, 210, 869–884. [Google Scholar] [CrossRef] [PubMed]
- Vacassenno, R.M.; Haddad, C.N.; Cooper, R.L. Bacterial lipopolysaccharide hyperpolarizes the membrane potential and is antagonized by the K2p channel blocker doxapram. Comp. Biochem. Physiol. C 2023, 266, 109571. [Google Scholar] [CrossRef]
- Cotten, J.F. TASK-1 (KCNK3) and TASK-3 (KCNK9) Tandem pore potassium channel antagonists stimulate breathing in isoflurane-anesthetized rats. Anesth. Analg. 2013, 116, 810–816. [Google Scholar] [CrossRef]
- Komatsu, R.; Sengupta, P.; Cherynak, G.; Wadhwa, A.; Sessler, D.I.; Liu, J.; Hurst, H.E.; Lenhardt, R. Doxapram Only Slightly Reduces the shivering threshold in healthy volunteers. Anesth. Analg. 2005, 101, 1368–1373. [Google Scholar] [CrossRef] [PubMed]
- Yost, C.S. A new look at the respiratory stimulant doxapram. CNS Drug Rev. 2006, 12, 236–249. [Google Scholar] [CrossRef]
- Song, S.S.; Lyden, P.D. Overview of therapeutic hypothermia. Curr. Treat. Options Neurol. 2012, 14, 541–548. [Google Scholar] [CrossRef]
- Elliott, E.R.; Cooper, R.L. Fluoxetine antagonizes the acute response of LPS: Blocks K2P channels. Comp. Biochem. Physiol. C 2025, 287, 110045. [Google Scholar] [CrossRef]
- Schreiber, J.A.; Düfer, M.; Seebohm, G. The special one: Architecture, physiology and pharmacology of the TRESK channel. Cell. Physiol. Biochem. 2022, 56, 663–684. [Google Scholar] [CrossRef] [PubMed]
- Goldstein, S.A.N.; Price, L.A.; Rosenthal, D.N.; Pausch, M.H. ORK1, a potassium-selective leak channel with two pore domains cloned from Drosophila melanogaster by expression in Saccharomyces cerevisiae. Proc. Natl. Acad. Sci. USA 1996, 93, 13256–13261. [Google Scholar] [CrossRef]
- Goldstein, S.A.N.; Wang, K.-W.; Ilan, N.; Pausch, M.H. Sequence and function of the two P domain potassium channels: Implications of an emerging superfamily. J. Mol. Med. 1998, 76, 13–20. [Google Scholar] [CrossRef] [PubMed]
- Lee, L.-M.; Müntefering, T.; Budde, T.; Meuth, S.G.; Ruck, T. Pathophysiological role of K2P Channels in human diseases. Cell. Physiol. Biochem. 2021, 55, 65–86. [Google Scholar] [CrossRef]
- Plant, L.D.; Goldstein, S.A.N. Two-pore domain potassium channels. In Handbook of Ion Channels, 1st ed.; Zheng, J., Trudeau, M.C., Eds.; CRC Press: Boca Raton, FL, USA, 2015; pp. 261–274. ISBN 9780429193965. [Google Scholar]
- Enyedi, P.; Braun, G.; Czirják, G. TRESK: The lone ranger of two-pore domain potassium channels. Mol. Cell. Endocrinol. 2012, 353, 75–81. [Google Scholar] [CrossRef]
- Kamuene, J.M.; Xu, Y.; Plant, L.D. The pharmacology of two-pore domain potassium channels. Handb. Exp. Pharmacol. 2021, 267, 417–443. [Google Scholar] [CrossRef]
- Adams, M.D.; Celniker, S.E.; Holt, R.A.; Evans, C.A.; Gocayne, J.D.; Amanatides, P.G.; Scherer, S.E.; Li, P.W.; Hoskins, R.A.; Galle, R.F.; et al. The genome sequence of Drosophila melanogaster. Science 2000, 287, 2185–2195. [Google Scholar] [CrossRef]
- Littleton, J.; Ganetzky, B. Ion channels and synaptic organization: Analysis of the Drosophila genome. Neuron 2000, 26, 35–43. [Google Scholar] [CrossRef]
- Ikeda, K.; Ozawa, S.; Hagiwara, S. Synaptic transmission reversibly conditioned by single-gene mutation in Drosophila melanogaster. Nature 1976, 259, 489–491. [Google Scholar] [CrossRef]
- Salkoff, L.B.; Wyman, R.J. Ion currents in Drosophila flight muscles. J. Physiol. 1983, 337, 687–709. [Google Scholar] [CrossRef]
- McCubbin, S.; Meade, A.; Harrison, D.A.; Cooper, R.L. Acute lipopolysaccharide (LPS)-induced cell membrane hyperpolarization is independent of voltage gated and calcium activated potassium channels. Comp. Biochem. Physiol. C 2024, 285, 110004. [Google Scholar] [CrossRef] [PubMed]
- Istas, O.; Greenhalgh, A.; Cooper, R.L. Repetitive exposure to bacterial endotoxin LPS alters synaptic transmission. J. Pharmacol. Toxicol. 2020, 15, 65–72. [Google Scholar] [CrossRef]
- Suzuki, N.; Kano, M. Development of action potential in larval muscle fibers in Drosophila melanogaster. J. Cell. Physiol. 1977, 93, 383–388. [Google Scholar] [CrossRef] [PubMed]
- Wu, C.; Haugland, F. Voltage clamp analysis of membrane currents in larval muscle fibers of Drosophila: Alteration of potassium currents in Shaker mutants. J. Neurosci. 1985, 5, 2626–2640. [Google Scholar] [CrossRef]
- Potter, R.; Meade, A.; Potter, S.; Cooper, R.L. Rapid and direct action of lipopolysaccharide (LPS) on skeletal muscle of larval Drosophila. Biology 2021, 10, 1235. [Google Scholar] [CrossRef] [PubMed]
- Cooper, R.L.; McNabb, M.; Nadolski, J. The effects of bacterial endotoxin LPS on synaptic transmission at the neuromuscular junction. Heliyon 2019, 5, e01430. [Google Scholar] [CrossRef] [PubMed]
- Vacassenno, R.M.; Haddad, C.N.; Cooper, R.L. The effects on resting membrane potential and synaptic transmission by Doxapram (blocker of K2P channels) at the Drosophila neuromuscular junction. Comp. Biochem. Physiol. C 2022, 263, 109497. [Google Scholar] [CrossRef] [PubMed]
- Schneider, I.; Blumenthal, A. Drosophila cell and tissue cultud. In Biology and Genetics of Drosophila; Ashburner, M., Wright, T.R.F., Eds.; Academic Press: New York, NY, USA, 1978; Volume 2B, pp. 266–315. [Google Scholar]
- Shields, G.; Sang, J. Improved medium for culture of Drosophila embryonic cells. Drosoph. Inf. Serv. 1977, 52, 161. [Google Scholar]
- Stewart, B.A.; Atwood, H.L.; Renger, J.J.; Wang, J.; Wu, C.-F. Improved stability of Drosophila larval neuromuscular preparations in haemolymph-like physiological solutions. J. Comp. Physiol. A 1994, 175, 179–191. [Google Scholar] [CrossRef] [PubMed]
- De Castro, C.; Titlow, J.; Majeed, Z.R.; Cooper, R.L. Analysis of various physiological salines for heart rate, CNS function, and synaptic transmission at neuromuscular junctions in Drosophila melanogaster larvae. J. Comp. Physiol. A 2014, 200, 83–92. [Google Scholar] [CrossRef] [PubMed]
- Ghezzi, A.; Liebeskind, B.J.; Thompson, A.; Atkinson, N.S.; Zakon, H.H. Ancient association between cation leak channels and Mid1 proteins is conserved in fungi and animals. Front. Mol. Neurosci. 2014, 7, 15. [Google Scholar] [CrossRef]
- Gilon, P.; Rorsman, P. NALCN: A regulated leak channel. Embo Rep. 2009, 10, 963–964. [Google Scholar] [CrossRef] [PubMed]
- Liebeskind, B.J.; Hillis, D.M.; Zakon, H.H. Phylogeny unites animal sodium leak channels with fungal calcium channels in an ancient, voltage-insensitive clade. Mol. Biol. Evol. 2012, 29, 3613–3616. [Google Scholar] [CrossRef] [PubMed]
- Lu, B.; Su, Y.; Das, S.; Liu, J.; Xia, J.; Ren, D. The neuronal channel NALCN contributes resting sodium permeability and is required for normal respiratory rhythm. Cell 2007, 129, 371–383. [Google Scholar] [CrossRef]
- Lu, B.; Zhang, Q.; Wang, H.; Wang, Y.; Nakayama, M.; Ren, D. Extracellular calcium controls background current and neuronal excitability via an UNC79-UNC80-NALCN cation channel complex. Neuron 2010, 68, 488–499. [Google Scholar] [CrossRef] [PubMed]
- Senatore, A.; Monteil, A.; van Minnen, J.; Smit, A.B.; Spafford, J.D. NALCN ion channels have alternative selectivity filters resembling calcium channels or sodium channels. PLoS ONE 2013, 8, e55088. [Google Scholar] [CrossRef]
- Paracini, N.; Schneck, E.; Imberty, A.; Micciulla, S. Lipopolysaccharides at Solid and Liquid Interfaces: Models for Biophysical Studies of the Gram-negative Bacterial Outer Membrane. Adv. Colloid. Interface Sci. 2022, 301, 102603. [Google Scholar] [CrossRef] [PubMed]
- Huang, C.; Zhang, J.; Liu, Z.; Xu, J.; Zhao, Y.; Zhang, P. In situ and label-free quantification of membrane protein–ligand interactions using optical imaging techniques: A review. Biosensors 2024, 14, 537. [Google Scholar] [CrossRef]
- Anselmo, S.; Bonaccorso, E.; Gangemi, C.; Sancataldo, G.; Nibali, V.C.; D’angelo, G. Lipid rafts in signalling, diseases, and infections: What can be learned from fluorescence techniques? Membranes 2025, 15, 6. [Google Scholar] [CrossRef]
- Crnković, A.; Srnko, M.; Anderluh, G. Biological nanopores: Engineering on demand. Life 2021, 11, 27. [Google Scholar] [CrossRef] [PubMed]
- Sarkar, P.; Chattopadhyay, A. Membrane dipole potential: An emerging approach to explore membrane organization and function. J. Phys. Chem. B 2022, 126, 4415–4430. [Google Scholar] [CrossRef] [PubMed]
- Nitabach, M.N.; Blau, J.; Holmes, T.C. Electrical silencing of Drosophila pacemaker neurons stops the free-running circadian clock. Cell 2002, 109, 485–495. [Google Scholar] [CrossRef] [PubMed]
- Budnik, V.; Koh, Y.-H.; Guan, B.; Hartmann, B.; Hough, C.; Woods, D.; Gorczyca, M. Regulation of synapse structure and function by the Drosophila tumor suppressor gene dlg. Neuron 1996, 17, 627–640. [Google Scholar] [CrossRef] [PubMed]
- Sulkowski, M.; Kim, Y.-J.; Serpe, M. Postsynaptic glutamate receptors regulate local BMP signaling at the Drosophila neuromuscular junction. Development 2014, 141, 436–447. [Google Scholar] [CrossRef]
- Cooper, A.S.; Rymond, K.E.; Ward, M.A.; Bocook, E.L.; Cooper, R.L. Drosophila melanogaster for physiological studies. J. Vis. Exp. 2009, 33, e1596. [Google Scholar] [CrossRef]


| Compound | Media 1 | Media 2 | Media 3 | Media 4 |
|---|---|---|---|---|
| NaCl | 70 mM | 70 mM | 0 mM | 0 mM |
| NMDG | 0 mM | 0 mM | 80 mM | 70 mM |
| KCl | 5 mM | 0 mM | 0 mM | 5 mM |
| MgCl2·6H2O | 20 mM | 20 mM | 20 mM | 20 mM |
| NaHCO3 | 10 mM | 10 mM | 0 mM | 10 mM |
| Trehalose | 5 mM | 5 mM | 5 mM | 5 mM |
| Sucrose | 115 mM | 115 mM | 115 mM | 115 mM |
| BES | 25 mM | 25 mM | 25 mM | 25 mM |
| CaCl2·2H2O | 1 mM | 1 mM | 1 mM | 1 mM |
| pH 7.2 | NaOH | NaOH | HCl | HCl |
Disclaimer/Publisher’s Note: The statements, opinions and data contained in all publications are solely those of the individual author(s) and contributor(s) and not of MDPI and/or the editor(s). MDPI and/or the editor(s) disclaim responsibility for any injury to people or property resulting from any ideas, methods, instructions or products referred to in the content. |
© 2025 by the authors. Licensee MDPI, Basel, Switzerland. This article is an open access article distributed under the terms and conditions of the Creative Commons Attribution (CC BY) license (https://creativecommons.org/licenses/by/4.0/).
Share and Cite
Hadjisavva, M.E.; Cooper, R.L. The Biphasic Effect of Lipopolysaccharide on Membrane Potential. Membranes 2025, 15, 74. https://doi.org/10.3390/membranes15030074
Hadjisavva ME, Cooper RL. The Biphasic Effect of Lipopolysaccharide on Membrane Potential. Membranes. 2025; 15(3):74. https://doi.org/10.3390/membranes15030074
Chicago/Turabian StyleHadjisavva, Maria E., and Robin L. Cooper. 2025. "The Biphasic Effect of Lipopolysaccharide on Membrane Potential" Membranes 15, no. 3: 74. https://doi.org/10.3390/membranes15030074
APA StyleHadjisavva, M. E., & Cooper, R. L. (2025). The Biphasic Effect of Lipopolysaccharide on Membrane Potential. Membranes, 15(3), 74. https://doi.org/10.3390/membranes15030074