Article

A Comparison Between Calcium and Strontium Transport by the (Ca2+ + Mg2+)ATPase of the Basolateral Plasma Membrane of Renal Proximal Convoluted Tubules

by
José Roberto Meyer-Fernandes
1,2,*,
Mauro Sola-Penna
3 and
Adalberto Vieyra
4,5,6,*
1
Instituto de Bioquímica Médica Leopoldo de Meis, Centro de Ciências da Saúde, Universidade Federal do Rio de Janeiro, Rio de Janeiro 21941-902, Brazil
2
Programa de Biologia Estrutural e Bioimagem, Instituto de Bioquímica Médica Leopoldo de Meis, Centro de Ciências da Saúde, Universidade Federal do Rio de Janeiro, Rio de Janeiro 21941-902, Brazil
3
Laboratório de Enzimologia e Controle do Metabolismo, Faculdade de Farmácia, Centro de Ciências da Saúde, Universidade Federal do Rio de Janeiro, Rio de Janeiro 21941-902, Brazil
4
Instituto de Biofísica Carlos Chagas Filho, Centro de Ciências da Saúde, Universidade Federal do Rio de Janeiro, Rio de Janeiro 21941-902, Brazil
5
Centro Nacional de Biologia Estrutural e Bioimagem/CENABIO, Centro de Ciências da Saúde, Universidade Federal do Rio de Janeiro, Rio de Janeiro 21941-902, Brazil
6
Programa de Biomedicina Translacional/BIOTRANS, UNIGRANRIO, INMETRO, and UERJ-ZO, Duque de Caxias 25071-202, Brazil
*
Authors to whom correspondence should be addressed.
Membranes 2025, 15(4), 122; https://doi.org/10.3390/membranes15040122
Submission received: 21 March 2025 / Revised: 7 April 2025 / Accepted: 10 April 2025 / Published: 12 April 2025
(This article belongs to the Section Biological Membranes)

Abstract

:
In this work, the utilization of calcium and strontium by the (Ca2+ + Mg2+)ATPase of the basolateral plasma membrane of renal proximal convoluted tubules were compared. [90Sr]Sr2+ and [45Ca]Ca2+ uptake by vesicles derived from this membrane were strictly dependent on ATP and Mg2+, and no other nucleotide was able to support the transport. Each cation inhibited the uptake of the other one in a purely competitive fashion (the same Vmax; increased K0.5), without causing a significant change in the influx rate. These results indicate that both cations bind at the same transport site on the enzyme, facing the cytosolic surface of the cell. The K0.5 for Sr2+ obtained for (Sr2+ + Mg2+)ATPase activity was 13.1 ± 0.2 µM and for Sr2+ uptake was 13.4 ± 0.1 µM. They were higher than K0.5 for Ca2+ obtained for (Ca2+ + Mg2+)ATPase activity (0.42 ± 0.03 µM) and for Ca2+ uptake (0.28 ± 0.02 µM). It is postulated that the lower ATPase affinity for Sr2+ is associated with greater steric difficulties for the occupation by this cation of the binding and transport sites, as a consequence of its greater crystal ionic radius (1.13 Å for Sr2+ against 0.99 Å for Ca2+).

1. Introduction

Calcium transport across the basolateral membranes of proximal tubule cells is mediated, in part, by an ATPase that is stimulated by micromolar Ca2+ concentrations in the presence of Mg2+ [1,2,3]. The renal (Ca2+ + Mg2+)ATPase is located in the plasma membrane of basolatera1 membranes of proximal tubule cells, where it plays a central role in the regulation of intracellular Ca2+ levels. Proximal tubules are responsible for the reabsorption of most of the ultrafiltered Ca2+ in the nephron [4]. Thus, these cells must handle a continuous flux of Ca2+ and, at the same time, maintain a very low cytoplasmic Ca2+ concentration.
Evidence has been presented [3,5,6] showing that the renal (Ca2+ + Mg2+)ATPase belongs to the P-ATPase class [7], passing through two principal conformational states (E1 and E2) during its catalytic cycle.
Membrane vesicles from the sarcoplasmic reticulum of skeletal muscle retain a membrane-bound (Ca2+ + Mg2+)ATPase (SERCA) which is also able to catalyze ATP hydrolysis, stimulated by Sr2+ ions, and to transport Sr2+ at the expense of ATP hydrolysis [8]. A plasma membrane (Ca2+ + Mg2+)ATPase (PMCA) with these kinetic characteristics, also able to hydrolyze ATP stimulated by Sr2+ and transporting Sr2+, has not yet been characterized. Here, for the first time, we are characterizing the Sr2+ ion transport and the (Sr2+ + Mg2+)ATPase activity in the plasma membrane of a cell.

2. Materials and Methods

2.1. Materials

All the reagents of analytical grade were purchased from Sigma Chemical Co. (St. Louis, MO, USA), or Merck (São Paulo, Brazil). The distilled water used to prepare all the solutions was deionized using a Milli-Q system of resins (Millipore Corp., Burlington, MA, USA). Radioactive Pi (32Pi) was purchased from Instituto de Pesquisas Energéticas e Nucleares (São Paulo, Brazil) as orthophosphoric acid and was purified by extraction in a phosphomolybdate complex with a mixture of 2-butanol/benzene followed by re-extraction into the aqueous phase with ammonium hydroxide and then precipitation as a MgNH4PO4 complex. [γ-32P]ATP (specific activity 104 Bq/nmol ATP) was prepared as previously described by Glynn and Chappell [9]. Ionized Ca2+ and Sr2+ concentrations were calculated using a computer program based on an iterative method that takes into account the different species involved in the equilibrium between EGTA, Ca2+, Sr2+, ATP4−, Mg2+, H+, and Pi [10,11].

2.2. Preparation of Purified Vesicles Derived from Basolateral Membranes

Basolateral membrane vesicles were isolated from sheep kidney proximal tubules by the Percoll gradient method [12]. Compared with the initial homogenate, this plasma membrane fraction was enriched 9–12-fold in the specific activity of the basolateral membrane marker (Na+ + K+)ATPase. Protein concentrations were determined using Folin’s phenol reagent [13] and bovine serum albumin as a standard.

2.3. 45Ca2+ and 90Sr2+ Uptake

Except when otherwise noted, the basic medium contained, in a final volume of 0.5 mL, 30 mM Tris-HCl buffer (pH 8.5), 5 mM ATP, 5 mM MgCl2, 1 mM ouabain, 10 mM NaN3, 0.1 mM EGTA, and 0.1 mM 45CaCl2 (10 µM free Ca2+; specific activity 5.0 × 10³ Bq/nmol CaCl2) or 0.1 mM 90SrCl2 (10 µM free Sr2+; specific activity 5.0 × 10³ Bq/nmol SrCl2). The experiments were carried out at 37 °C. 45Ca2+ or 90Sr2+ uptake was started by the addition of membranes (protein concentration 0.2 mg/mL) and stopped by Millipore filtration [14], using 0.45 µm pore size filters. The 45Ca2+ and 90Sr2+ remaining in the vesicles were counted in a liquid scintillation counter after the filters were washed twice with 10 mL of a cold solution containing 2 mM La(NO3)3, 100 mM KC1, and 20 mM MOPS-Tris (pH 7.0). 90SrCl2 and 45CaCl2 were obtained from New England Nuclear Corporation (Boston, MA, USA).

2.4. (Ca2+ + Mg2+)ATPase and (Sr2+ + Mg2+)ATPase Activities

The activities were measured under the same conditions as the 45Ca2+ and 90Sr2+ uptakes, except that the reactions were performed in the presence of 5 mM [γ-32P]ATP. The reaction was initiated by the addition of membrane and stopped by the addition of 1.0 mL of ice-cold 25% charcoal in 0.1 M HCl to adsorb the non-hydrolyzed [γ-32P]ATP [15]. Following centrifugation at 4000× g for 30 min, an aliquot of the supernatant was withdrawn to measure the amount of 32Pi released. Spontaneous hydrolysis of [γ-32P]ATP was measured in tubes run in parallel in which the enzyme was added after the ice-cold charcoal suspension. The (Sr2+ + Mg2+)ATPase and (Ca2+ + Mg2+)ATPase activities were quantified as the difference between the ATP hydrolysis measured in the presence of SrCl2 or CaCl2, and in its absence (EGTA 1 mM). 45Ca, 90Sr, and 32Pi were counted in a liquid scintillation counter.

2.5. Data Analysis

Data analysis was performed using the software Enzfitter (Elsevier-Biosoft, Cambridge, United Kingdom). Values for the variables were calculated by non-linear regression. Data points represent means ± SEM of three determinations using different membrane preparations. When indicated, the data were analyzed using Student’s t-test, using Prism computer software (GraphPad Software Inc., San Diego, CA, USA). The statistically significant difference was set at p < 0.05.

3. Results and Discussion

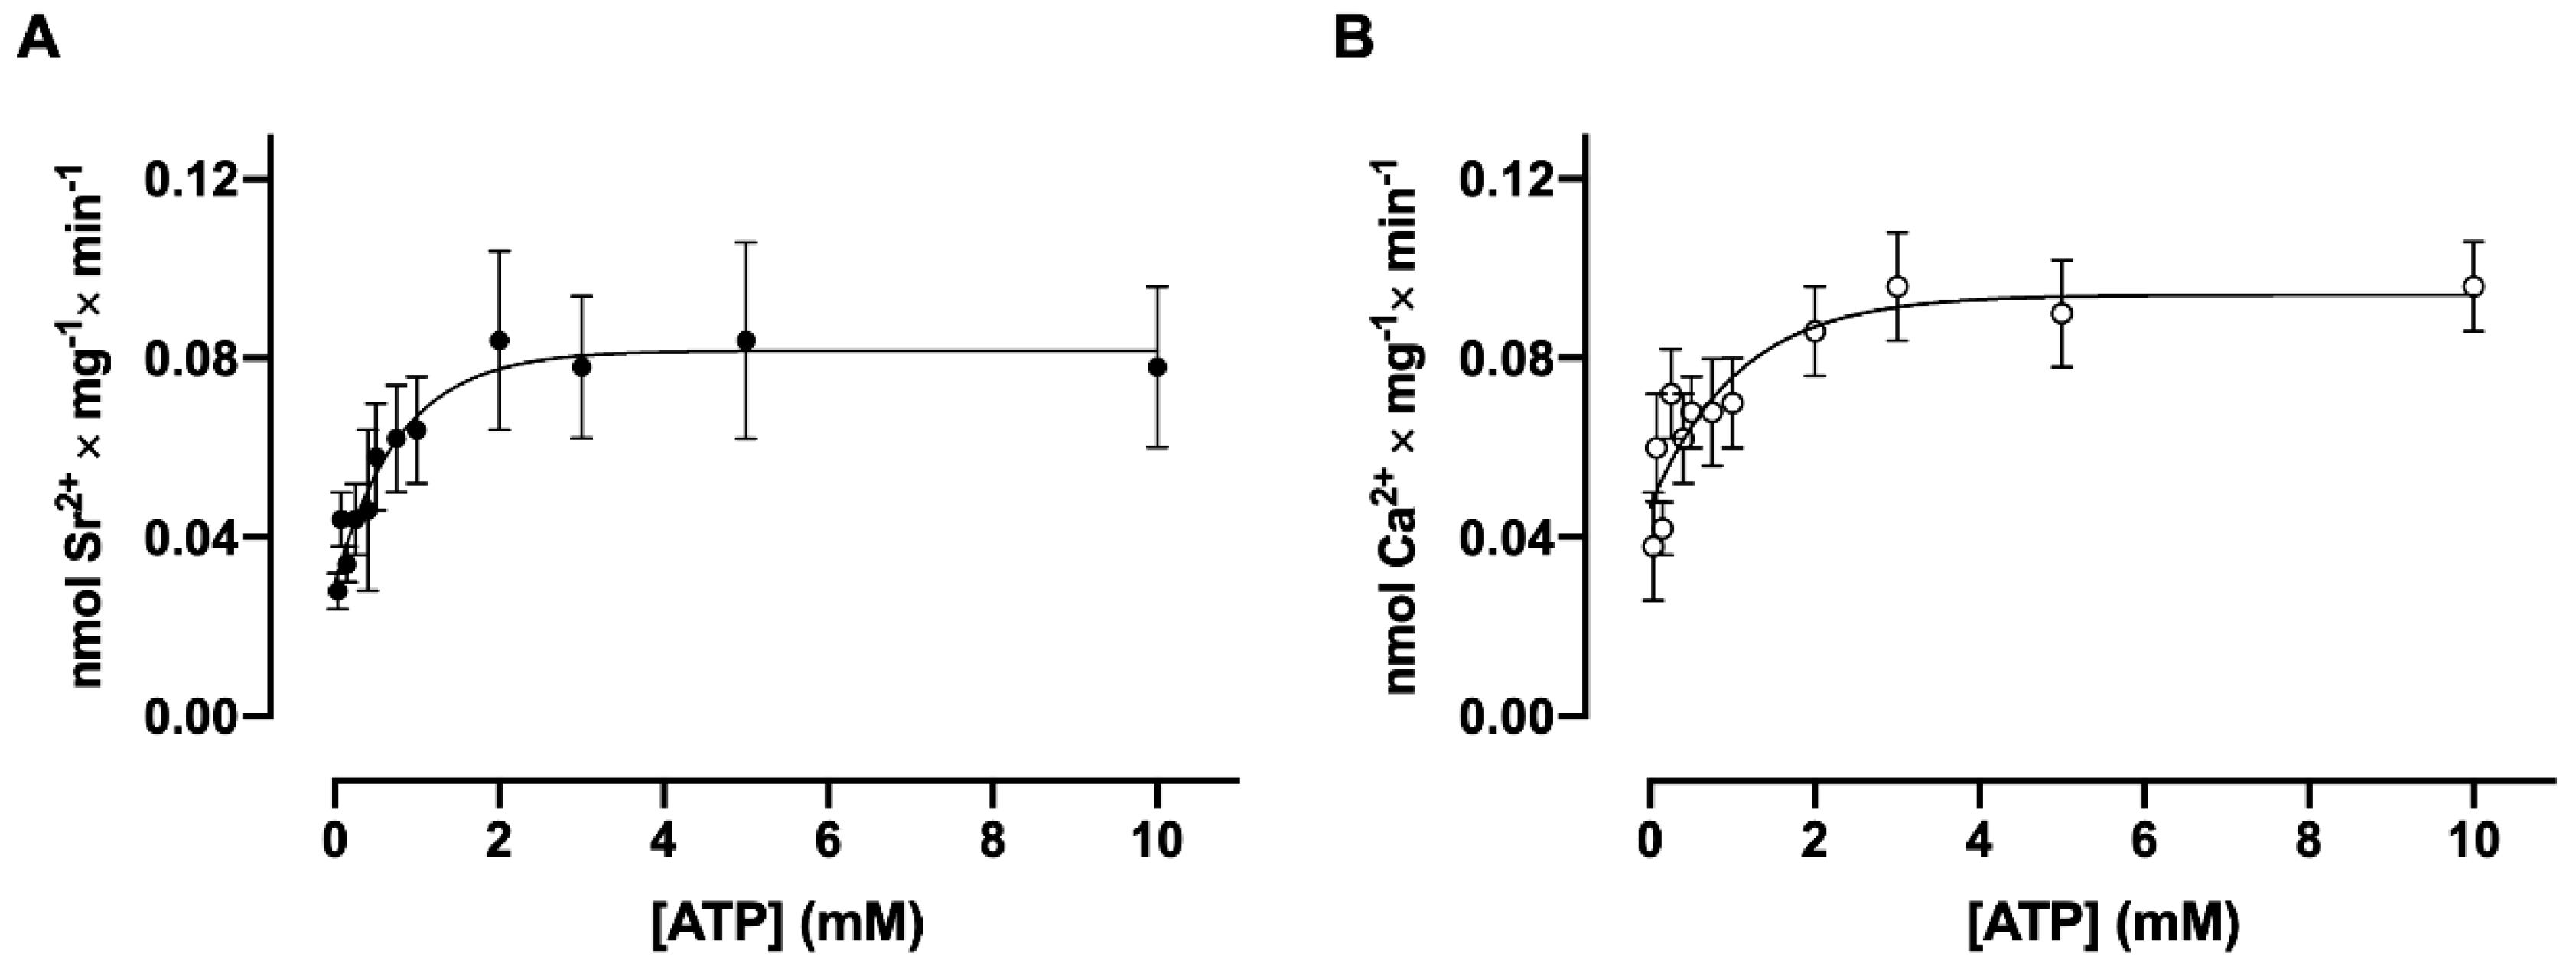
3.1. Ca2+ and Sr2+Transport

In order to determine whether Ca2+ and Sr2+ are actively accumulated in these plasma membrane vesicles, the samples were incubated with 90SrCl2 or 45CaCl2 in the presence and absence of ATP, in the presence of a non-hydrolyzable analog of ATP, (5′-adenylyl methylene diphosphonate, AMP-P-C-P), and in the presence and absence of MgCl2. Figure 1 shows the time course of 90Sr2+ (A) and 45Ca2+ (B) uptake. The transport rates of 90Sr2+ and 45Ca2+ by the basolateral membrane vesicles were very slow when compared to those of the sarcoplasmic reticulum [8]. The maximum accumulation level was reached after four hours, which probably reflects the small number of transport units present in the plasma membrane in most cells. At all times, Sr2+ uptake was 30–35% lower than Ca2+ uptake, and the difference was probably due to a slower rate of active Sr2+ influx as a consequence of steric difficulties for the occupancy of the binding and transport sites, because of its greater crystal ionic radius (1.13 Å for Sr2+ against 0.99 Å for Ca2+) [16]. In these experiments, in the absence of ATP, about 2.1 nmol 90Sr2+ × mg protein−1 and 3.6 nmol 45Ca2+ × mg protein−1 were observed. The same low amounts of accumulated 45Ca or 90Sr were obtained in the presence of AMP-P-C-P or in the absence of MgCl2. It can also be seen in this figure that the addition of A23187, a Ca2+ ionophore, induces a rapid and total release of 90Sr2+ and 45Ca2+ accumulated by the vesicles, which indicates that 90Sr2+ as well as 45Ca2+ are found in the luminal compartment.
One of the characteristics of plasma membrane (Ca2+ + Mg2+)ATPases is the high specificity for the energy-donor substrate used for transport, in this case, ATP [17,18]. As shown in Table 1, both 45Ca2+ transport and 90Sr2+ transport present the same pattern of selectivity for the different substrates tested.
The dependence of Sr2+ and Ca2+ uptake on ATP concentration (Figure 2, panel A and panel B, respectively) presents the same stimulatory profile for both 90Sr2+and 45Ca2+ uptake with a Km for ATP in the Sr2+ transport curve of 0.65 ± 0.06 mM and a Km for ATP in the Ca2+ transport curve of 0.52 ± 0.06 mM, without significant differences between these values (p > 0.05; Student´s t-test).

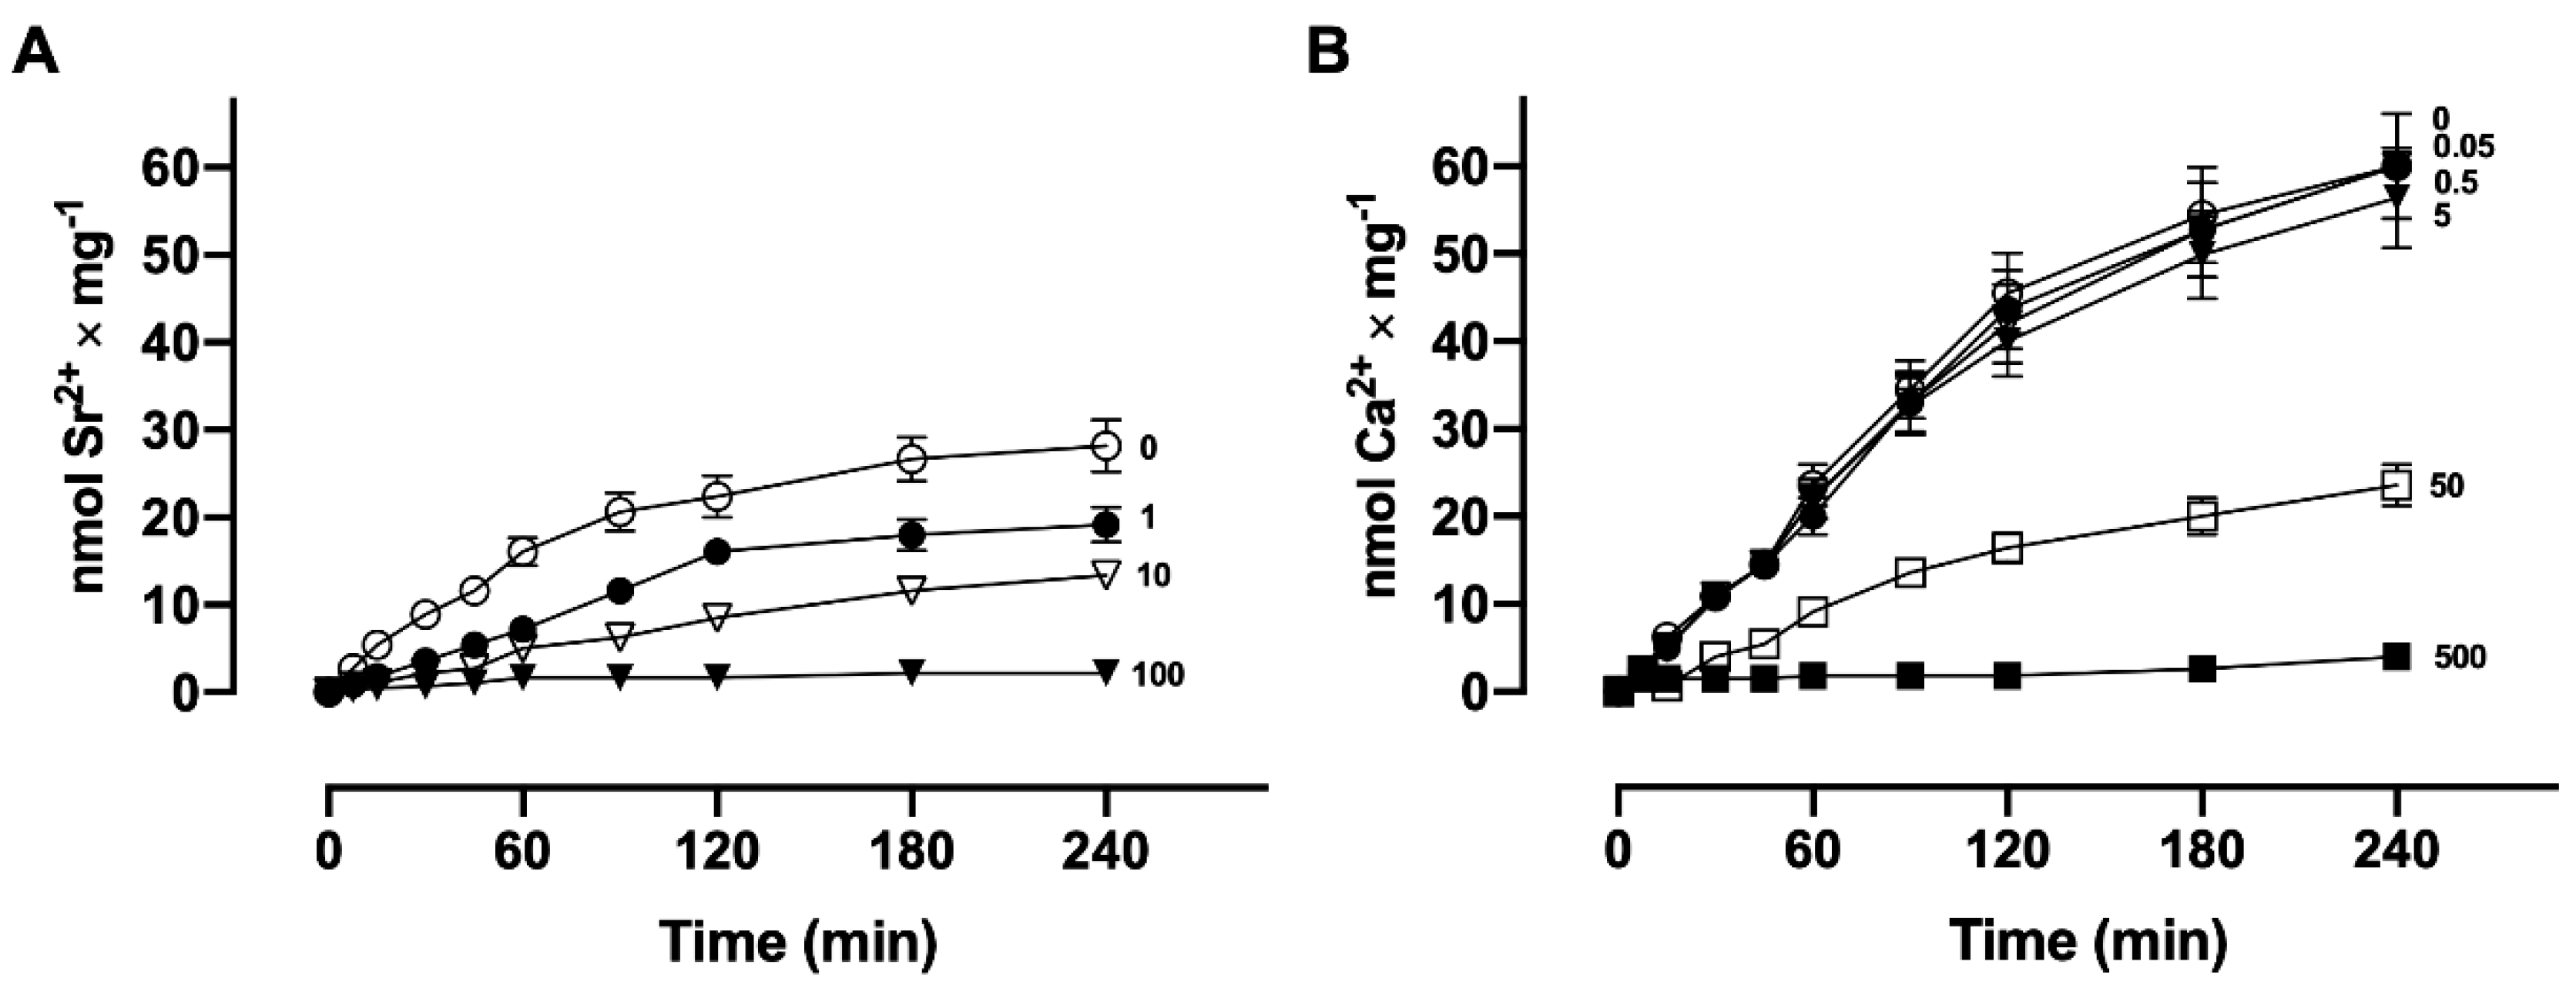
3.2. Dependence of Sr2+ and Ca2+ Uptake on Orthophosphate Concentration

As seen in Figure 3, panels A and B, the dependence on Pi concentration presents the same stimulatory profile for both 90Sr2+ and 45Ca2+ uptake. Due to the small volume of the basolateral membrane inside-out vesicles, the accumulated Ca2+ and Sr2+ can reach sufficiently high concentrations in the lumen of the vesicles to saturate the low-affinity site facing the internal surface of the vesicle, leading to inhibition of the hydrolytic activity of the (Ca2+ + Mg2+)ATPase [3]. There are several observations showing that the addition of anions such as phosphate (Pi) and oxalate increases the amount of Ca2+ accumulated inside plasma membrane and inside sarcoplasmic reticulum membrane vesicles [19]. This increase in the amount of accumulated Ca2+ is attributed to the fact that the intravesicular anions form insoluble complexes with Ca, thus reducing the concentration of free Ca2+ in the lumen and thus decreasing the occupancy of the low-affinity inhibitory site. As seen in Figure 3, panels A and B, the dependence on Pi concentration presents the same stimulatory profile for both Sr2+ and Ca2+ uptake with the same K0.5 (5.3 mM and 5.1 mM, respectively; Student’s t-test), reaching saturation at a concentration of 40 mM.
Another possibility that has been suggested is that incubation of the vesicles in media containing potassium phosphate in the pH range 7.0–7.4 would lead to an asymmetric distribution of the anionic species of the buffer due to differences in permeability of H2PO4 and HPO42− with the generation of a ΔpH with increased Ca2+ uptake [3], due to an increase in the intravesicular concentration of H+ available for exchange for external Ca2+. The existence of Ca2+/nH+ cotransport was shown in the (Ca2+ + Mg2+)ATPase of red blood cells [17].

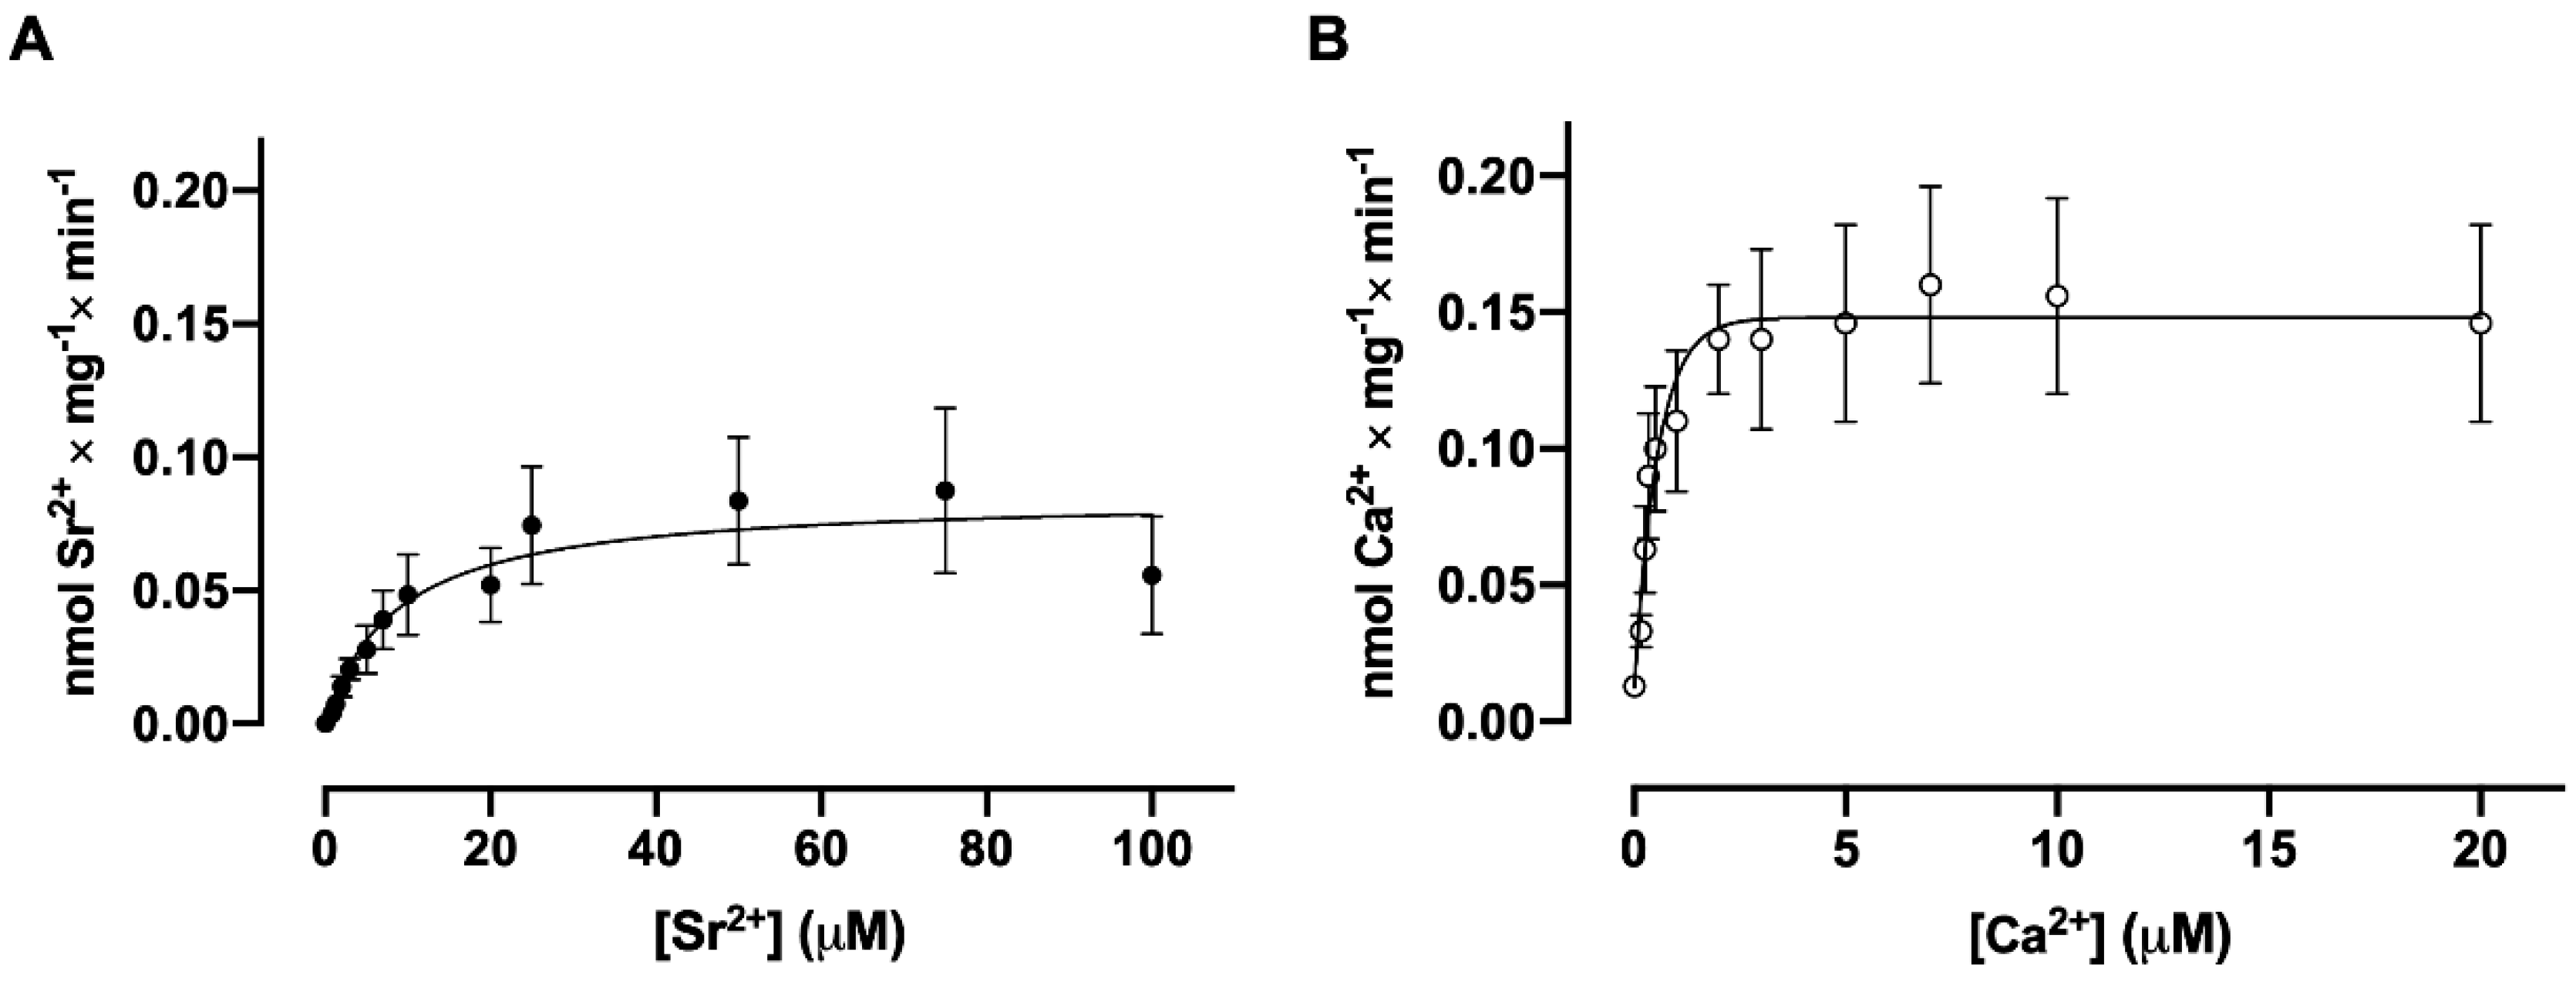
3.3. Dependence of Sr2+ and Ca2+ Uptake on Free Sr2+ and Ca2+ Concentrations, Respectively

The mechanism of transepithelial Ca2+ transport by renal tubular plasma membrane (Ca2+ + Mg2+)ATPases presupposes that the system located in the membrane is stimulated by micromolar concentrations of the ion, since cytosolic Ca2+ concentrations vary in this range. The dependence of Sr2+ uptake on Sr2+ concentrations follows Michaelis–Menten kinetics, reaching a maximum velocity of 0.11 nmol ± 0.02 nmol Sr2+ × mg−1 × min−1 with a K0.5 for Sr2+ of 13.4 ± 2.4 µM (Figure 4A). As can be seen in Figure 4B, the dependence of Ca2+ uptake on Ca2+ concentrations follows the same kinetics, reaching a maximum velocity of 0.15 nmol ± 0.04 nmol Ca2+ × mg−1 × min−1 with a K0.5 for Ca2+ of 0.28 ± 0.03 µM (Figure 4B). These data show that although the Ca2+ active transporter system present in the basolateral plasma membrane can also transport Sr2+ with the same velocity, its affinity is greater for Ca2+, a cation that has a smaller crystalline ionic radius than Sr2+ [16], and which would therefore be able to more easily accommodate the binding located in transmembrane domains of the ATPase molecule [20].

3.4. Sr2+ and Ca2+ Transport Competition Assays

If the Ca2+ transport system present in the basolateral membrane were the same as that responsible for Sr2+ transport, the addition of increasing concentrations of non-radioactive Ca2+ or Sr2+ should decrease the amount of transported 90Sr2+ or 45Ca2+, respectively. In Figure 5A, it is observed that 90Sr2+ uptake decreases as increasing concentrations of free Ca2+ are added simultaneously. The same inhibitory effect can also be observed on 45Ca2+ uptake when increasing concentrations of free Sr2+ are added to the reaction medium (Figure 5B). However, the inhibition promoted by the addition of Sr2+ only becomes more evident when a concentration of Sr2+ 100 times greater than that of Ca2+ is added to the medium. These results are consistent with those showing that the transporter system present in the plasma membrane has greater affinity for Ca2+ than for Sr2+.

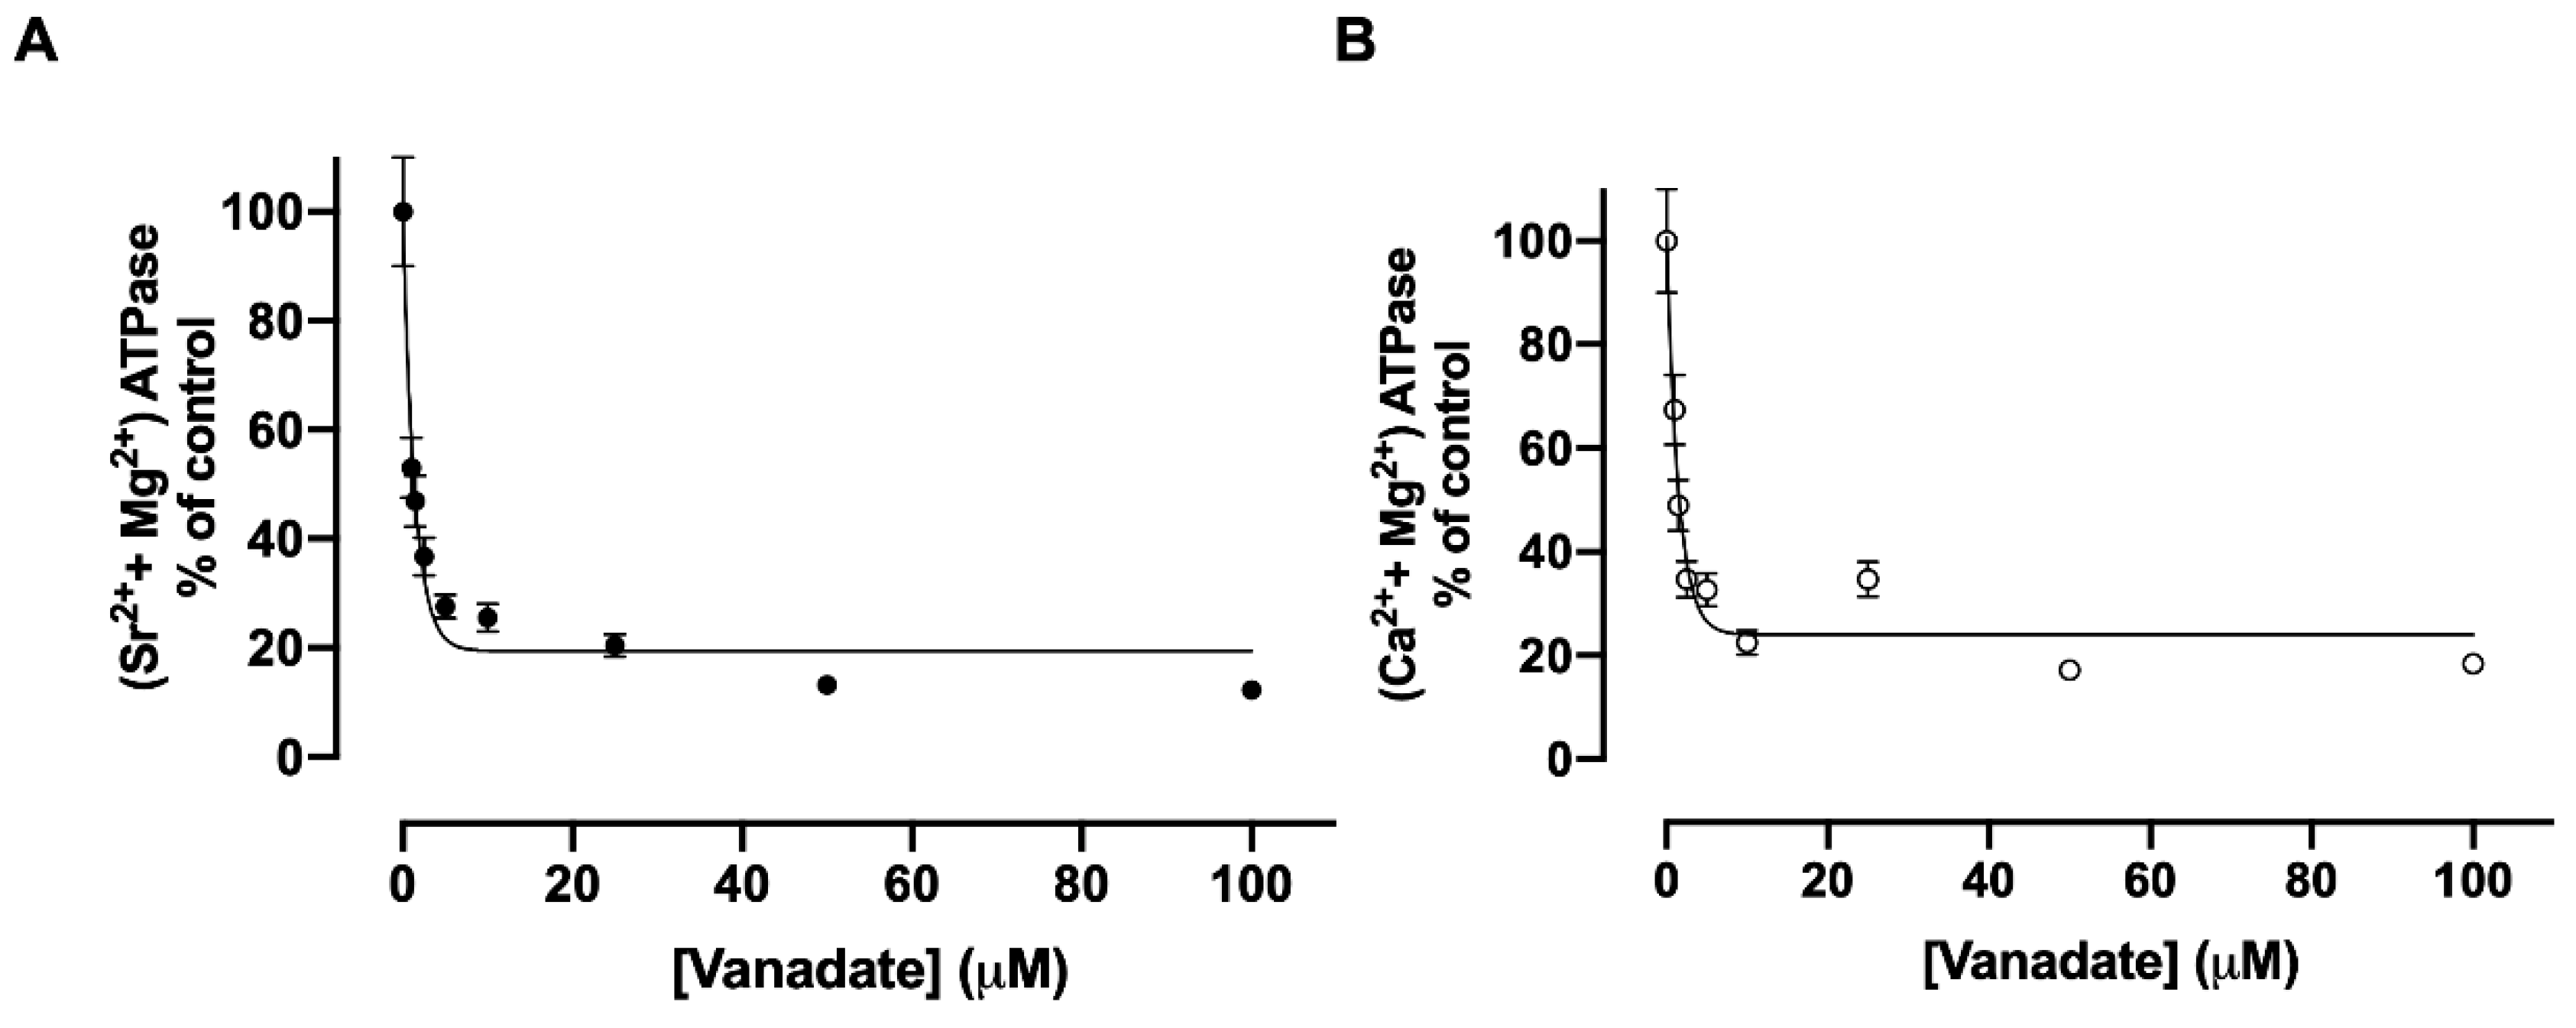
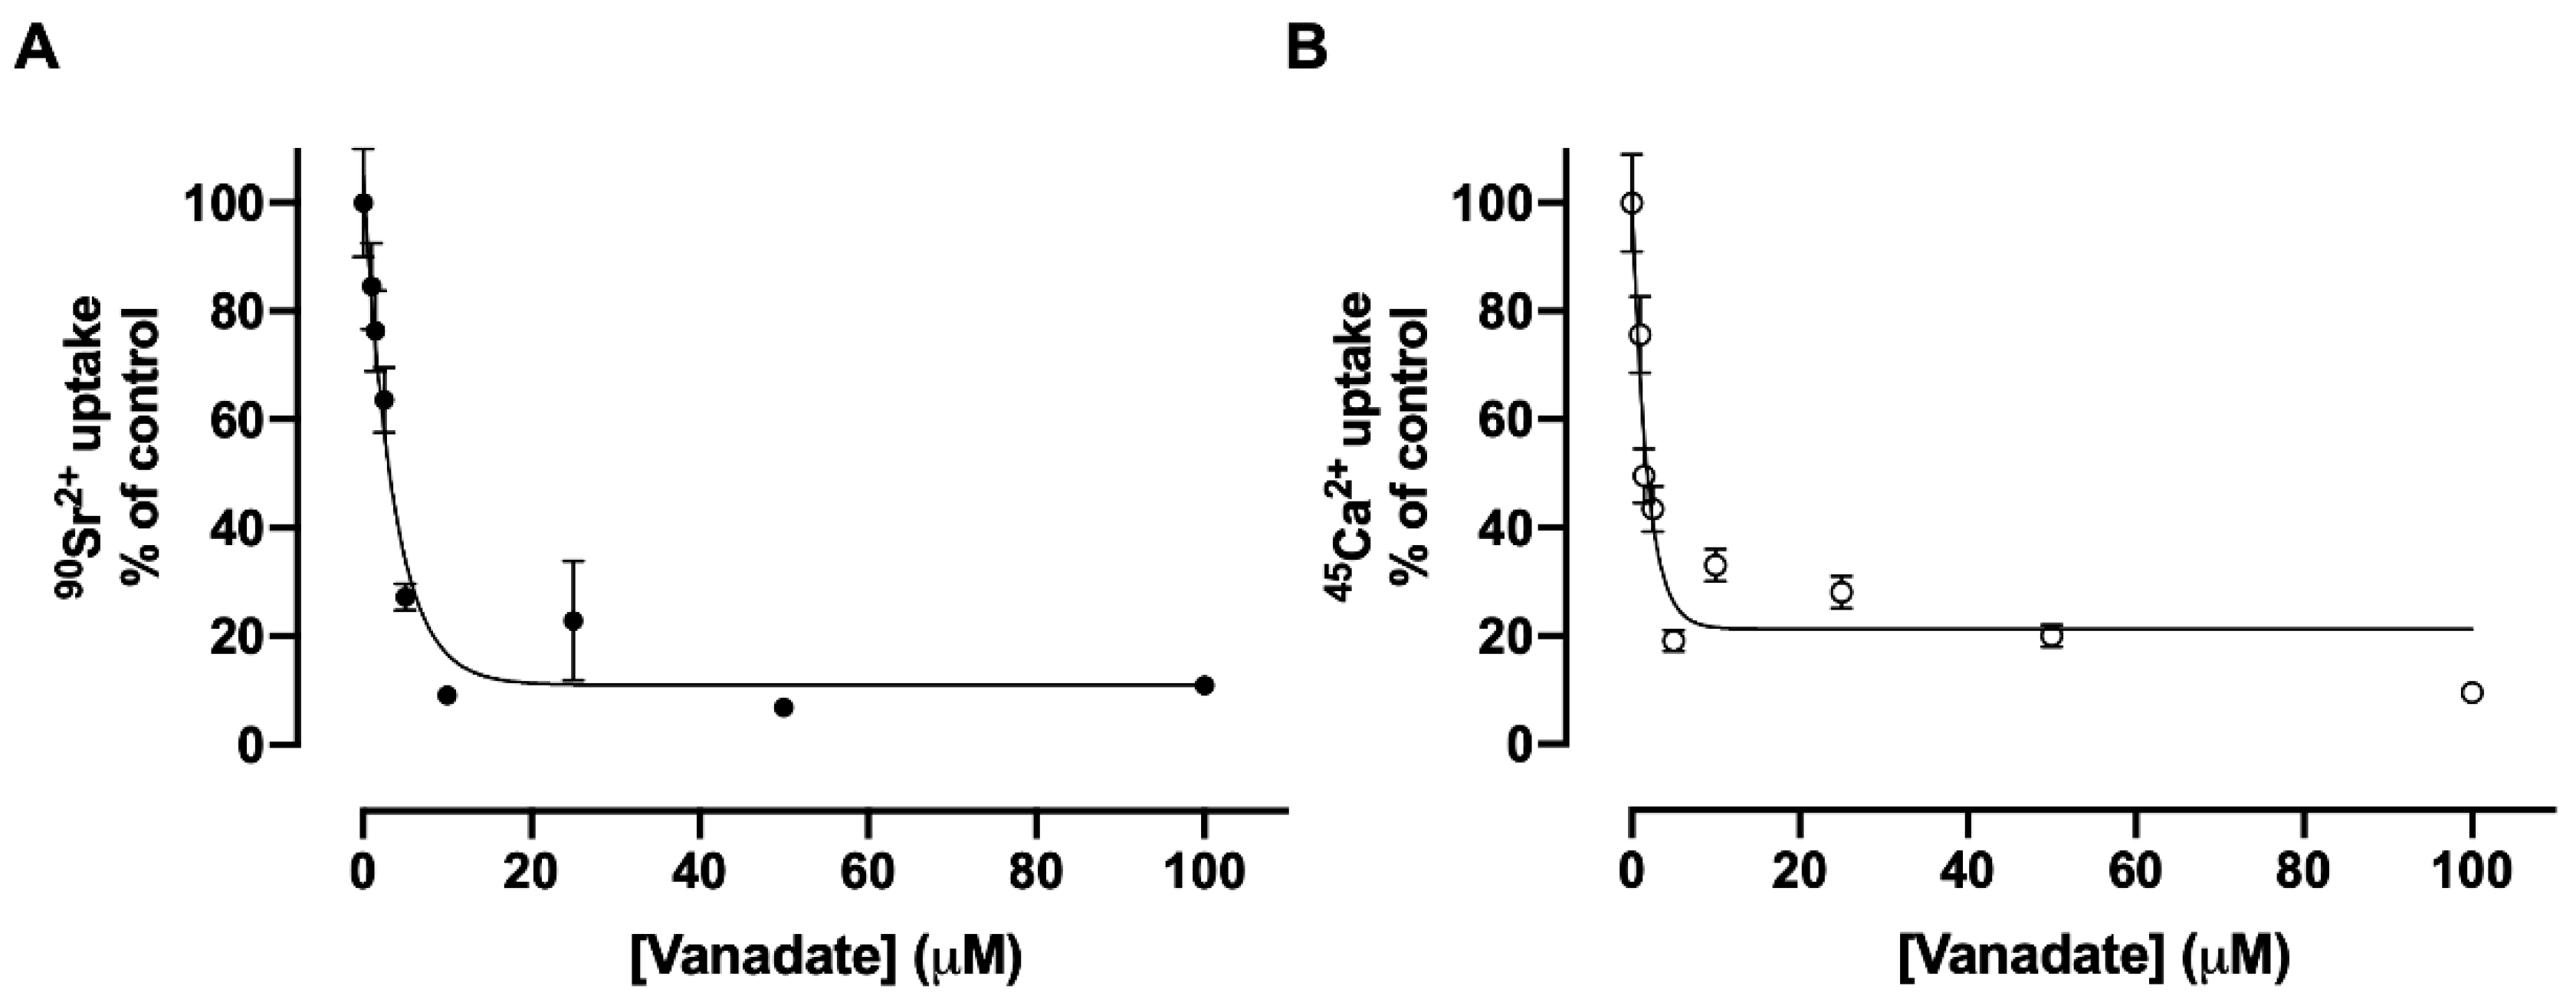
3.5. Inhibition of Sr2+ Transport by Vanadate

It has been demonstrated that orthovanadate is capable of inhibiting a large number of transporting ATPases that form a phosphorylated intermediate during their catalytic cycle, defined as P-ATPases [7]. Vanadate is one of the most studied P-type ATPase inhibitors [21]. It is known that the orthovanadate ion VO3- presents a great structural similarity to PO42-. Figure 6 shows the effects of vanadate on (Sr2+ + Mg2+)ATPase and (Ca2+ + Mg2+)ATPase activities of the renal basolateral membrane. Using plasma membranes, the (Sr2+ + Mg2+)ATPase and (Ca2+ + Mg2+)ATPase activities are similarly very sensitive to vanadate below 10 μM of the compound (Figure 6, panels A and B). The same inhibitory profile is observed when the concentration of vanadate in Sr2+ and Ca2+ uptake assays is increased (Figure 7, panels A and B).

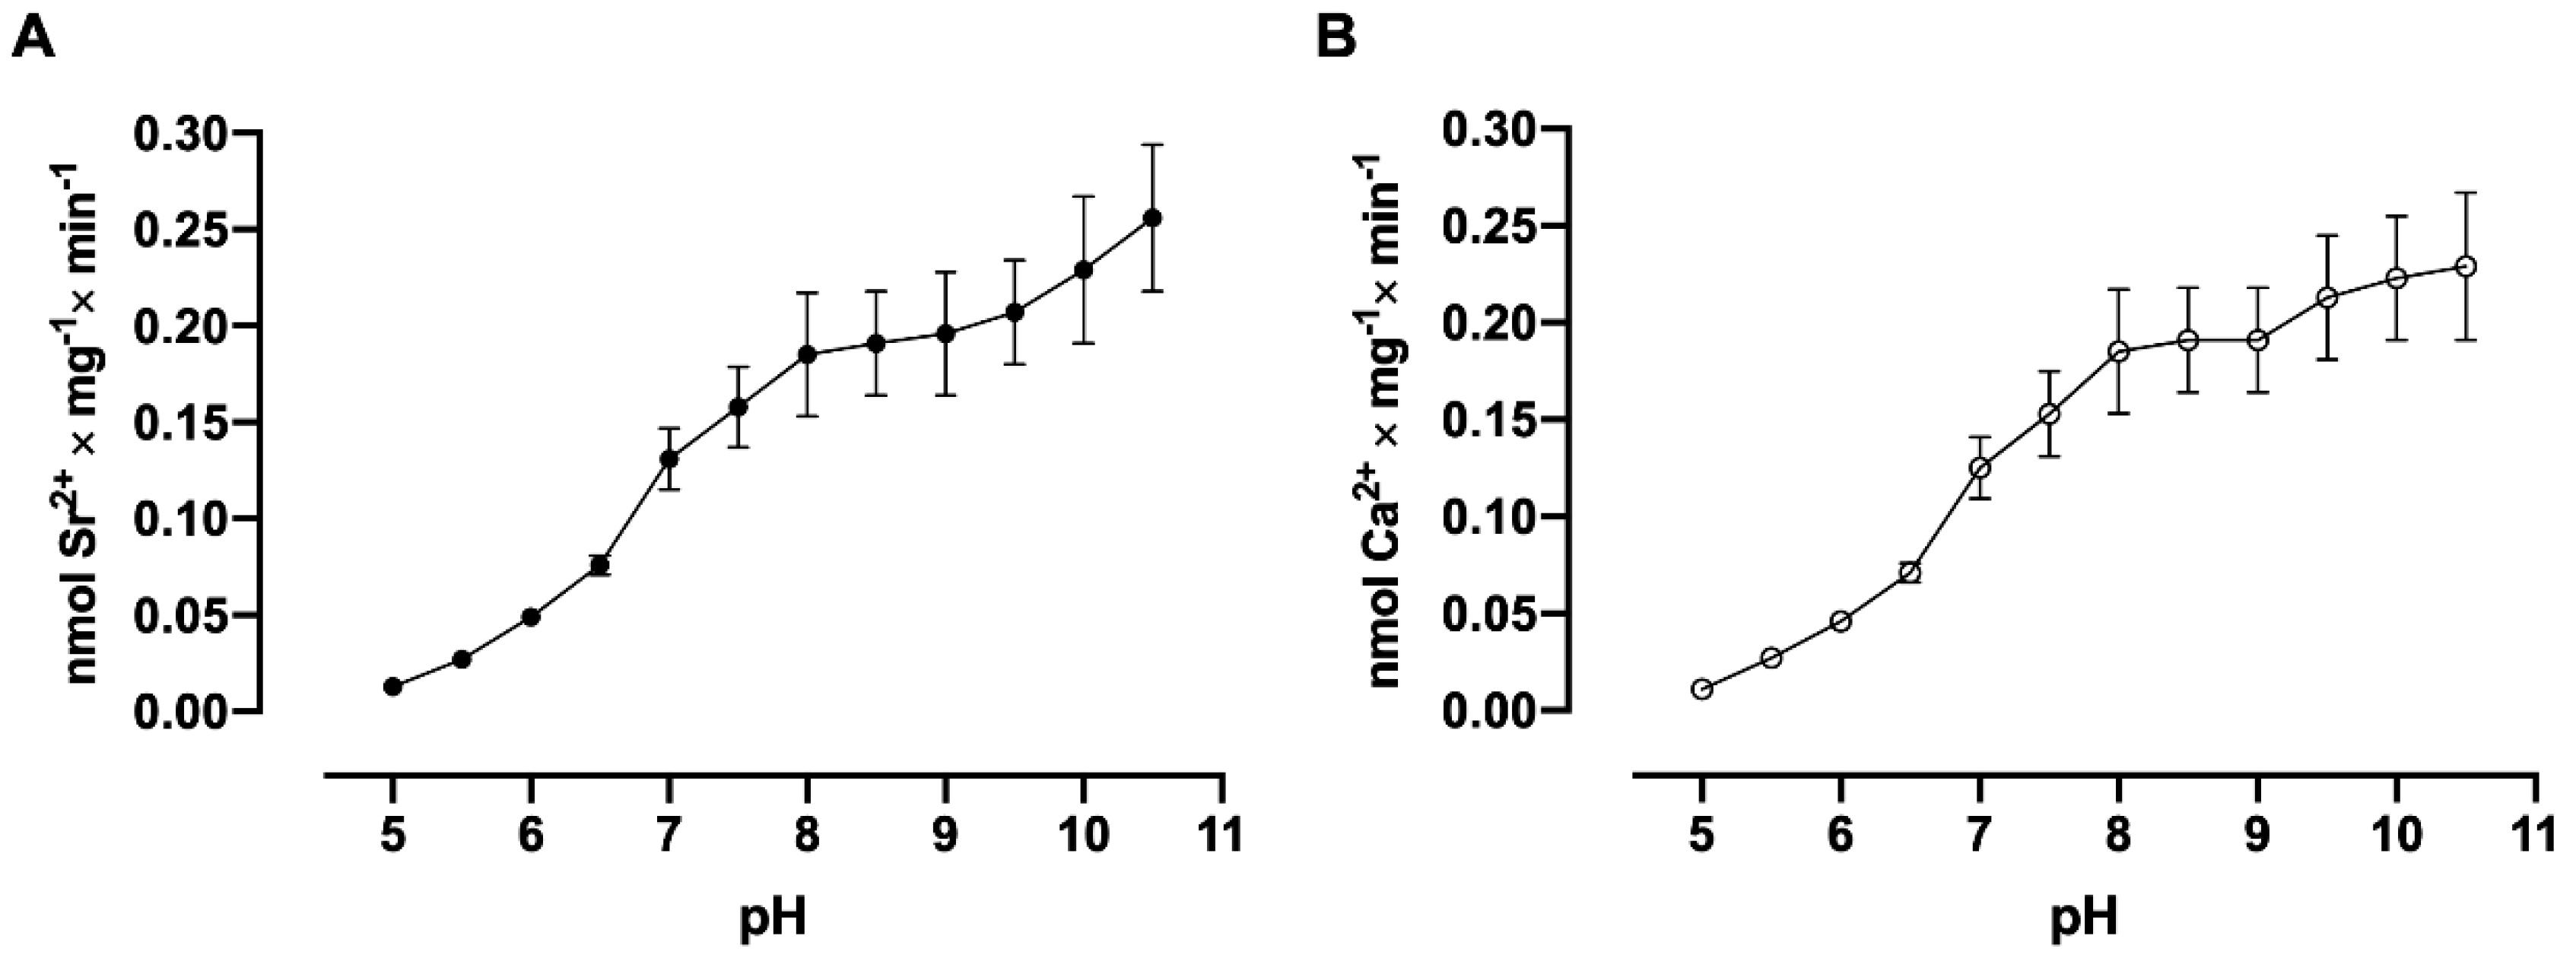
3.6. pH Dependence Assays

Several amino acids in different domains of the (Ca2+ + Mg2+)ATPase molecule are potential candidates to offer -COOH and -OH groups in their side chains which are capable of contributing to the binding of the Ca2+ or Sr2+ ions after deprotonation [22]. With the use of renal plasma membrane vesicles, low levels of Sr2+ and Ca2+ accumulation (Figure 8, panels A and B) were observed at pH 5.0. However, a progressive increase in the velocity of accumulation of both cations was observed due to the increase in pH of the medium. In Figure 9, it is observed that (Sr2+ + Mg2+)ATPase (Figure 9A) and (Ca2+ + Mg2+)ATPase (Figure 9B) activities increase as the pH of the medium increases, with a profile similar to that shown for Sr2+ and Ca2+ uptake in Figure 8, panels A and B.

3.7. Specificity for Different Energy-Donor Substrates

It has been described that one of the differences between plasma membrane (Ca2+ + Mg2+)ATPase (PMCA) and sarcoplasmic reticulum (Ca2+ + Mg2+)ATPase (SERCA) is the high specificity for ATP [6]. Nucleotides other than ATP are inefficient to sustain Ca2+ uptake catalyzed by different plasma membrane (Ca2+ + Mg2+)ATPases. The high specificity for ATP as an energy donor for Sr2+ and Ca2+ transport (Table 1), confirms the plasma membrane origin of the vesicles used in this study, and rules out the possibility that Sr2+ uptake was due to endoplasmic reticulum membrane vesicles present in the preparation used.
The reaction medium contained 10 μM free Ca2+ or 10 μM free Sr2+ and 5 mM of the nucleotides indicated in the Table 1. The reaction mixtures were incubated for 30 min at 37 °C.

3.8. Conclusions

From the results described and discussed in Figure 1, Figure 2, Figure 3, Figure 4, Figure 5, Figure 6, Figure 7, Figure 8 and Figure 9, we propose (Figure 10) that the electronic configuration of Sr2+ perturbs its proper alignment with the aspartic acid (D895), asparagine (N891), glutamic acid (E433), and methionine (M894) residues of the (Ca2+ + Mg2+)ATPase plasma membrane molecule and, consequently, the kinetic properties of its transit through the channel formed by the transmembrane TM4, TM5, and TM6 domains [20]. These results can help explain how the electronic configuration underlies modifications of cation flux properties across biological membranes. Mutation of the residues above to investigate whether Sr2+ transport still occurs constitutes a future direction for this study.

Author Contributions

Conceptualization, J.R.M.-F. and A.V.; methodology, J.R.M.-F. and M.S.-P.; validation, J.R.M.-F., M.S.-P. and A.V.; formal analysis, J.R.M.-F., M.S.-P. and A.V; investigation, J.R.M.-F., M.S.-P. and A.V.; resources, A.V.; data curation, J.R.M.-F., M.S.-P. and A.V.; writing—original draft preparation, J.R.M.-F. and A.V.; writing—review and editing, J.R.M.-F., M.S.-P. and A.V.; visualization, J.R.M.-F., M.S.-P. and A.V.; supervision, J.R.M.-F. and A.V.; project administration, A.V.; funding acquisition, A.V. All authors have read and agreed to the published version of the manuscript.

Funding

Brazilian Agencies of Conselho Nacional de De-senvolvimento Científico e Tecnológico (CNPq—Grant Number: 304763/2021-7), Coordenação de Aperfeiçoamento de Pessoal de Nível Superior (CAPES—Grant Number: 0012017), and Fundação Carlos Chagas Filho deAmparo à Pesquisa do Estado do Rio de Janeiro (FAPERJ- Grant Number: E-26/150.042/2023).

Institutional Review Board Statement

Not applicable.

Informed Consent Statement

Not applicable.

Data Availability Statement

The datasets generated and/or analyzed during the current study are available from the corresponding authors on reasonable request.

Acknowledgments

We would like to thank Glória Costa-Sarmento for their excellent technical assistance.

Conflicts of Interest

The authors declare no conflicts of interest.

References

  1. Gmaj, P.; Murer, H.; Kinne, R. Calcium ion transport across plasma membranes isolated from rat kidney cortex. Biochem. J. 1979, 178, 549–557. [Google Scholar] [CrossRef] [PubMed]
  2. Gmaj, P.; Murer, H.; Carafoli, E. Localization and properties of a high affinity (Ca2+ + Mg2+)ATPase in isolated kidney cortex plasma membranes. FEBS Lett. 1982, 144, 226–230. [Google Scholar] [CrossRef]
  3. Vieyra, A.; Nachbin, L.; de Dios-Abad, E.; Goldfeld, M.; Meyer-Fernandes, J.R.; de Moraes, L. Comparison between calcium transport and adenosine triphosphatase activity in membrane vesicles derived from rabbit kidney proximal tubules. J. Biol. Chem. 1986, 261, 4247–4255. [Google Scholar] [CrossRef] [PubMed]
  4. Suki, W.N. Calcium transport in the nephron. Am. J. Physiol. 1979, 237, F1–F6. [Google Scholar] [CrossRef] [PubMed]
  5. Niggli, V.; Sigel, E. Anticipating antiport in P-type ATPases. Trends Biochem. Sci. 2008, 33, 156–160. [Google Scholar] [CrossRef]
  6. Gmaj, P.; Zurini, M.; Murer, H.; Carafoli, E. A high-affinity, calmodulin-dependent Ca2+ pump in the basal-lateral plasma membranes of kidney cortex. Eur. J. Biochem. 1983, 136, 71–76. [Google Scholar] [CrossRef]
  7. Pedersen, P.L. Transport ATPases into the year 2008: A brief overview related to types, structures, functions and roles in health and disease. J. Bioenerg. Biomembr. 2007, 39, 349–355. [Google Scholar] [CrossRef]
  8. Guimarães-Motta, H.; Sande-Lemos, M.P.; de Meis, L. Energy interconversion in sarcoplasmic reticulum vesicles in the presence of Ca2+ and Sr2+ gradients. J. Biol. Chem. 1984, 259, 8699–8705. [Google Scholar] [CrossRef]
  9. Glynn, I.M.; Chappell, J.B. A simple method for the preparation of 32P-labelled adenosine triphosphate of high specific activity. Biochem. J. 1964, 90, 147–149. [Google Scholar] [CrossRef]
  10. Fabiato, A.; Fabiato, F. Calculation programs for computing the composition of the solutions containing multiple metals and ligands used for experiments in skinned muscle cells. J. Physiol. 1979, 75, 463–505. [Google Scholar]
  11. Sorenson, M.M.; Coelho, H.S.; Reuben, J.P. Caffeine inhibition of calcium accumulation by the sarcoplasmic reticulum in mammalian skinned fibers. J. Membr. Biol. 1986, 90, 219–230. [Google Scholar] [CrossRef] [PubMed]
  12. Grassl, S.M.; Aronson, P.S. Na+/HCO3 co-transport in basolateral membrane vesicles isolated from rabbit renal cortex. J. Biol. Chem. 1986, 261, 8778–8783. [Google Scholar] [CrossRef] [PubMed]
  13. Lowry, O.H.; Rosebrough, N.J.; Farr, A.L.; Randal, R.J. Protein measurement with the Folin phenol reagent. J. Biol. Chem. 1951, 193, 265–275. [Google Scholar] [CrossRef]
  14. Martonosi, A.; Feretos, R. Sarcoplasmic Reticulum I. The uptake of Ca2+ by Sarcoplasmic reticulum fragments. J. Biol. Chem. 1964, 239, 648–658. [Google Scholar] [CrossRef] [PubMed]
  15. Grubmeyer, C.; Penefsky, H.S. The presence of two hydrolytic sites on beef heart mitochondrial adenosine triphosphatase. J. Biol. Chem. 1981, 256, 3718–3727. [Google Scholar] [CrossRef]
  16. Nightingale, E.R., Jr. Phenomenological theory of ion solvation. Effective radii of hydrated ions. J. Phys. Chem. 1959, 63, 1381–1387. [Google Scholar] [CrossRef]
  17. Graf, E.; Verma, A.K.; Gorski, J.P.; Lopaschuk, G.; Niggli, V.; Zurini, M.; Carafoli, E.; Penniston, J.T. Molecular properties of calcium-pumping ATPase from human erythrocytes. Biochemistry 1982, 21, 4511–4516. [Google Scholar] [CrossRef]
  18. Caride, A.J.; Rega, A.F.; Garrahan, P.J. Effects of p-nitrophenylphosphate on Ca2+ transport in inside-out vesicles from human red-cell membranes. Biochim. Biophys. Acta 1983, 734, 363–367. [Google Scholar] [CrossRef]
  19. de Meis, L.; Sorenson, M.M. ATP regulation of calcium transport in back-inhibited sarcoplasmic reticulum vesicles. Biochim. Biophys. Acta 1989, 984, 373–378. [Google Scholar] [CrossRef]
  20. Gong, D.; Chi, X.; Ren, K.; Huang, G.; Shou, G.; Yan, N.; Lei, J.; Zhou, Q. Structure of the huma plasma membrane Ca2+-ATPase 1 in complex with its obligatory subunit neuroplastin. Nat. Commun. 2018, 9, 3623. [Google Scholar] [CrossRef]
  21. Rossi, J.P.; Garrahan, P.J.; Rega, A.F. Vanadate inhibition of active Ca2+ transport across human red cell membranes. Biochem. Biophys. Acta 1981, 648, 145–150. [Google Scholar] [CrossRef] [PubMed]
  22. Williams, R.J.P. The symbiosis of metal and protein functions. Eur. J. Biochem. 1985, 150, 231–248. [Google Scholar] [CrossRef] [PubMed]
Figure 1. Time course of 90Sr2+ (A) and 45Ca2+ (B) by basolateral plasma membrane vesicles. The reaction medium contained ATP (ο), and sufficient [90Sr]SrCl2 or [45Ca]CaCl2 to give a final concentration of 10 μM free Sr2+ or 10 μM free Ca2+. Modifications of the basic medium were the absence of ATP (●), absence of MgCl2 (▲), and replacement of ATP with the non-hydrolyzable analog AMP-P-C-P (Δ). The reaction mixtures were incubated at 37 °C. Arrows indicate the addition of 10 μg/mL of the ionophore A23187. The insets show cartoons of the Sr2+ (A) and Ca2+ (B) with their respective crystal radii in Å [16] and the corresponding number of electrons.
Membranes 15 00122 g001
Figure 2. The dependence of 90Sr2+ (A) and 45Ca2+ (B) uptake by basolateral plasma membrane vesicles on ATP concentration. The reaction medium contained the ATP concentrations indicated on the abscissae, and [90Sr] SrCl2 or [45Ca] CaCl2 sufficient for a final concentration of 10 μM free Sr2+ or 10 μM free Ca2+. The reaction mixtures were incubated for 30 min at 37 °C and the rate is expressed in nmol of Sr2+ or Ca2+ accumulated per mg per min. The mean Km values were calculated from three curves obtained with different preparations. The differences between the two Km values were assessed using Student’s t-test.
Membranes 15 00122 g002
Figure 3. The dependence of 90Sr2+ (A) and 45Ca2+ uptake (B) by basolateral plasma membrane vesicles on Pi concentration. The reaction medium contained the Pi concentrations indicated on the abscissae, and [90Sr]SrCl2 (A) or [45Ca]CaCl2 (B) sufficient for a final concentration of 10 μM free Sr2+ or 10 μM free Ca2+. The reaction mixtures were incubated for 30 min at 37 °C and the rate is expressed in nmol of Sr2+ or Ca2+ accumulated per mg per min. The mean K0.5 values were calculated from three curves obtained with different preparations. Differences between the two Km values were assessed using Student’s t-test.
Membranes 15 00122 g003
Figure 4. The dependence of 90Sr2+ and 45Ca2+ uptake by basolateral plasma membrane vesicles on Sr2+ or Ca2+ concentrations. The reaction medium contained the concentrations of free Sr2+ (A) or free Ca2+ (B) indicated on the corresponding abscissa. The reaction mixtures were incubated for 30 min at 37 °C. The rates are expressed in nmol of Sr2+ or Ca2+ accumulated per mg per min. The mean K0.5 values were calculated from three curves obtained with different preparations. Differences between the two K0.5 values were assessed using Student’s t-test.
Membranes 15 00122 g004
Figure 5. The effects of unlabeled Ca addition on 90Sr uptake and of unlabeled Sr addition on 40Ca uptake. (A): Time course of 90Sr accumulation ([Sr2+] = 10 μM) in the absence of CaCl2 (O), or in the presence of 1 μM (●), 10 μM (▽), or 100 μM (▼) CaCl2. (B): Time course of 45Ca accumulation ([Ca2+] = 0.5 µM) in the absence of SrCl2 (O), or in the presence of 0.05 μM (●), 0.5 μM (▽), 5 μM (▼), 50 μM (□), or 500 μM (■) SrCl2. The reaction mixtures were incubated during the times indicated on the abscissae at 37 °C to measure the corresponding accumulation levels.
Membranes 15 00122 g005
Figure 6. The effect of vanadate on (Sr2+ + Mg2+)ATPase (A) or (Ca2++Mg2+)ATPase (B) activities from basolateral membranes. The reaction medium contained 10 µM free Sr2+ or 10 µM free Ca2+ and the vanadate concentrations indicated on the abscissae. The reaction mixtures were incubated for 30 min at 37 °C.
Membranes 15 00122 g006
Figure 7. The effect of vanadate on the uptake of 90Sr (A) or 45Ca (B) by basolateral plasma membrane vesicles. The reaction medium contained 10 µM free Sr2+ or 10 µM free Ca2+ and the vanadate concentrations indicated on the abscissae. The reaction mixtures were incubated for 30 min at 37 °C.
Membranes 15 00122 g007
Figure 8. The dependence of 90Sr2+ (A) and 45Ca2+uptake (B) by basolateral plasma membrane vesicles on medium pH. The reaction medium was adjusted to the pH values shown on the abscissae by adding HCl or Tris base and contained 10 µM free Sr2+ or 10 µM free Ca2+. The reaction mixtures were incubated for 30 min at 37 °C.
Membranes 15 00122 g008
Figure 9. The dependence of (Sr2+ + Mg2+)ATPase (A) and (Ca2+ + Mg2+)ATPase (B) activities from basolateral plasma membranes on medium pH. The reaction medium was adjusted to the pH values shown on the abscissae by adding HCl or Tris base and contained 10 µM free Sr2+ or 10 µM free Ca2+. The reaction mixtures were incubated for 30 min at 37 °C.
Membranes 15 00122 g009
Figure 10. The proposed model for Sr2+ binding to the Ca2+-binding sites of plasma membrane (Ca2+ + Mg2+)ATPase. Adapted from Ref. [20]. Left: a representation of Sr2+ binding. Right: a representation of Ca2+ binding. The coordinating residues D895, N891, E433, and M894 align to allow Sr2+ binding and access to the transmembrane channel. The figure also depicts the transmembrane domains TM4, TM5, and TM6. The view is from the cytoplasmic side. The larger radius of Sr2+ [16] perturbs its proper alignment and, consequently, the kinetic properties of its transport. Modified from Gong et al. [20] and reproduced under the terms of the Creative Common License CC BY 4.0.
Membranes 15 00122 g010
Table 1. Specificity for different energy-donor substrates in 90Sr2+ and 45Ca2+ uptake assays.
SubstratesUptake of 90Sr (%)Uptake of 45Ca (%)
ATP100100
CTP2.45.2
GTP2.71.4
ITP1.64.5
UTP1.42.7
Abbreviations: ATP: Adenosine triphosphate; CTP: Cytidine triphosphate; GTP: Guanosine triphosphate; ITP: Inosine triphosphate; UTP: Uridine triphosphate.
Disclaimer/Publisher’s Note: The statements, opinions and data contained in all publications are solely those of the individual author(s) and contributor(s) and not of MDPI and/or the editor(s). MDPI and/or the editor(s) disclaim responsibility for any injury to people or property resulting from any ideas, methods, instructions or products referred to in the content.

