
Effect of Seasonal Variation during Annual Cyclist Training on Somatic Function, White Blood Cells Composition, Immunological System, Selected Hormones and Their Interaction with Irisin

 ,
,  ,
,
Abstract
:1. Introduction
2. Materials and Methods
2.1. Analytical Methods/Biochemical Determinations in Blood at Rest
2.2. Whole Blood Hematology Determinations
2.3. Immunological Parameters
2.4. Hormone Concentration
2.5. Statistical Analysis
3. Results
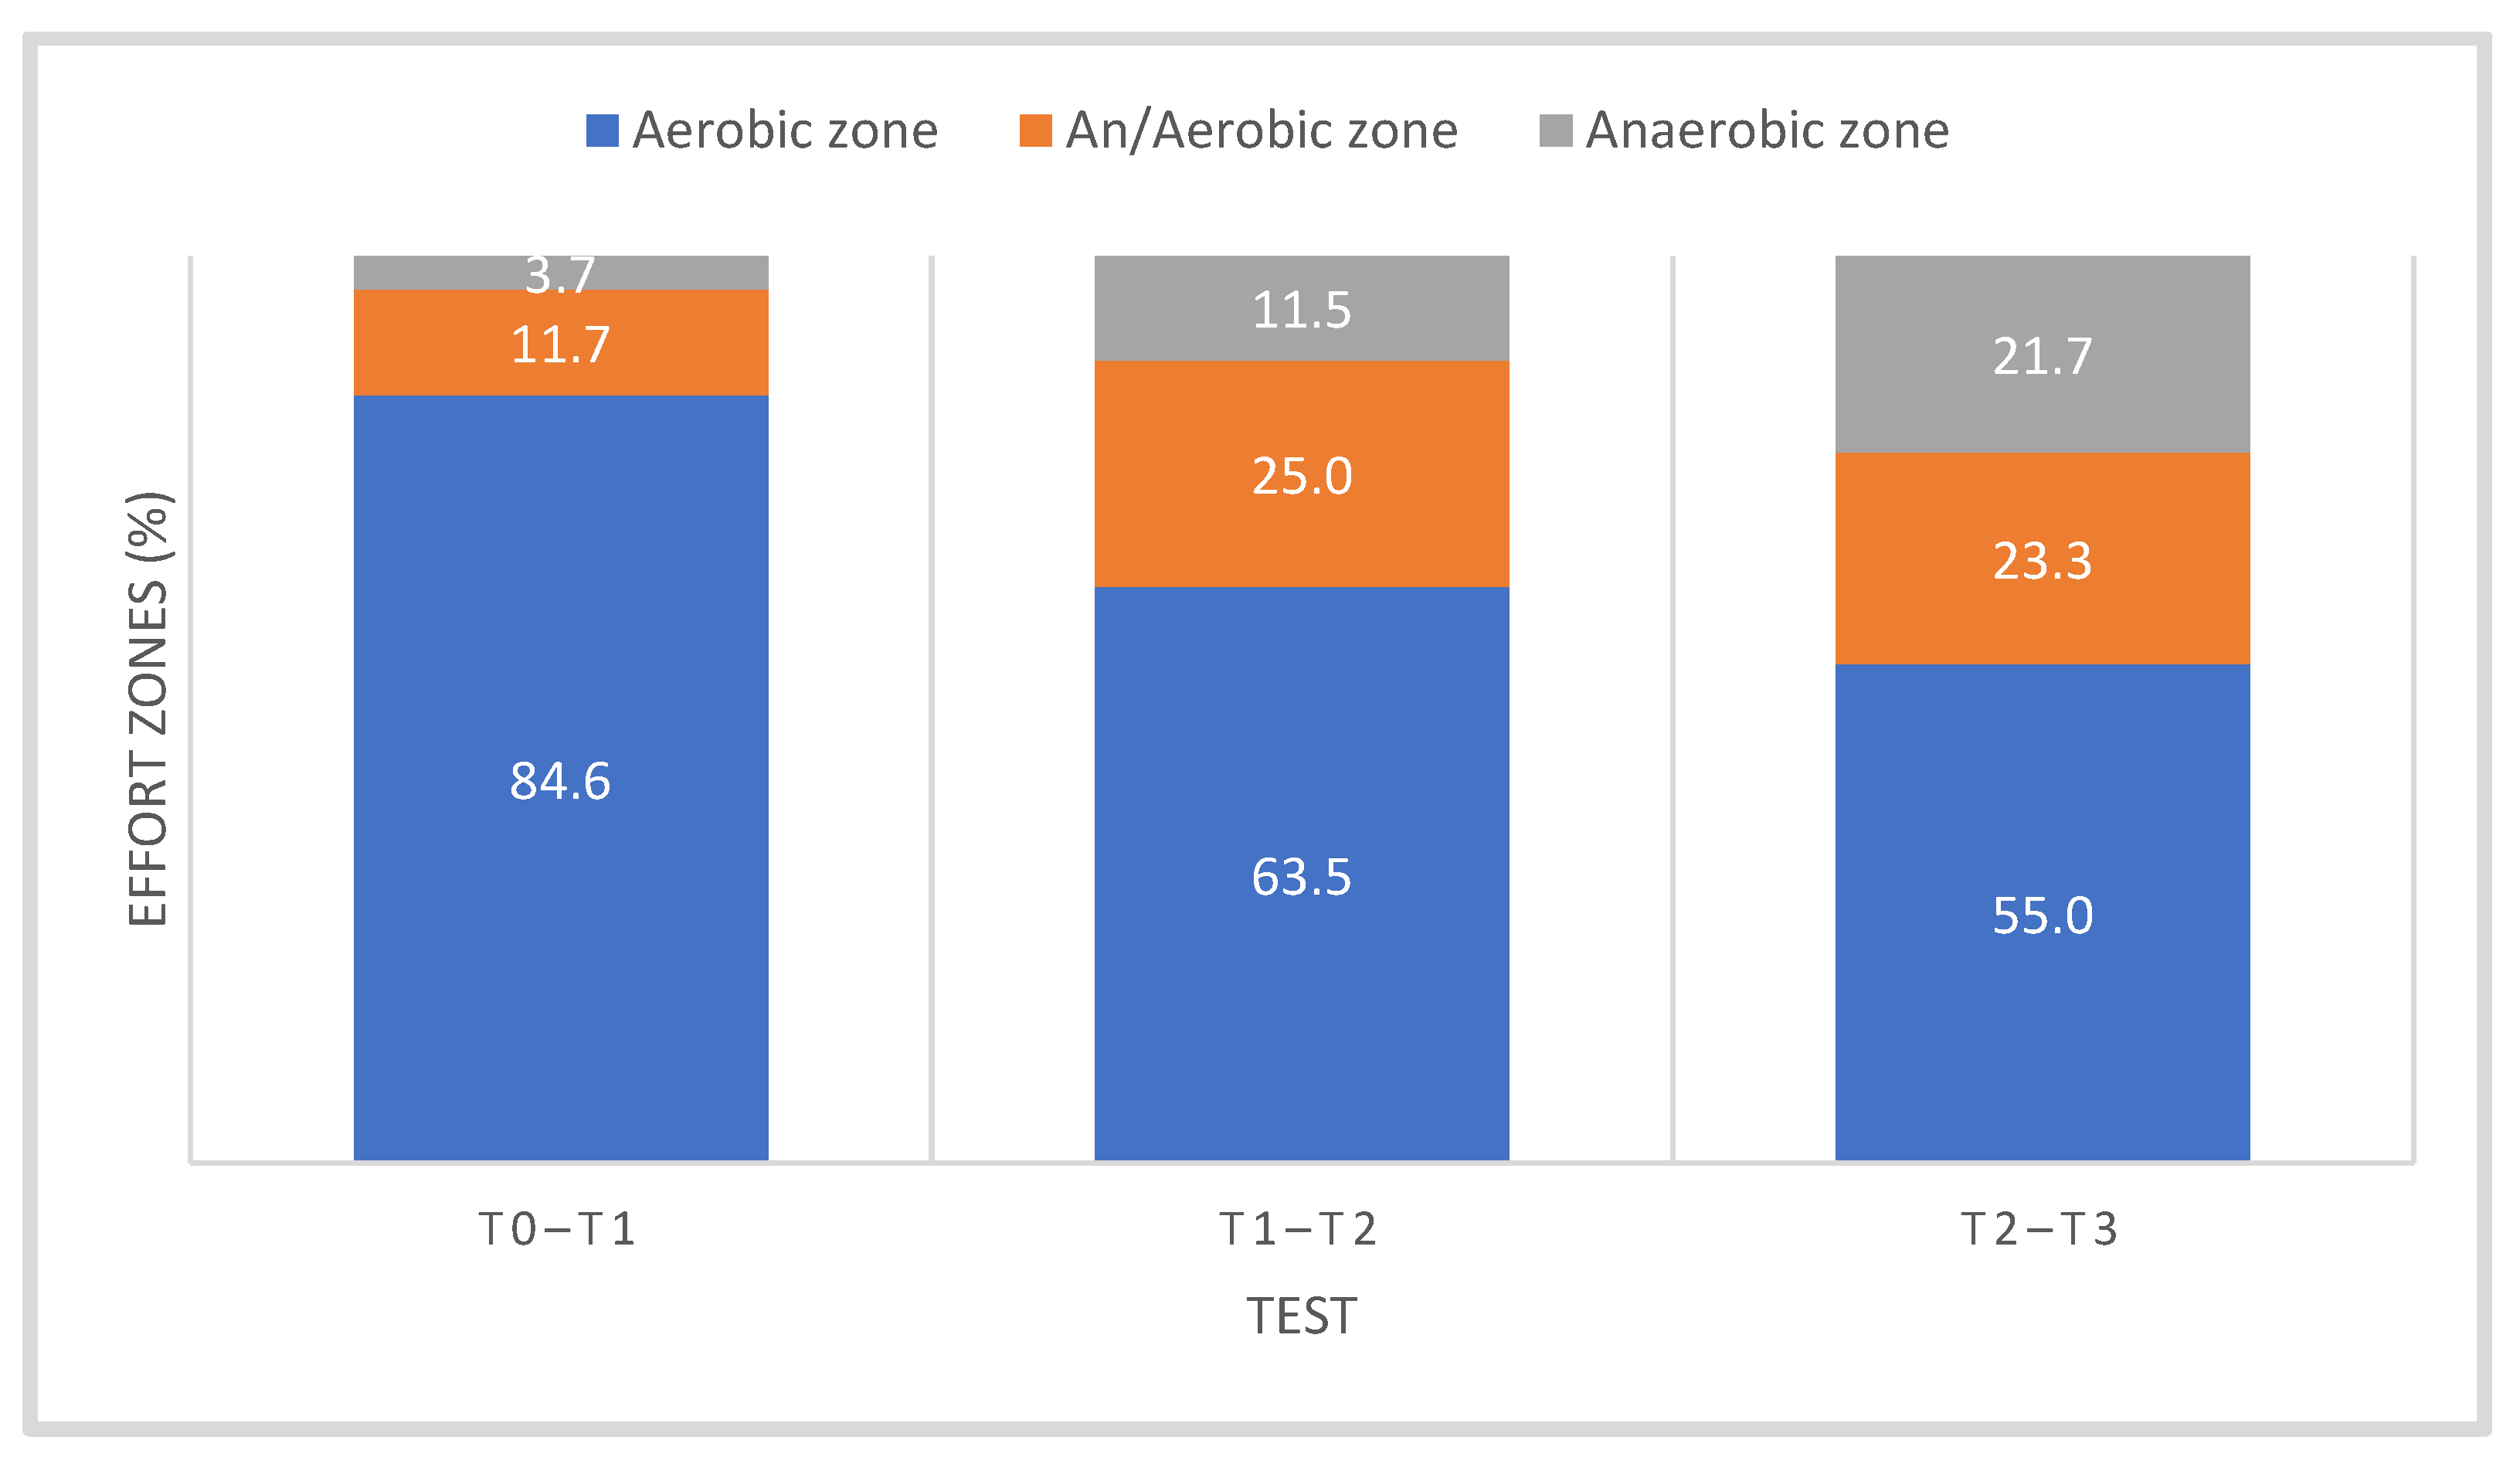
3.1. Somatic and Functional Parameters
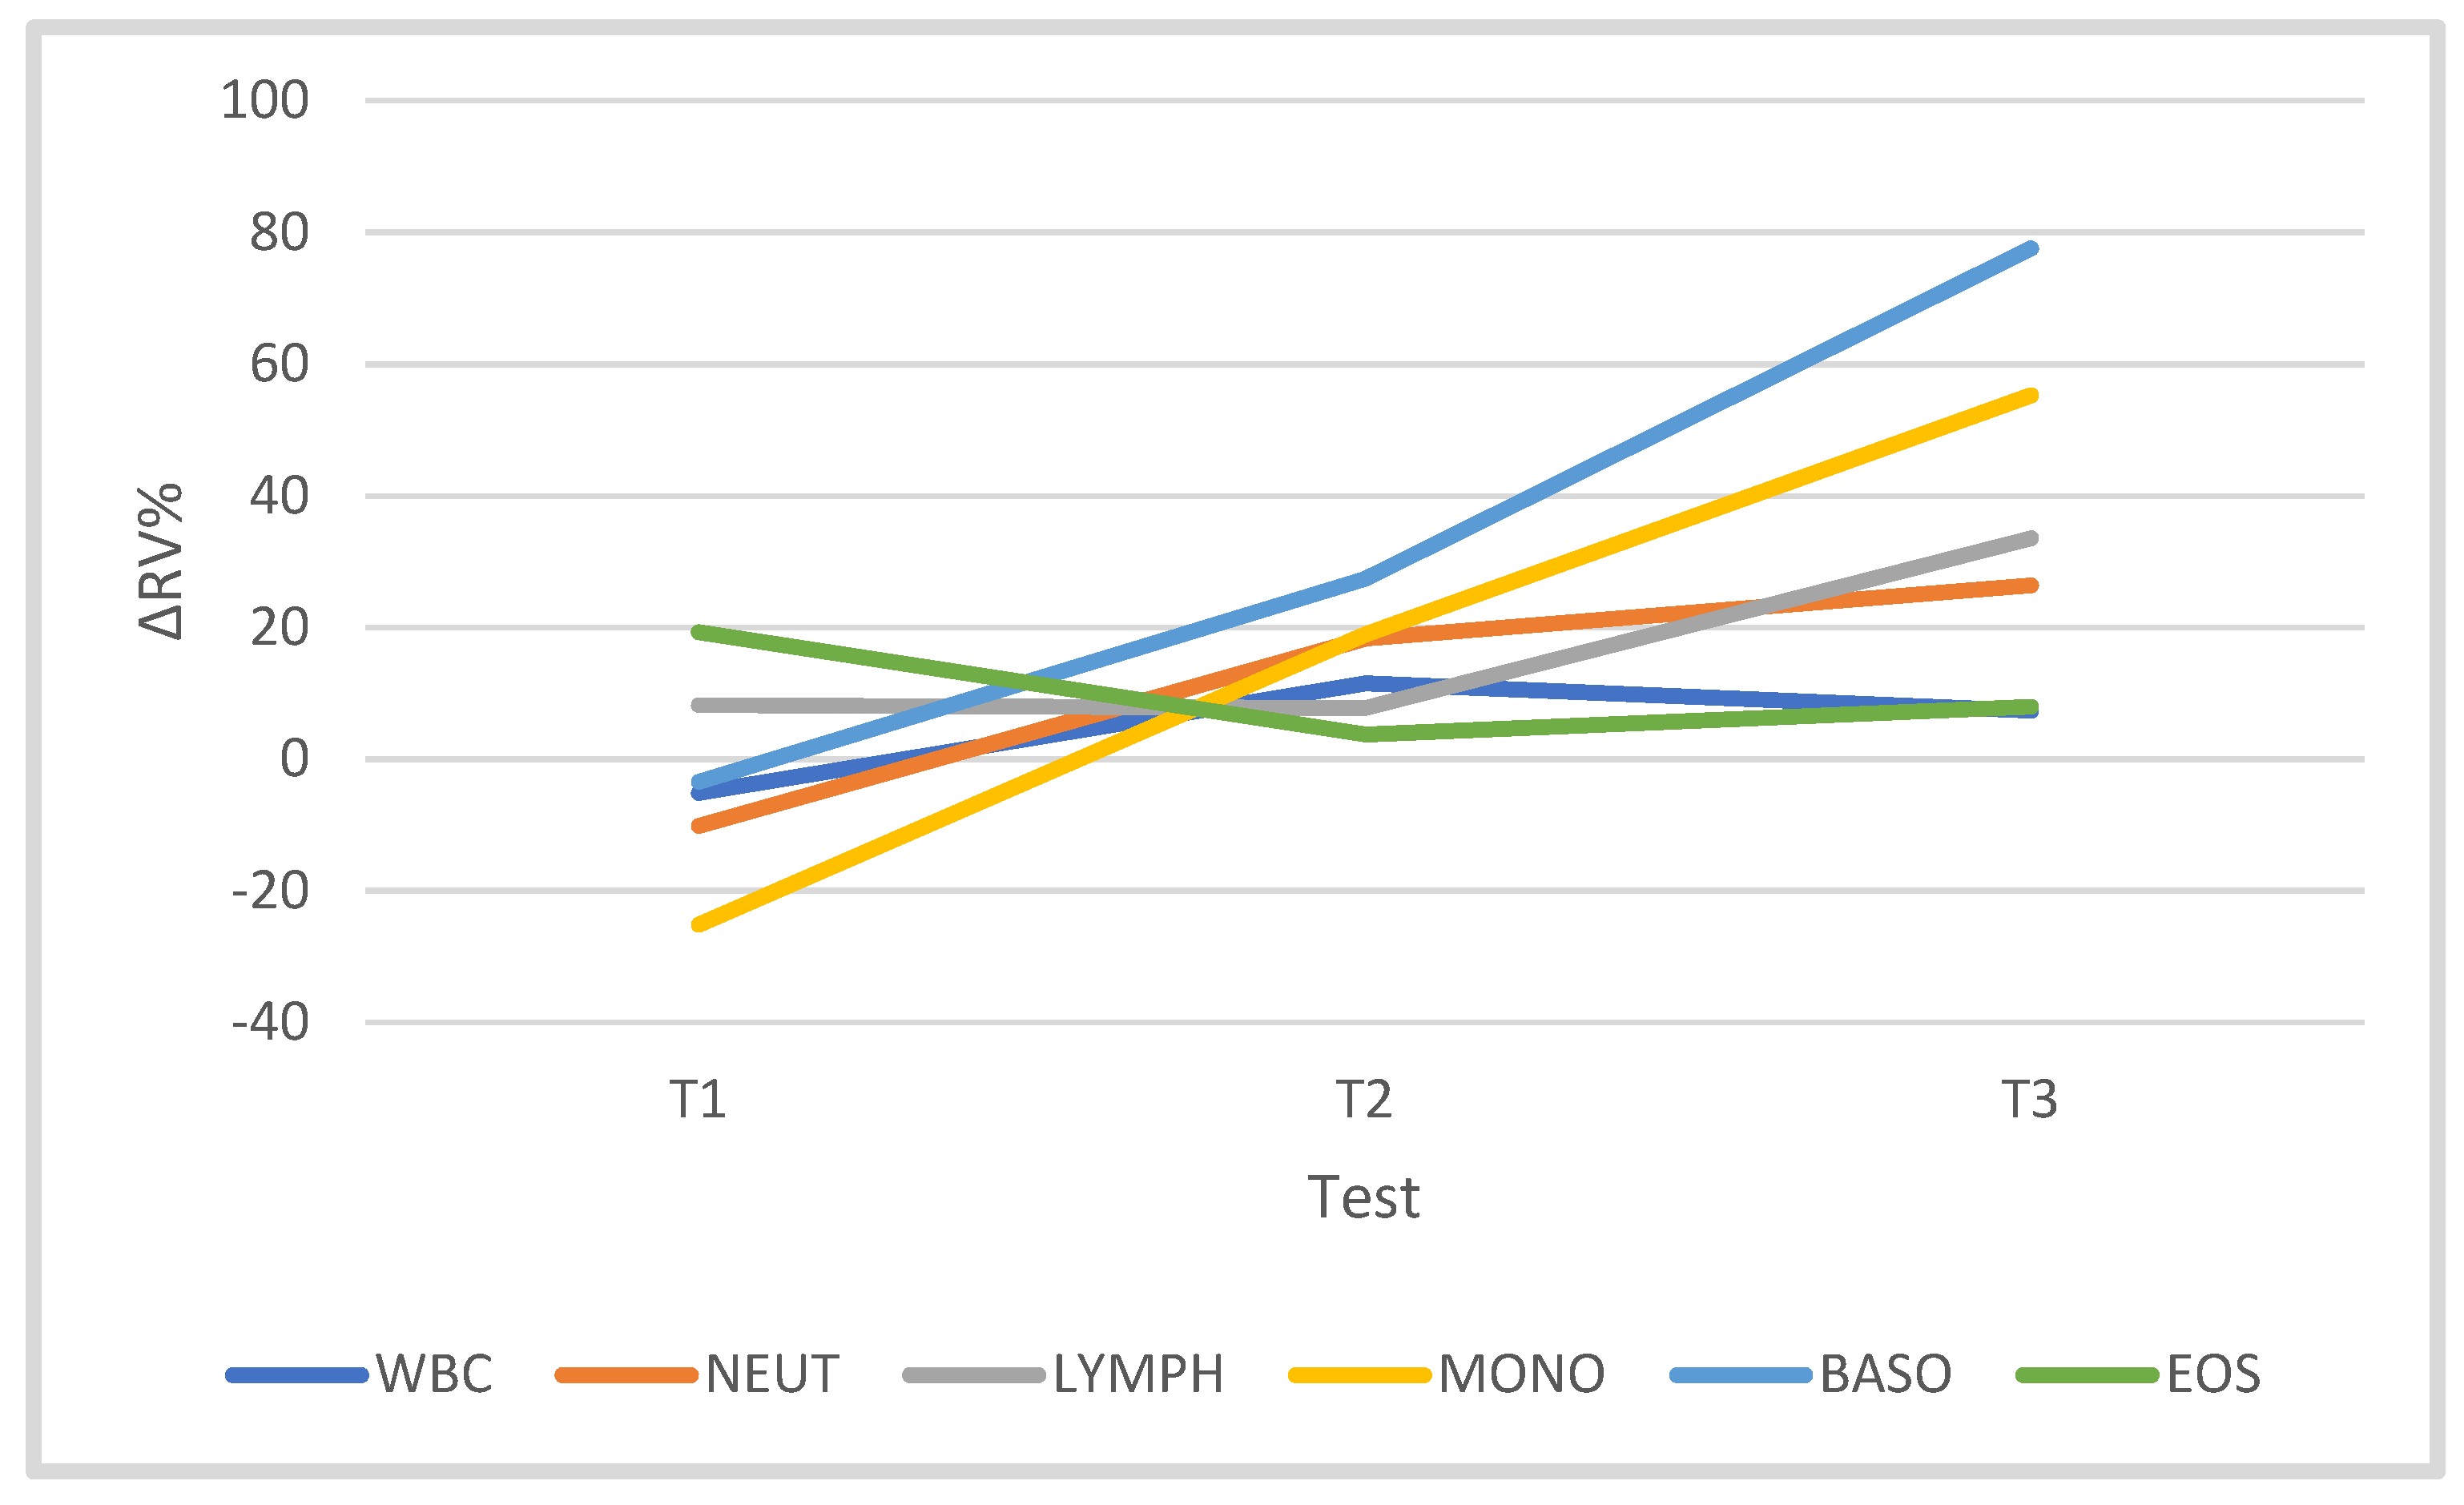
3.2. Leukocytes and Leukocyte Subsets
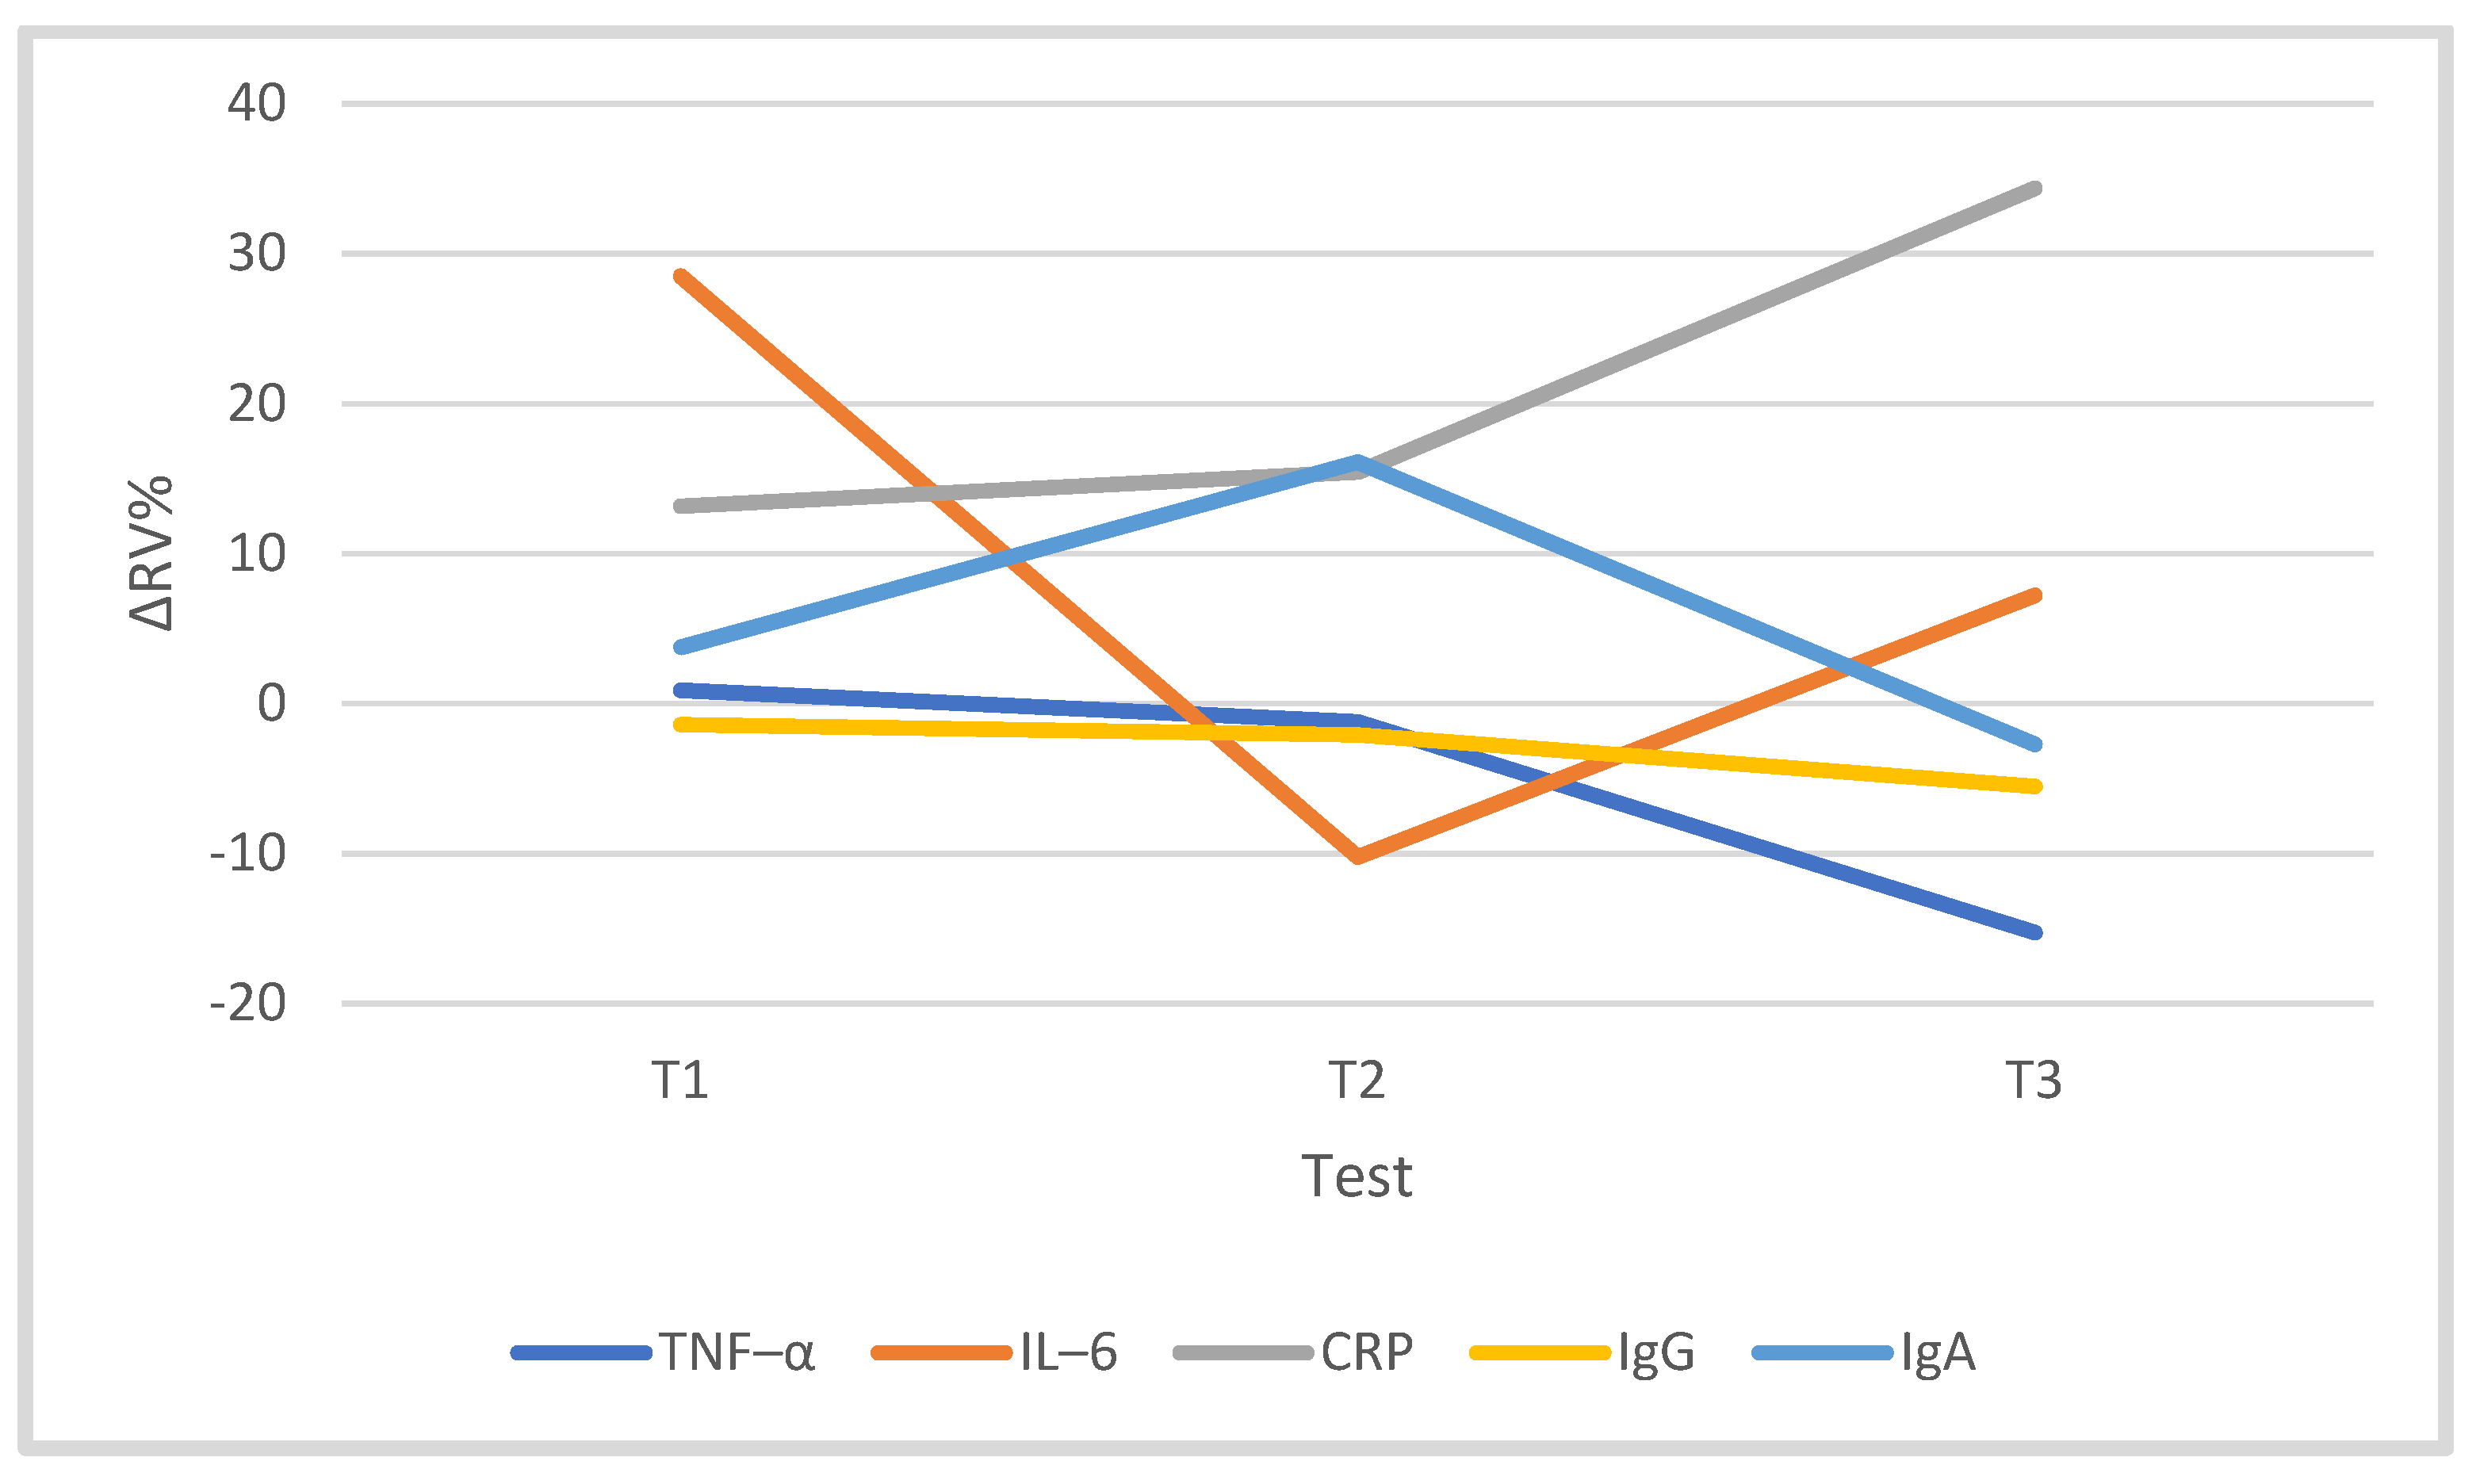
3.3. Immune System
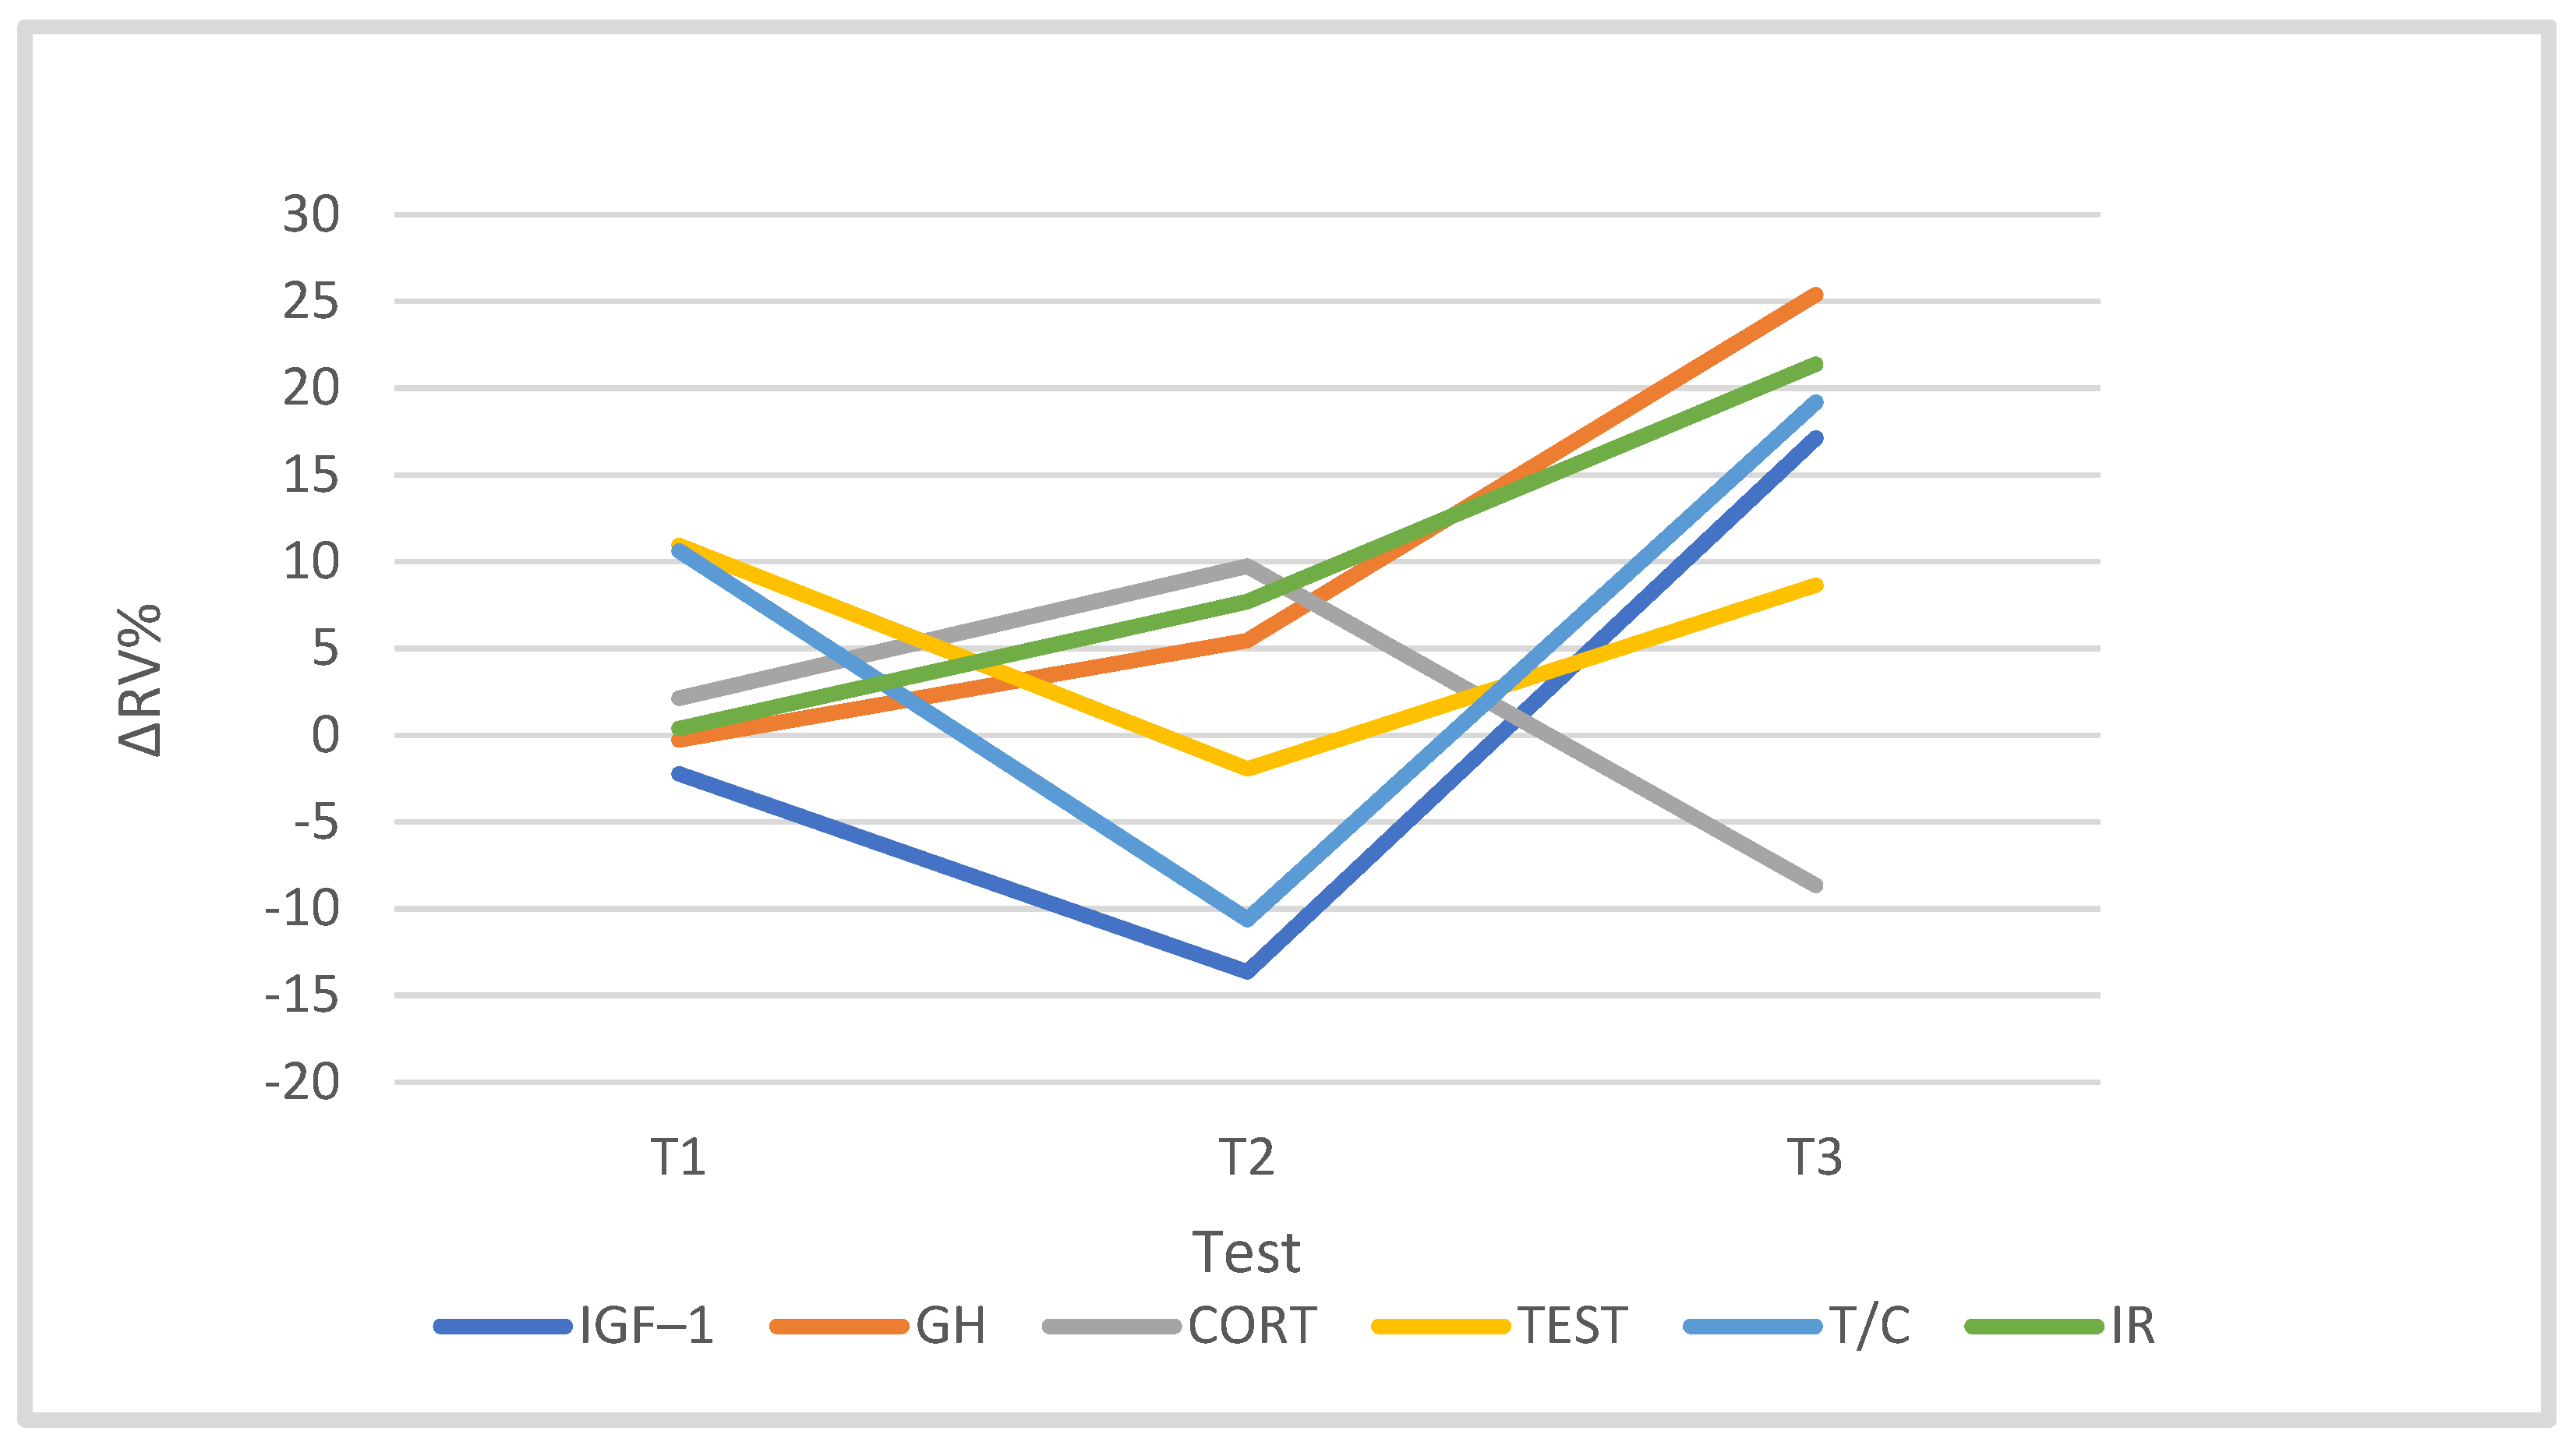
3.4. Hormones
3.5. The Strength of the Relationship between Training Load and the Studied Variables
4. Discussion
4.1. Somatic, Functional and Biochemical Changes during the Training Macrocycle
4.2. The White Blood Cell System and Selected Indicators of the Immune System in the Cyclists’ Training Macrocycle
4.3. The Concentration of Selected Hormones in the Training Macrocycle
4.4. Irisin Concentration in the Training Process (Macrocycle)
4.5. Limitations
5. Conclusions
Author Contributions
Funding
Institutional Review Board Statement
Informed Consent Statement
Data Availability Statement
Conflicts of Interest
References
- Sørensen, A.; Aune, T.K.; Rangul, V.; Dalen, T. The Validity of Functional Threshold Power and Maximal Oxygen Uptake for Cycling Performance in Moderately Trained Cyclists. Sports 2019, 7, 217. [Google Scholar] [CrossRef] [Green Version]
- Midgley, A.; Mcnaughton, L.; Jones, A. Training to Enhance the Physiological Determinants of Long-Distance Running Performance. Sports Med. 2007, 37, 857–880. [Google Scholar] [CrossRef] [PubMed]
- Neufer, P.D. The effect of detraining and reduced training on the physiological adaptations to aerobic exercise training. Sports Med. 1989, 8, 302–320. [Google Scholar] [CrossRef]
- Rietjens, G.J.M.; Keizer, H.A.; Kuipers, H.; Saris, W.H. A reduction in training volume and intensity for 21 days does not impair performance in cyclists. Br. J. Sports Med. 2001, 35, 431–434. [Google Scholar] [CrossRef] [PubMed] [Green Version]
- Gibala, M.J.; MacDougall, J.D.; Sale, D.G. The effects of tapering on strength performance in trained athletes. Int. J. Sports Med. 1994, 15, 492–497. [Google Scholar] [CrossRef] [PubMed]
- Blalock, J.E. Production of peptide hormones and neurotransmitters by the immune system. Neuroimmunoendocrinology 1992, 52, 1–24. [Google Scholar] [CrossRef]
- McLean, B.D.; Coutts, A.J.; Kelly, V.; McGuigan, M.R.; Cormack, S.J. Neuromuscular, endocrine, and perceptual fatigue responses during different length between-match microcycles in professional rugby league players. Int. J. Sports Physiol. Perform. 2010, 5, 367–383. [Google Scholar] [CrossRef] [Green Version]
- Pedersen, B.K. Muscles and their myokines. J. Exp. Biol. 2011, 214, 337–346. [Google Scholar] [CrossRef] [PubMed] [Green Version]
- Jürimäe, J.; Mäestu, J.; Jürimäe, T.; Mangus, B.; von Duvillard, S.-P. Peripheral signals of energy homeostasis as possible markers of training stress in athletes: A review. Metabolism 2011, 335–350. [Google Scholar] [CrossRef]
- Płoszczyca, K.; Foltyn, J.; Goliniewski, J.; Krężelok, J.; Poprzęcki, S.; Ozimek, M.; Czuba, M. Seasonal changes in gross efficiency and aerobic capacity in well-trained road cyclists. Isokinet. Exerc. Sci. 2019, 27, 193–202. [Google Scholar] [CrossRef]
- Ferrari, S.; Libanati, C.; Lin Fang, C.J.; Brown, J.P.; Cosman, F.; Czerwiński, E.; de Gregόrio, L.H.; Malouf-Sierra, J.; Reginster, J.-Y.; Wang, A.; et al. Relationship Between Bone Mineral Density T-Score and Nonvertebral Fracture Risk Over 10 Years of Denosumab Treatment. JBMR 2019. [Google Scholar] [CrossRef] [Green Version]
- Ferrari, H.G.; Gobatto, C.A.; Manchado-Gobatto, F.B. Training load, immune system, upper respiratory symptoms and performance in well-trained cyclists throughout a competitive season. Biol. Sport 2013, 30, 289–294. [Google Scholar] [CrossRef] [PubMed]
- Leonardo-Mendonça, R.C.; Concepción-Huertas, M.; Zabala, M.; Escames, G.; Acuña-Castroviejo, D. Redox status and antioxidant response in professional cyclists during training. Eur. J. Sport Sci. 2014, 14, 830–838. [Google Scholar] [CrossRef] [PubMed]
- Muńoz, D.; Olcina, G.; Robles, M.C.; Timon, R.; Caballero, M.J.; Maynard, M. Effect of different exercise intensities on oxidative stress markers and antioxidant response in trained cyclists. J. Sports Med. Phys. Fitness. 2010, 50, 93–98. [Google Scholar]
- Bortoluzzi, S.; Scannapieco, P.; Cestaro, A.; Danieli, G.A.; Schiaffino, S. Computational reconstruction of the human skeletal muscle secretome. Proteins 2006, 62, 776–792. [Google Scholar] [CrossRef]
- Kurdiova, T.; Balaz, M.; Vician, M.; Maderova, D.; Vlcek, M.; Valkovic, L.; Srbecky, M.; Imrich, R.; Kyselovicova, O.; Belan, V.; et al. Effects of obesity, diabetes and exercise on Fndc5 gene expression and irisin release in human skeletal muscle and adipose tissue: In vivo and in vitro studies. J. Physiol. 2014, 592, 1091–1107. [Google Scholar] [CrossRef] [PubMed]
- Arias-Loste, M.T.; Ranchal, I.; Romero-Gómez, M.; Crespo, J. Irisin, a Link among Fatty Liver Disease, Physical Inactivity and Insulin Resistance. Int. J. Mol. Sci. 2014, 15, 23163–23178. [Google Scholar] [CrossRef] [PubMed] [Green Version]
- Boström, P.; Wu, J.; Jedrychowski, M.P.; Korde, A.; Ye, L.; Lo, J.C.; Rasbach, K.A.; Boström, E.A.; Choi, J.H.; Long, J.Z.; et al. A PGC1-α-dependent myokine that drives brown-fat-like development of white fat and thermogenesis. Nature 2012, 481, 463–468. [Google Scholar] [CrossRef]
- Elsen, M.; Raschke, S.; Eckel, J. Browning of white fat: Does irisin play a role in human? J. Endocrinol. 2014, 222, R25–R38. [Google Scholar] [CrossRef] [Green Version]
- Varela-Rodriguez, B.M.; Pena-Bello, L.; Juiz-Valina, P.; Vidal-Bretal, B.; Cordido, F.; Sangiao-Alvarellos, S. FNDC5 expression and circulating irisin levels are modified by diet and hormonal conditions in hypothalamus, adipose tissue and muscle. Sci. Rep. 2016, 6, 29898. [Google Scholar] [CrossRef] [PubMed] [Green Version]
- Azzu, V.; Brand, M.D. The on-off switches of the mitochondrial uncoupling proteins. Trends Biochem. Sci. 2010, 35, 298–307. [Google Scholar] [CrossRef] [PubMed] [Green Version]
- Shamim, D.; Laskowski, M. Inhibition of inflammation mediated through the tumor necrosis factor α, biochemical pathway can lead to favorable outcomes in Alzheimer disease. J. Cent. Nerv. Syst. Dis. 2017, 9, 1179573517722512. [Google Scholar] [CrossRef] [PubMed] [Green Version]
- Tsuchiya, Y.; Ando, D.; Goto, K.; Kiuchi, M.; Yamakita, M.; Koyama, K. High-intensity exercise cuses greater irisin response compared with low-intensity exercise under similar energy consumption. Tohoku J. Exp. Med. 2014, 233, 135–140. [Google Scholar] [CrossRef] [Green Version]
- Zhang, Y.; Xie, C.; Wang, H.; Foss, R.M.; Clare, M.; George, E.V.; Li, S.; Katz, A.; Cheng, H.; Ding, Y.; et al. Irisin exerts dual effects on browning and adipogenesis of human white adipocytes. Am. J. Physiol. Endocrinol. Metab. 2016, 311, E530–E541. [Google Scholar] [CrossRef] [PubMed]
- Pérez-Sotelo, D.; Roca-Rivada, A.; Baamonde, I.; Baltar, J.; Castro, A.I.; Domínguez, E.; Collado, M.; Casanueva, F.F.; Pardo, M. Lack of Adipocyte-Fndc5/Irisin Expression and Secretion Reduces Thermogenesis and Enhances Adipogenesis. Sci. Rep. 2017, 7, 16289. [Google Scholar] [CrossRef] [Green Version]
- Hecksteden, A.; Wegmann, M.; Steffen, A.; Kraushaar, J.; Morsch, A.; Ruppenthal, S.; Kaestner, L.; Meyerl, T. Irisin and exercise training in humans-results from a randomized controlled training trial. BMC Med. 2013, 11, 235. [Google Scholar] [CrossRef] [Green Version]
- Norheim, F.; Langleite, T.M.; Hjorth, M.; Holen, T.; Kielland, A.; Stadheim, H.K.; Gulseth, H.L.; Birkeland, K.I.; Jensen, J.; Drevon, C.A. The effects of acute and chronic exercise on PGC-1α, irisin and browning of subcutaneous adipose tissue in humans. FEBS J. 2014, 281, 739–749. [Google Scholar] [CrossRef]
- Huh, J.Y.; Mougios, V.; Skraparlis, A.; Kabasakalis, A.; Mantzoros, C.S. Irisin in response to acute and chronic whole-body vibration exercise in humans. Metabolism 2014, 63, 918–921. [Google Scholar] [CrossRef]
- Nygaard, H.; Slettaløkken, G.; Vegge, G.; Hollan, I.; Whist, J.E.; Strand, T.; Rønnestad, B.R.; Ellefsen, S. Irisin in blood increases transiently after single sessions of intense endurance exercise and heavy strength training. PLoS ONE 2015, 10, e0121367. [Google Scholar] [CrossRef]
- Choi, S.J. Differential susceptibility on myosin heavy chain isoform following eccentric-induced muscle damage. J. Exerc. Rehabil. 2014, 10, 344–348. [Google Scholar] [CrossRef] [PubMed] [Green Version]
- Tsuchiya, Y.; Mizuno, S.; Goto, K. Irisin response to downhill running exercise in humans. J. Exerc. Nutr. Biochem. 2018, 22, 12–17. [Google Scholar] [CrossRef]
- Stengel, A.; Hofmann, T.; Goebel-Stengel, M.; Elbelt, U.; Kobelt, P.; Klapp, B.F. Circulating levels of irisin in patients with anorexia nervosa and different stages of obesity. Correlation with body mass index. Peptides 2013, 39, 125–130. [Google Scholar] [CrossRef]
- Chen, N.; Li, Q.; Liu, J.; Jia, S. Irisin, an exercise-induced myokine as a metabolic regulator: An updated narrative review. Diabetes Metab. Res. Rev. 2016, 32, 51–59. [Google Scholar] [CrossRef]
- Buege, J.A.; Aust, S.D. Microsomal lipid peroxidation. Methods Enzym. 1978, 52, 302–310. [Google Scholar] [CrossRef]
- Swain, D.P. The influence of body mass in endurance bicycling. Med. Sci. Sports Exerc. 1994, 26, 58–63. [Google Scholar] [CrossRef]
- Khan, F.Y. Rhabdomyolysis: A review of the literature. Neth. J. Med. 2009, 67, 272–283. [Google Scholar] [PubMed]
- Brancaccio, P.; Maffulli, N.; Limongelli, F.M. Creatine kinase monitoring in sport medicine. Br. Med. Bull. 2007, 81, 209–230. [Google Scholar] [CrossRef]
- Baird, M.F.; Graham, S.M.; Baker, J.S.; Bickerstaff, G.F. Creatine-kinase and exercise-related muscle damage; Implications for muscle performance and recovery. J. Nutr. Metabol. 2012. [Google Scholar] [CrossRef] [PubMed] [Green Version]
- Lutosławska, G.; Pośniak, J.; Hubner-Woźniak, E.; Sitkowski, D. Exercise induced changes in plasma creatine kinase activity, blood glucose and lactate concentrations in speed skaters throughout their annual training cycle. Biol. Sport 1998, 15, 9–17. [Google Scholar]
- Banake, R.; Leithäuser, R.M.; Ochenrtel, O. Blood Lactate Diagnostics in Exercise Testing and Training. Int. J. Sports Physiol. 2011, 6, 8–24. [Google Scholar] [CrossRef] [Green Version]
- Finaud, J.; Lac, G.; Filaire, E. Oxidative stress: Relationship with exercise and training. Sports Med. 2006, 36, 327–358. [Google Scholar] [CrossRef]
- Nemes, R.; Koltai, E.; Taylor, A.W.; Suzuki, K. Reactive Oxygen and Nitrogen Species Regulate Key Metabolic, Anabolic, and Catabolic Pathways in Skeletal Muscle. Antioxidants 2018, 7, 85. [Google Scholar] [CrossRef] [Green Version]
- Gleeson, M. Immune system adaptation in elite athletes. Curr. Opin. Clin. Nutr. Metab. Care 2006, 9, 659–665. [Google Scholar] [CrossRef]
- Gleeson, M. Immune function in sport and exercise. J. Appl. Physiol. 2007, 103, 693–699. [Google Scholar] [CrossRef] [Green Version]
- Horn, P.L.; Pyne, D.B.; Hopkins, W.G.; Barnes, C.J. Lower white blood cell counts in elite athletes training for highly aerobic sports. Eur. J. Appl. Physiol. 2010, 110, 925–932. [Google Scholar] [CrossRef] [PubMed]
- Cosgrove, C.; Galloway, S.D.; Neal, C.; Hunter, A.M.; McFarlin, B.K.; Spielmann, G.; Simpson, R.J. The impact of 6-month training preparation for an ironman triathlon, on the proportions o naive, memory and senescent T cells in resting blood. Eur. J. Physiol. 2012, 112, 2989–2998. [Google Scholar] [CrossRef] [PubMed]
- Córdova, A.; Surerda, A.; Tur, J.A.; Pons, A. Immune response exercise in elite sportsmen during the competitive season. J. Physiol. Biochem. 2010, 66, 1–6. [Google Scholar] [CrossRef] [PubMed]
- Villa, G.; Córdova, A.; Avila, C.; Almar, M.; Marroyo, J.A.; García, J.; del Villar, V. Modifications of the leukocytes in professional cyclists throughout the competition. Rev. Clin. Esp. 2003, 203, 412–416. [Google Scholar] [CrossRef]
- Park, C.H.; Park, T.G.; Kim, T.U.; Kwak, Y.S. Changes of immunological markers in elite and amateur triathletes. Int. Sport Med. J. 2008, 9, 116–130. [Google Scholar]
- Salamat, K.M.; Azarbayjani, M.A.; Yusof, A.; Dehghan, F. The response of pre-inflammatory cytokines factors to different exercises (endurance, resistance, concurrent) in overweight men. Alex. J. Med. 2016, 52, 367–370. [Google Scholar] [CrossRef]
- Libardi, C.A.; de Sousa, G.; Ciavaglia, C.; Madruga, V.A. Effect of resistance, endurance, and concurrent training on TNF-alpha, IL-6, and CRP. Med. Sci. Sports Exerc. 2012, 44, 50–56. [Google Scholar] [CrossRef]
- Pedersen, A.-M.; Pedersen, B.K. The anti-inflammatory effect of exercise. J. Appl. Physiol. 2005, 98, 1154–1162. [Google Scholar] [CrossRef] [PubMed] [Green Version]
- Margeli, A.; Skenderi, K.; Tsironi, M.; Hantzi, E.; Matalas, A.L.; Vrettou, C.; Kanavakis, E.; Chrousos, G.; Papassotiriou, I. Dramatic elevations of interleukin-6 and acute phase reactants in athletes participating in the ultradistance foot race “Spartathlon”: Severe systemic inflammation and lipid and lipoprotein changes in protracted exercise. J. Clin. Endocrinol. Metab. 2005, 90, 3914–3918. [Google Scholar] [CrossRef] [PubMed] [Green Version]
- Steensberg, A.; van Hall, G.; Osada, T.; Sacchetti, M.; Saltin, B.; Pedersen, B.K. Production of interleukin-6 in contracting human skeletal muscles can account for the exercise-induced increase in plasma interleukin-6. J. Physiol. 2000, 529 Pt 1, 237–242. [Google Scholar] [CrossRef]
- Steensberg, A.; Keller, C.; Starkie, R.L.; Osada, T.; Febbraio, M.A.; Pedersen, B.K. IL-6 and TNF-alpha expression in, and release from, contracting human skeletal muscle. Am. J. Physiol. Endocrinol. Metab. 2002, 283, E1272–E1278. [Google Scholar] [CrossRef] [PubMed] [Green Version]
- Fischer, C.P.; Plomgaard, P.; Hansen, A.K.; Pilegaard, H.; Saltin, B.; Pedersen, B.K. Endurance training reduces the contraction-induced interleukin-6 mRNA expression in human skeletal muscle. Am. J. Physiol. Endocrinol. Metab. 2004, 287, E1189–E1194. [Google Scholar] [CrossRef] [PubMed]
- Beavers, K.M.; Brinkley, T.E.; Nicklas, B.J. Effect of exercise training on chronic inflammation. Clin. Chim. Acta 2010, 411, 785–793. [Google Scholar] [CrossRef] [Green Version]
- Gleeson, M.; Mc Donald, W.A.; Cripps, A.W.; Pyne, D.B.; Clancy, R.L.; Fricker, P.A. The effect on immunity of long-term intensive training in elite swimmers. Clin. Exp. Immunol. 1995, 102, 210–216. [Google Scholar] [CrossRef]
- Pedersen, B.K.; Febbraio, M.A. Muscles, exercise and obesity: Skeletal muscle as a secretory organ. Nat. Rev. Endocrinol. 2012, 8, 457–465. [Google Scholar] [CrossRef]
- Kraemer, W.J.; Fragala, M.S.; Watson, G.; Volek, J.S.; Rubin, M.R.; French, D.N.; Evans, D.S. Hormonal responses to a 160-km race across frozen Alaska. Brit. J. Sports Med. 2008, 42, 116–120. [Google Scholar] [CrossRef]
- Filaire, E.; Legrand, B.; Bret, K.; Sagnol, M.; Cottet-Emard, J.M.; Pequignot, J.M. Psychobiologic responses to 4 days of increased training and recovery in cyclists. Int. J. Sports Med. 2002, 23, 588–594. [Google Scholar] [CrossRef] [PubMed]
- Lucia, A.; Diaz, B.; Hoyos, J.; Fernandez, C.; Villa, G.; Bandres, F.; Chicharro, J.L. Hormone levels of world class cyclists during the tour of Spain stage race. Brit. J. Sports Med. 2001, 35, 424–430. [Google Scholar] [CrossRef] [PubMed]
- Grego, F.; Vallier, J.-M.; Collardeau, M.; Bermon, S.; Ferrari, P.; Candito, M.; Brisswalter, J. Effects of long duration exercise on cognitive function, blood glucose, and counter regulatory hormones in male cyclists. Neurosci. Lett. 2004, 364, 76–80. [Google Scholar] [CrossRef]
- Fry, R.W.; Morton, A.R.; Keast, D. Overtraining in athletes. Sports Med. 1991, 12, 32–65. [Google Scholar] [CrossRef] [PubMed]
- Cadegiani, F.; Kater, C.E. Hormonal aspects of overtraining syndrome: A systematic review. BMC Sports Sci. Med. Rehabil. 2017, 9, 14. [Google Scholar] [CrossRef]
- Kraemer, W.J.; Ratamess, N.A. Hormonal responses and adaptations to resistance exercise and training. Sports Med. 2005, 35, 339–361. [Google Scholar] [CrossRef]
- Linnamo, V.; Pakarinen, A.; Komi, P.V.; Kraemer, W.J.; Häkkinen, K. Acute hormonal responses to submaximal and maximal heavy resistance and explosive exercise in men and women. J. Strenght Cond. Res. 2005, 19, 566–571. [Google Scholar] [CrossRef]
- Daskalopoulos, P.; Evangelos, C.M.; Hermans, K.; Blankesteijn, M.W. Cardiac (myo)fibroblast: Novel Strategies for its Targeting Following Myocardial Infarction. Curr. Pharm. Des. 2014, 20, 1987–2002. [Google Scholar] [CrossRef]
- Tsuchiya, Y.; Ando, D.; Takamatsu, K.; Goto, K. Resistance exercise induces a greater irisin response than endurance exercise. Metabolism 2015, 64, 1042–1050. [Google Scholar] [CrossRef] [PubMed]
- Jin, Y.; Sumsuzzman, D.M.; Choi, J.; Kang, H.; Lee, S.-R.; Hong, Y. Molecular and functional interaction of the myokine irisin with physical exercise and Alzheimer’s disease. Molecules 2018, 23, 3229. [Google Scholar] [CrossRef] [Green Version]
- Manabe, Y.; Miyatake, S.; Mayumi, M. Myokines: Do they really exist? J. Physiol. Fit. Sports Med. 2012, 1, 51–58. [Google Scholar] [CrossRef] [Green Version]
- Timmons, J.A.; Baar, K.; Davidsen, P.K.; Atherton, P.J. Is irisin a human exercise gene? Nature 2012, 488, E9–E10. [Google Scholar] [CrossRef] [PubMed]


| Training Period/Tests | Month | Training Volume (h) | Training Volume (km) | Aerobic Zone | Aerobic–Anaerobic Zone | Anaerobic Zone |
|---|---|---|---|---|---|---|
| TRAN (T0) | November | 49.04 ± 3.86 | 1183.00 ± 82.70 | 94 | 4 | 2 |
| PREP (T1) | December | 60.22 ± 6.29 | 1564.34 ± 116.26 | 90 | 6 | 4 |
| January | 47.25 ± 5.05 | 1433.18 ± 78.75 | 70 | 25 | 5 | |
| February | 71.91 ± 7.90 | 2001.62 ± 244.02 | 65 | 27 | 8 | |
| March | 72.09 ± 8.09 | 2101.23 ± 185.06 | 62 | 23 | 15 | |
| COMP I (T2) | April | 76.01 ± 7.55 | 2158.03 ± 103.51 | 60 | 20 | 20 |
| May | 61.90 ± 3.08 | 2212.98 ± 113.00 | 55 | 25 | 20 | |
| COMP II (T3) | June | 50.93 ± 3.52 | 2097.58 ± 117.48 | 50 | 25 | 25 |
| Variables/Period | TRAN; T0 | PREP; T1 | COMP I; T2 | COMP II; T3 | ||||
| X | S | X | S | X | S | X | S | |
| BM (kg) | 72.41 | 7.35 | 72.63 | 7.17 | 72.40 | 7.00 | 71.90 | 6.31 |
| FAT (kg) | 7.84 | 2.51 | 7.07 | 2.58 | 6.94 | 2.15 | 6.62 | 1.74 |
| FAT (%) | 10.73 | 2.78 | 9.58 | 3.04 | 9.50 | 2.53 | 9.17 * | 2.13 |
| BMI (kg/m2) | 21.94 | 1.49 | 22.02 | 1.30 | 21.91 | 1.29 | 21.79 | 1.27 |
| VO2max (mL/kg/min) | 65.78 | 3.87 | 69.56 | 4.10 | 68.74 | 4.60 | 69.67 | 1.58 |
| Biochemical variables in the annual training cycle of cyclists. Registration during the TRAN period—end of the transition period (test—T0), PREP—preparation period (test—T1), COMP I—beginning of the competition period (test—T2), COMP II—during the competition period (test—T3). | ||||||||
| Variables/Period | TRAN; T0 | PREP; T1 | COMP I; T2 | COMP II; T3 | ||||
| X | S | X | S | X | S | X | S | |
| MDA (µmol/L) | 3.54 | 1.04 | 3.56 | 1.01 | 3.80 | 0.98 | 4.03 | 2.05 |
| CK (U/L) | 149.46 | 51.32 | 128.32 | 34.08 | 168.50 | 42.02 | 116.81 # | 29.27 |
| LDH (U/L) | 303.71 | 75.00 | 289.92 | 53.55 | 347.79 | 45.02 | 306.46 | 57.51 |
| LA (mmol/L) | 1.37 | 0.30 | 1.21 | 0.28 | 1.14 | 0.24 | 1.12 | 0.20 |
| Variables/Period | TRAN; T0 | PREP; T1 | COMP I; T2 | COMP II; T3 | ||||
|---|---|---|---|---|---|---|---|---|
| X | S | X | S | X | S | X | S | |
| WBC (103/µL) | 5.52 | 1.18 | 5.12 | 0.73 | 6.11 | 1.79 | 5.80 | 0.74 |
| Lymph (103/µL) | 2.14 | 0.62 | 2.21 | 0.51 | 2.24 | 0.57 | 2.83 * | 0.74 |
| Mono (103/µL) | 0.39 | 0.09 | 0.29 * | 0.11 | 0.45 | 0.04 | 0.37 | 0.06 |
| Neut (103/µL) | 2.80 | 0.85 | 2.40 | 0.36 | 3.21 | 1.40 | 3.00 | 0.62 |
| Baso (103/µL) | 0.06 | 0.03 | 0.05 | 0.03 | 0.08 | 0.04 | 0.10 * | 0.04 |
| Eos (103/µL) | 0.15 | 0.06 | 0.17 | 0.05 | 0.15 | 0.06 | 0.14 | 0.07 |
| TNF-α (pg/mL) | 18.89 | 1.73 | 18.91 | 2.33 | 18.51 | 4.11 | 15.81 | 4.46 |
| IL-6 (pg/mL) | 0.55 | 0.34 | 0.56 | 0.18 | 0.46 | 0.24 | 0.62 | 0.53 |
| CRP (mg/dL) | 0.11 | 0.01 | 0.13 | 0.02 | 0.13 | 0.01 | 0.15 | 0.02 |
| IgG (g/L) | 9.25 | 1.89 | 9.13 | 1.93 | 9.07 | 1.97 | 8.67 | 1.71 |
| IgA (g/L) | 1.66 | 0.62 | 1.70 | 0.63 | 1.80 | 0.74 | 1.53 | 0.40 |
| IGF-1 (ng/m) | 218.38 | 61.63 | 214.84 | 74.66 | 188.20 | 68.92 | 239.52 | 36.62 |
| GH (µg/L) | 0.55 | 0.26 | 0.48 | 0.35 | 0.53 | 0.29 | 0.65 | 0.57 |
| Cort (µg/dL) | 19.62 | 5.54 | 19.46 | 3.55 | 21.04 | 4.69 | 17.49 # | 3.51 |
| Test (ng/mL) | 3.90 | 1.30 | 4.20 | 1.68 | 3.84 | 1.74 | 3.89 | 1.37 |
| T/C | 0.21 | 0.09 | 0.23 | 0.11 | 0.19 | 0.10 | 0.24 | 0.15 |
| IR (µg/mL) | 9.61 | 2.37 | 9.52 | 2.16 | 10.22 | 2.83 | 11.49 | 2.52 |
| Parameter/IR | IR T0 vs. | IR T1 vs. | IR T2 vs. | IR T3 vs. |
| BM *(T0–T3) | 0.101; p = 0.796 | −0.199; p = 0.609 | 0.174; p = 0.65 | 0.612; p = 0.080 |
| BMI (T0–T3) | 0.267; p = 0.488 | −0.211; p = 0.586 | −0.165; p = 0.671 | 0.588; p = 0.096 |
| FAT kg (T0–T3) | 0.222; p = 0.566 | 0.003; p = 0.994 | 0.228; p = 0.556 | 0.495; p = 0.176 |
| FAT% (T0–T3) | 0.264; p = 0.492 | 0.058; p = 0.882 | 0.234; p = 0.545 | 0.331; p = 0.385 |
| VO2max (T0–T3) | −0.441; p = 0.235 | −0.482; p = 0.189 | −0.101; p = 0.796 | −0.216; p = 0.578 |
| CK (T0–T3) | −0.319; p = 0.401 | −0.519; p = 0.152 | 0.353; p = 0.351 | 0.523; p = 0.148 |
| LDH (TO–T3) | −0.356; p = 0.342 | 0.448; p = 0.227 | −0.158; p = 0.685 | 0.372; p = 0.324 |
| MDA (T0–T3) | −0.035; p = 0.930 | −0.323; p = 0.397 | 0.333; p = 0.381 | 0.168; p = 0.666 |
| LA (T0–T3) | −0.163; p = 0.675 | 0.245; p = 0.525 | −0.224; p = 0.562 | 0.156; p = 0.688 |
| Pearson coefficient “r” between serum irisin (IR) level and WBC components, selected hormone concentrations and immunological factors in four stages of cyclists’ macrocycles (T0–T3). | ||||
| Parameter/IR | IR T0 vs. | IR T1 vs. | IR T2 vs. | IR T3 vs. |
| WBC (T0–T3) | −0.433; p = 0.244 | −0.418; p = 0.263 | −0.413; p = 0.269 | −0.455; p = 0.218 |
| Lymph (T0–T3) | −0.339; p = 0.372 | −0.620; p = 0.075 | −0.411; p = 0.272 | −0.269; p = 0.483 |
| Mono (T0–T3) | −0.159; p = 0.683 | −0.326; p = 0.391 | −0.111; p = 0.777 | −0.495; p = 0.176 |
| Neut (T0–T3) | −0.286; p = 0.455 | 0.105; p = 0.787 | −0.362; p = 0.38 | −0.173; p = 0.656 |
| Baso (T0–T3) | 0.011; p = 0.977 | −0.223; p = 0.564 | −0.646; p = 0.060 | −0.344; p = 0.365 |
| Eos (T0–T3) | −0.649; p = 0.058 | 0.085; p = 0.828 | 0.223; p = 0.564 | −0.177; p = 0.649 |
| Test (T0–T3) | 0.309; p = 0.418 | 0.178; p = 0.646 | −0.049; p = 0.901 | −0.238; p = 0.537 |
| Cort (T0–T3) | 0.758; p = 0.018 * | 0.304; p = 0.427 | 0.545; p = 0.129 | 0.544; p = 0.130 |
| T/C (T0–T3) | −0.220; p = 0.569 | 0.043; p = 0.913 | −0.278; p = 0.469 | −0.345; p = 0.363 |
| GH (T0–T3) | −0.230; p = 0.551 | −0.759; p = 0.018 * | −0.567; p = 0.111 | −0.527; p = 0.145 |
| IGF1 (T0–T3) | −0.417; p = 0.265 | −0.232; p = 0.548 | −0.236; p = 0.54 | −0.156; p = 0.689 |
| TNFα (T0–T3) | −0.303; p = 0.428 | 0.073; p = 0.851 | −0.559; p = 0.118 | −0.466; p = 0.206 |
| IL-6 (T0–T3) | −0.369; p = 0.328 | 0.289; p = 0.450 | 0.476; p = 0.195 | −0.053; p = 0.892 |
| CRP (T0–T3) | −0.152; p = 0.423 | 0.037; p = 0.924 | 0.00; p = 1.00 | 0.119; p = 0.761 |
| IgA (T0–T3) | −0.058; p = 0.882 | 0.203; p = 0.601 | 0.092; p = 0.813 | 0.551; p = 0.124 |
| IgG (T0–T3) | 0.325; p = 0.394 | 0.115; p = 0.768 | 0.188; p = 0.628 | 0.013; p = 0.974 |
| WBC (T0–T3) | −0.433; p = 0.244 | −0.418; p = 0.263 | −0.413; p = 0.269 | −0.455; p = 0.218 |
| Lymph (T0–T3) | −0.339; p = 0.372 | −0.620; p = 0.075 | −0.411; p = 0.272 | −0.269; p = 0.483 |
Publisher’s Note: MDPI stays neutral with regard to jurisdictional claims in published maps and institutional affiliations. |
© 2021 by the authors. Licensee MDPI, Basel, Switzerland. This article is an open access article distributed under the terms and conditions of the Creative Commons Attribution (CC BY) license (https://creativecommons.org/licenses/by/4.0/).
Share and Cite
Grzebisz-Zatońska, N.; Poprzęcki, S.; Pokora, I.; Mikołajec, K.; Kamiński, T. Effect of Seasonal Variation during Annual Cyclist Training on Somatic Function, White Blood Cells Composition, Immunological System, Selected Hormones and Their Interaction with Irisin. J. Clin. Med. 2021, 10, 3299. https://doi.org/10.3390/jcm10153299
Grzebisz-Zatońska N, Poprzęcki S, Pokora I, Mikołajec K, Kamiński T. Effect of Seasonal Variation during Annual Cyclist Training on Somatic Function, White Blood Cells Composition, Immunological System, Selected Hormones and Their Interaction with Irisin. Journal of Clinical Medicine. 2021; 10(15):3299. https://doi.org/10.3390/jcm10153299
Chicago/Turabian StyleGrzebisz-Zatońska, Natalia, Stanisław Poprzęcki, Ilona Pokora, Kazimierz Mikołajec, and Tomasz Kamiński. 2021. "Effect of Seasonal Variation during Annual Cyclist Training on Somatic Function, White Blood Cells Composition, Immunological System, Selected Hormones and Their Interaction with Irisin" Journal of Clinical Medicine 10, no. 15: 3299. https://doi.org/10.3390/jcm10153299