
Comparative Analysis of the Kinetic Behavior of Systemic Inflammatory Markers in Patients with Depressed versus Preserved Left Ventricular Function Undergoing Transcatheter Aortic Valve Implantation

 ,
,
Abstract
:1. Introduction
2. Methods
2.1. Study Population
2.2. TAVI Procedure
2.3. Inflammatory Markers
2.4. Definition Criteria for Events
2.5. Matching
2.6. Statistical Analysis
3. Results
3.1. Pre-Procedural Data
3.2. Procedural Data

| Admission | 24 h | 72 h | 6 Months | p1 | p2 | p3 | |
|---|---|---|---|---|---|---|---|
| WBC (K/μL) | 7.46 ± 2.26 | 10.08 ± 3.55 | 9 ± 2.91 | 7.47 ± 2.38 | <0.0001 | <0.0001 | 1 |
| Absolute neutrophils (K/μL) | 4.97 ± 2.06 | 8.19 ± 3.43 | 6.73 ± 2.79 | 4.89 ± 2.04 | <0.0001 | <0.0001 | 1 |
| Absolute lymphocytes (K/μL) | 1.67 ± 1.1 | 1.1 ± 0.76 | 1.29 ± 0.59 | 1.76 ± 1.09 | <0.0001 | <0.0001 | 1 |
| NLR | 3.72 ± 2.8 | 9.76 ± 7.29 | 6.52 ± 4.66 | 3.36 ± 2.23 | <0.0001 | <0.0001 | 1 |
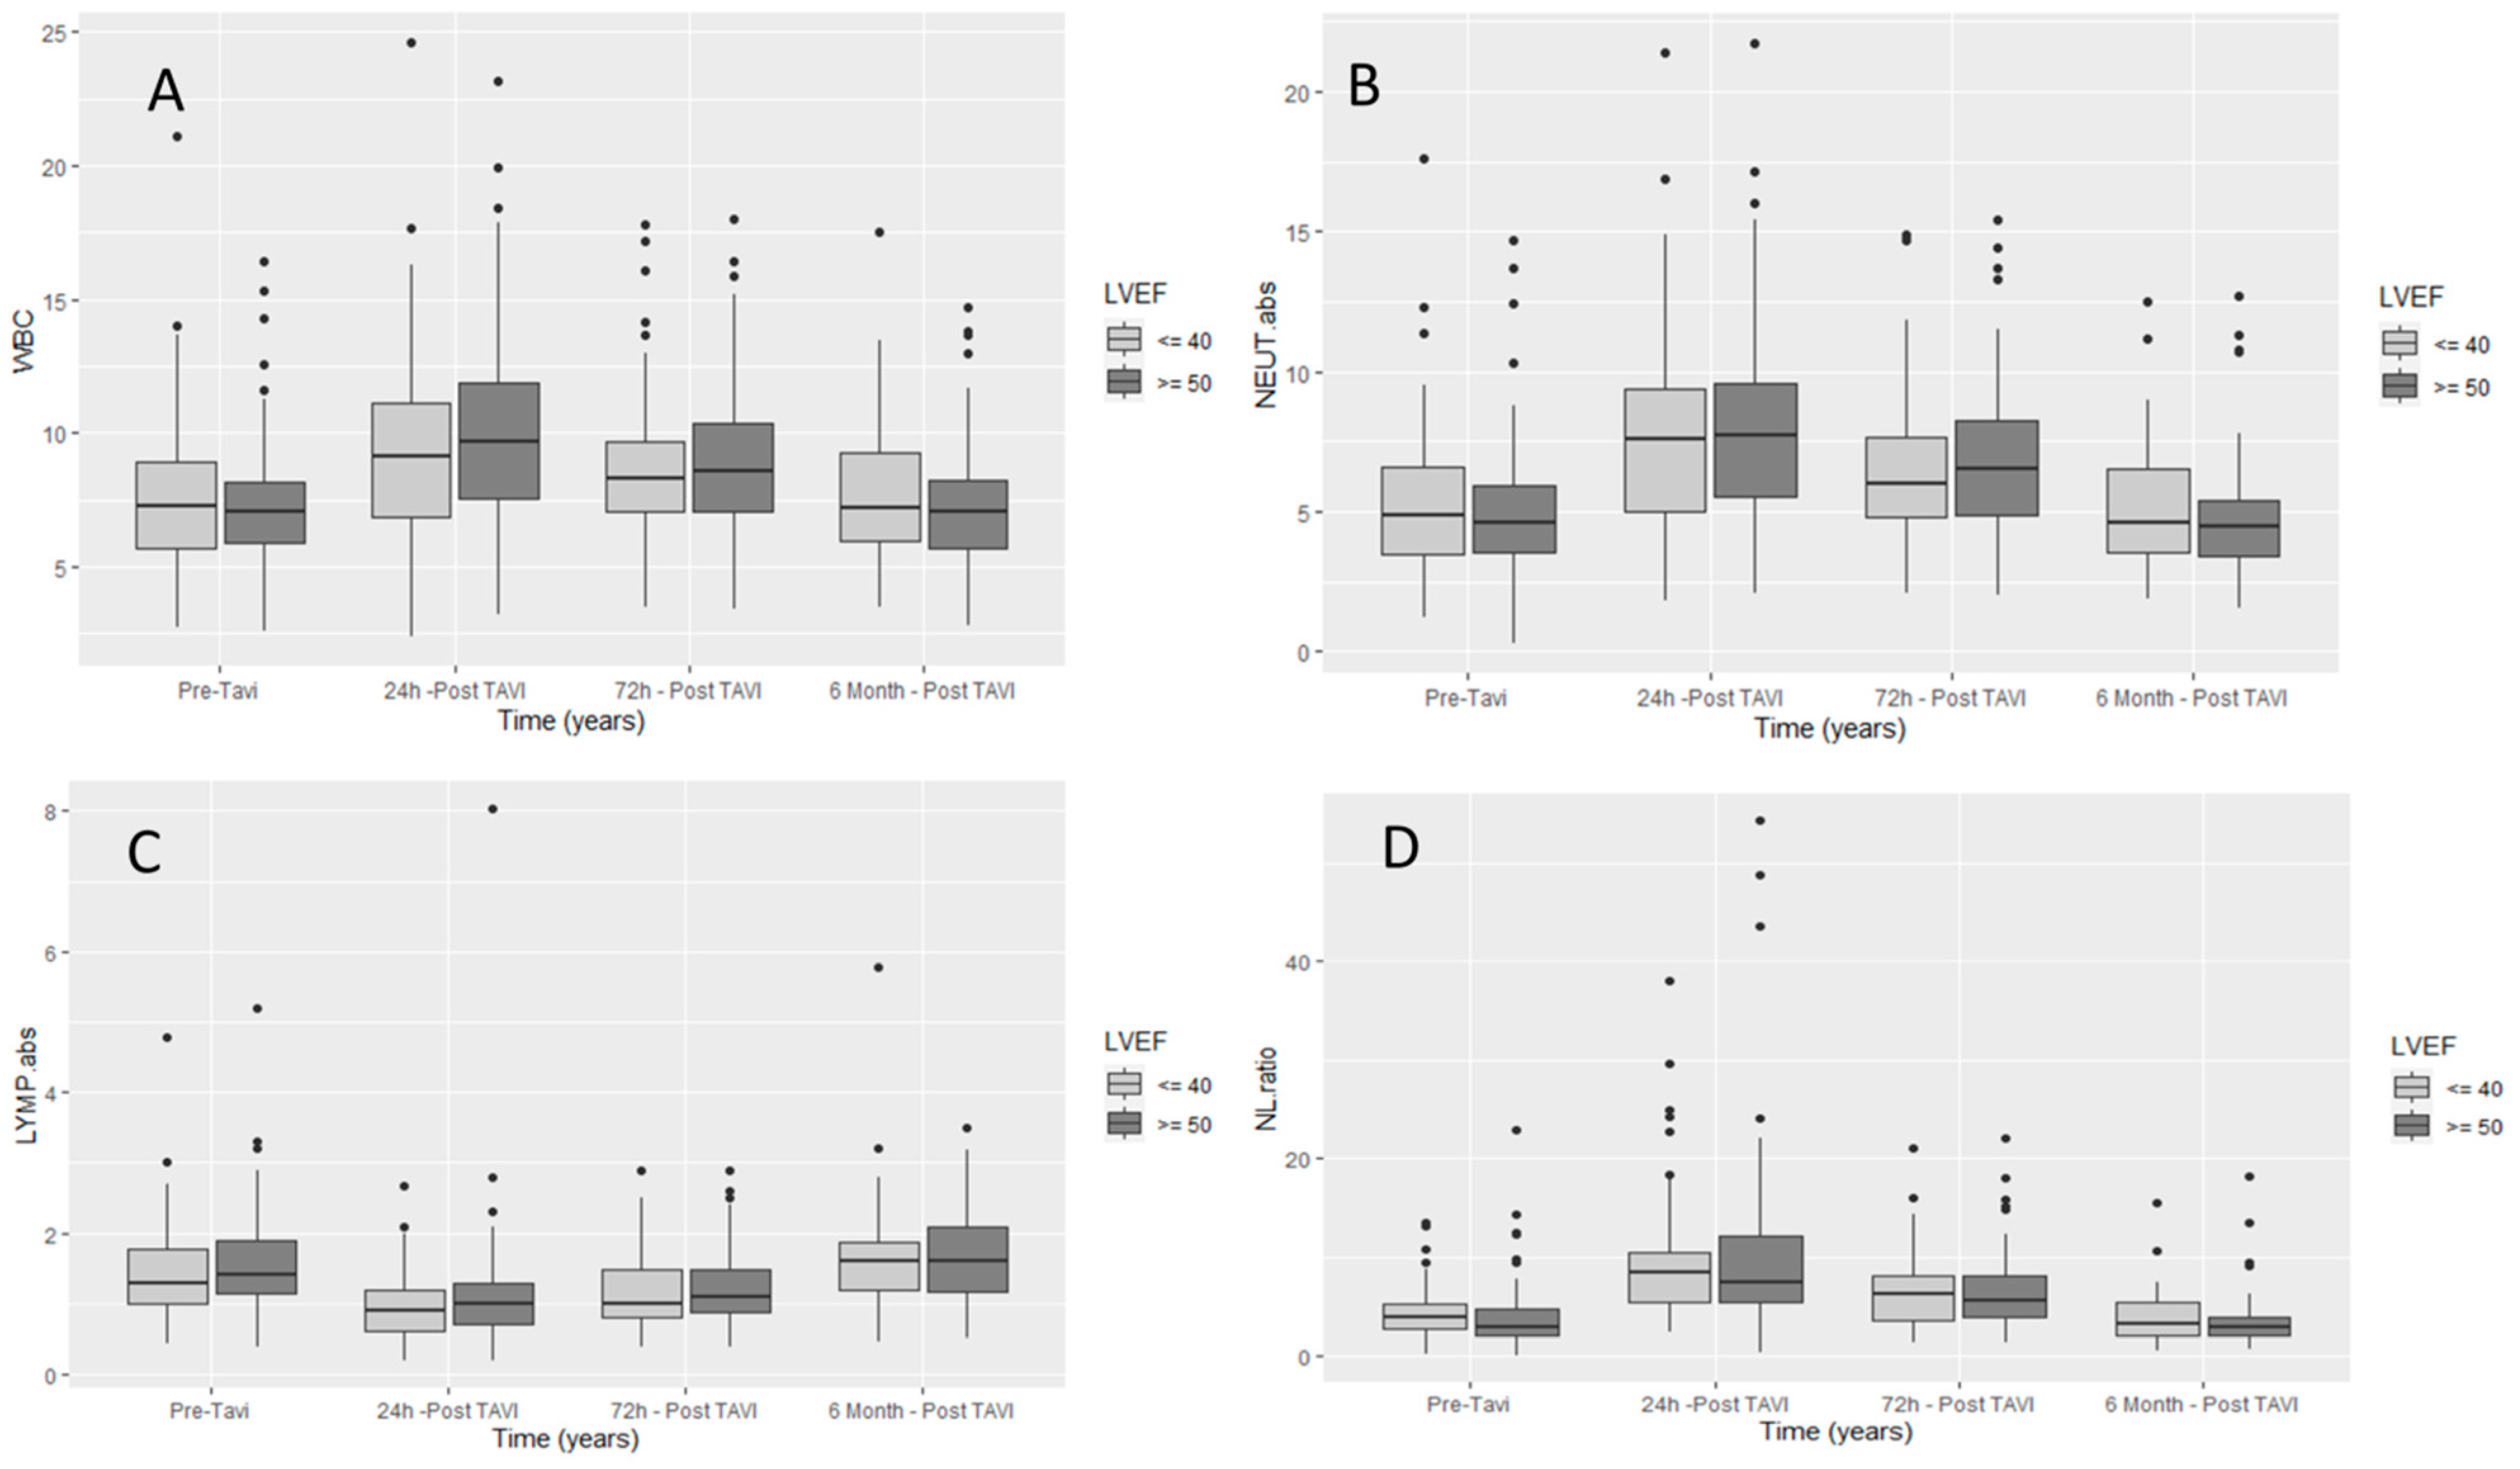
| Overall | EF ≥ 50 | EF ≤ 40 | p Value | |
|---|---|---|---|---|
| N = 156 | N = 104 | N = 52 | ||
| Admission | ||||
| WBC (K/μL) | 7.10 [5.89, 8.43] | 7.06 [5.90, 8.14] | 7.25 [5.68, 8.90] | 0.565 |
| Absolute neutrophils (K/μL) | 4.70 [3.51, 6.11] | 4.59 [3.52, 5.93] | 4.88 [3.48, 6.60] | 0.316 |
| Absolute lymphocytes (K/μL) | 1.31 [1.10, 1.90] | 1.40 [1.14, 1.90] | 1.28 [1.00, 1.78] | 0.215 |
| NLR | 3.21 [2.22, 5.00] | 2.85 [2.07, 4.78] | 3.90 [2.67, 5.26] | 0.04 |
| 24 h post-procedure | ||||
| WBC (K/μL) | 9.53 [7.40, 11.80] | 9.65 [7.57, 11.88] | 9.10 [6.88, 11.10] | 0.371 |
| Absolute neutrophils (K/μL) | 7.65 [5.50, 9.46] | 7.70 [5.50, 9.58] | 7.60 [4.97, 9.40] | 0.434 |
| Absolute lymphocytes (K/μL) | 0.95 [0.66, 1.30] | 1.00 [0.70, 1.30] | 0.90 [0.60, 1.20] | 0.421 |
| NLR | 7.83 [5.48, 12.07] | 7.40 [5.48, 12.18] | 8.35 [5.48, 10.47] | 0.678 |
| 72 h post-procedure | ||||
| WBC (K/μL) | 8.49 [7.10, 10.38] | 8.55 [7.10, 10.40] | 8.30 [7.10, 9.70] | 0.497 |
| Absolute neutrophils (K/μL) | 6.40 [4.83, 8.16] | 6.52 [4.88, 8.22] | 6.00 [4.83, 7.65] | 0.436 |
| Absolute lymphocytes (K/μL) | 1.10 [0.80, 1.49] | 1.10 [0.88, 1.49] | 1.00 [0.80, 1.48] | 0.468 |
| NLR | 5.71 [3.77, 8.09] | 5.65 [3.82, 8.15] | 6.16 [3.48, 8.01] | 0.863 |
| 6 months post-procedure | ||||
| WBC (K/μL) | 7.10 [5.84, 8.65] | 7.05 [5.72, 8.24] | 7.20 [6.00, 9.30] | 0.38 |
| Absolute neutrophils (K/μL) | 4.60 [3.40, 5.95] | 4.50 [3.40, 5.40] | 4.60 [3.55, 6.55] | 0.288 |
| Absolute lymphocytes (K/μL) | 1.60 [1.15, 1.92] | 1.60 [1.17, 2.08] | 1.60 [1.20, 1.86] | 0.844 |
| NLR | 3.00 [2.02, 4.35] | 2.94 [2.01, 3.88] | 3.30 [2.06, 5.35] | 0.288 |
| Post-Procedure 24 h—WBC | Post-Procedure 24 h—NEUT Abs | Post-Procedure 24 h—LYMP Abs | NLR 24 h | ||||||
|---|---|---|---|---|---|---|---|---|---|
| Median (IQR) | p-Value | Median (IQR) | p-Value | Median (IQR) | p-Value | Median (IQR) | p-Value | ||
| Total | 9.53 (7.4–11.8) | 7.65 (5.5–9.51) | 0.95 (0.62–1.3) | 7.83 (5.46–12.14) | |||||
| Gender | females | 9.6 (7.15–11.41) | 0.634 | 7.77 (5.5–9.4) | 0.952 | 0.9 (0.6–1.3) | 0.736 | 8.02 (5.46–11.5) | 0.696 |
| males | 9.4 (7.4–12.4) | 7.6 (5.5–10.1) | 1 (0.7–1.3) | 7.54 (5.5–12.36) | |||||
| Age *, years | 0.053 | 0.511 | −0.001 | 0.993 | −0.042 | 0.604 | 0.017 | 0.829 | |
| BMI *, kg/m2 | 0.112 | 0.165 | 0.097 | 0.229 | 0.161 | 0.046 | −0.039 | 0.627 | |
| HTN | no | 8.7 (7.53–13.4) | 0.860 | 6.9 (5.5–12) | 0.975 | 0.8 (0.6–1.2) | 0.521 | 10.46 (5.28–17.25) | 0.411 |
| yes | 9.63 (7.15–11.8) | 7.685 (5.5–9.455) | 0.975 (0.66–1.3) | 7.63 (5.48–11.41) | |||||
| Diabetes | no | 9.67 (7.15–11.87) | 0.956 | 7.67 (5.4–9.67) | 0.944 | 0.94 (0.7–1.3) | 0.889 | 7.66 (5.18–12.14) | 0.446 |
| yes | 9.53 (7.6–11.67) | 7.625 (6.17–9.2) | 0.975 (0.6–1.3) | 7.87 (5.87–11.33) | |||||
| AF | no | 9.4 (7.53–11.87) | 0.613 | 7.7 (5.7–9.6) | 0.251 | 0.9 (0.7–1.3) | 0.272 | 8.13 (5.62–12.77) | 0.075 |
| yes | 9.685 (7.03–11) | 7 (5.1–9.2) | 1.035 (0.7–1.3) | 6.91 (4.78–10) | |||||
| CAD | no | 9.45 (7.515–11.555) | 0.994 | 7 (5.5–9.4) | 0.769 | 0.94 (0.7–1.3) | 0.853 | 7.54 (5.18–12.2) | 0.856 |
| yes | 9.63 (7–11.87) | 7.7 (5.3–9.51) | 1 (0.6–1.3) | 7.83 (5.78–10.85) | |||||
| PAD | no | 9.565 (7.45–12.085) | 0.452 | 7.67 (5.5–9.79) | 0.366 | 0.95 (0.6–1.3) | 0.865 | 7.9 (5.26–12.77) | 0.486 |
| yes | 9.415 (6.85–11) | 7.425 (5.05–9) | 0.935 (0.7–1.25) | 7.2 (5.73–9.64) | |||||
| Baseline echo | |||||||||
| LVEF (%) * | 0.146 | 0.070 | 0.148 | 0.066 | 0.036 | 0.656 | 0.051 | 0.532 | |
| Septum thickness (mm) * | 0.132 | 0.102 | 0.142 | 0.079 | −0.137 | 0.091 | 0.200 | 0.013 | |
| Procedure related | |||||||||
| TAVI types | SEV | 9.8 (7.7–12.7) | 0.076 | 7.7 (5.9–10.3) | 0.056 | 1 (0.7–1.3) | 0.848 | 7.85 (5.55–12.16) | 0.389 |
| BEV | 9.25 (7.015–10.9) | 7.4 (5.11–8.95) | 0.975 (0.6–1.3) | 7.29 (5.27–10.47) | |||||
| Contrast volume (mL) * | 0.150 | 0.062 | 0.162 | 0.044 | −0.031 | 0.705 | 0.188 | 0.019 | |
| Time (minutes) * | 0.113 | 0.165 | 0.166 | 0.041 | −0.191 | 0.018 | 0.275 | 0.001 | |
| Post-dilatation | no | 9.615 (7.53–11.8) | 0.585 | 7.7 (5.5–9.4) | 0.702 | 1 (0.7–1.3) | 0.450 | 7.6 (5.46–12) | 0.749 |
| yes | 9.15 (7–11.87) | 6.92 (5.5–9.6) | 0.855 (0.6–1.2) | 8.69 (5.5–12.14) | |||||
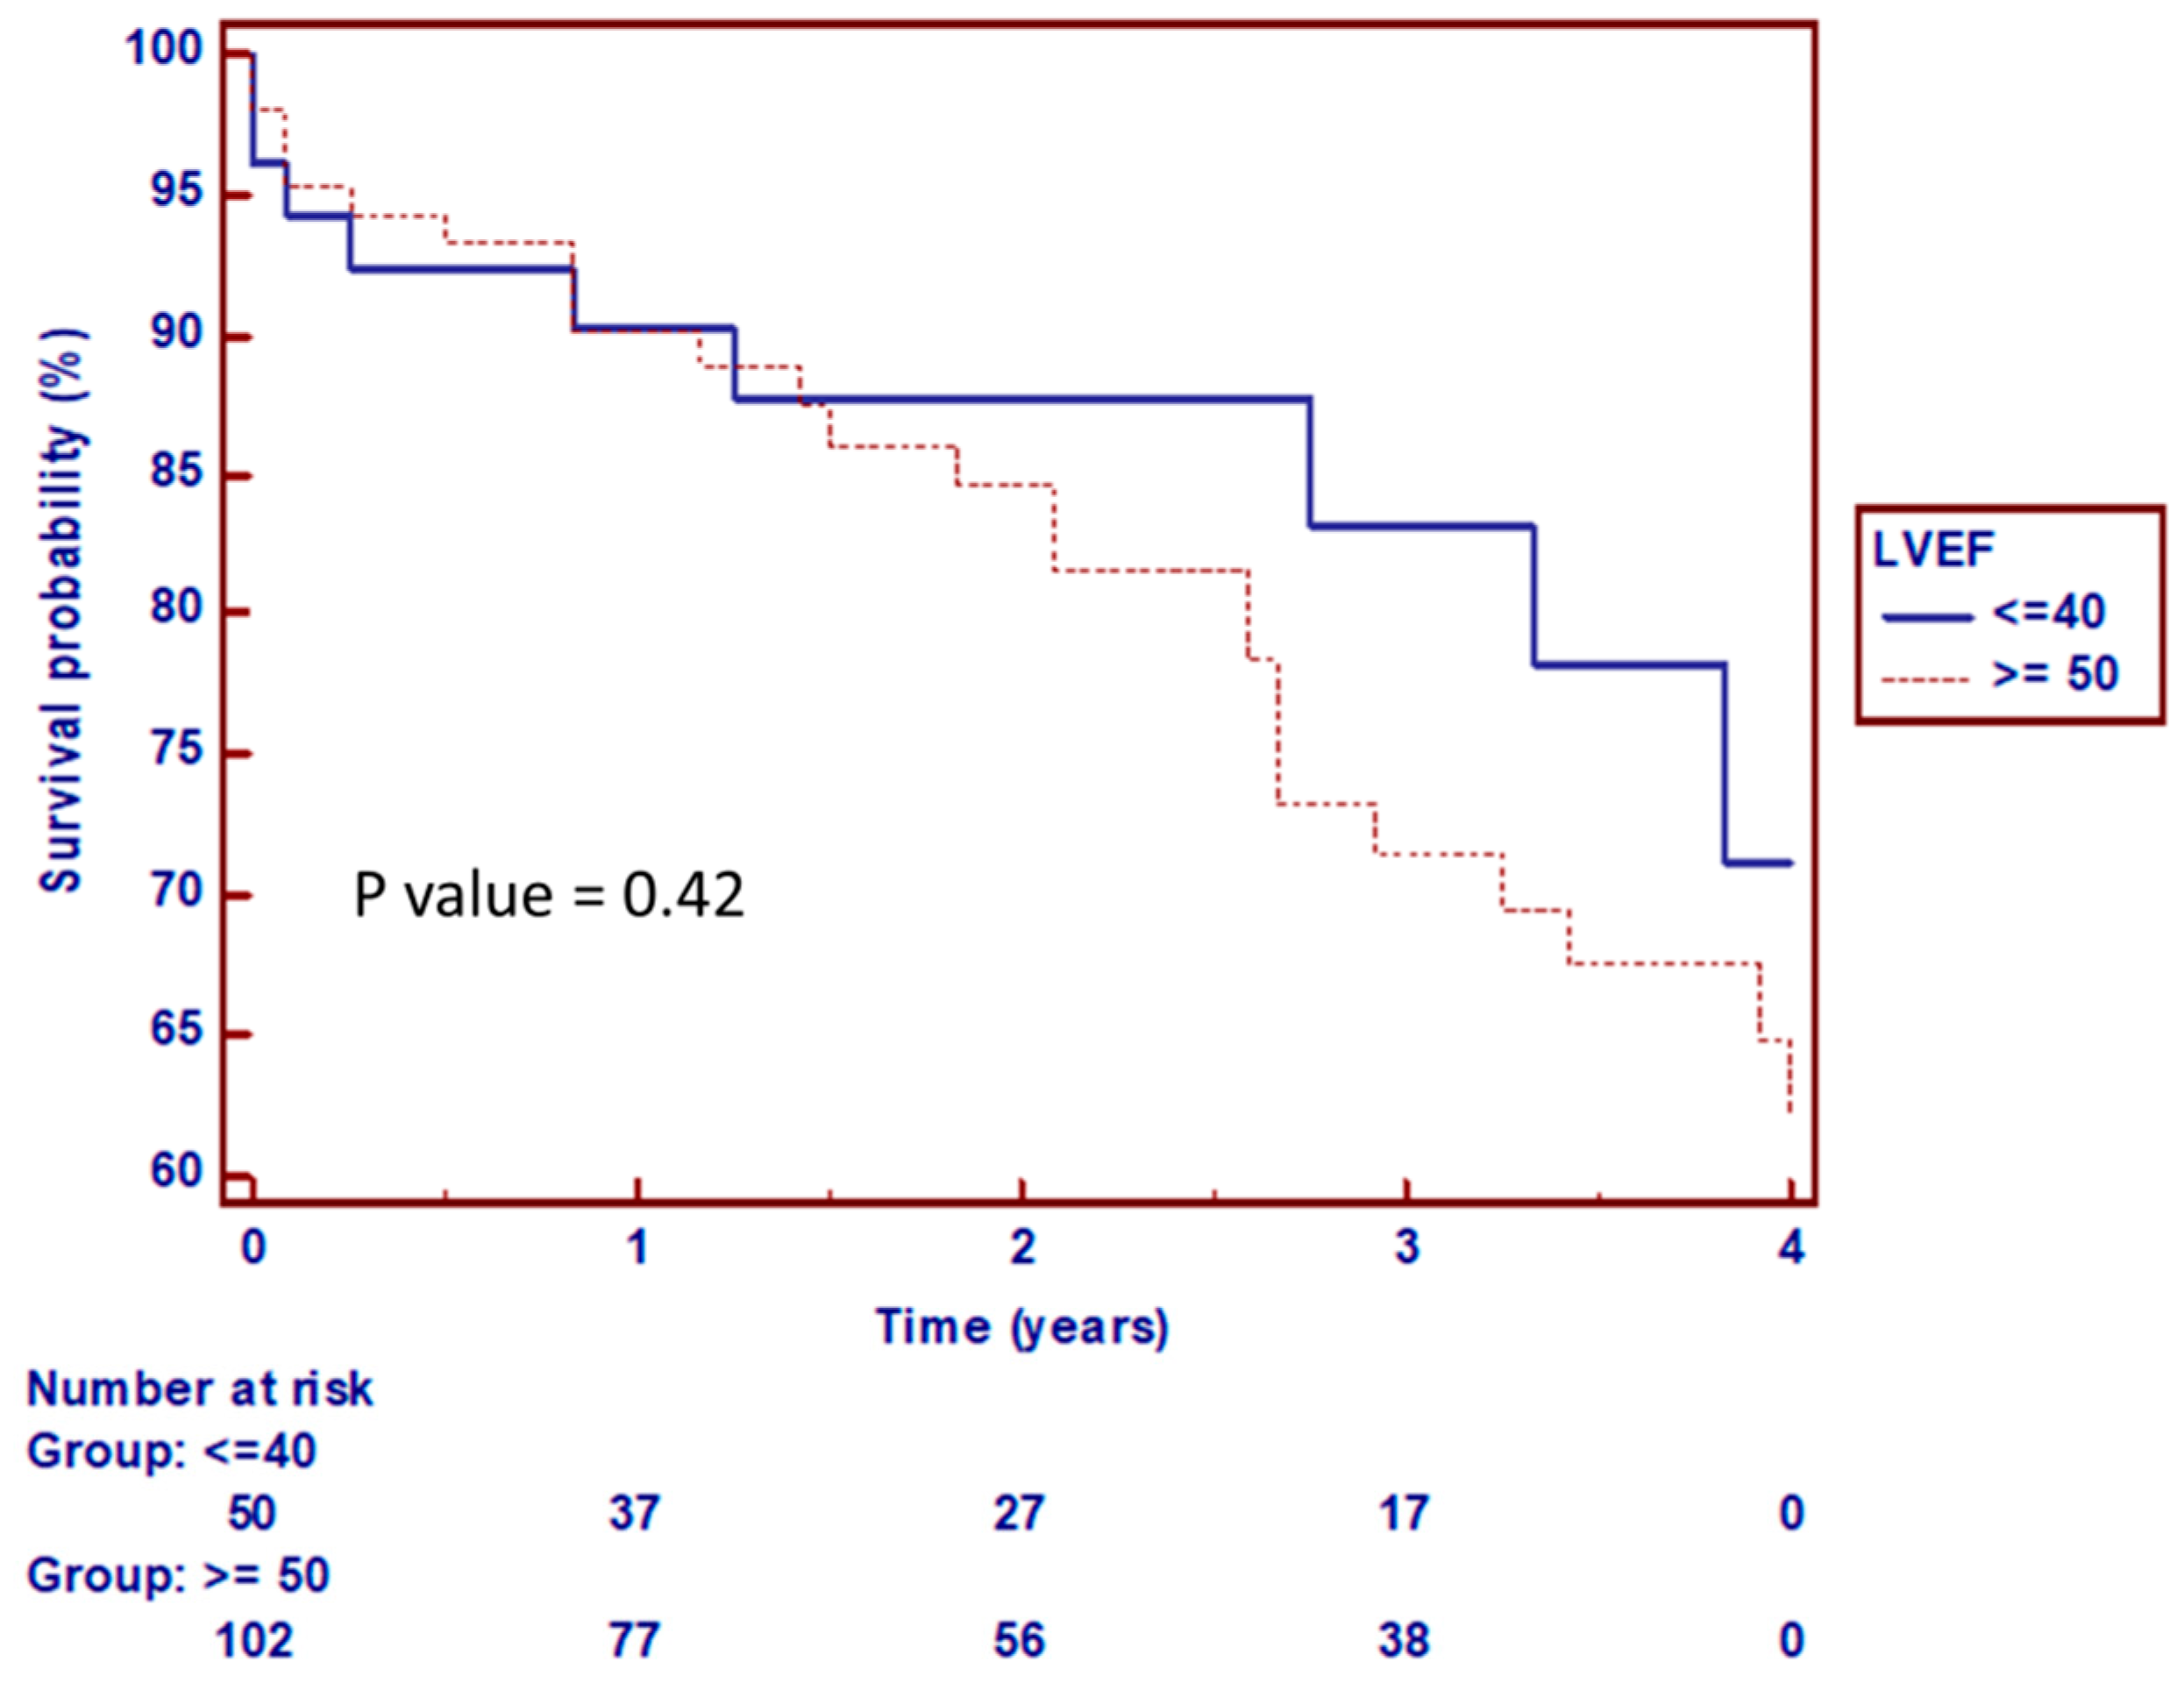
3.3. Clinical Outcomes
4. Discussion
Author Contributions
Funding
Institutional Review Board Statement
Informed Consent Statement
Data Availability Statement
Conflicts of Interest
References
- Halkos, M.E.; Chen, E.P.; Sarin, E.L.; Kilgo, P.; Thourani, V.H.; Lattouf, O.M.; Vega, J.D.; Morris, C.D.; Vassiliades, T.; Cooper, W.A. Aortic valve replacement for aortic stenosis in patients with left ventricular dysfunction. Ann. Thorac. Surg. 2009, 88, 746–751. [Google Scholar] [CrossRef]
- Pibarot, P.; Dumesnil, J.G. Low-flow, low-gradient aortic stenosis with normal and depressed left ventricular ejection fraction. J. Am. Coll. Cardiol. 2012, 60, 1845–1853. [Google Scholar] [CrossRef] [Green Version]
- Baron, S.J.; Arnold, S.V.; Herrmann, H.C.; Holmes, D.R.; Szeto, W.Y.; Allen, K.B.; Chhatriwalla, A.K.; Vemulapali, S.; O’Brien, S.; Dai, D. Impact of ejection fraction and aortic valve gradient on outcomes of transcatheter aortic valve replacement. J. Am. Coll. Cardiol. 2016, 67, 2349–2358. [Google Scholar] [CrossRef] [PubMed]
- Herrmann, H.C.; Pibarot, P.; Hueter, I.; Gertz, Z.M.; Stewart, W.J.; Kapadia, S.; Tuzcu, E.M.; Babaliaros, V.; Thourani, V.; Szeto, W.Y. Predictors of mortality and outcomes of therapy in low-flow severe aortic stenosis: A Placement of Aortic Transcatheter Valves (PARTNER) trial analysis. Circulation 2013, 127, 2316–2326. [Google Scholar] [CrossRef] [Green Version]
- Elmariah, S.; Palacios, I.F.; McAndrew, T.; Hueter, I.; Inglessis, I.; Baker, J.N.; Kodali, S.; Leon, M.B.; Svensson, L.; Pibarot, P. Outcomes of transcatheter and surgical aortic valve replacement in high-risk patients with aortic stenosis and left ventricular dysfunction: Results from the Placement of Aortic Transcatheter Valves (PARTNER) trial (cohort A). Circ. Cardiovasc. Interv. 2013, 6, 604–614. [Google Scholar] [CrossRef] [Green Version]
- Carreras, E.T.; Kaneko, T.; Ramirez-Del Val, F.; Pelletier, M.P.; Sobieszczyk, P.S.; Bhatt, D.L.; Shah, P.B. Impact of flow, gradient, and left ventricular function on outcomes after transcatheter aortic valve replacement. Catheter. Cardiovasc. Interv. 2018, 91, 798–805. [Google Scholar] [CrossRef]
- Passeri, J.J.; Elmariah, S.; Xu, K.; Inglessis, I.; Baker, J.N.; Alu, M.; Kodali, S.; Leon, M.B.; Svensson, L.G.; Pibarot, P. Transcatheter aortic valve replacement and standard therapy in inoperable patients with aortic stenosis and low EF. Heart 2015, 101, 463–471. [Google Scholar] [CrossRef]
- van der Boon, R.M.; Nuis, R.J.; Van Mieghem, N.M.; Benitez, L.M.; van Geuns, R.J.; Galema, T.W.; van Domburg, R.T.; Geleijnse, M.L.; Dager, A.; de Jaegere, P.P. Clinical outcome following transcatheter aortic valve implantation in patients with impaired left ventricular systolic function. Catheter. Cardiovasc. Interv. 2012, 79, 702–710. [Google Scholar] [CrossRef]
- Sanders-van Wijk, S.; Maeder, M.T.; Nietlispach, F.; Rickli, H.; Estlinbaum, W.; Erne, P.; Rickenbacher, P.; Peter, M.; Pfisterer, M.P.; Brunner-La Rocca, H.P. Long-Term Results of Intensified, N-Terminal-Pro-B-Type Natriuretic Peptide–Guided Versus Symptom-Guided Treatment in Elderly Patients With Heart Failure: Five-Year Follow-Up From TIME-CHF. Circ. Heart Fail. 2014, 7, 131–139. [Google Scholar] [CrossRef] [PubMed] [Green Version]
- O’Connor, C.M.; Starling, R.C.; Hernandez, A.F.; Armstrong, P.W.; Dickstein, K.; Hasselblad, V.; Heizer, G.M.; Komajda, M.; Massie, B.M.; McMurray, J.J. Effect of nesiritide in patients with acute decompensated heart failure. N. Engl. J. Med. 2011, 365, 32–43. [Google Scholar] [CrossRef] [PubMed] [Green Version]
- Cho, J.H.; Cho, H.J.; Lee, H.Y.; Ki, Y.J.; Jeon, E.S.; Hwang, K.K.; Chae, S.C.; Baek, S.H.; Kang, S.M.; Choi, D.J. Neutrophil-lymphocyte ratio in patients with acute heart failure predicts in-hospital and long-term mortality. J. Clin. Med. 2020, 9, 557. [Google Scholar] [CrossRef] [PubMed] [Green Version]
- Murphy, S.P.; Kakkar, R.; McCarthy, C.P.; Januzzi Jr, J.L. Inflammation in heart failure: JACC state-of-the-art review. J. Am. Coll. Cardiol. 2020, 75, 1324–1340. [Google Scholar] [CrossRef] [PubMed]
- Dick, S.A.; Epelman, S. Chronic heart failure and inflammation: What do we really know? Circ. Res. 2016, 119, 159–176. [Google Scholar] [CrossRef] [PubMed] [Green Version]
- Sorysz, D.; Januszek, R.; Sowa-Staszczak, A.; Grochowska, A.; Opalińska, M.; Bagieński, M.; Zawiślak, B.; Dziewierz, A.; Tokarek, T.; Krawczyk-Ożóg, A. The Usefulness of [18F] F-Fluorodeoxyglucose and [18F] F-Sodium Fluoride Positron Emission Tomography Imaging in the Assessment of Early-Stage Aortic Valve Degeneration after Transcatheter Aortic Valve Implantation (TAVI)—Protocol Description and Preliminary Results. J. Clin. Med. 2021, 10, 431. [Google Scholar]
- Friedman, G.D.; Klatsky, A.L.; Siegelaub, A. The leukocyte count as a predictor of myocardial infarction. N. Engl. J. Med. 1974, 290, 1275–1278. [Google Scholar] [CrossRef]
- Horne, B.D.; Anderson, J.L.; John, J.M.; Weaver, A.; Bair, T.L.; Jensen, K.R.; Renlund, D.G.; Muhlestein, J.B.; Group IHCS. Which white blood cell subtypes predict increased cardiovascular risk? J. Am. Coll. Cardiol. 2005, 45, 1638–1643. [Google Scholar] [CrossRef] [Green Version]
- Duffy, B.K.; Gurm, H.S.; Rajagopal, V.; Gupta, R.; Ellis, S.G.; Bhatt, D.L. Usefulness of an elevated neutrophil to lymphocyte ratio in predicting long-term mortality after percutaneous coronary intervention. Am. J. Cardiol. 2006, 97, 993–996. [Google Scholar] [CrossRef]
- Azab, B.; Jaglall, N.; Atallah, J.P.; Lamet, A.; Raja-Surya, V.; Farah, B.; Lesser, M.; Widmann, W.D. Neutrophil-lymphocyte ratio as a predictor of adverse outcomes of acute pancreatitis. Pancreatology 2011, 11, 445–452. [Google Scholar] [CrossRef]
- Uthamalingam, S.; Patvardhan, E.A.; Subramanian, S.; Ahmed, W.; Martin, W.; Daley, M.; Capodilupo, R. Utility of the neutrophil to lymphocyte ratio in predicting long-term outcomes in acute decompensated heart failure. Am. J. Cardiol. 2011, 107, 433–438. [Google Scholar] [CrossRef]
- Im Cho, K.; Sakuma, I.; Sohn, I.S.; Jo, S.H.; Koh, K.K. Inflammatory and metabolic mechanisms underlying the calcific aortic valve disease. Atherosclerosis 2018, 277, 60–65. [Google Scholar] [CrossRef] [PubMed]
- Dweck, M.R.; Khaw, H.; Sng, G.K.; Luo, E.; Baird, A.; Williams, M.C.; Makiello, P.; Mirsadraee, S.; Joshi, N.; van Beek, E. Aortic stenosis, atherosclerosis, and skeletal bone: Is there a common link with calcification and inflammation? Eur. Heart J. 2013, 34, 1567–1574. [Google Scholar] [CrossRef] [PubMed] [Green Version]
- Ari, M.E.; Ekici, F.; Çetin, İİ.; Tavil, E.B.; Yaralı, N.; Işık, P.; Hazırolan, T.; Tunç, B. Assessment of left ventricular functions and myocardial iron load with tissue Doppler and speckle tracking echocardiography and T2* MRI in patients with β-thalassemia major. Echocardiography 2017, 34, 383–389. [Google Scholar] [CrossRef]
- Cho, K.I.; Cho, S.H.; Her, A.Y.; Singh, G.B.; Shin, E.S. Prognostic utility of neutrophil-to-lymphocyte ratio on adverse clinical outcomes in patients with severe calcific aortic stenosis. PloS ONE 2016, 11, e0161530. [Google Scholar] [CrossRef] [PubMed]
- Song, J.; Zheng, Q.; Ma, X.; Zhang, Q.; Xu, Z.; Zou, C.; Wang, Z. Predictive roles of neutrophil-to-lymphocyte ratio and C-reactive protein in patients with calcific aortic valve disease. Int. Heart J. 2019, 60, 345–351. [Google Scholar] [CrossRef] [PubMed] [Green Version]
- Baratchi, S.; Zaldivia, M.T.; Wallert, M.; Loseff-Silver, J.; Al-Aryahi, S.; Zamani, J.; Thurgood, P.; Salim, A.; Htun, N.M.; Stub, D. Transcatheter Aortic Valve Implantation Represents an Anti-Inflammatory Therapy Via Reduction of Shear Stress–Induced, Piezo-1–Mediated Monocyte Activation. Circulation 2020, 142, 1092–1105. [Google Scholar] [CrossRef]
- Chieffo, A.; Buchanan, G.L.; Van Mieghem, N.M.; Tchetche, D.; Dumonteil, N.; Latib, A.; Van Der Boon, R.M.; Vahdat, O.; Marcheix, B.; Farah, B. Transcatheter aortic valve implantation with the Edwards SAPIEN versus the Medtronic CoreValve Revalving system devices: A multicenter collaborative study: The PRAGMATIC Plus Initiative (Pooled-RotterdAm-Milano-Toulouse In Collaboration). J. Am. Coll. Cardiol. 2013, 61, 830–836. [Google Scholar] [CrossRef] [PubMed] [Green Version]


| Overall | EF ≥ 50 | EF ≤ 40 | p Value | |
|---|---|---|---|---|
| Clinical characteristic | N = 156 | N = 104 | N = 52 | |
| Age, years | 81.00 [76.00, 85.00] | 81.50 [74.75, 86.25] | 81.00 [77.00, 85.00] | 0.737 |
| Male (%) | 89 (57%) | 60 (57.7%) | 29 (55.8%) | 0.954 |
| Body mass index, kg/m | 26.89 [23.44, 29.33] | 26.33 [22.72, 30.55] | 27.05 [24.08, 29.11] | 0.506 |
| Hypertension (%) | 145 (93%) | 97 (93.3%) | 48 (92.3%) | 1 |
| Diabetes (%) | 67 (43%) | 44 (42.3%) | 23 (44.2%) | 0.954 |
| Dyslipidemia (%) | 118 (76%) | 75 (72.1%) | 43 (82.7%) | 0.21 |
| Smoker (%) | 21 (13%) | 14 (13.5%) | 7 (13.5%) | 1 |
| Atrial fibrillation (%) | 50 (32%) | 35 (34.0%) | 15 (30.0%) | 0.758 |
| Coronary artery disease (%) | 71 (46%) | 42 (40.8%) | 29 (55.8%) | 0.11 |
| Peripheral artery disease (%) | 32 (21%) | 16 (15.4%) | 16 (30.8%) | 0.042 |
| Previous myocardial infarction (%) | 21 (13%) | 10 (9.6%) | 11 (21.6%) | 0.073 |
| Previous stroke (%) | 20 (13%) | 14 (13.5%) | 6 (11.5%) | 0.933 |
| Previous pacemaker (%) | 22 (14%) | 14 (13.5%) | 8 (15.4%) | 0.935 |
| CABG (%) | 12 (0.7%) | 5 (7.9%) | 7 (17.1%) | 0.266 |
| STS Score | 8.01 [5.1, 10.3] | 8.04 [4.8, 10.2] | 8.3 [5.2, 10.6] | 0.617 |
| LVEF (%) | 52.50 [39.75, 60.00] | 55.00 [53.75, 60.0] | 35.00 [30.00, 39.25] | <0.001 |
| Septum thickness (mm) | 13.00 [12.00, 15.00] | 14.00 [13.00, 15.0] | 12.50 [12.00, 14.0] | 0.001 |
| Aortic valve area (cm) | 0.70 [0.60, 0.80] | 0.70 [0.60, 0.80] | 0.65 [0.50, 0.70] | 0.035 |
| Aortic valve gradient- mean (mm Hg) | 37.00 [29.50, 47.00] | 43.50 [32.25, 50.75] | 32.00 [27.00, 37.00] | 0.003 |
| Contrast volume (mL) | 120.00 [90.00, 157.0] | 136.44 (63.55) | 122.04 (51.51) | 0.158 |
| Time (minutes) | 84.00 [68.00, 105.75] | 93.44 (33.77) | 84.23 (32.07) | 0.106 |
| WBC (K/μL) | 7.10 [5.89, 8.43] | 7.06 [5.90, 8.14] | 7.25 [5.68, 8.90] | 0.565 |
| Absolute Neutrophils (K/μL) | 4.70 [3.51, 6.11] | 4.59 [3.52, 5.93] | 4.88 [3.48, 6.60] | 0.316 |
| Absolute Lymphocytes (K/μL) | 1.31 [1.10, 1.90] | 1.28 [1.00, 1.78] | 1.40 [1.14, 1.90] | 0.215 |
| NLR | 3.21 [2.22, 5.00] | 2.85 [2.07, 4.78] | 3.90 [2.67, 5.26] | 0.04 |
| Variable | Total | EF ≥ 50 | EF ≤ 40 | p Value |
|---|---|---|---|---|
| Mortality | 8 (5.1%) | 5 (4.8%) | 3 (5.7%) | 0.271 |
| Bleeding | 8 (0.5%) | 6 (5.8%) | 2 (3.8%) | 0.898 |
| Major vascular complication | 13 (0.8%) | 9 (8.7%) | 4 (7.7%) | 1 |
| Stroke | 3 (0.1%) | 1 (1.0%) | 2 (3.8%) | 0.536 |
| Myocardial infarction | 3 (0.1%) | 2 (1.9%) | 1 (1.9%) | 1 |
| Acute kidney injury | 7 (0.5%) | 4 (3.8%) | 3 (5.8%) | 0.891 |
| Arrhythmia | 42 (27%) | 29 (27.9%) | 13 (25.0%) | 0.848 |
Publisher’s Note: MDPI stays neutral with regard to jurisdictional claims in published maps and institutional affiliations. |
© 2021 by the authors. Licensee MDPI, Basel, Switzerland. This article is an open access article distributed under the terms and conditions of the Creative Commons Attribution (CC BY) license (https://creativecommons.org/licenses/by/4.0/).
Share and Cite
Abu Khadija, H.; Gandelman, G.; Ayyad, O.; Poles, L.; Jonas, M.; Paz, O.; Goland, S.; Shimoni, S.; Meledin, V.; George, J.; et al. Comparative Analysis of the Kinetic Behavior of Systemic Inflammatory Markers in Patients with Depressed versus Preserved Left Ventricular Function Undergoing Transcatheter Aortic Valve Implantation. J. Clin. Med. 2021, 10, 4148. https://doi.org/10.3390/jcm10184148
Abu Khadija H, Gandelman G, Ayyad O, Poles L, Jonas M, Paz O, Goland S, Shimoni S, Meledin V, George J, et al. Comparative Analysis of the Kinetic Behavior of Systemic Inflammatory Markers in Patients with Depressed versus Preserved Left Ventricular Function Undergoing Transcatheter Aortic Valve Implantation. Journal of Clinical Medicine. 2021; 10(18):4148. https://doi.org/10.3390/jcm10184148
Chicago/Turabian StyleAbu Khadija, Haitham, Gera Gandelman, Omar Ayyad, Lion Poles, Michael Jonas, Offir Paz, Sorel Goland, Sara Shimoni, Valery Meledin, Jacob George, and et al. 2021. "Comparative Analysis of the Kinetic Behavior of Systemic Inflammatory Markers in Patients with Depressed versus Preserved Left Ventricular Function Undergoing Transcatheter Aortic Valve Implantation" Journal of Clinical Medicine 10, no. 18: 4148. https://doi.org/10.3390/jcm10184148
APA StyleAbu Khadija, H., Gandelman, G., Ayyad, O., Poles, L., Jonas, M., Paz, O., Goland, S., Shimoni, S., Meledin, V., George, J., & Blatt, A. (2021). Comparative Analysis of the Kinetic Behavior of Systemic Inflammatory Markers in Patients with Depressed versus Preserved Left Ventricular Function Undergoing Transcatheter Aortic Valve Implantation. Journal of Clinical Medicine, 10(18), 4148. https://doi.org/10.3390/jcm10184148