
Using Deep Neural Networks for Predicting Age and Sex in Healthy Adult Chest Radiographs

 , and
, and
Abstract
:1. Introduction
2. Material and Methods
2.1. Ethics Statement
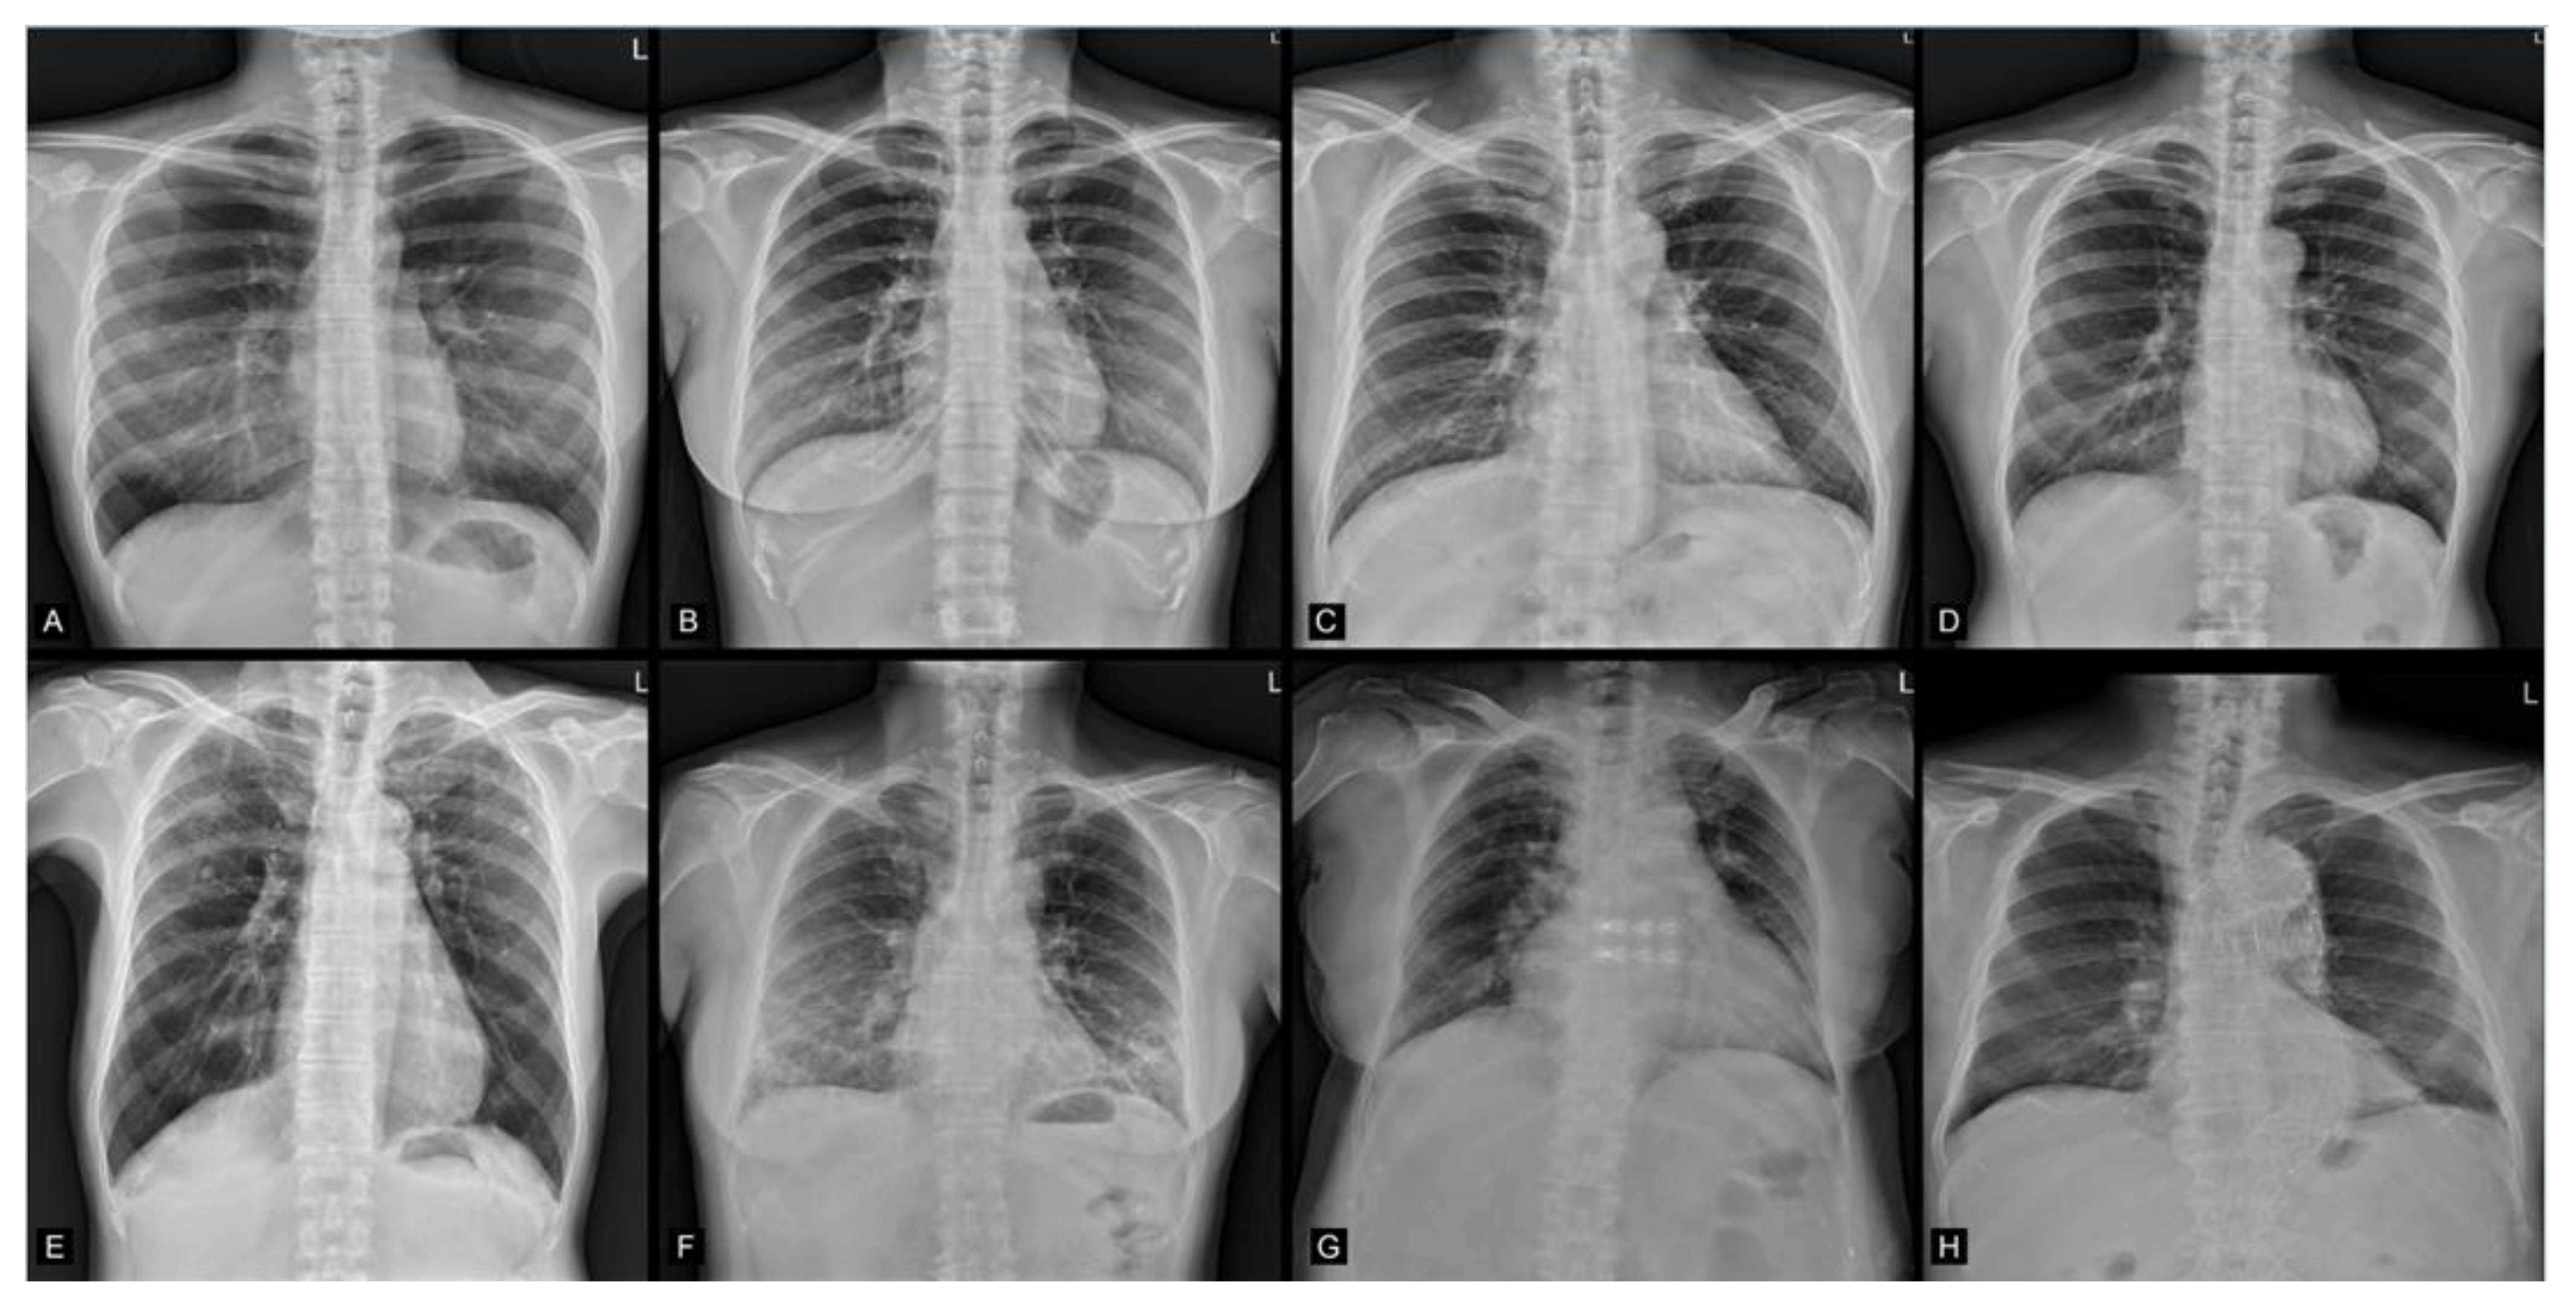
2.2. Image Data Acquisition
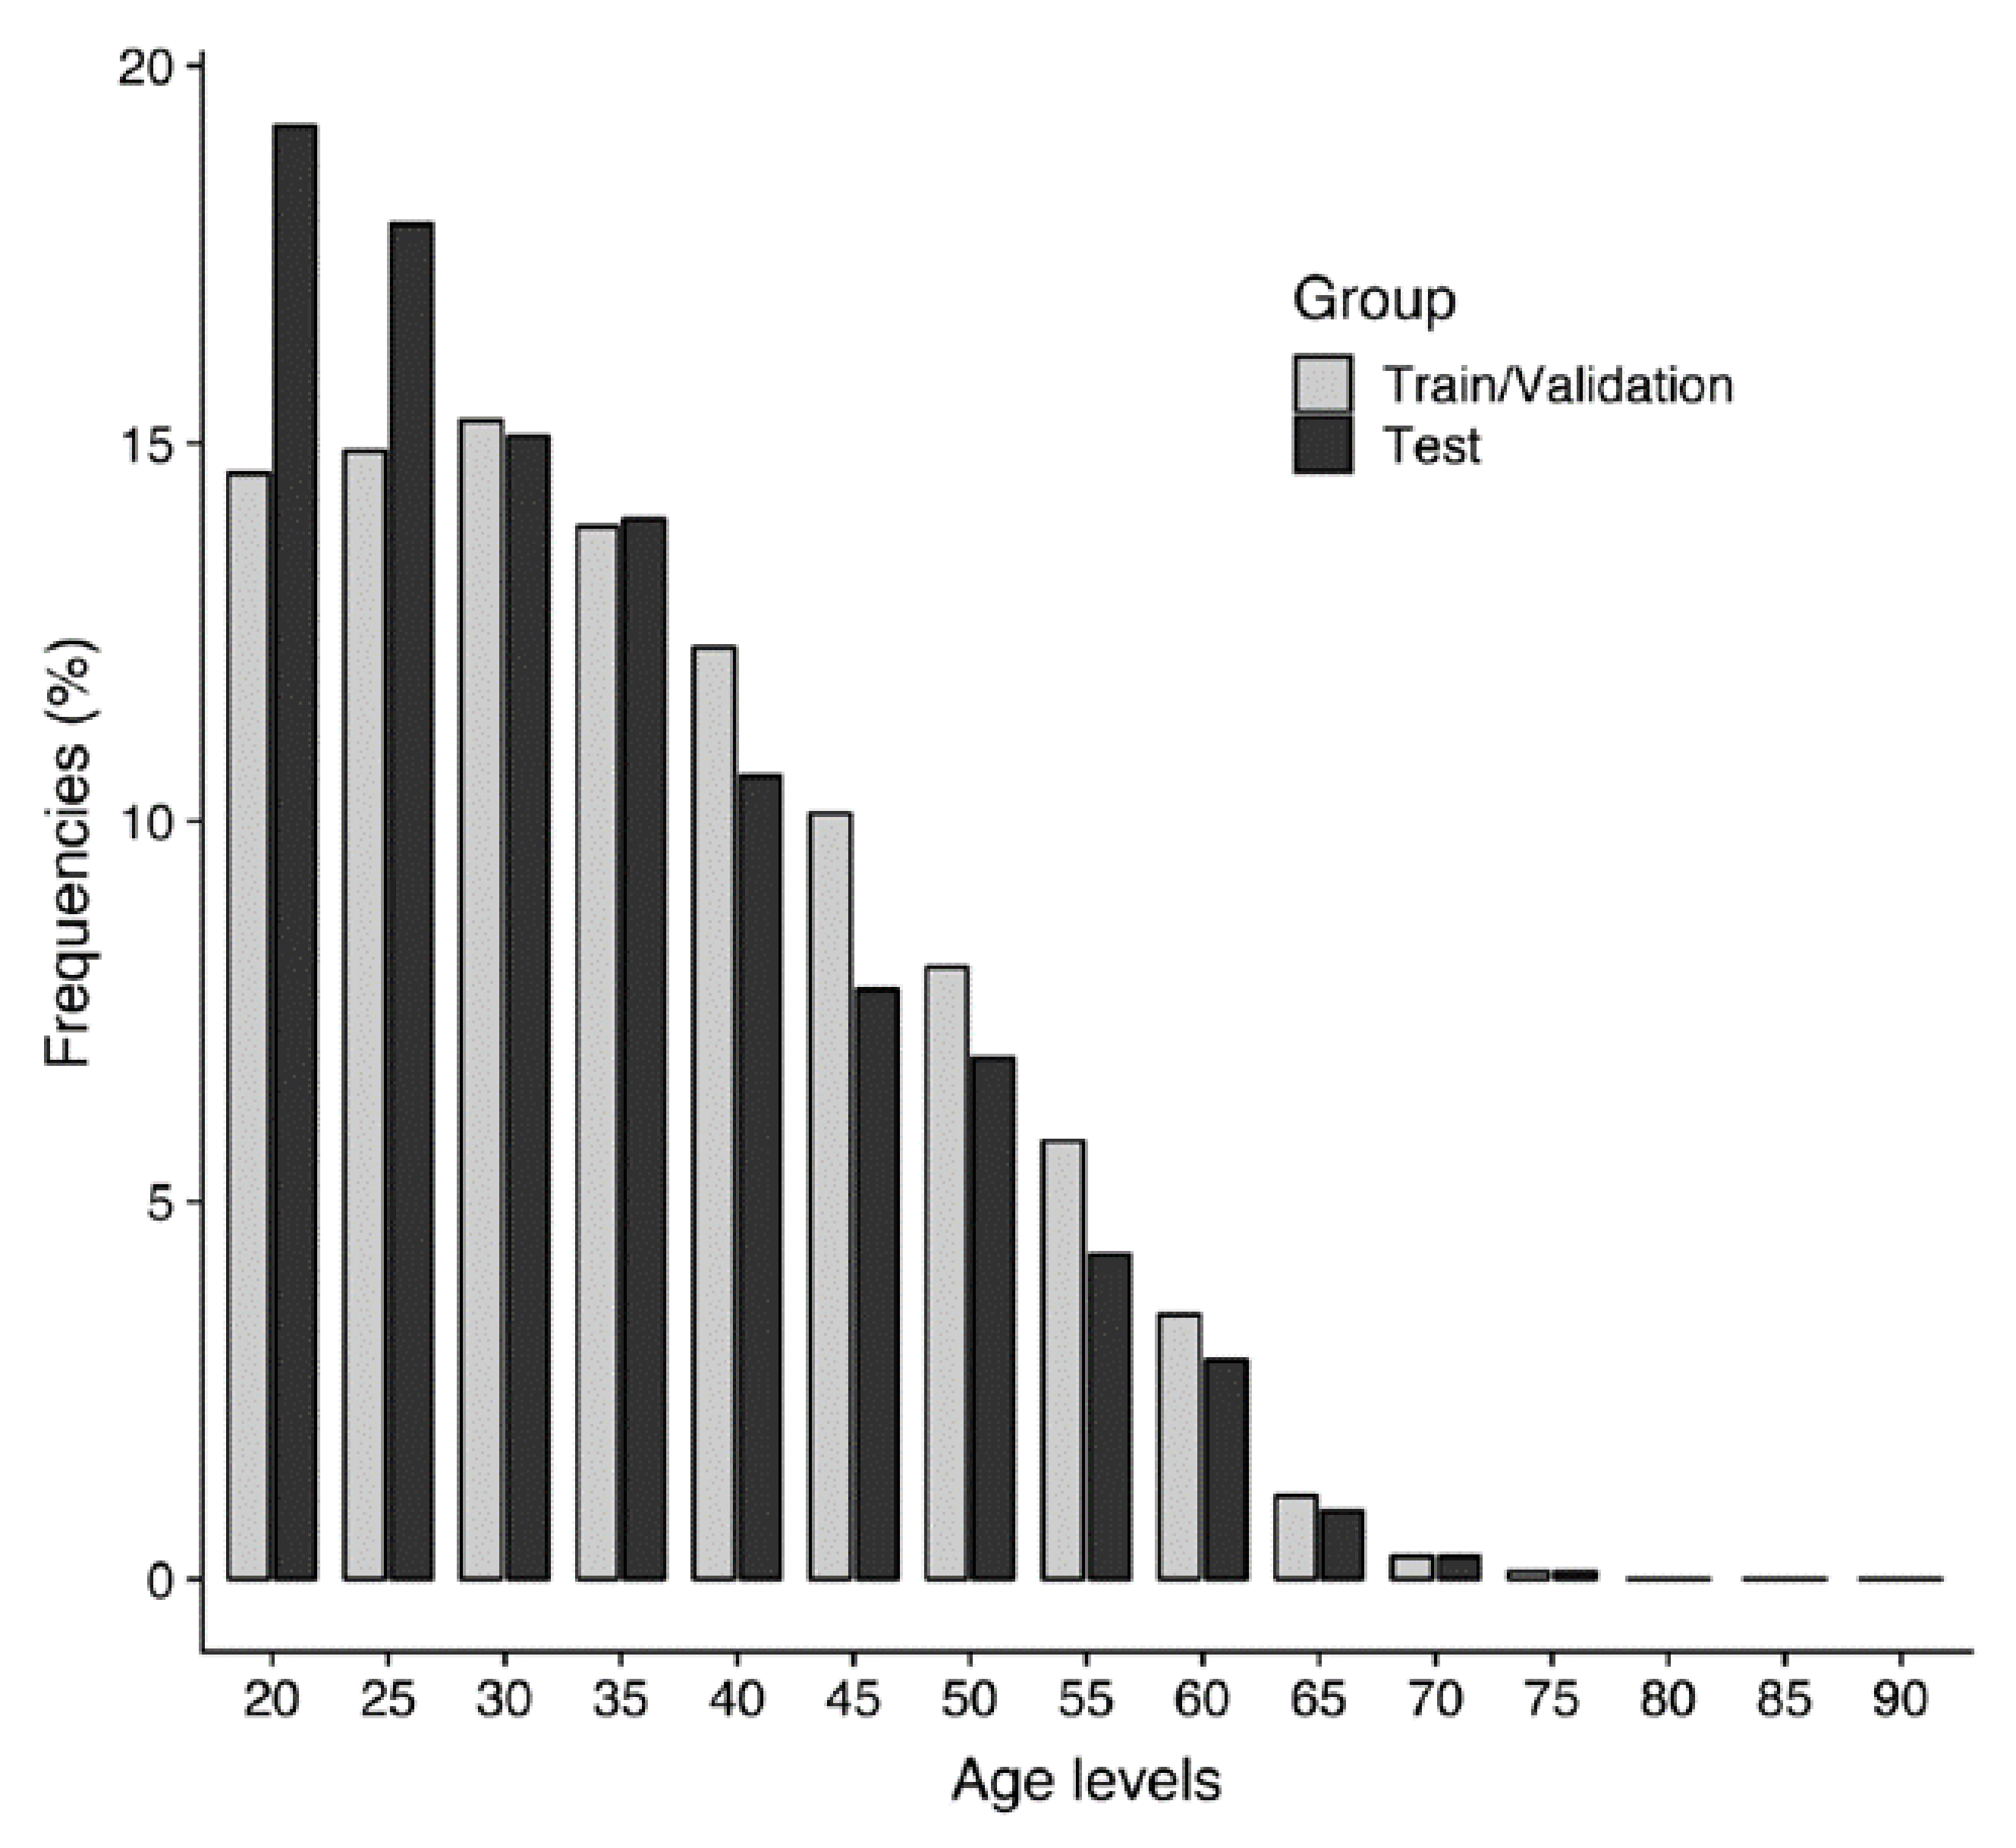
2.3. Study Population Demographics
2.4. Deep Learning Algorithm Architecture
2.5. Training of the Deep Learning Algorithm
2.6. Gradient-Weighted Class Activation Mapping
2.7. Statistical Analysis
3. Results
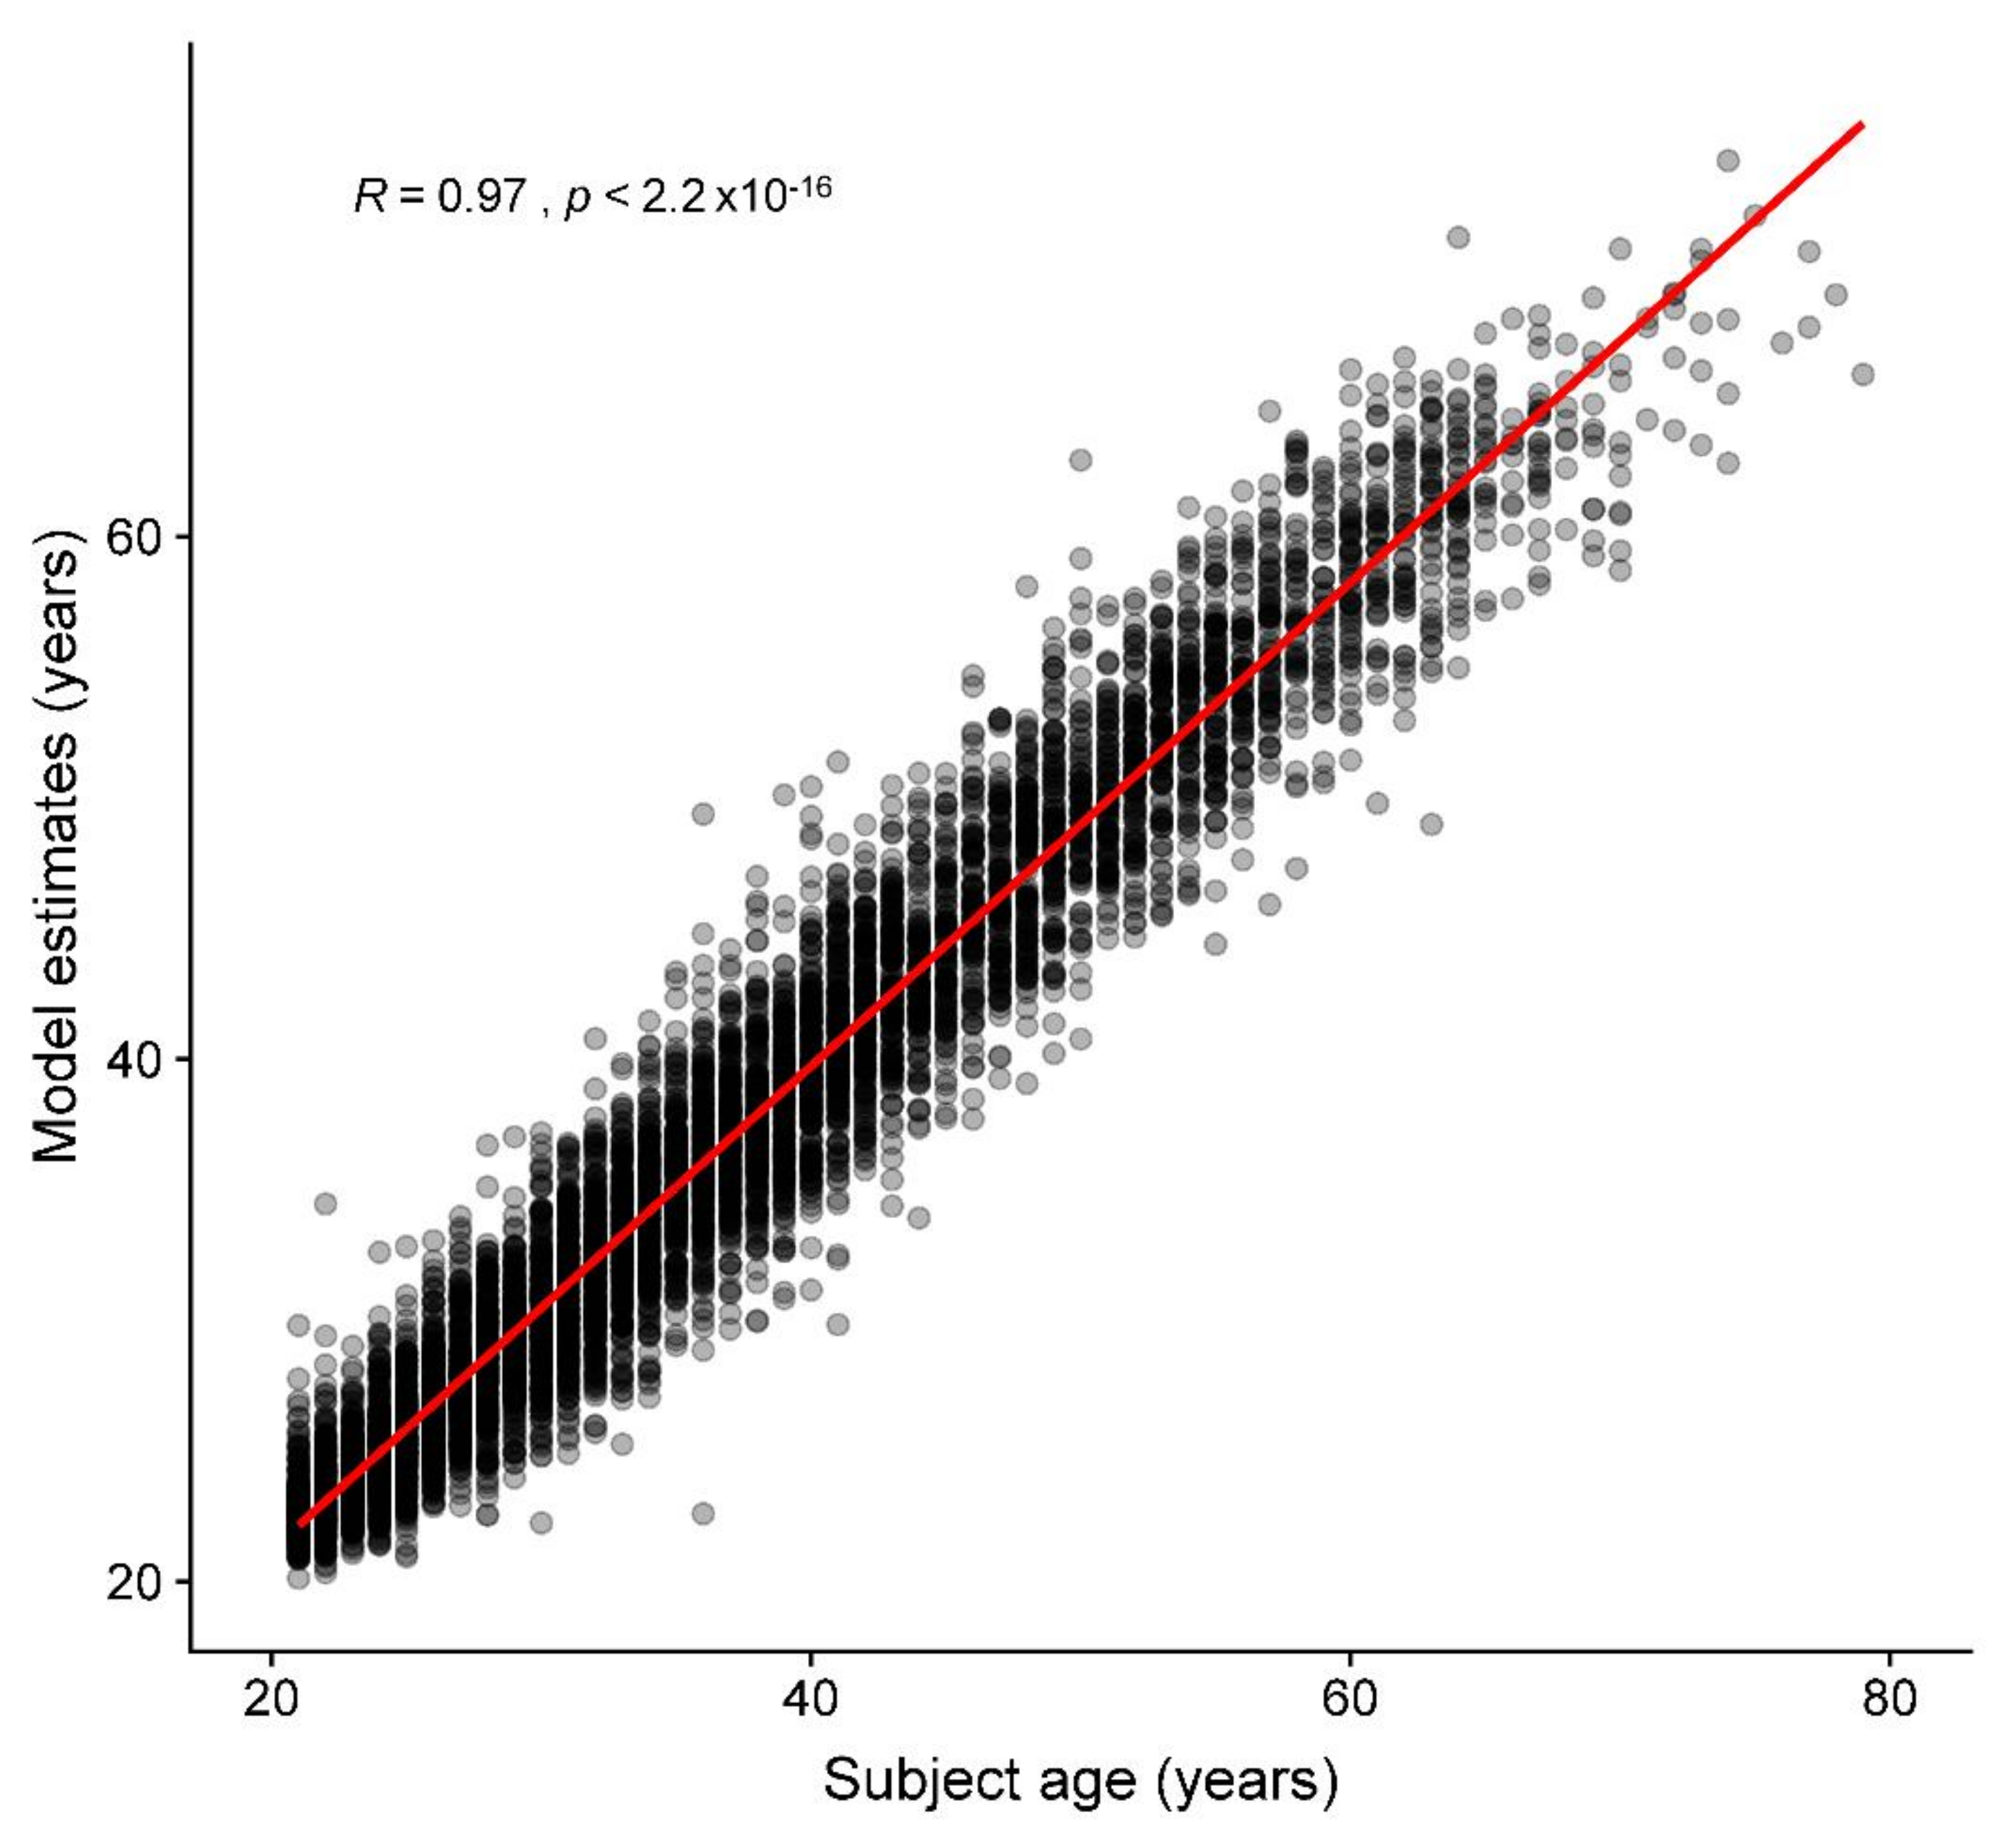
3.1. Age Prediction
3.2. Sex Prediction
3.3. Group Summarized Activation Maps
4. Discussion
5. Limitations
Author Contributions
Funding
Institutional Review Board Statement
Informed Consent Statement
Data Availability Statement
Acknowledgments
Conflicts of Interest
Abbreviations
| ADAM | adaptive moment estimation |
| AUC | area under the receiver operating characteristic curve |
| CNN | convolutional neural network |
| CXRs | chest radiograph |
| DICOM | Digital Imaging and Communications in Medicine |
| Grad-CAM | gradient-weighted class activation mapping |
| MAE | mean absolute error |
| ML | machine learning |
| MR | magnetic resonance |
| ReLU | rectified linear unit |
| RMSE | root mean square error |
| SAM | summarized activation map |
References
- Willems, G. A review of the most commonly used dental age estimation techniques. J. Forensic Odonto-Stomatol. 2001, 19, 9–17. [Google Scholar]
- Chandrakanth, H.V.; Kanchan, T.; Krishan, K.; Arun, M.; Pramod Kumar, G.N. Estimation of age from human sternum: An autopsy study on a sample from South India. Int. J. Leg. Med. 2012, 126, 863–868. [Google Scholar] [CrossRef] [PubMed]
- McCormick, W.F. Mineralization of the costal cartilages as an indicator of age: Preliminary observations. J. Forensic Sci. 1980, 25, 736–741. [Google Scholar] [CrossRef] [PubMed]
- Latham, K.E.; Finnegan, J.M.; Rhine, S.; Charles, C. Age Estimation of the Human Skeleton; Charles C. Thomas Publisher: Springfield, IL, USA, 2010. [Google Scholar]
- Schmeling, A.; Schulz, R.; Reisinger, W.; Muhler, M.; Wernecke, K.D.; Geserick, G. Studies on the time frame for ossification of the medial clavicular epiphyseal cartilage in conventional radiography. Int. J. Leg. Med. 2004, 118, 5–8. [Google Scholar] [CrossRef] [PubMed]
- Cole, J.H.; Annus, T.; Wilson, L.R.; Remtulla, R.; Hong, Y.T.; Fryer, T.D.; Acosta-Cabronero, J.; Cardenas-Blanco, A.; Smith, R.; Menon, D.K.; et al. Brain-predicted age in Down syndrome is associated with beta amyloid deposition and cognitive decline. Neurobiol. Aging 2017, 56, 41–49. [Google Scholar] [CrossRef]
- Cole, J.H.; Underwood, J.; Caan, M.W.; De Francesco, D.; van Zoest, R.A.; Leech, R.; Wit, F.W.; Portegies, P.; Geurtsen, G.J.; Schmand, B.A.; et al. Increased brain-predicted aging in treated HIV disease. Neurology 2017, 88, 1349–1357. [Google Scholar] [CrossRef]
- Cole, J.H.; Leech, R.; Sharp, D.J.; Alzheimer’s Disease Neuroimaging, I. Prediction of brain age suggests accelerated atrophy after traumatic brain injury. Ann. Neurol. 2015, 77, 571–581. [Google Scholar] [CrossRef] [Green Version]
- Franke, K.; Gaser, C.; Manor, B.; Novak, V. Advanced BrainAGE in older adults with type 2 diabetes mellitus. Front. Aging Neurosci. 2013, 5, 90. [Google Scholar] [CrossRef]
- Gaser, C.; Franke, K.; Kloppel, S.; Koutsouleris, N.; Sauer, H.; Alzheimer’s Disease Neuroimaging Initiative. BrainAGE in Mild Cognitive Impaired Patients: Predicting the Conversion to Alzheimer’s Disease. PLoS ONE 2013, 8, e67346. [Google Scholar] [CrossRef]
- Koutsouleris, N.; Davatzikos, C.; Borgwardt, S.; Gaser, C.; Bottlender, R.; Frodl, T.; Falkai, P.; Riecher-Rossler, A.; Moller, H.J.; Reiser, M.; et al. Accelerated brain aging in schizophrenia and beyond: A neuroanatomical marker of psychiatric disorders. Schizophr. Bull. 2014, 40, 1140–1153. [Google Scholar] [CrossRef] [Green Version]
- Faulkner, K.G. The tale of the T-score: Review and perspective. Osteoporos. Int. 2005, 16, 347–352. [Google Scholar] [CrossRef] [PubMed]
- Raghu, V.K.; Weiss, J.; Hoffmann, U.; Aerts, H.; Lu, M.T. Deep Learning to Estimate Biological Age From Chest Radiographs. JACC Cardiovasc. Imaging 2021. [Google Scholar] [CrossRef] [PubMed]
- Ieki, H.; Ito, K.; Saji, M.; Kawakami, R.; Nagatomo, Y.; Koyama, S.; Matsunaga, H.; Miyazawa, K.; Ozaki, K.; Onouchi, Y.; et al. Deep learning-based chest X-ray age serves as a novel biomarker for cardiovascular aging. bioRxiv 2021. 2021.2003.2024.436773. [Google Scholar] [CrossRef]
- Karargyris, A.; Kashyap, S.; Wu, J.T.; Sharma, A.; Moradi, M.; Syeda-Mahmood, T. Age prediction using a large chest X-ray dataset. arXiv 2019, arXiv:1903.06542. [Google Scholar]
- Thodberg, H.H. Clinical review: An automated method for determination of bone age. J. Clin. Endocrinol. Metab. 2009, 94, 2239–2244. [Google Scholar] [CrossRef] [Green Version]
- Thodberg, H.H.; Kreiborg, S.; Juul, A.; Pedersen, K.D. The BoneXpert method for automated determination of skeletal maturity. IEEE Trans. Med. Imaging 2009, 28, 52–66. [Google Scholar] [CrossRef]
- Ashburner, J. A fast diffeomorphic image registration algorithm. NeuroImage 2007, 38, 95–113. [Google Scholar] [CrossRef]
- Franke, K.; Ziegler, G.; Kloppel, S.; Gaser, C.; Alzheimer’s Disease Neuroimaging, I. Estimating the age of healthy subjects from T1-weighted MRI scans using kernel methods: Exploring the influence of various parameters. NeuroImage 2010, 50, 883–892. [Google Scholar] [CrossRef]
- Neeb, H.; Zilles, K.; Shah, N.J. Fully-automated detection of cerebral water content changes: Study of age- and gender-related H2O patterns with quantitative MRI. NeuroImage 2006, 29, 910–922. [Google Scholar] [CrossRef]
- Larson, D.B.; Chen, M.C.; Lungren, M.P.; Halabi, S.S.; Stence, N.V.; Langlotz, C.P. Performance of a Deep-Learning Neural Network Model in Assessing Skeletal Maturity on Pediatric Hand Radiographs. Radiology 2018, 287, 313–322. [Google Scholar] [CrossRef]
- Cole, J.H.; Poudel, R.P.K.; Tsagkrasoulis, D.; Caan, M.W.A.; Steves, C.; Spector, T.D.; Montana, G. Predicting brain age with deep learning from raw imaging data results in a reliable and heritable biomarker. NeuroImage 2017, 163, 115–124. [Google Scholar] [CrossRef] [Green Version]
- LeCun, Y.; Bengio, Y.; Hinton, G. Deep learning. Nature 2015, 521, 436–444. [Google Scholar] [CrossRef]
- Hamczyk, M.R.; Nevado, R.M.; Barettino, A.; Fuster, V.; Andres, V. Biological versus Chronological Aging: JACC Focus Seminar. J. Am. Coll. Cardiol. 2020, 75, 919–930. [Google Scholar] [CrossRef]
- Jazwinski, S.M.; Kim, S. Examination of the Dimensions of Biological Age. Front. Genet. 2019, 10, 263. [Google Scholar] [CrossRef]
- Jylhava, J.; Pedersen, N.L.; Hagg, S. Biological Age Predictors. EBioMedicine 2017, 21, 29–36. [Google Scholar] [CrossRef] [Green Version]
- Sabottke, C.F.; Breaux, M.A.; Spieler, B.M. Estimation of age in unidentified patients via chest radiography using convolutional neural network regression. Emerg. Radiol. 2020, 27, 463–468. [Google Scholar] [CrossRef] [PubMed]
- Szegedy, C.; Ioffe, S.; Vanhoucke, V.; Alemi, A.A. Inception-v4, inception-resnet and the impact of residual connections on learning. In Proceedings of the Thirty-First AAAI Conference on Artificial Intelligence, San Francisco, CA, USA, 4–9 February 2017. [Google Scholar]
- He, K.; Zhang, X.; Ren, S.; Sun, J. Deep residual learning for image recognition. In Proceedings of the IEEE Conference on Computer Vision and Pattern Recognition, Las Vegas, NV, USA, 27–30 June 2016; pp. 770–778. [Google Scholar]
- Szegedy, C.; Vanhoucke, V.; Ioffe, S.; Shlens, J.; Wojna, Z. Rethinking the inception architecture for computer vision. In Proceedings of the IEEE Conference on Computer Vision and Pattern Recognition, Las Vegas, NV, USA, 27–30 June 2016; pp. 2818–2826. [Google Scholar]
- Szegedy, C.; Liu, W.; Jia, Y.; Sermanet, P.; Reed, S.; Anguelov, D.; Erhan, D.; Vanhoucke, V.; Rabinovich, A. Going deeper with convolutions. In Proceedings of the IEEE Conference on Computer Vision and Pattern Recognition, Boston, MA, USA, 7–12 June 2015; pp. 1–9. [Google Scholar]
- Szegedy, C.; Ioffe, S.; Vanhoucke, V.; Alemi, A. Inception-v4, Inception-ResNet and the Impact of Residual Connections on Learning. arXiv 2016, arXiv:1602.07261v2. [Google Scholar]
- Deng, J.; Dong, W.; Socher, R.; Li, L.-J.; Kai, L.; Li, F.-F. ImageNet: A Large-Scale Hierarchical Image Database. In Proceedings of the 2009 IEEE Conference on Computer Vision and Pattern Recognition, Miami, FL, USA, 20–25 June 2009; pp. 248–255. [Google Scholar]
- Selvaraju, R.R.; Cogswell, M.; Das, A.; Vedantam, R.; Parikh, D.; Batra, D. Grad-CAM: Visual Explanations from Deep Networks via Gradient-based Localization. arXiv 2019, arXiv:1610.02391v4. [Google Scholar]
- Redmon, J.; Farhadi, A. YOLOv3: An Incremental Improvement. arXiv 2018, arXiv:1804.02767v1. [Google Scholar]
- Schaefer, S.; McPhail, T.; Warren, J. Image Deformation Using Moving Least Squares. ACM Trans. Graph. 2006, 25, 533–540. [Google Scholar] [CrossRef]
- Oakden-Rayner, L. Exploring large-scale public medical image datasets. Acad. Radiol. 2020, 27, 106–112. [Google Scholar] [CrossRef] [Green Version]
- Tang, S.; Ghorbani, A.; Yamashita, R.; Rehman, S.; Dunnmon, J.A.; Zou, J.; Rubin, D.L. Data valuation for medical imaging using Shapley value and application to a large-scale chest X-ray dataset. Sci. Rep. 2021, 11, 8366. [Google Scholar] [CrossRef]
- Gross, B.H.; Gerke, K.F.; Shirazi, K.K.; Whitehouse, W.M.; Bookstein, F.L. Estimation of patient age based on plain chest radiographs. J. Can. Assoc. Radiol. 1985, 36, 141–143. [Google Scholar]
- Barchilon, V.; Hershkovitz, I.; Rothschild, B.M.; Wish-Baratz, S.; Latimer, B.; Jellema, L.M.; Hallel, T.; Arensburg, B. Factors affecting the rate and pattern of the first costal cartilage ossification. Am. J. Forensic Med. Pathol. 1996, 17, 239–247. [Google Scholar] [CrossRef] [PubMed]
- DiGangi, E.A.; Bethard, J.D.; Kimmerle, E.H.; Konigsberg, L.W. A new method for estimating age-at-death from the first rib. Am. J. Phys. Anthropol. 2009, 138, 164–176. [Google Scholar] [CrossRef]
- Weaver, A.A.; Schoell, S.L.; Stitzel, J.D. Morphometric analysis of variation in the ribs with age and sex. J. Anat. 2014, 225, 246–261. [Google Scholar] [CrossRef] [Green Version]
- Redheuil, A.; Yu, W.C.; Mousseaux, E.; Harouni, A.A.; Kachenoura, N.; Wu, C.O.; Bluemke, D.; Lima, J.A. Age-related changes in aortic arch geometry: Relationship with proximal aortic function and left ventricular mass and remodeling. J. Am. Coll. Cardiol. 2011, 58, 1262–1270. [Google Scholar] [CrossRef] [PubMed] [Green Version]
- Pfaffenberger, S.; Bartko, P.; Graf, A.; Pernicka, E.; Babayev, J.; Lolic, E.; Bonderman, D.; Baumgartner, H.; Maurer, G.; Mascherbauer, J. Size matters! Impact of age, sex, height, and weight on the normal heart size. Circ. Cardiovasc. Imaging 2013, 6, 1073–1079. [Google Scholar] [CrossRef] [Green Version]
- Chang, E.; Varghese, M.; Singer, K. Gender and Sex Differences in Adipose Tissue. Curr. Diabetes Rep. 2018, 18, 69. [Google Scholar] [CrossRef] [PubMed]
- Luders, E.; Cherbuin, N.; Kurth, F. Forever Young(er): Potential age-defying effects of long-term meditation on gray matter atrophy. Front. Psychol. 2014, 5, 1551. [Google Scholar] [CrossRef] [PubMed] [Green Version]
- Steffener, J.; Habeck, C.; O’Shea, D.; Razlighi, Q.; Bherer, L.; Stern, Y. Differences between chronological and brain age are related to education and self-reported physical activity. Neurobiol. Aging 2016, 40, 138–144. [Google Scholar] [CrossRef] [PubMed] [Green Version]


| Set | Training (n = 53,315) | Validation (n = 6664) | Test (n = 6664) | Total (n = 66,643) |
|---|---|---|---|---|
| Age | ||||
| Mean (Standard deviation) | 39.1 (11.9) | 37.1 (11.8) | 36.8 (11.8) | 38.7 (11.9) |
| Median (Min, Max) | 38.0 (20.0, 93.0) | 35.0 (20.0, 86.0) | 35.0 (20.0, 79.0) | 37.0 (20.0, 93.0) |
| Sex | ||||
| Female | 29,104 (54.6%) | 3490 (52.4%) | 3440 (51.6%) | 36,034 (54.1%) |
| Male | 24,211 (45.4%) | 3174 (47.6%) | 3224 (48.4%) | 30,609 (45.9%) |
Publisher’s Note: MDPI stays neutral with regard to jurisdictional claims in published maps and institutional affiliations. |
© 2021 by the authors. Licensee MDPI, Basel, Switzerland. This article is an open access article distributed under the terms and conditions of the Creative Commons Attribution (CC BY) license (https://creativecommons.org/licenses/by/4.0/).
Share and Cite
Yang, C.-Y.; Pan, Y.-J.; Chou, Y.; Yang, C.-J.; Kao, C.-C.; Huang, K.-C.; Chang, J.-S.; Chen, H.-C.; Kuo, K.-H. Using Deep Neural Networks for Predicting Age and Sex in Healthy Adult Chest Radiographs. J. Clin. Med. 2021, 10, 4431. https://doi.org/10.3390/jcm10194431
Yang C-Y, Pan Y-J, Chou Y, Yang C-J, Kao C-C, Huang K-C, Chang J-S, Chen H-C, Kuo K-H. Using Deep Neural Networks for Predicting Age and Sex in Healthy Adult Chest Radiographs. Journal of Clinical Medicine. 2021; 10(19):4431. https://doi.org/10.3390/jcm10194431
Chicago/Turabian StyleYang, Chung-Yi, Yi-Ju Pan, Yen Chou, Chia-Jung Yang, Ching-Chung Kao, Kuan-Chieh Huang, Jing-Shan Chang, Hung-Chieh Chen, and Kuei-Hong Kuo. 2021. "Using Deep Neural Networks for Predicting Age and Sex in Healthy Adult Chest Radiographs" Journal of Clinical Medicine 10, no. 19: 4431. https://doi.org/10.3390/jcm10194431