Different Inspiratory Flow Waveform during Volume-Controlled Ventilation in ARDS Patients

 ,
,
Abstract
:1. Introduction
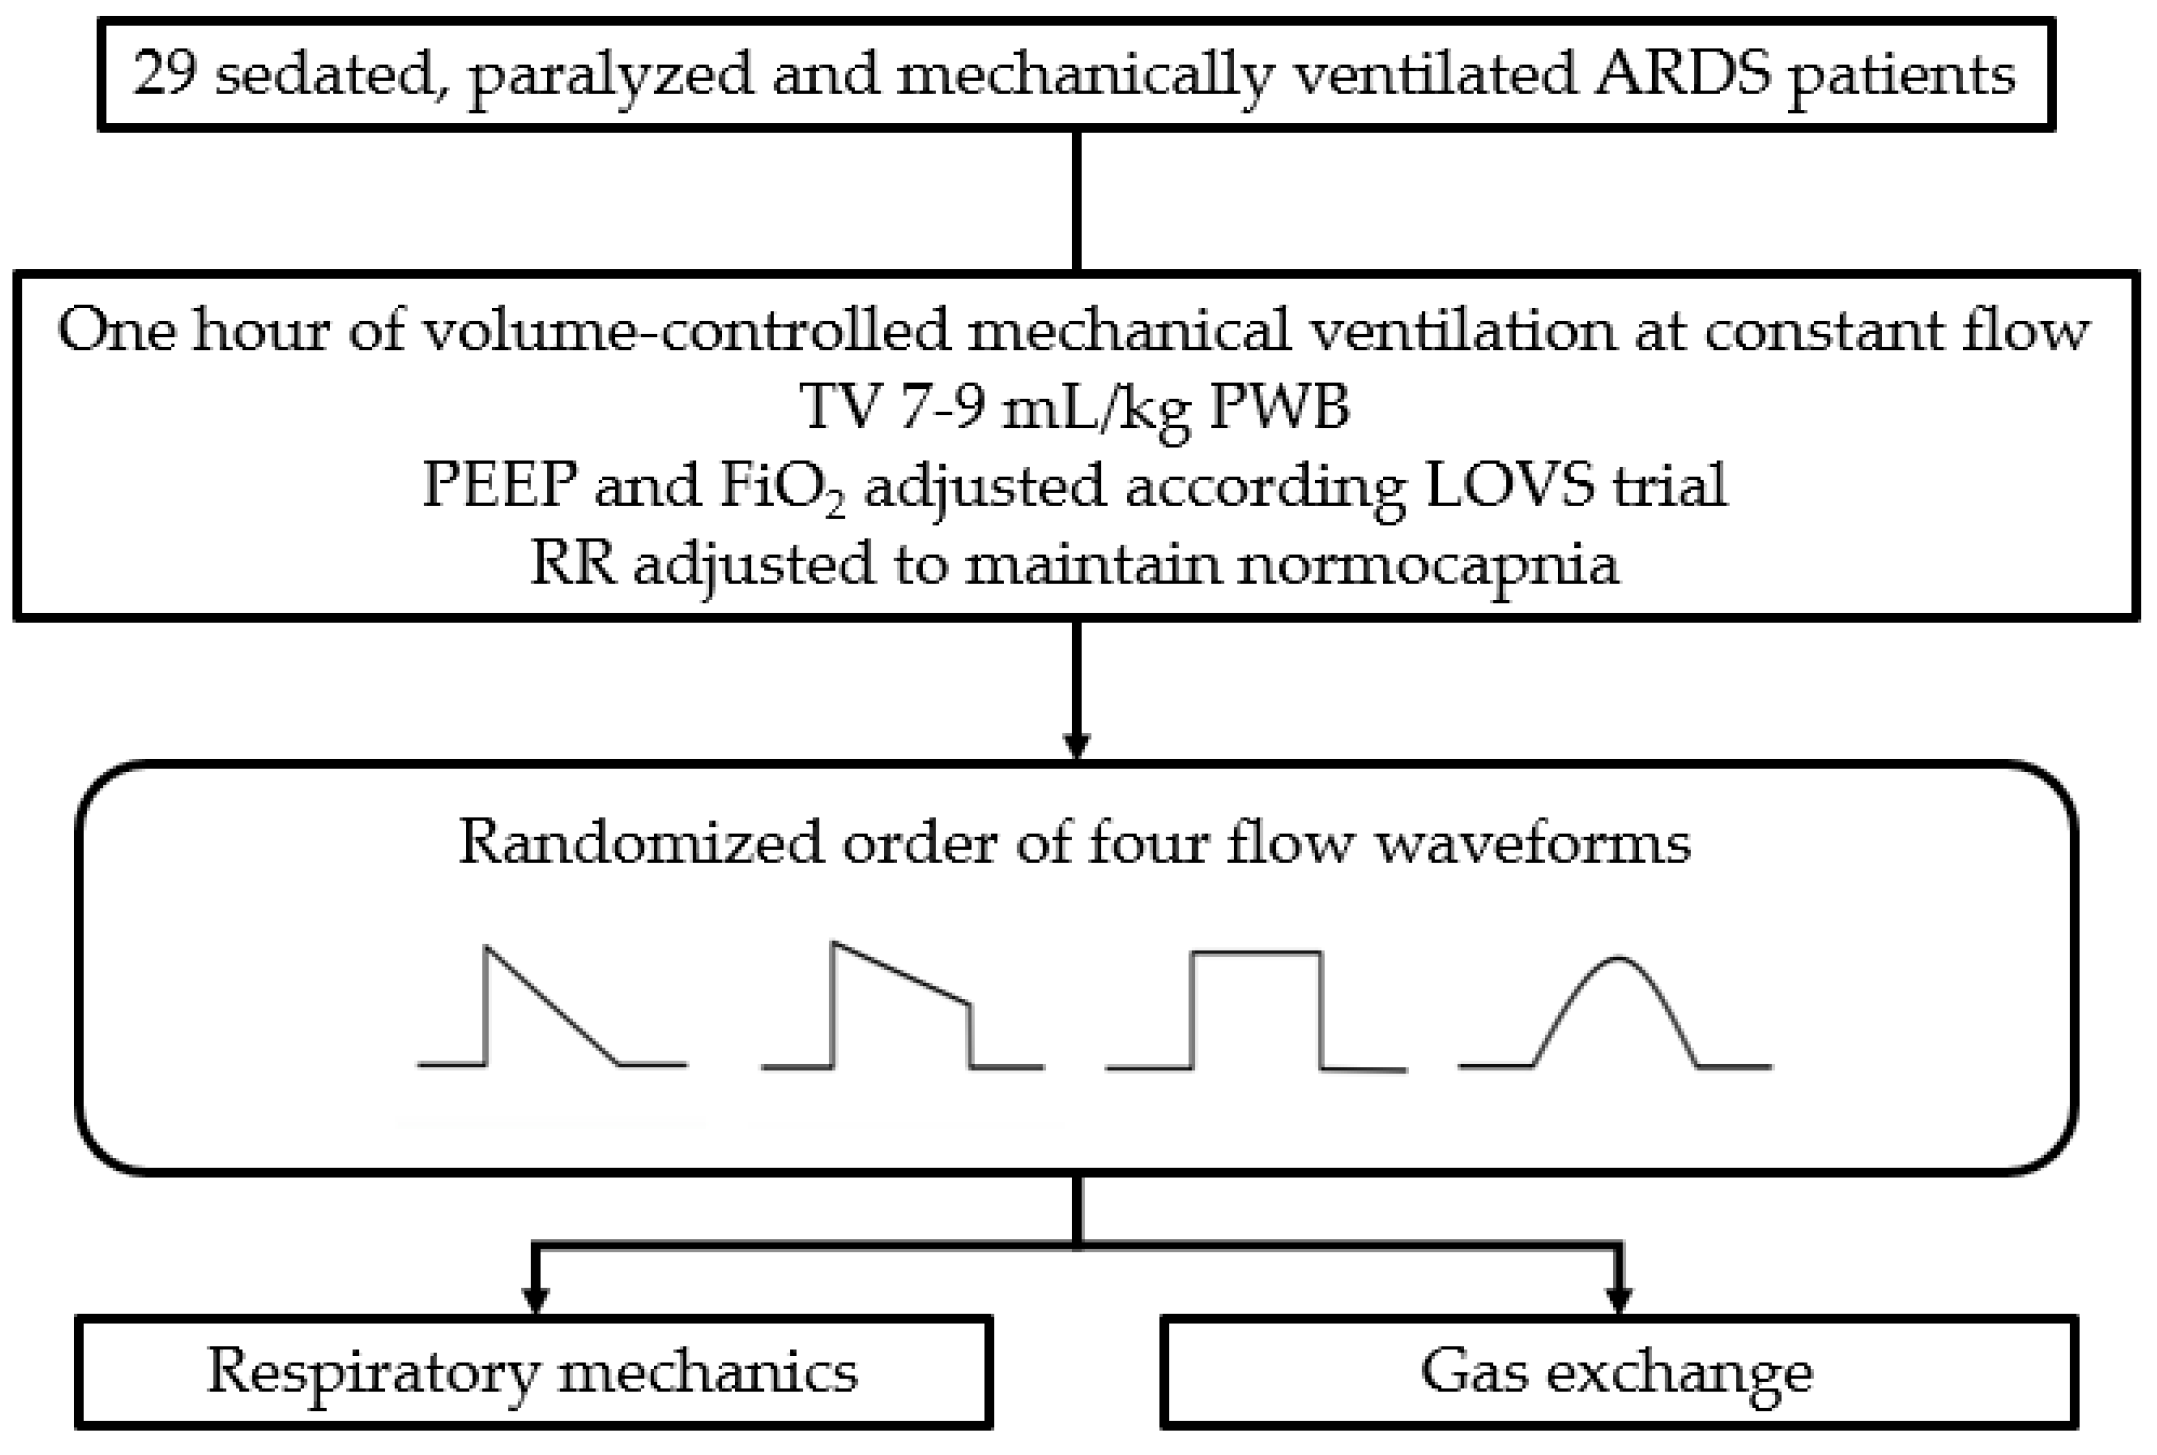
2. Materials and Methods
2.1. Study Protocol
2.2. Measurements
2.3. Statistical Analysis
3. Results
3.1. Breathing Pattern and Respiratory Mechanics
3.2. Gas Exchange and Hemodynamics
4. Discussion
5. Limitations
6. Conclusions
Author Contributions
Funding
Institutional Review Board Statement
Informed Consent Statement
Data Availability Statement
Conflicts of Interest
References
- Tobin, M.J. Principles and practice of mechanical ventilation. Shock 1996, 5, 77. [Google Scholar] [CrossRef]
- Esteban, A.; Anzueto, A.; Frutos-Vivar, F.; Alía, I.; Brochard, L.; Stewart, T.E.; Benito, S.; Epstein, S.K.; Apezteguía, C.; Nightingale, P.; et al. Characteristics and Outcomes in Adult Patients Receiving Mechanical VentilationA 28-Day International Study. JAMA 2002, 287, 345–355. [Google Scholar] [CrossRef] [PubMed]
- Esteban, A.; Ferguson, N.; Meade, M.O.; Frutos-Vivar, F.; Apezteguia, C.; Brochard, L.; Raymondos, K.; NIN, N.; Hurtado, J.; Tomicic, V.; et al. Evolution of Mechanical Ventilation in Response to Clinical Research. Am. J. Respir. Crit. Care Med. 2008, 177, 170–177. [Google Scholar] [CrossRef] [PubMed]
- Robert S Campbell, B.R.D. Pressure-Controlled Versus Volume-Controlled Ventilation: Does it matter? Respir. Care 2002, 47, 416–424. [Google Scholar]
- Abraham, E.; Yoshihara, G. Cardiorespiratory Effects of Pressure Controlled Ventilation in Severe Respiratory Failure. Chest 1990, 98, 1445–1449. [Google Scholar] [CrossRef] [Green Version]
- Hubmayr, R.D.; Abel, M.D.; Rehder, K. Physiologic approach to mechanical ventilation. Crit. Care Med. 1990, 18, 103–113. [Google Scholar] [CrossRef]
- Rittayamai, N.; Katsios, C.M.; Beloncle, F.; Friedrich, J.O.; Mancebo, J.; Brochard, L. Pressure-Controlled vs Volume-Controlled Ventilation in Acute Respiratory Failure. Chest 2015, 148, 340–355. [Google Scholar] [CrossRef]
- Kallet, R.H.; Campbell, A.R.; Dicker, R.A.; Katz, J.A.; Mackersie, R.C. Work of breathing during lung-protective ventilation in patients with acute lung injury and acute respiratory distress syndrome: A comparison between volume and pres-sure-regulated breathing modes. Respir. Care 2005, 50, 1623–1631. [Google Scholar]
- Al-Saady, N.; Bennett, E.D. Decelerating inspiratory flow waveform improves lung mechanics and gas exchange in patients on intermittent positive-pressure ventilation. Intensiv. Care Med. 1985, 11, 68–75. [Google Scholar] [CrossRef]
- Polese, G.; Lubli, P.; Poggi, R.; Luzzani, A.; Milic-Emili, J.; Rossi, A. Effects of inspiratory flow waveforms on arterial blood gases and respiratory mechanics after open heart surgery. Eur. Respir. J. 1997, 10, 2820–2824. [Google Scholar] [CrossRef] [Green Version]
- Davis, K.; Branson, R.D.; Campbell, R.S.; Porembka, D.T. Comparison of Volume Control and Pressure Control Ventilation: Is Flow Waveform the Difference? J. Trauma Inj. Infect. Crit. Care 1996, 41, 808–814. [Google Scholar] [CrossRef] [PubMed]
- Guérin, C.; Lemasson, S.; La Cara, M.; Fournier, G. Physiological effects of constant versus decelerating inflation flow in patients with chronic obstructive pulmonary disease under controlled mechanical ventilation. Intensiv. Care Med. 2001, 28, 164–169. [Google Scholar] [CrossRef]
- Lofstrom, H. Effects on Breathing Mechanics and Gas Exchange of Different Inspiratory Gas Flow Patterns during Anaesthe-sia. Acta Anaesthesiol. Scand. 1975, 19, 8–18. [Google Scholar]
- Rappaport, S.H.; Shpiner, R.; Yoshihara, G.; Wright, J.; Chang, P.; Abraham, E. Randomized, prospective trial of pres-sure-limited versus volume-controlled ventilation in severe respiratory failure. Crit. Care Med. 1994, 22, 22–32. [Google Scholar] [CrossRef]
- Prella, M.; Feihl, F.; Domenighetti, G. Effects of Short-term Pressure-Controlled Ventilation on Gas Exchange, Airway Pressures, and Gas Distribution in Patients with Acute Lung Injury/ARDS. Chest 2002, 122, 1382–1388. [Google Scholar] [CrossRef] [Green Version]
- Yang, S.C.; Yang, S.P. Effects of Inspiratory Flow Waveforms on Lung Mechanics, Gas Exchange, and Respiratory Metabolism in COPD Patients During Mechanical Ventilation. Chest 2002, 122, 2096–2104. [Google Scholar] [CrossRef]
- Gattinoni, L.; Tonetti, T.; Cressoni, M.; Cadringher, P.; Herrmann, P.; Moerer, O.; Protti, A.; Gotti, M.; Chiurazzi, C.; Carlesso, E.; et al. Ventilator-related causes of lung injury: The mechanical power. Intensiv. Care Med. 2016, 42, 1567–1575. [Google Scholar] [CrossRef]
- Force, A.D.T.; Ranieri, V.M.; Rubenfeld, G.D.; Thompson, B.T.; Ferguson, N.D.; Caldwell, E.; Fan, E.; Camporota, L.; Slutsky, A.S. Acute Respiratory Distress Syndrome: The Berlin Definition. JAMA 2012, 307, 2526–2533. [Google Scholar] [CrossRef]
- Meade, M.O.; Cook, D.J.; Guyatt, G.H.; Slutsky, A.S.; Arabi, Y.; Cooper, D.J.; Davies, A.R.; Hand, L.E.; Zhou, Q.; Thabane, L.; et al. Ventilation Strategy Using Low Tidal Volumes, Recruitment Maneuvers, and High Positive End-Expiratory Pressure for Acute Lung Injury and Acute Respiratory Distress Syndrome. JAMA 2008, 299, 637–645. [Google Scholar] [CrossRef] [PubMed] [Green Version]
- Chiumello, D.; Carlesso, E.; Cadringher, P.; Caironi, P.; Valenza, F.; Polli, F.; Tallarini, F.; Cozzi, P.; Cressoni, M.; Colombo, A.; et al. Lung Stress and Strain during Mechanical Ventilation for Acute Respiratory Distress Syndrome. Am. J. Respir. Crit. Care Med. 2008, 178, 346–355. [Google Scholar] [CrossRef] [PubMed] [Green Version]
- Chiumello, D.; Cressoni, M.; Chierichetti, M.; Tallarini, F.; Botticelli, M.; Berto, V.; Mietto, C.; Gattinoni, L. Nitrogen washout/washin, helium dilution and computed tomography in the assessment of end expiratory lung volume. Crit. Care 2008, 12, R150. [Google Scholar] [CrossRef] [Green Version]
- Dammann, J.F.; Mcaslan, T.C.; Maffeo, C.J. Optimal flow pattern for mechanical ventilation of the lungs 2. The effect of a sine versus square wave flow pattern with and without an end-inspiratory pause on patients. Crit. Care Med. 1978, 6, 293–310. [Google Scholar] [CrossRef]
- Baker, A.B.; Babington, P.C.B.; Colliss, J.E.; Cowie, R.W. Effects of Varying Inspiratory Flow Waveform and Time in Intermittent Positive Pressure Ventilation I: Introduction and Methods. Br. J. Anaesth. 1977, 49, 1207–1220. [Google Scholar] [CrossRef] [PubMed] [Green Version]
- Santini, A.; Mauri, T.; Corte, F.D.; Spinelli, E.; Pesenti, A. Effects of inspiratory flow on lung stress, pendelluft, and ventilation heterogeneity in ARDS: A physiological study. Crit. Care 2019, 23, 1–9. [Google Scholar] [CrossRef] [PubMed] [Green Version]
- Roth, H.; Luecke, T.; Deventer, B.; Joachim, A.; Herrmann, P.; Quintel, M. Pulmonary gas distribution during ventilation with different inspiratory flow patterns in experimental lung injury—A computed tomography study. Acta Anaesthesiol. Scand. 2004, 48, 851–861. [Google Scholar] [CrossRef] [PubMed]
- Garcia, C.S.N.B.; Abreu, S.C.; Soares, R.M.L.; Prota, L.F.M.; Figueira, R.C.; Morales, M.M.; Capelozzi, V.L.; Zin, W.A.; Rocco, P.R.M. Pulmonary morphofunctional effects of mechanical ventilation with high inspiratory air flow. Crit. Care Med. 2008, 36, 232–239. [Google Scholar] [CrossRef] [PubMed]
- Kotani, M.; Kotani, T.; Li, Z.; Silbajoris, R.; Piantadosi, C.; Huang, Y.-C. Reduced inspiratory flow attenuates IL-8 release and MAPK activation of lung overstretch. Eur. Respir. J. 2004, 24, 238–246. [Google Scholar] [CrossRef] [PubMed] [Green Version]
- Protti, A.; Maraffi, T.; Milesi, M.; Votta, E.; Santini, A.; Pugni, P.; Andreis, D.T.; Nicosia, F.; Zannin, E.; Gatti, S.; et al. Role of Strain Rate in the Pathogenesis of Ventilator-Induced Lung Edema*. Crit. Care Med. 2016, 44, e838–e845. [Google Scholar] [CrossRef] [PubMed]
- Rich, P.B.; Reickert, C.A.; Sawada, S.; Awad, S.S.; Lynch, W.R.; Johnson, K.J.; Hirschl, A.R.B. Effect of Rate and Inspiratory Flow on Ventilator-Induced Lung Injury. J. Trauma Inj. Infect. Crit. Care 2000, 49, 903–911. [Google Scholar] [CrossRef] [PubMed]
- Maeda, Y.; Fujino, Y.; Uchiyama, A.; Matsuura, N.; Mashimo, T.; Nishimura, M. Effects of Peak Inspiratory Flow on Development of Ventilator-induced Lung Injury in Rabbits. J. Am. Soc. Anesthesiol. 2004, 101, 722–728. [Google Scholar] [CrossRef]


| Characteristics | Study Population (n = 28) |
|---|---|
| Age, years | 72 (56–78) |
| Male sex, % (n) | 71 (20) |
| Height, cm | 168 (164–172) |
| Weight, kg | 71 (66–89) |
| BMI, kg/m2 | 25 (22–31) |
| SAPS II | 45 (35–51) |
| Origin of ARDS, % (n) | |
| Pulmonary Extrapulmonary | 71 (20) 29 (8) |
| ARDS severity | |
| Mild, % (n) Moderate, % (n) Severe, % (n) | 36 (10) 64 (18) 0 (0) |
| Duration of mechanical ventilation, days | 15 (11–22) |
| Intensive care unit length of stay, days | 16 (14–24) |
| Intensive care unit mortality, % (n) | |
| Dead Alive | 43 (12) 57 (16) |
| Tidal volume, mL | 458 (432–471) |
| Tidal volume per predicted body weight, mL/kg | 8.7 (8.2–8.9) |
| Respiratory rate, bpm | 16 (15–17) |
| Minute ventilation, L/min | 7.2 (6.5–7.4) |
| PEEP, cmH2O | 11.3 (10.4–11.5) |
| Driving pressure, cmH2O | 10.6 (9.2–11.0) |
| Respiratory system Elastance, cmH2O/L | 20.4 (16.0–21.6) |
| PaCO2, mmHg | 51.5 (46.4–53.2) |
| PaO2, mmHg | 72.8 (68.0–84.5) |
| FiO2, mmHg | 0.4 (0.4–0.5) |
| PaO2/FiO2 | 182 (151–189) |
| Breathing Pattern | DE | TDE | SQ | SIN | p |
| Respiratory rate, bpm | 16 (15–17) | 16 (15–17) | 16 (15–17) | 16 (15–17) | 0.397 |
| Tidal volume, mL | 465 (428–500) | 465 (428–500) | 465 (428–500) | 465 (428–500) | 0.735 |
| Minute ventilation, L/min | 7.3 (6.7–8.3) | 7.3 (6.7–8.3) | 7.3 (6.7–8.3) | 7.3 (6.7–8.3) | 0.155 |
| Total breathing time, s | 3.7 (3.5–4.0) | 3.7 (3.5–4.0) | 3.7 (3.5–4.0) | 3.7 (3.5–4.0) | 0.397 |
| Inspiratory time, s | 1.1 (1.0–1.1) | 1.1 (1.0–1.1) | 1.1 (1.0–1.1) | 1.1 (1.0–1.1) | 0.389 |
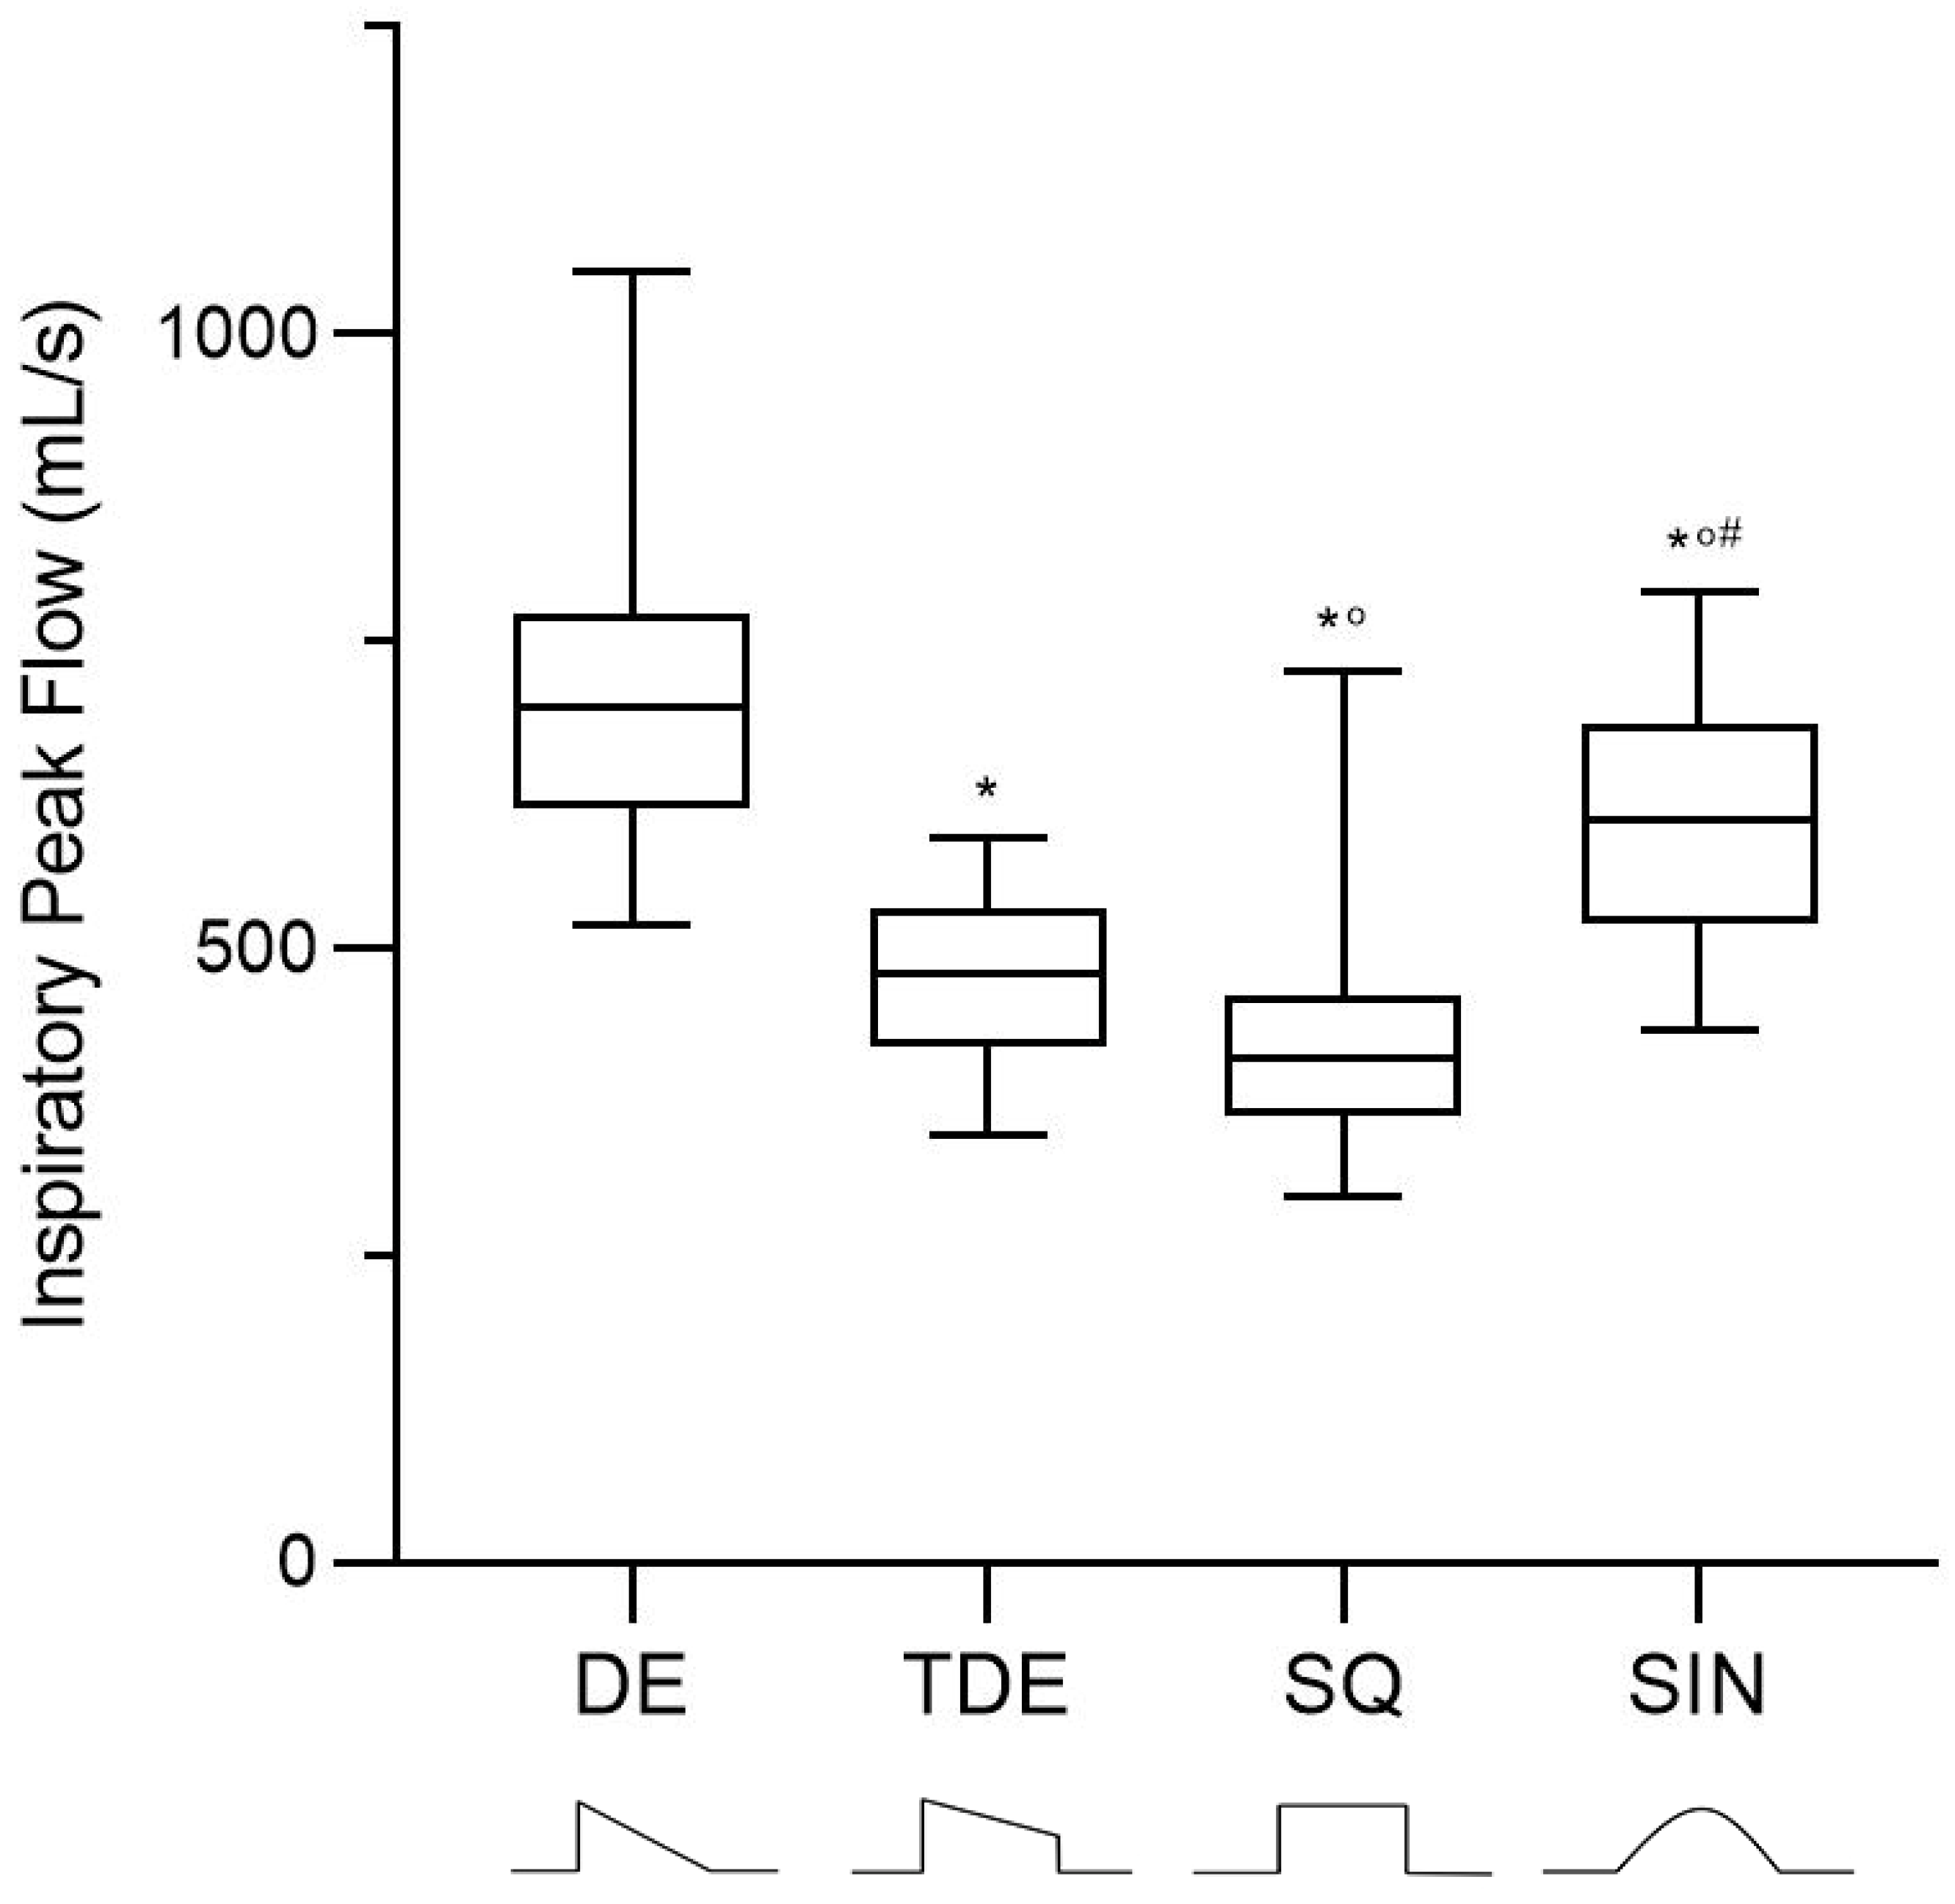
| Inspiratory Peak flow, mL/s | 696 (622–761) | 480 (428–539) * | 411 (364–459) *,# | 611 (533–494) *,°,# | <0.001 |
| Mean Inspiratory flow, L/min | 23.7 (20.8–26.1) | 23.0 (19.4–24.7) * | 21.8 (19.7–24.8) * | 23.9 (21.3–26.4) °,# | 0.020 |
| Respiratory Mechanics Variables | DE | TDE | SQ | SIN | p |
|---|---|---|---|---|---|
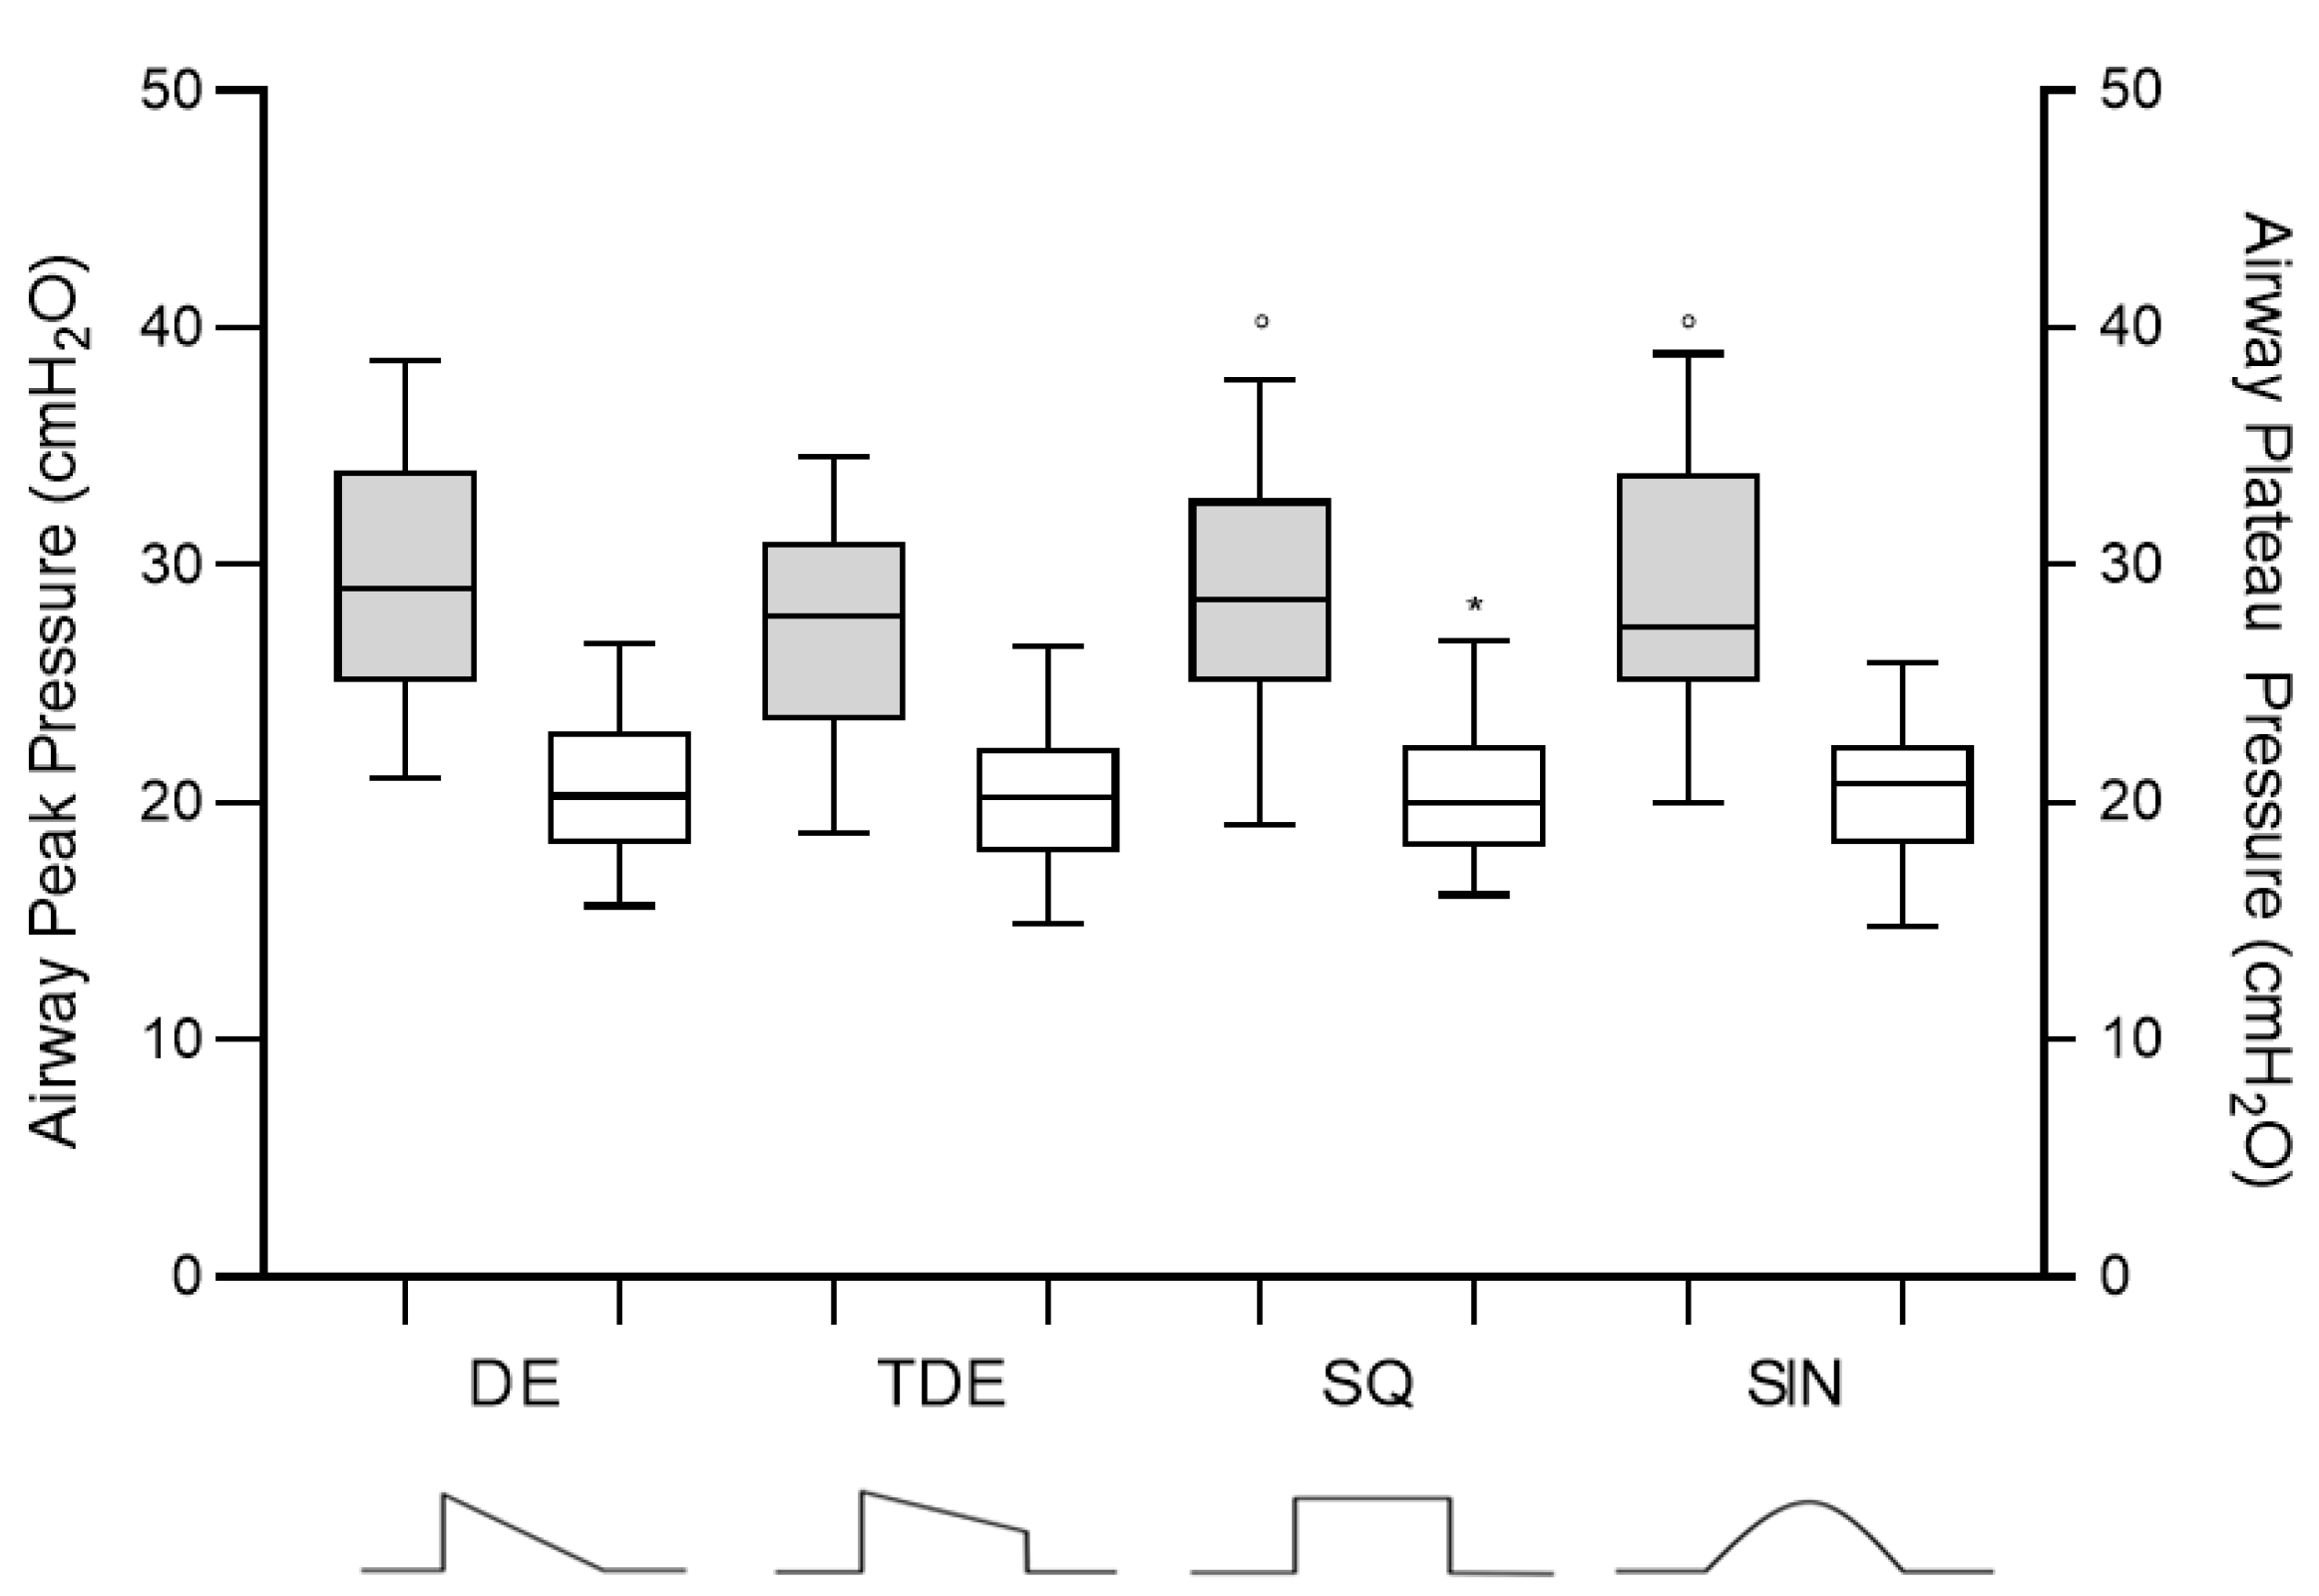
| Airway Peak pressure, cmH2O | 28.5 (25.0–33.2) | 27.8 (23.8–31) | 28.5 (25–32.2) ° | 28.4 (25.8–33.8) ° | <0.001 |
| Airway Plateau pressure, cmH2O | 20.3 (18.4–22.9) | 20.2 (17.9–22.3) | 20.0 (18.2–22.2) * | 20.8 (18.2–22.2) | 0.008 |
| Driving pressure, cmH2O | 8.9 (7.7–11.0) | 8.9 (7.8–10.9) | 8.7 (7.5–10.3) | 8.7 (7.9–10.8) | 0.082 |
| Mean airway pressure, cmH2O | 17 (15–18) | 16 (14–17) | 15 (14–17) | 16 (14–16) | 0.276 |
| Respiratory system elastance, cmH2O/L | 19.5 (15.8–26.1) | 19.1 (15.3–25.4) | 18.1 (15.5–23.3) | 19.9 (15.8–25.0) | 0.195 |
| Lung elastance, cmH2O/L | 13.1 (9.6–17.2) | 12.6 (9.8–15.8) | 11.9 (9.1–15.5) | 12.4 (10.0–16.9) | 0.132 |
| Chest wall elastance, cmH2O/L | 7.2 (5.4–8.6) | 6.5 (4.7–8.4) | 6.7 (6.0–8.3) | 6.9 (5.0–8.7) | 0.412 |
| Mechanical power, J/min | 17.5 (12.8–19.7) | 17.0 (13.4–18.3) | 16.7 (14.2–19.7) ° | 18.2 (14.0–20.8) ° | 0.002 |
| End-expiratory lung volume, mL | 1269 (787–1621) | 1172 (829–1658) | 1172 (729–1608) | 1249 (829–1671) | 0.998 |
| Gas Exchange Variables | DE | TDE | SQ | SIN | p |
|---|---|---|---|---|---|
| PaO2, mmHg | 73 (68–88) | 71 (67–80) | 70 (68–79) * | 73 (68–83) | 0.039 |
| PaO2/FiO2, mmHg | 181 (156–242) | 176 (156–218) | 176 (152–218) * | 172 (152–211) | 0.030 |
| Right-to-left shunt, % | 32 ± 8 | 36 ± 12 | 36 ± 10 | 36 ± 9 * | 0.004 |
| PaCO2, mmHg | 47 (42–56) | 47 (43–58) | 50 (43–58) * | 47 (43–61) * | 0.003 |
Publisher’s Note: MDPI stays neutral with regard to jurisdictional claims in published maps and institutional affiliations. |
© 2021 by the authors. Licensee MDPI, Basel, Switzerland. This article is an open access article distributed under the terms and conditions of the Creative Commons Attribution (CC BY) license (https://creativecommons.org/licenses/by/4.0/).
Share and Cite
Chiumello, D.; Meli, A.; Pozzi, T.; Lucenteforte, M.; Simili, P.; Sterchele, E.; Coppola, S. Different Inspiratory Flow Waveform during Volume-Controlled Ventilation in ARDS Patients. J. Clin. Med. 2021, 10, 4756. https://doi.org/10.3390/jcm10204756
Chiumello D, Meli A, Pozzi T, Lucenteforte M, Simili P, Sterchele E, Coppola S. Different Inspiratory Flow Waveform during Volume-Controlled Ventilation in ARDS Patients. Journal of Clinical Medicine. 2021; 10(20):4756. https://doi.org/10.3390/jcm10204756
Chicago/Turabian StyleChiumello, Davide, Andrea Meli, Tommaso Pozzi, Manuela Lucenteforte, Paolo Simili, Elda Sterchele, and Silvia Coppola. 2021. "Different Inspiratory Flow Waveform during Volume-Controlled Ventilation in ARDS Patients" Journal of Clinical Medicine 10, no. 20: 4756. https://doi.org/10.3390/jcm10204756