
Inner Retinal Layer Thickness Alterations in Early Age Related Macular Degeneration in Eyes with Subretinal Drusenoid Deposits or Conventional Drusen

 , , and
Abstract
:1. Introduction
2. Materials and Methods
3. Results
4. Discussion
Author Contributions
Funding
Institutional Review Board Statement
Informed Consent Statement
Data Availability Statement
Conflicts of Interest
References
- Sivaprasad, S.; Bird, A.; Nitiahpapand, R.; Nicholson, L.; Hykin, P.; Chatrizalli, I. Perspectives on reticular pseudodrusen in age-related macular degeneration. Surv. Ophthalmol. 2016, 16, 521–537. [Google Scholar] [CrossRef] [PubMed]
- Zweifel, S.A.; Spaide, R.F.; Curcio, C.A.; Malek, G.; Imamura, Y. Reticular Pseudodrusen Are Subretinal Drusenoid Deposits. Ophthalmology 2010, 117, 303–312. [Google Scholar] [CrossRef] [PubMed]
- Curcio, C.A.; Messinger, J.D.; Sloan, K.R.; McGwin, G.; Medeiros, N.E.; Spaide, R.F. Subretinal drusenoid deposits in non-neovascular age-related macular degeneration: Morphology, prevalence, topography, and biogenesis model. Retina 2013, 33, 265–276. [Google Scholar] [CrossRef] [Green Version]
- Keane, P.A.; Patel, P.J.; Liakopoulos, S.; Heussen, F.M.; Sadda, S.R.; Tufail, A. Evaluation of age-related macular degenera-tion with optical coherence tomography. Surv. Ophthalmol. 2012, 57, 389–414. [Google Scholar] [CrossRef] [PubMed]
- Ooto, S.; Vongkulsiri, S.; Sato, T.; Suzuki, M.; Curcio, C.A.; Spaide, R.F. Outer Retinal Corrugations in Age-Related Macular Degeneration. JAMA Ophthalmol. 2014, 132, 806–813. [Google Scholar] [CrossRef] [Green Version]
- Trinh, M.; Tong, J.; Yoshioka, N.; Zangerl, B.; Kalloniatis, M.; Nivison-Smith, L. Macula Ganglion Cell Thickness Changes Display Location-Specific Variation Patterns in Intermediate Age-Related Macular Degeneration. Investig. Ophthalmol. Vis. Sci. 2020, 61, 2. [Google Scholar] [CrossRef] [PubMed] [Green Version]
- Ozcaliskan, S.; Artunay, O.; Balci, S.; Perente, I.; Yenerel, N.M. Quantitative analysis of inner retinal structural and micro-vascular alterations in intermediate age-related macular degeneration: A swept-source OCT angiography study. Photodiagnosis Photodyn. Ther. 2020, 32, 102030. [Google Scholar] [CrossRef]
- Shin, I.H.; Lee, W.H.; Lee, J.J.; Jo, Y.J.; Kim, J.Y. Thickness of the macula, retinal nerve fiber layer, and ganglion cell-inner plexıform layer in the age-related macular degeneration: The Repeatability Study of Spectral Domain Optical Coherence Tomography. Retina. 2018, 38, 253–262. [Google Scholar] [CrossRef] [PubMed]
- Camacho, P.; Dutra-Medeiros, M.; PaÅLris, L. Ganglion cell complex in early and intermediate age-related macular degen-eration: Evidence by SD-OCT manual segmentation. Ophthalmology 2017, 238, 31–43. [Google Scholar] [CrossRef]
- Yenice, E.; Sengun, A.; Demirok, G.S.; Turaçlı, E. Ganglion cell complex thickness in nonexudative age-related macular degeneration. Eye 2015, 29, 1076–1080. [Google Scholar] [CrossRef] [Green Version]
- Zucchiatti, I.; Parodi, M.B.; Pierro, L.; Cicinelli, M.V.; Gagliardi, M.; Castellino, N.; Bandello, F. Macular Ganglion Cell Complex and Retinal Nerve Fiber Layer Comparison in Different Stages of Age-Related Macular Degeneration. Am. J. Ophthalmol. 2015, 160, 602–607.e1. [Google Scholar] [CrossRef]
- Lamin, A.; Oakley, J.D.; Dubis, A.M.; Russakoff, D.B.; Sivaprasad, S. Changes in volume of various retinal layers over time in early and intermediate age-related macular degeneration. Eye 2018, 33, 428–434. [Google Scholar] [CrossRef] [PubMed] [Green Version]
- Lee, S.E.; Bin Lim, H.; Shin, Y.I.; Ryu, C.K.; Lee, W.H.; Kim, J.-Y. Characteristics of the inner retinal layer in the fellow eyes of patients with unilateral exudative age-related macular degeneration. PLOS ONE 2020, 15, e0239555. [Google Scholar] [CrossRef]
- Feigl, B.; Brown, B.; Lovie-Kitchin, J.; Swann, P. Functional loss in early age-related maculopathy: The ischaemia post recep-toral hypothesis. Eye (Lond.) 2007, 21, 689–696. [Google Scholar] [CrossRef] [PubMed]
- Spaide, R.F.; Ooto, S.; Curcio, C.A. Subretinal drusenoid deposits AKA pseudodrusen. Surv. Ophthalmol. 2018, 63, 782–815. [Google Scholar] [CrossRef] [PubMed]
- Corvi, F.; Souied, E.H.; Capuano, V.; Costanzo, E.; Benatti, L.; Querques, L.; Bandello, F.; Querques, G. Choroidal structure in eyes with drusen and reticular pseudodrusen determined by binarisation of optical coherence tomographic images. Br. J. Ophthalmol. 2016, 101, 348–352. [Google Scholar] [CrossRef]
- Alten, F.; Heiduschka, P.; Clemens, C.R.; Eter, N. Exploring choriocapillaris under reticular pseudodrusen using OCT-Angiography. Graefe’s Arch. Clin. Exp. Ophthalmol. 2016, 254, 2165–2173. [Google Scholar] [CrossRef] [PubMed]
- Cicinelli, M.V.; Rabiolo, A.; Marchese, A.; De Vitis, L.; Carnevali, A.; Querques, L.; Bandello, F.; Querques, G. Choroid morphometric analysis in non-neovascular age-related macular degeneration by means of optical coherence tomography angiography. Br. J. Ophthalmol. 2017, 101, 1193–1200. [Google Scholar] [CrossRef]
- Cicinelli, M.V.; Rabiolo, A.; Sacconi, R.; Lamanna, F.; Querques, L.; Bandello, F.; Querques, G. Retinal vascular alterations in reticular pseudodrusen with and without outer retinal atrophy assessed by optical coherence tomography angiography. Br. J. Ophthalmol. 2018, 102, 1192–1198. [Google Scholar] [CrossRef]
- Abdolrahimzadeh, S.; Parisi, F.; Marcelli, M.; Giustolisi, R.; Gharbiya, M. Optical coherence tomography evidence of macu-lar ganglion cell-inner plexiform layer thinning in eyes with subretinal drusenoid deposits. Eye (Lond.) 2019, 33, 1290–1296. [Google Scholar] [CrossRef]
- Laíns, I.; Wang, J.; Providência, J.; Mach, S.; Gil, P.; Gil, J.; Marques, M.; Armstrong, G.; Garas, S.; Barreto, P.; et al. Choroidal Changes Associated With Subretinal Drusenoid Deposits in Age-related Macular Degeneration Using Swept-source Optical Coherence Tomography. Am. J. Ophthalmol. 2017, 180, 55–63. [Google Scholar] [CrossRef]
- Zweifel, S.A.; Imamua, Y.; Spaide, T.C.; Fujiwara, T.; Spaide, R.F. Prevalence and significance of suretinal drudenoid depos-its (reticular pseudodrusen) in age-realted macular degeneration. Ophthalmology 2010, 117, 1775–1781. [Google Scholar] [CrossRef]
- Spaide, R.F.; Yannuzzi, L.; Freund, K.B.; Mullins, R.; Stone, E. eyes with subretinal drusenoid deposits and no drusen: Pro-gression of macular findings. Retina 2019, 39, 12–26. [Google Scholar] [CrossRef] [PubMed]
- Gass, J.D.M. Stereoscopic Atlas of Macular Diseases Diagnosis and Treatment, 3rd ed.; Mosby: St. Louis, MO, USA, 1987; Volume 1, p. 3. [Google Scholar]
- Lee, E.K.; Yu, H.G. Ganglion cell-inner plexiform layer and peripapillary retinal nerve fiber layer thicknesses in early age-related macular degeneration. Investig Ophthalmol Vis Sci. 2015, 56, 3976–3983. [Google Scholar] [CrossRef]
- Curcio, C.A.; Allen, K.A. Topography of ganglion cells in human retina. J. Comp. Neurol. 1990, 300, 5–25. [Google Scholar] [CrossRef]
- Spaide, R.F.; Curcio, C.A. Evaluation of segmentation of the superficial and deep vascular layers of the retina by optical co-herence tomography angiography instruments in normal eyes. JAMA Ophthalmol. 2017, 135, 259–262. [Google Scholar] [CrossRef]
- Lee, M.W.; Kim, J.M.; Lim, H.B.; Shin, Y.I.; Lee, Y.H.; Kim, J.Y. Longitudinal changes in ganglion cell-inner plexiform layer of fellow eyes in unilat-eral age-related macular degeneration. Am J. Ophthalmol. 2020, 212, 17–25. [Google Scholar] [CrossRef] [PubMed]
- Hyman, L.; Schachat, A.P.; He, Q.; Leske, M.C. Hypertension, Cardiovascular Disease, and Age-Related Macular Degeneration. Arch. Ophthalmol. 2000, 118, 351–358. [Google Scholar] [CrossRef] [PubMed] [Green Version]
- Bin Lim, H.; Lee, M.W.; Park, J.-H.; Kim, K.M.; Jo, Y.J.; Kim, J.Y. Changes in Ganglion Cell–Inner Plexiform Layer Thickness and Retinal Microvasculature in Hypertension: An Optical Coherence Tomography Angiography Study. Am. J. Ophthalmol. 2019, 199, 167–176. [Google Scholar] [CrossRef]
- Abdolrahimzadeh, S.; Parisi, F.; Scavella, V.; Recupero, S.M. Optical coherence tomography evidence on the correlation of choroidal thickness and age with vascularized retinal layers in normal eyes. Retina 2016, 36, 2329–2338. [Google Scholar] [CrossRef] [PubMed]
- Chiang, T.T.-K.; Keenan, T.D.; Agrón, E.; Liao, J.; Klein, B.; Chew, E.Y.; Cukras, C.A.; Wong, W.T. Macular Thickness in Intermediate Age-Related Macular Degeneration Is Influenced by Disease Severity and Subretinal Drusenoid Deposit Presence. Investig. Ophthalmol. Vis. Sci. 2020, 61, 59. [Google Scholar] [CrossRef] [PubMed]
- Sullivan, R.; Penfold, P.; Pow, D.V. Neuronal Migration and Glial Remodeling in Degenerating Retinas of Aged Rats and in Nonneovascular AMD. Investig. Ophthalmol. Vis. Sci. 2003, 44, 856–865. [Google Scholar] [CrossRef] [PubMed]


| SDD (n = 18) | CD (n = 19) | p-Value a | Control Group (n = 18) | p-Value b | |
|---|---|---|---|---|---|
| Age (Years) | 79.39 ± 8.06 | 80.53 ± 5.35 | 0.614 c | 75.61 ± 6.89 | 0.842 e |
| Sex (M/F) | 13/5 | 9/10 | 0.183 d | 7/11 | 0.113 d |
| BCVA (logMAR) | 0.85 ± 0.19 | 0.86 ± 0,17 | 0.868 c | 0.92 ± 0.11 | 0.331 e |
| Spherical Equivalent (Diopters) | 0.11 ± 1.40 | −0.13 ± 0.89 | 0.533 c | 0.04 ± 0.1 | 0.780 e |
| Phakic/Pseudophakic | 13/5 | 12/7 | 0.721 d | 12/6 | 0.840 d |
| SDD (n = 18) | CD (n = 19) | p-Value a | Control Group (n = 18) | p-Value b | p-Value e | p-Value f | |
|---|---|---|---|---|---|---|---|
| Central 1mm | 70 ± 6.10 | 69.21 ± 9.72 | 0.964 c | 78.22 ± 11.31 | 0.004 d* | 0.026 c* | 0.013 c* |
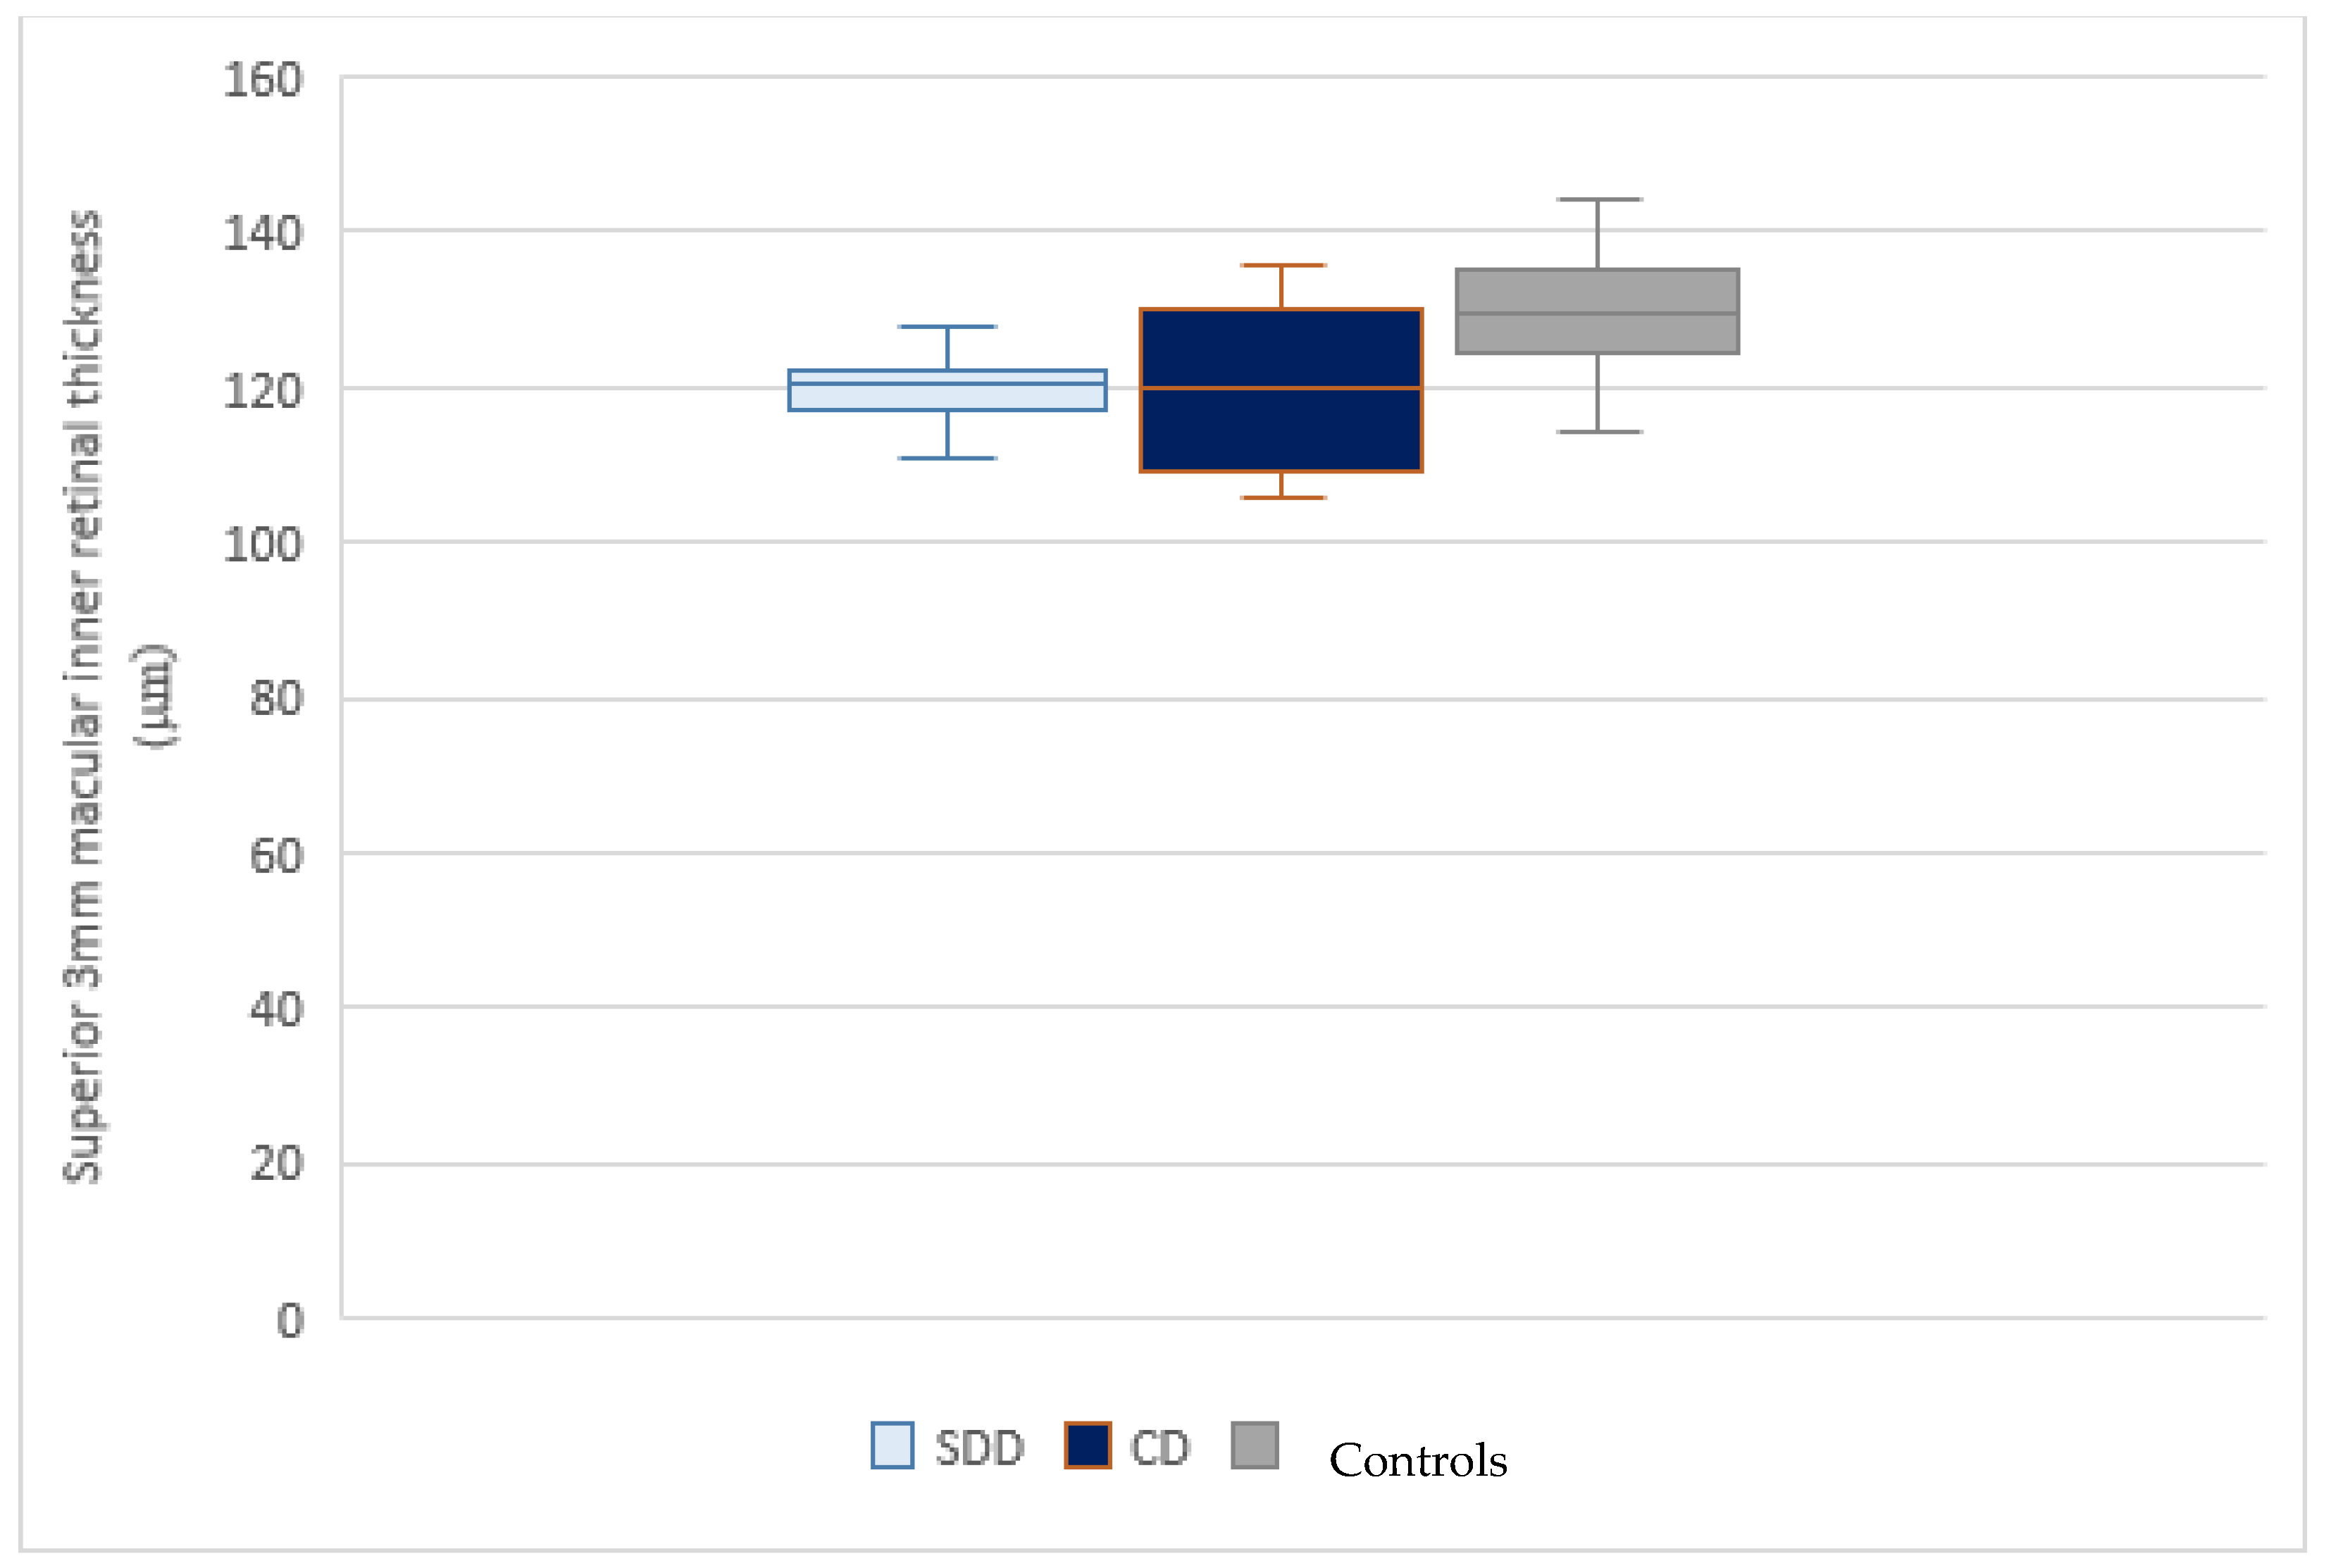
| Superior 3 mm | 118.83 ± 8.99 | 119.89 ± 9.97 | 0.935 c | 129.55 ± 8.58 | 0.003 d* | 0.002 c* | 0.007 c* |
| Inferior 3 mm | 119.88 ± 10.49 | 117.52 ± 13.92 | 0.814 c | 123.11 ± 10.07 | 0.747 d | 0.683 c | 0.324 c |
| Temporal 3 mm | 114.72 ± 9.62 | 114.26 ± 11.77 | 0.448 c | 119.50 ± 10.45 | 0.472 d | 0.372 c | 0.306 c |
| Nasal 3 mm | 117.44 ± 8.44 | 118 ± 10.10 | 0.986 c | 124.44 ± 12.69 | 0.178 d | 0.120 c | 0.164 c |
| Superior 5 mm | 101.61 ± 10.12 | 103.21 ± 8.46 | 0.854 c | 106.88 ± 8.49 | 0.400 d | 0.191 c* | 0.441 c |
| Inferior 5 mm | 100 ± 6.12 | 98.47 ± 10.69 | 0.860 c | 102.16 ± 8.89 | 0.814 d | 0.738 c | 0.419 c |
| Temporal 5 mm | 99.88 ± 10.74 | 99.52 ± 12.71 | 0.994 c | 105.33 ± 10.73 | 0.572 d | 0.329 c | 0.283 c |
| Nasal 5 mm | 105.66 ± 10.92 | 110.57 ± 11.33 | 0.460 c | 112.38 ± 14.69 | 0.306 d | 0.238 c | 0.898 c |
Publisher’s Note: MDPI stays neutral with regard to jurisdictional claims in published maps and institutional affiliations. |
© 2021 by the authors. Licensee MDPI, Basel, Switzerland. This article is an open access article distributed under the terms and conditions of the Creative Commons Attribution (CC BY) license (https://creativecommons.org/licenses/by/4.0/).
Share and Cite
Abdolrahimzadeh, S.; Di Pippo, M.; Sordi, E.; Zweifel, S.A. Inner Retinal Layer Thickness Alterations in Early Age Related Macular Degeneration in Eyes with Subretinal Drusenoid Deposits or Conventional Drusen. J. Clin. Med. 2021, 10, 5136. https://doi.org/10.3390/jcm10215136
Abdolrahimzadeh S, Di Pippo M, Sordi E, Zweifel SA. Inner Retinal Layer Thickness Alterations in Early Age Related Macular Degeneration in Eyes with Subretinal Drusenoid Deposits or Conventional Drusen. Journal of Clinical Medicine. 2021; 10(21):5136. https://doi.org/10.3390/jcm10215136
Chicago/Turabian StyleAbdolrahimzadeh, Solmaz, Mariachiara Di Pippo, Edoardo Sordi, and Sandrine Anne Zweifel. 2021. "Inner Retinal Layer Thickness Alterations in Early Age Related Macular Degeneration in Eyes with Subretinal Drusenoid Deposits or Conventional Drusen" Journal of Clinical Medicine 10, no. 21: 5136. https://doi.org/10.3390/jcm10215136
APA StyleAbdolrahimzadeh, S., Di Pippo, M., Sordi, E., & Zweifel, S. A. (2021). Inner Retinal Layer Thickness Alterations in Early Age Related Macular Degeneration in Eyes with Subretinal Drusenoid Deposits or Conventional Drusen. Journal of Clinical Medicine, 10(21), 5136. https://doi.org/10.3390/jcm10215136