
Estimating Cervical Vertebral Maturation with a Lateral Cephalogram Using the Convolutional Neural Network

 ,
,
Abstract
:1. Introduction
2. Materials and Methods
2.1. Dataset
2.2. Modules
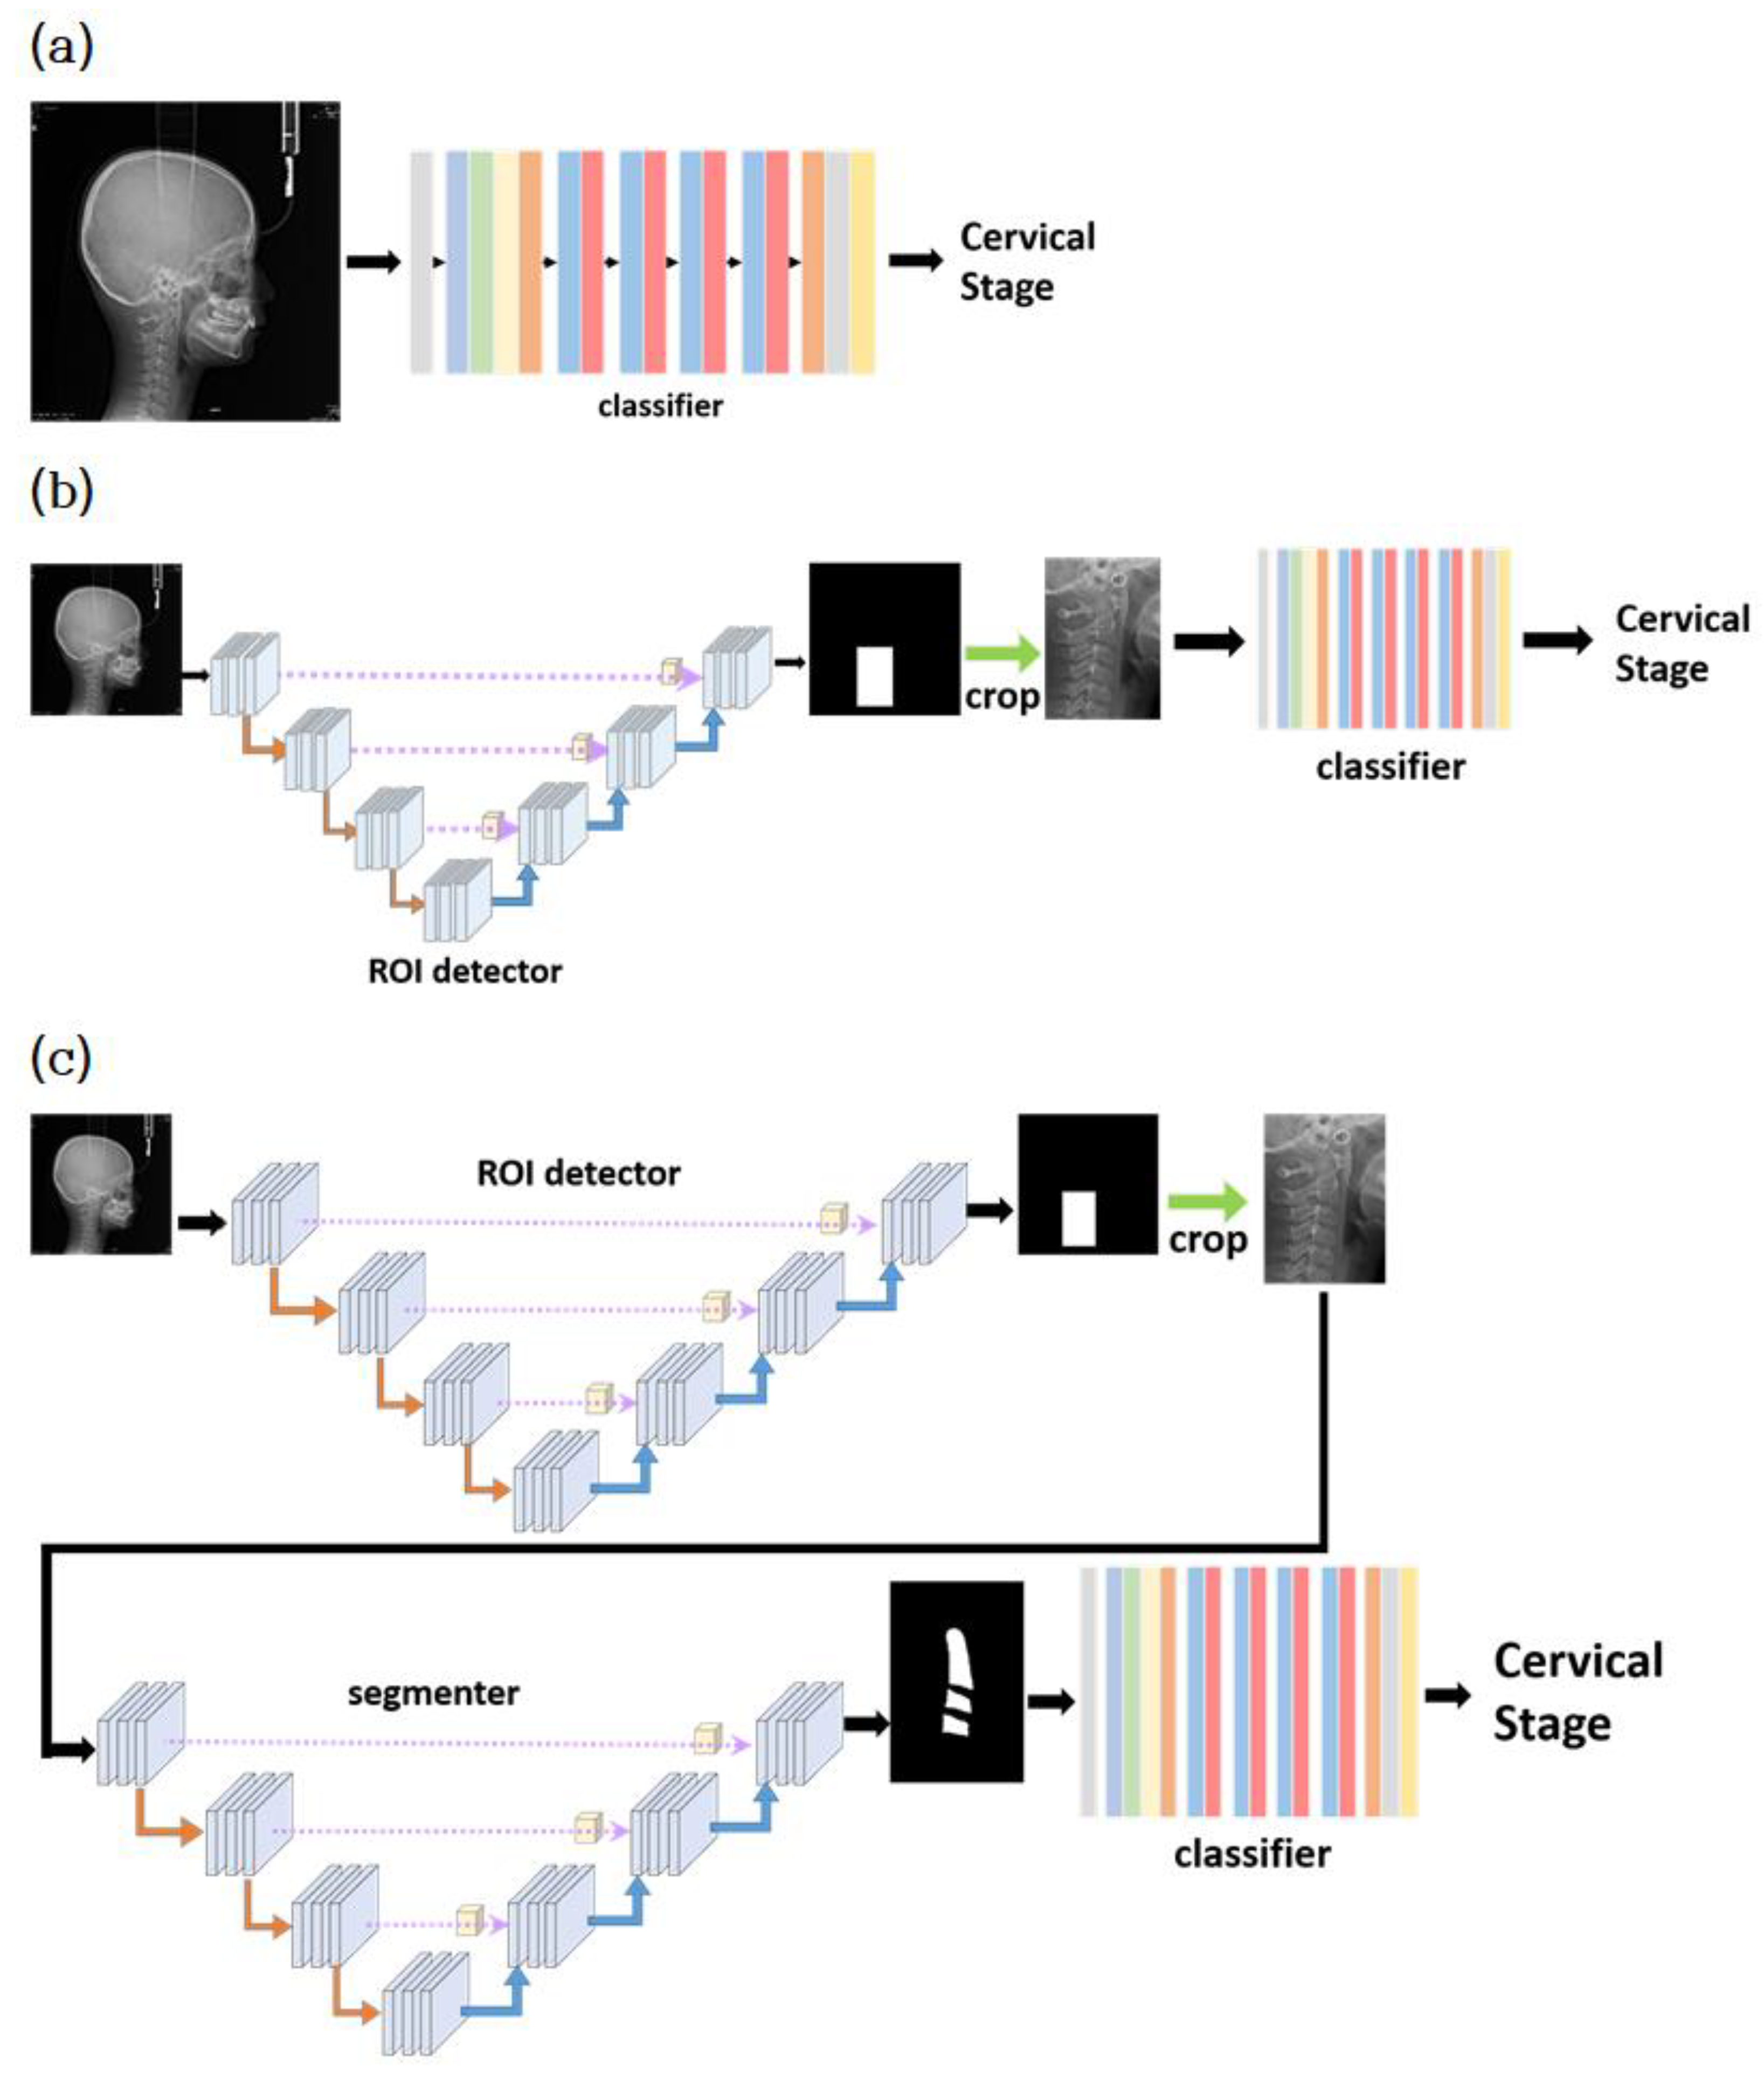
2.2.1. Classifier
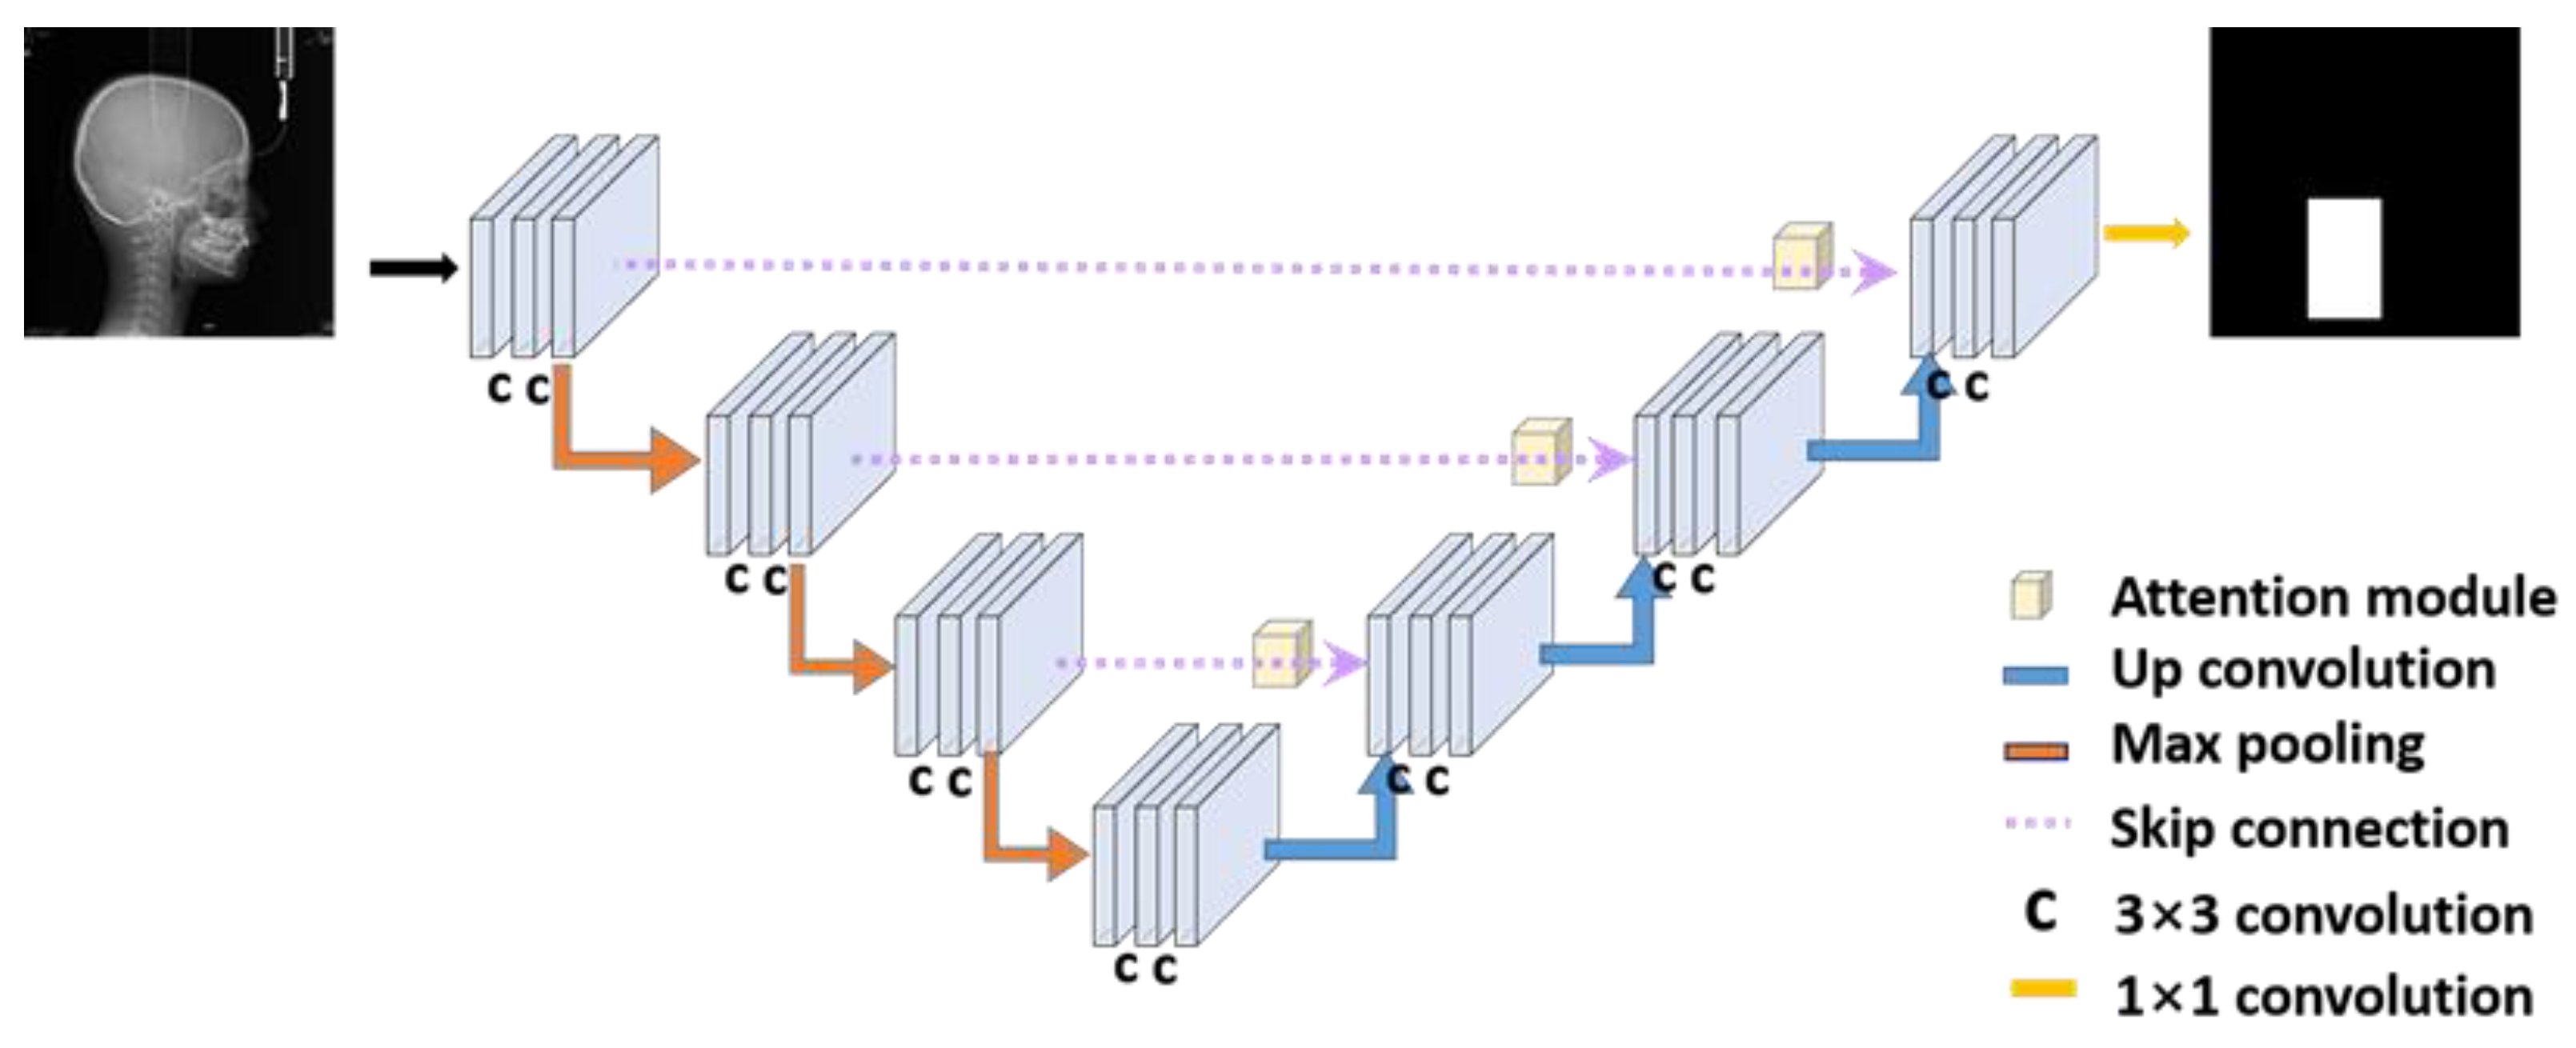
2.2.2. ROI Detector
2.2.3. Segmentor
2.3. Classification Models
3. Results
3.1. Experimental Environment
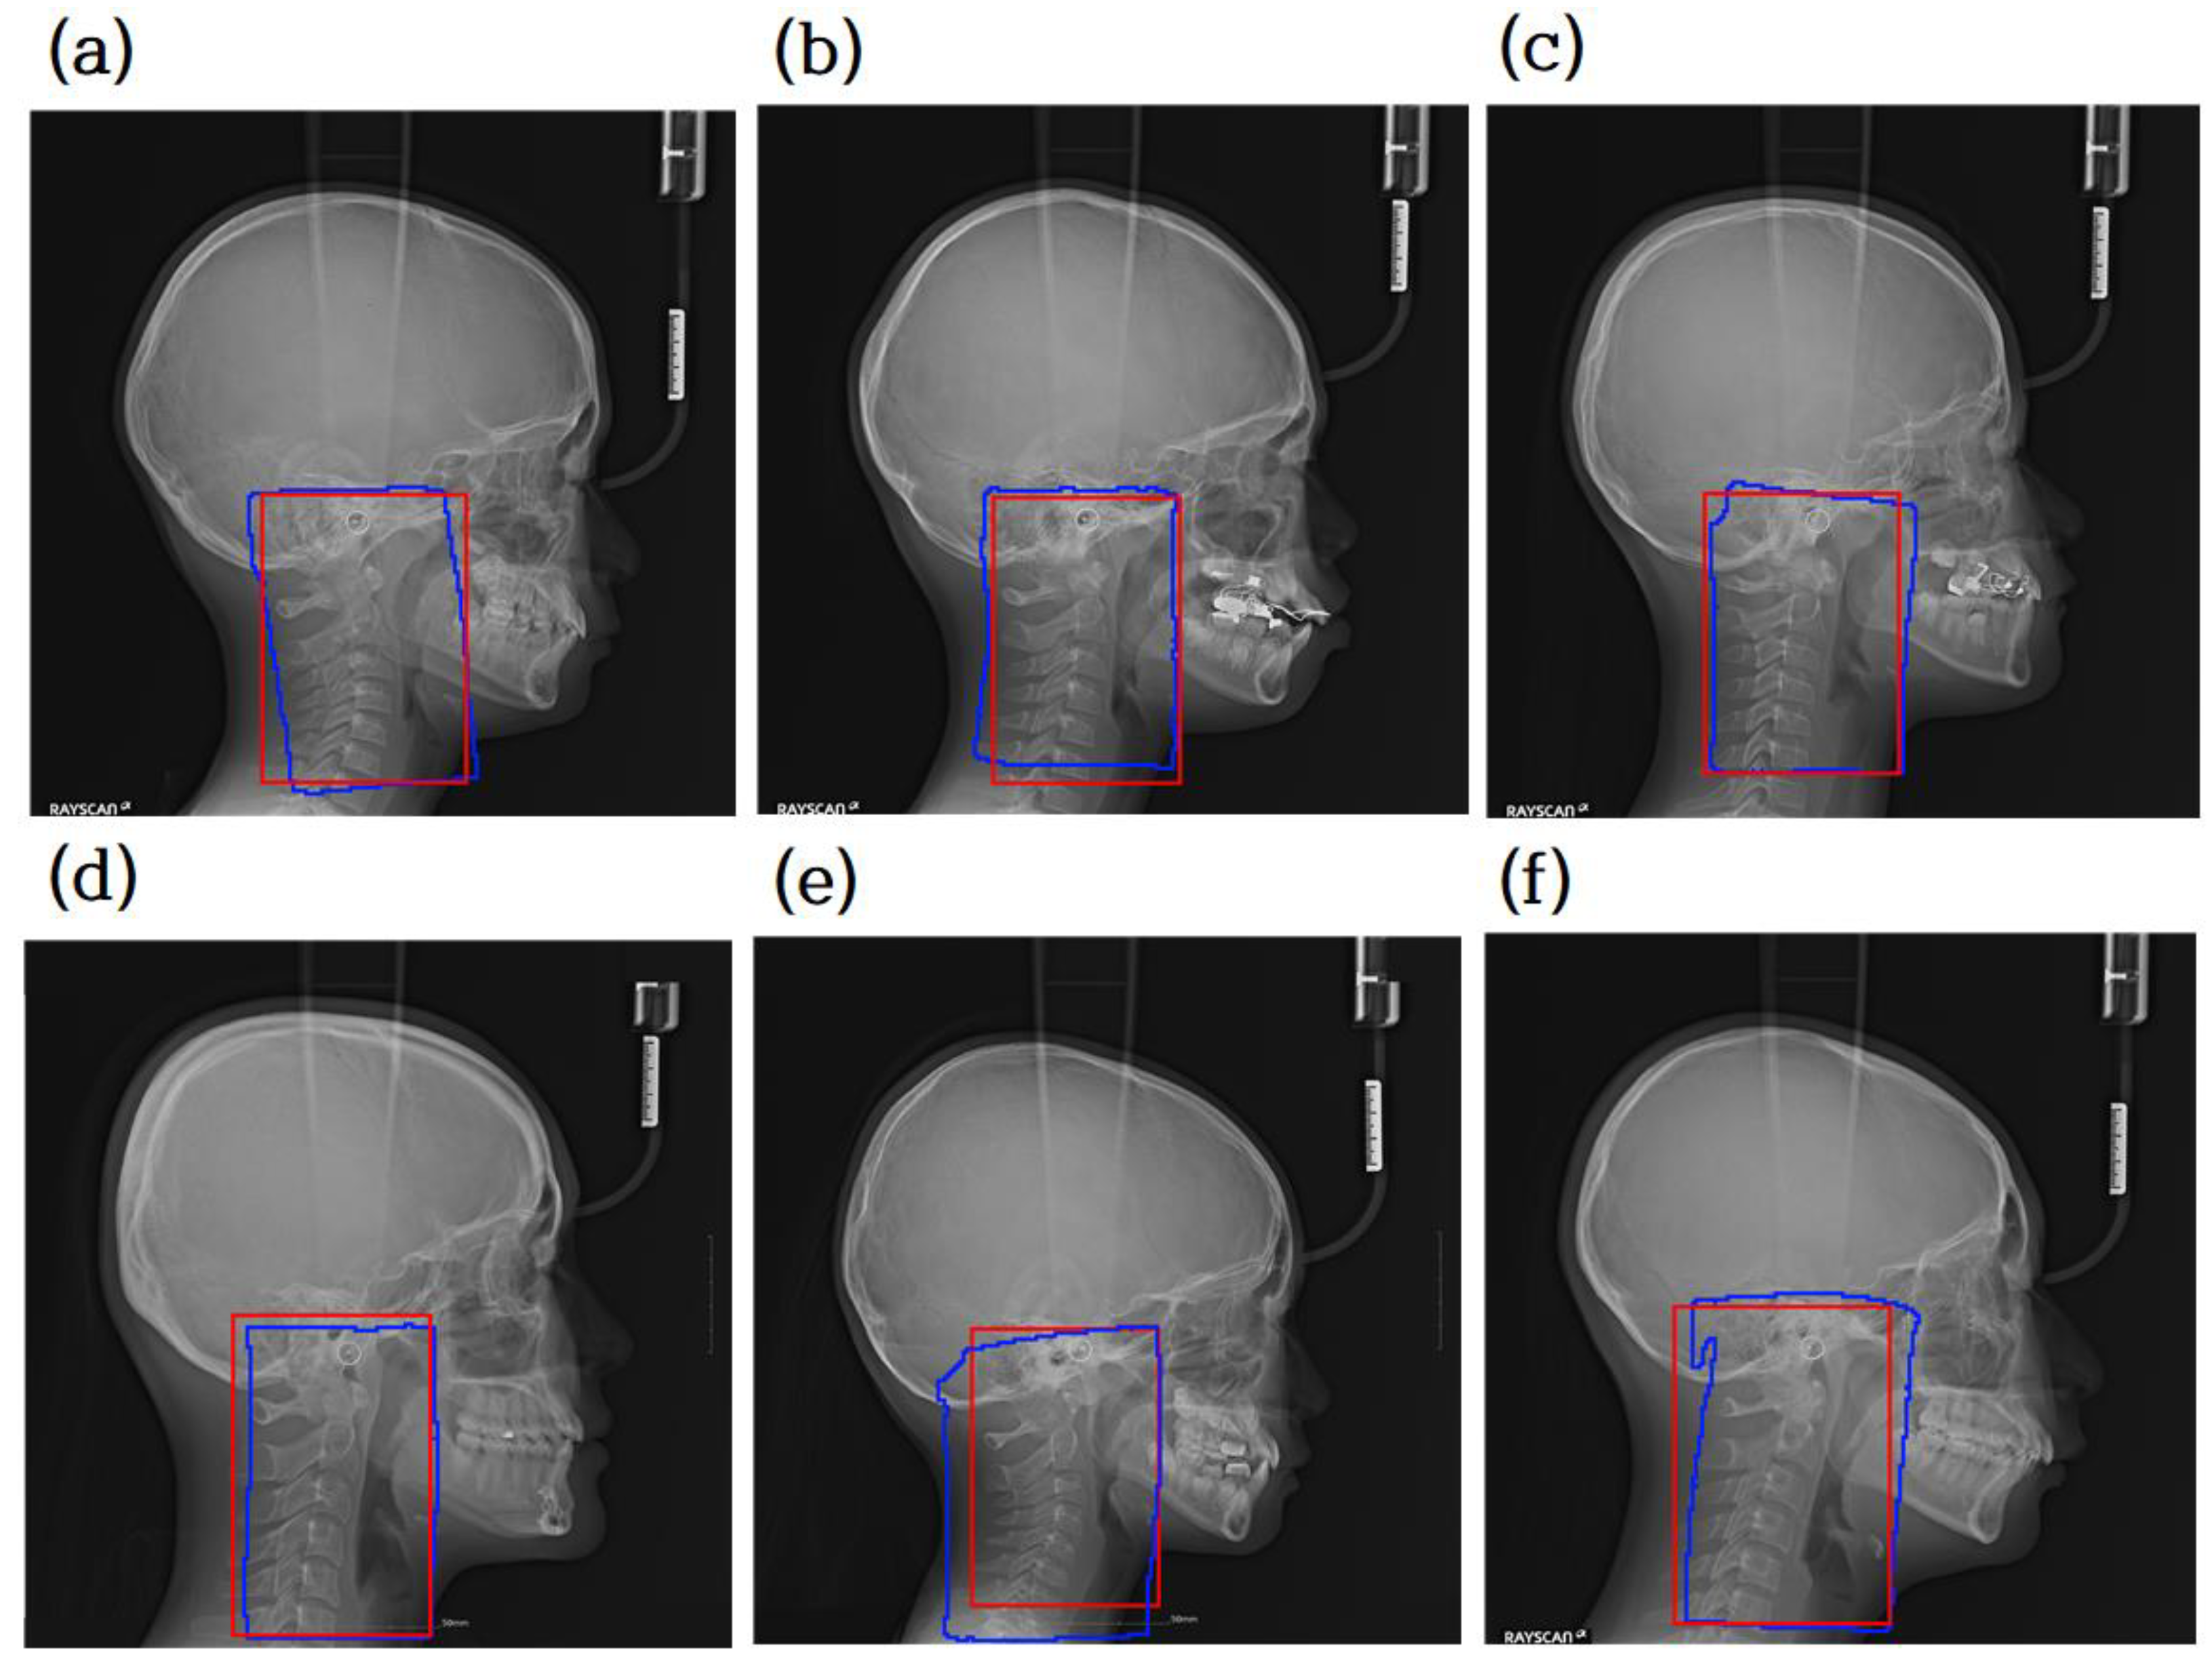
3.2. Evaluation of ROI Detector and Segmentor
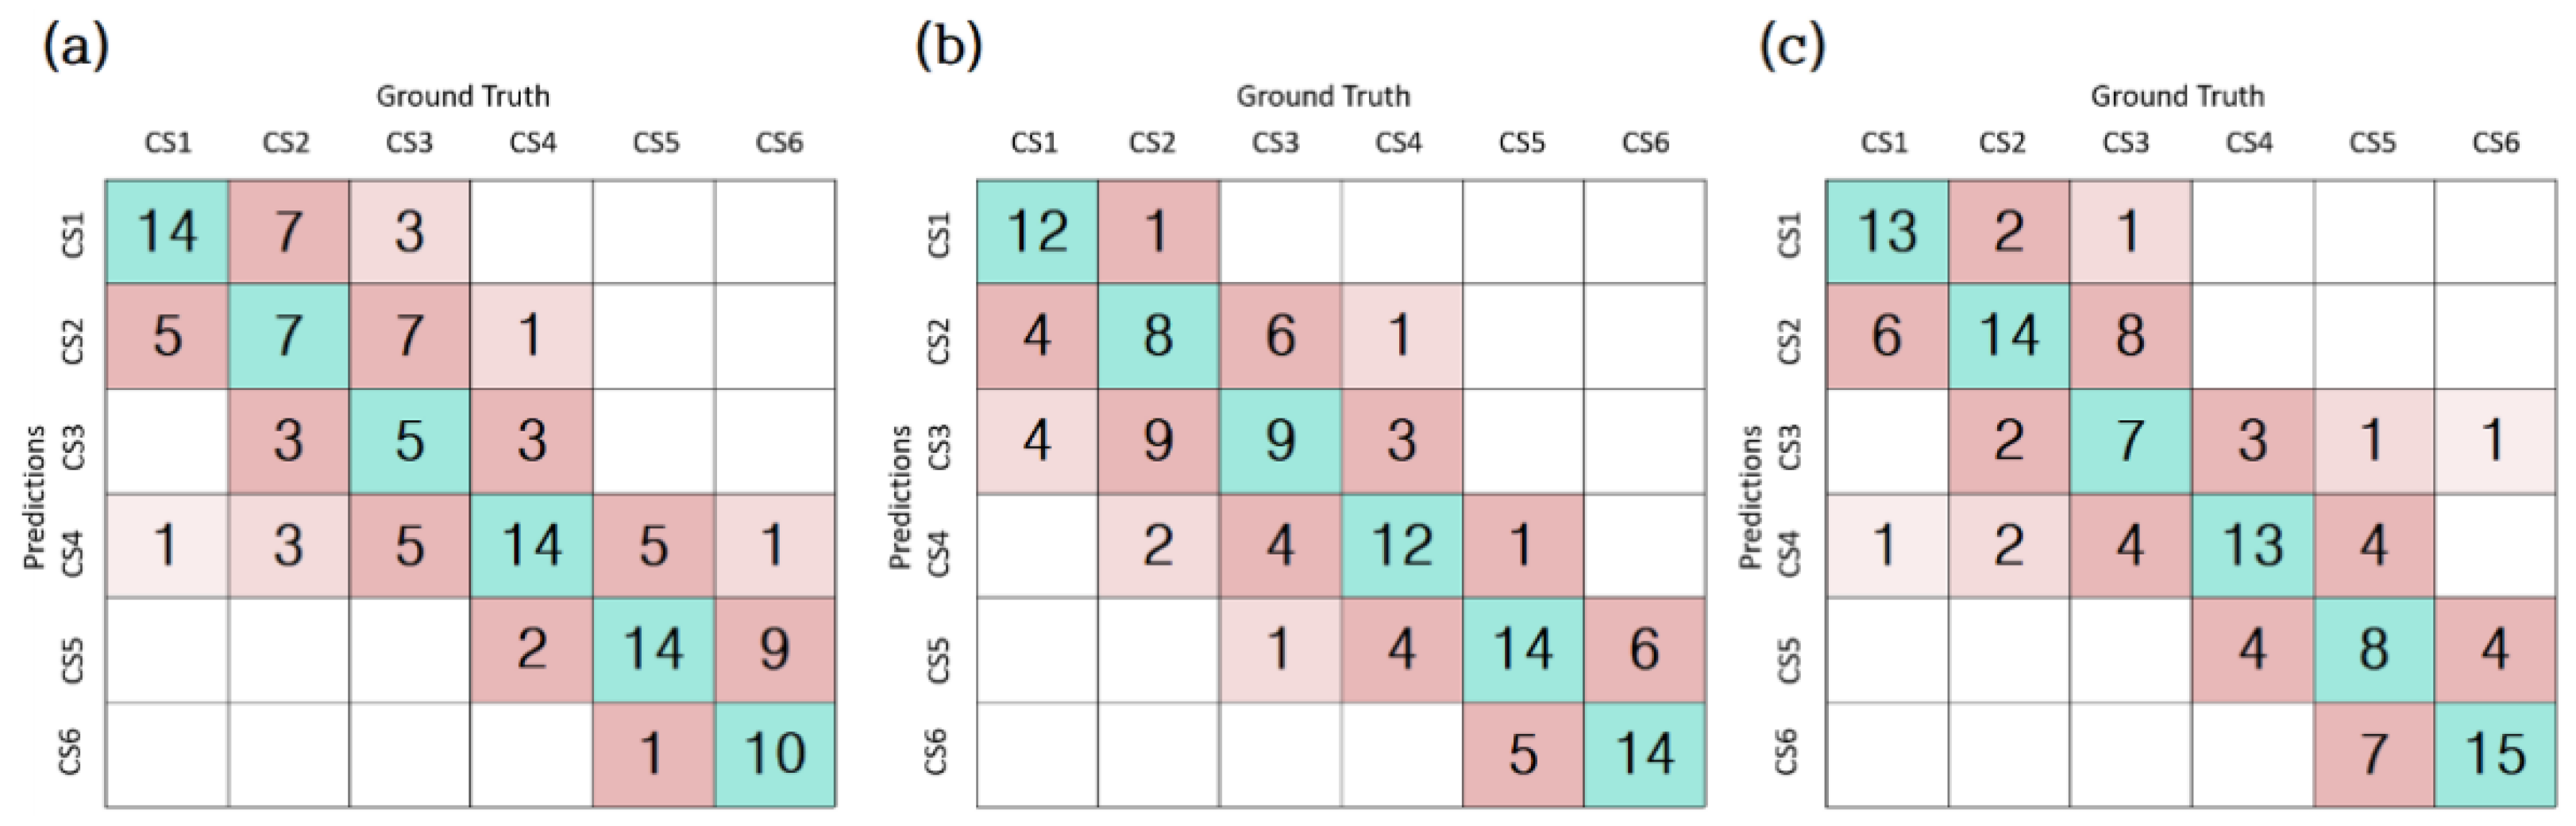
3.3. Evaluation of Classification Accuracy of the Three Models
4. Discussion
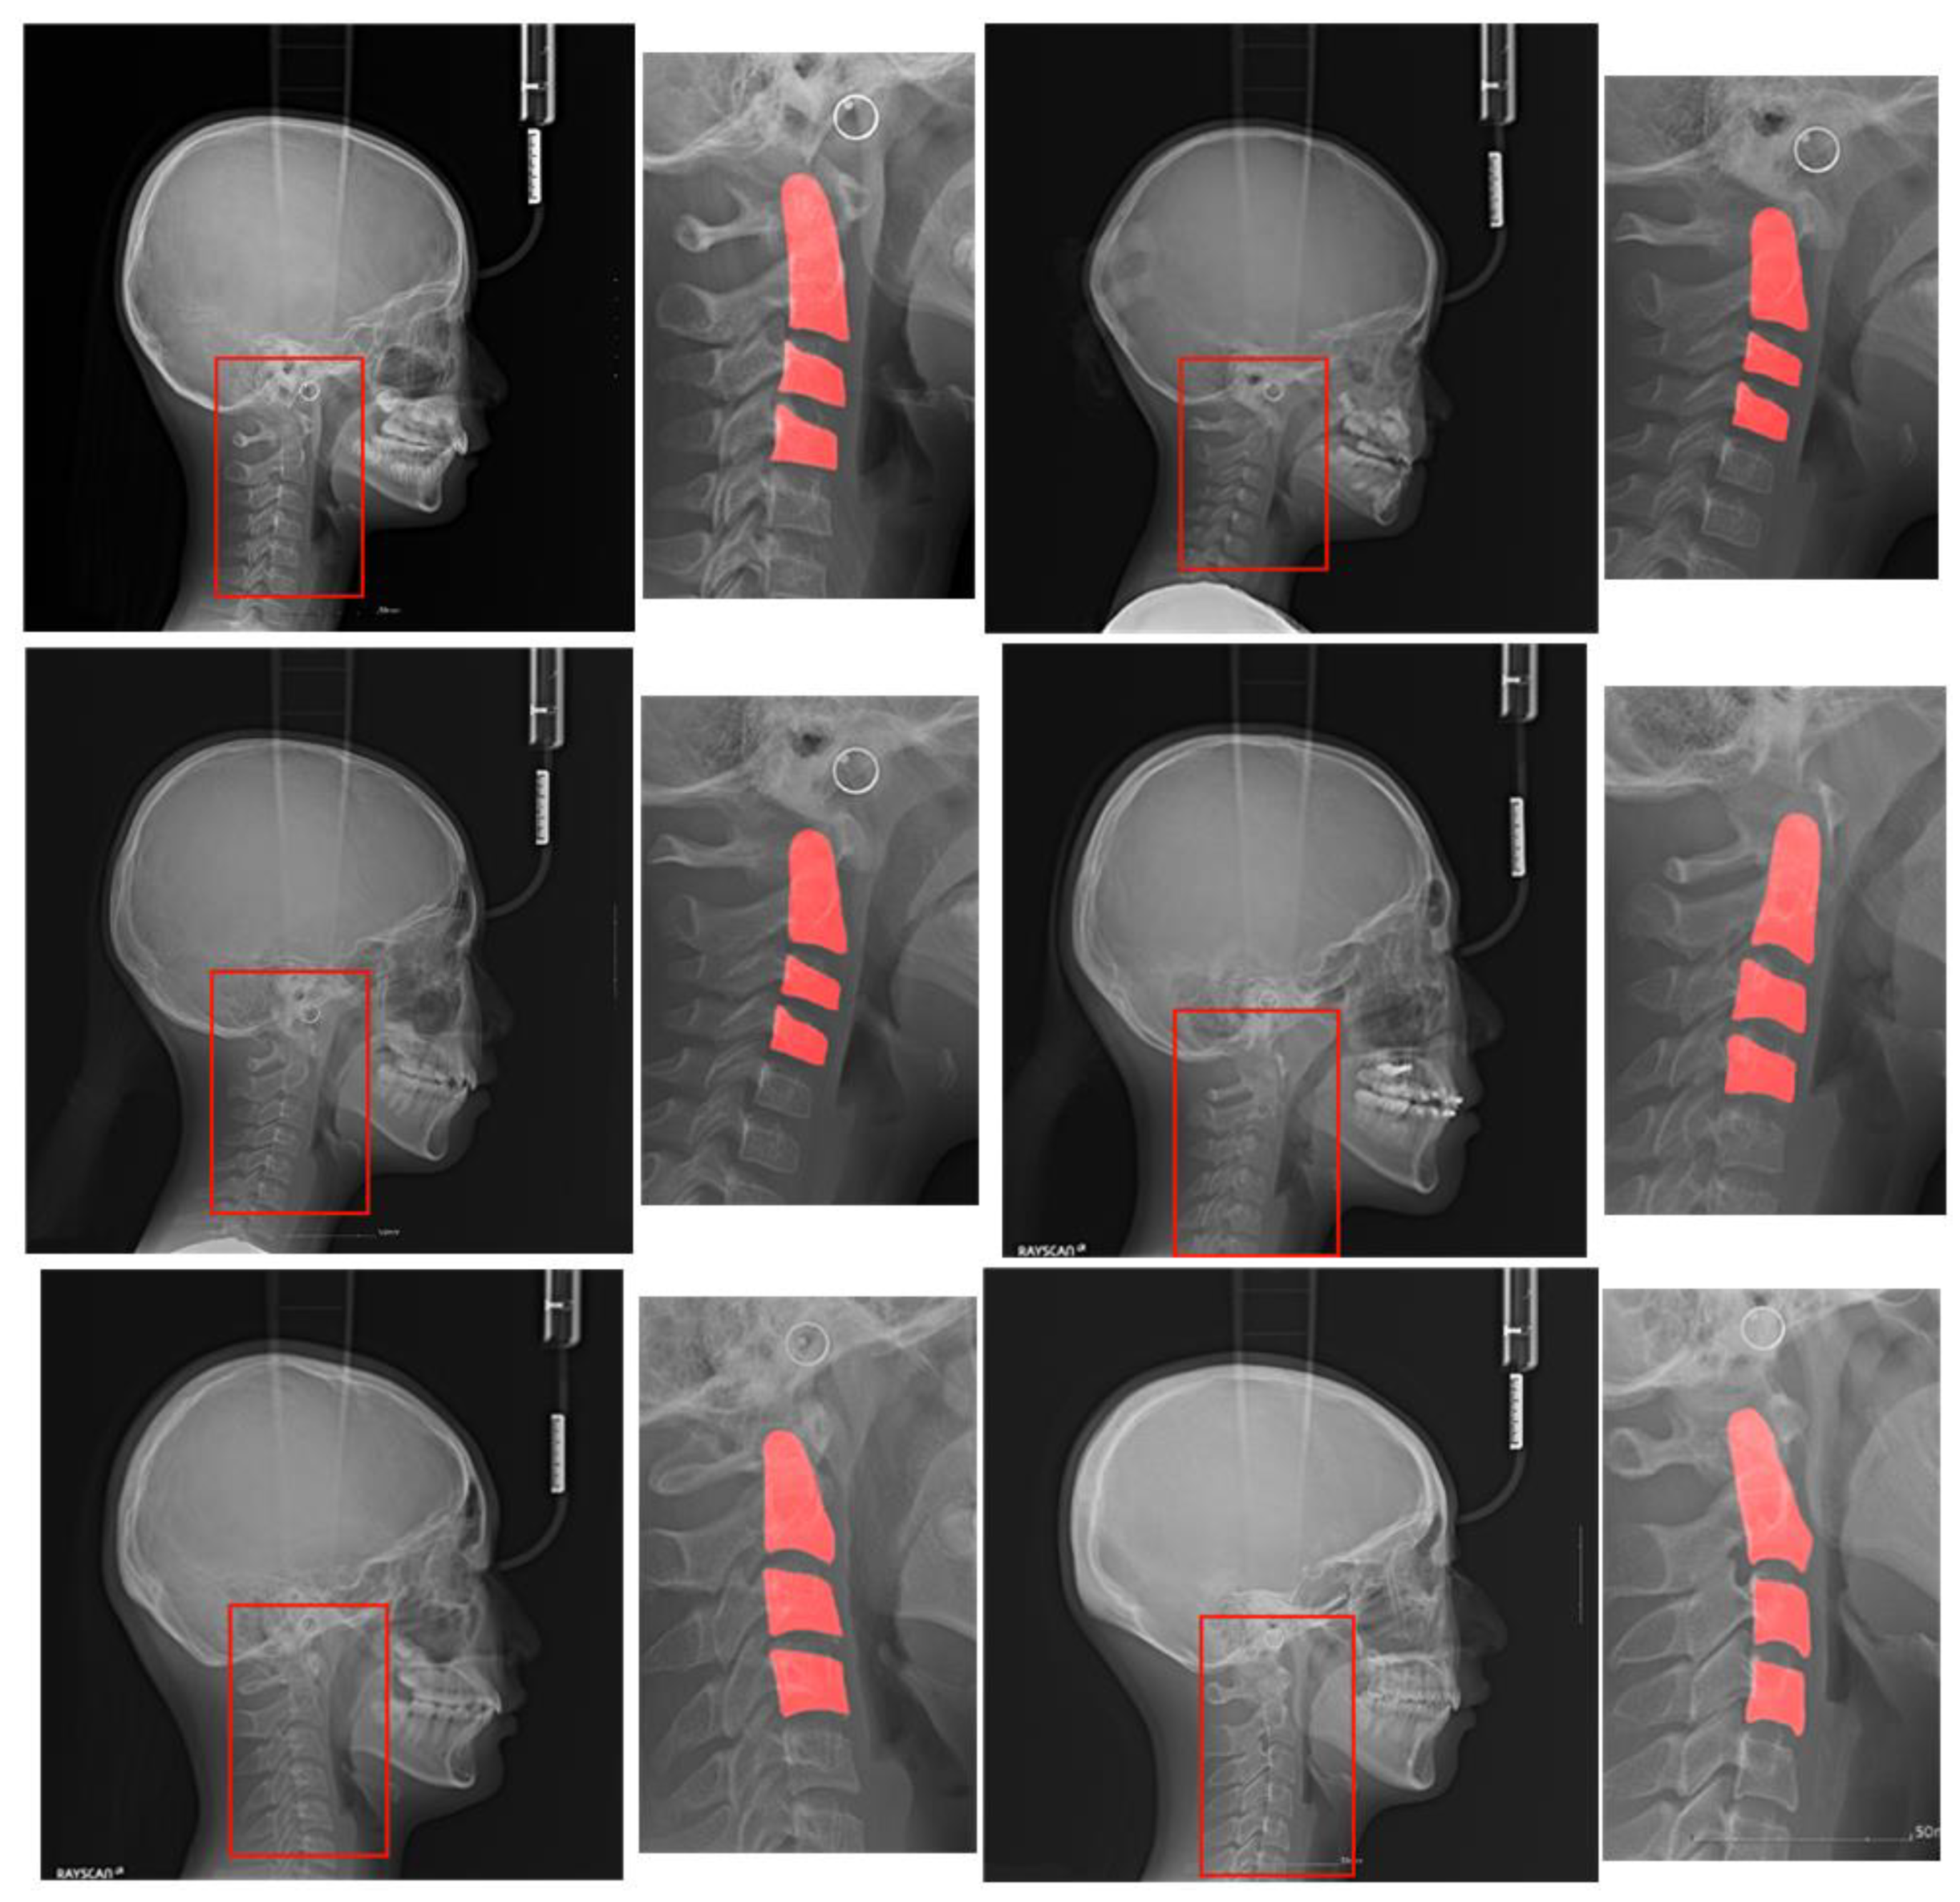
- Dataset construction: Our dataset contains 600 lateral cephalograms collected from patients visiting the Jeonbuk National University Dental Hospital, Korea. Each image is labeled with one of the six classes representing the bone maturity stage. In addition, to support segmentation-based model learning, the C2, C3, and C4 cervical vertebrae are labeled with segmentation information at the pixel level.
- The C2, C3, and C4 cervical vertebrae are very small compared to the whole image, resulting in a severe data imbalance. To solve this issue, we propose attention U-Net models that automatically detect the ROI and segment the C2, C3, and C4 regions with high accuracy.
- We propose three CNN-based classification models: a one-step model with only CVM classification, a two-step model with ROI detection and CVM classification, and a three-step model with ROI detection, cervical segmentation, and CVM classification. Their accuracies were compared with those of our dataset.
5. Conclusions
Author Contributions
Funding
Institutional Review Board Statement
Informed Consent Statement
Data Availability Statement
Conflicts of Interest
References
- Martin, D.D.; Wit, J.M.; Hochberg, Z.; Sävendahl, L.; van Rijn, R.R.; Fricke, O.; Cameron, N.; Caliebe, J.; Hertel, T.; Kiepe, D.; et al. The use of bone age in clinical practice—Part 1. Horm. Res. Paediatr. 2011, 76, 1–9. [Google Scholar] [CrossRef]
- Greulich, W.W.; Pyle, S.I. Radiographic Atlas of Skeletal Development of the Hand and Wrist; Stanford University Press: Redwood City CA, USA, 1959. [Google Scholar]
- Tanner, J.M.; Whitehouse, R.H.; Cameron, N.; Marshall, W.A.; Healy, M.J.R.; Goldstein, H. Assessment of Skeletal Maturity and Prediction of Adult Height (TW2 Method); WB Saunders: London, UK, 2001. [Google Scholar]
- McNamara, J.A.; Franchi, L. The cervical vertebral maturation method: A user’s guide. Angle Orthod. 2018, 88, 133–143. [Google Scholar] [CrossRef] [Green Version]
- Gabriel, D.B.; Southard, K.A.; Qian, F.; Marshall, S.D.; Franciscus, R.G.; Southard, T.E. Cervical vertebrae maturation method: Poor reproducibility. Am. J. Orthod. Dentofacial. Orthop. 2009, 136, 478.e1–478.e7. [Google Scholar] [CrossRef]
- Nestman, T.S.; Marshall, S.D.; Qian, F.; Holton, N.; Franciscus, R.G.; Southard, T.E. Cervical vertebrae maturation method morphologic criteria: Poor reproducibility. Am. J. Orthod. Dentofac. Orthop. 2011, 140, 182–188. [Google Scholar] [CrossRef] [PubMed]
- Spampinato, C.; Palazzo, S.; Giordano, D.; Aldinucci, M.; Leonardi, R. Deep learning for automated skeletal bone age assessment in X-ray images. Med. Image Anal. 2017, 36, 41–51. [Google Scholar] [CrossRef]
- Lee, H.; Tajmir, S.; Lee, J.; Zissen, M.; Yeshiwas, B.A.; Alkasab, T.K.; Choy, G.; Do, S. Fully automated deep learning system for bone age assessment. J. Digit. Imaging 2017, 30, 427–441. [Google Scholar] [CrossRef] [Green Version]
- Kim, J.R.; Shim, W.H.; Yoon, H.M.; Hong, S.H.; Lee, J.S.; Cho, Y.A.; Kim, S. Computerized bone age estimation using deep learning based program: Evaluation of the accuracy and efficiency. Am. J. Roentgenol. 2017, 209, 1374–1380. [Google Scholar] [CrossRef] [PubMed]
- Gray, S.; Bennani, H.; Kieser, J.A.; Farella, M. Morphometric analysis of cervical vertebrae in relation to mandibular growth. Am. J. Orthod. Dentofac. Orthop. 2016, 149, 92–98. [Google Scholar] [CrossRef]
- Baptista, R.S.; Quaglio, C.L.; Mourad, L.M.E.H.; Hummel, A.D.; Caetano, C.A.C.; Ortolani, C.L.F.; Pisa, I.T. A semi-automated method for bone age assessment using cervical vertebral maturation. Angle Orthod. 2012, 82, 658–662. [Google Scholar] [CrossRef] [PubMed] [Green Version]
- Džemidžić, V.; Sokic, E.; Tiro, A.; Nakaš, E. Computer based assessment of cervical vertebral maturation stages using digital lateral cephalograms. Acta Inform. Med. 2015, 23, 364. [Google Scholar] [CrossRef] [PubMed] [Green Version]
- Moraes, D.R.; Casati, J.P.; Rodrigues, E.L. Analysis of polynomial behavior of the C3 cervical concavity to bone age estimation using artificial neural networks. In Proceedings of the 2013 ISSNIP Biosignals Biorobotics Conference: Biosignals and Robotics for Better and Safer Living (BRC), Rio de Janeiro, Brazil, 18–20 February 2013; pp. 1–6. [Google Scholar]
- Kök, H.; Acilar, A.M.; İzgi, M.S. Usage and comparison of artificial intelligence algorithms for determination of growth and development by cervical vertebrae stages in orthodontics. Prog. Orthod. 2019, 20, 41. [Google Scholar] [CrossRef] [PubMed]
- Amasya, H.; Yildirim, D.; Aydogan, T.; Kemaloglu, N.; Orhan, K. Cervical vertebral maturation assessment on lateral cephalometric radiographs using artificial intelligence: Comparison of machine learning classifier models. Dentomaxillofac. Radiol. 2020, 49, 20190441. [Google Scholar] [CrossRef] [PubMed]
- Makaremi, M.; Lacaule, C.; Mohammad-Djafari, A. Deep learning and artificial intelligence for the determination of the cervical vertebra maturation degree from lateral radiography. Entropy 2019, 21, 1222. [Google Scholar] [CrossRef] [Green Version]
- Seo, H.; Hwang, J.; Jeong, T.; Shin, J. Comparison of Deep Learning Models for Cervical Vertebral Maturation Stage Classification on Lateral Cephalometric Radiographs. J. Clin. Med. 2021, 10, 3591. [Google Scholar] [CrossRef]
- Baccetti, T.; Franchi, L.; McNamara, J.A., Jr. The cervical vertebral maturation (CVM) method for the assessment of optimal treatment timing in dentofacial orthopedics. Angle Orthod. 2002, 72, 316–323. [Google Scholar] [CrossRef] [PubMed]
- Lin, T.Y.; Goyal, P.; Girshick, R.; He, K.; Dollar, P. Focal loss for dense object detection. IEEE Trans. Pattern Anal. Mach. Intell. 2018, 2, 318–327. [Google Scholar]
- Taghanaki, S.A.; Zheng, Y.; Zhou, S.K.; Georgescu, B.; Sharma, P.; Xu, D.; Comaniciu, D.; Hamarneh, G. Combo loss: Handling input and output imbalance in multi-organ segmentation. Comput. Med. Imaging Graph. 2019, 75, 24–33. [Google Scholar] [CrossRef] [Green Version]
- Deng, J.; Dong, W.; Socher, R.; Li, L.-J.; Li, K.; Fei-Fei, L. ImageNet: A large-scale hierarchical image database. In Proceedings of the 2009 IEEE Conference Comput Vision Pattern Recognit, Miami, FL, USA, 20–25 June 2009. [Google Scholar]
- Ronneberger, O.; Fischer, P.; Brox, T. U-Net: Convolutional Networks for Biomedical Image Segmentation. In Proceedings of the Medical Image Computing and Computer-Assisted Intervention (MICCAI), Munich, Germany, 5–9 October 2015; pp. 234–241. [Google Scholar]
- Oktay, O.; Schlemper, J.; Folgoc, L.L.; Lee, M.J.; Heinrich, M.; Misawa, K.; Mori, K.; McDonagh, S.G.; Hammerla, N.; Kainz, B.; et al. Attention U-net: Learning where to look for the pancreas. arXiv 2018, arXiv:1804.03999. [Google Scholar]
- Schoretsaniti, L.; Mitsea, A.; Karayianni, K.; Sifakakis, L. Cervical Vertebral Maturation Method: Reproducibility and Efficiency of Chronological Age Estimation. Appl. Sci. 2021, 11, 3160. [Google Scholar] [CrossRef]
- Topol, E.J. High-performance medicine: The convergence of human and artificial intelligence. Nat. Med. 2019, 25, 44–56. [Google Scholar] [CrossRef]
- Wang, C.W.; Huang, C.T.; Lee, J.H.; Li, C.-H.; Chang, S.-W.; Siao, M.-J.; Lai, T.-M.; Ibragimov, B.; Vrtovec, T.; Ronneberger, O.; et al. A benchmark for comparison of dental radiography analysis algorithms. Med. Image Anal. 2016, 31, 63–76. [Google Scholar] [CrossRef]
- Oh, K.; Oh, I.S.; Le, T.V.; Lee, D.-W. Deep Anatomical Context Feature Learning for Cephalometric Landmark Detection. IEEE J. Biomed. Health Inform. 2021, 25, 806–817. [Google Scholar] [CrossRef]
- Canseco, J.A.; Schroeder, G.D.; Patel, P.D.; Grasso, G.; Chang, M.; Kandziora, F.; Vialle, E.N.; Oner, F.C.; Schnake, K.J.; Dvorak, M.F.; et al. Regional and experiential differences in surgeon preference for the treatment of cervical facet injuries: A case study survey with the AO Spine Cervical Classification Validation Group. Eur. Spine J. 2021, 30, 517–523. [Google Scholar] [CrossRef] [PubMed]
- Perrini, P.; Montemurro, N. Congenital absence of a cervical spine pedicle. Neurol. India 2016, 64, 189–190. [Google Scholar] [CrossRef] [PubMed]
- Tiyaworabun, S.T.; Beeko, D.; Bock, W.J. Congenital absence of a pedicle in the cervical spine. Acta Neurochir. 1982, 61, 303–317. [Google Scholar] [CrossRef] [PubMed]
- Dallora, A.L.; Anderberg, P.; Kvist, O.; Mendes, E.; Ruiz, S.D.; Berglund, J.S. Bone age assessment with various machine learning techniques: A systematic literature review and meta-analysis. PLoS ONE 2019, 14, e0220242. [Google Scholar] [CrossRef] [PubMed]


| ε(x) | Model | ||
|---|---|---|---|
| Model_1 | Model_2 | Model_3 | |
| ε(0) | 0.5333 | 0.5916 | 0.6250 |
| ε(1) | 0.9250 | 0.9667 | 0.9333 |
| ε(2) | 0.9916 | 0.9833 | 0.9833 |
Publisher’s Note: MDPI stays neutral with regard to jurisdictional claims in published maps and institutional affiliations. |
© 2021 by the authors. Licensee MDPI, Basel, Switzerland. This article is an open access article distributed under the terms and conditions of the Creative Commons Attribution (CC BY) license (https://creativecommons.org/licenses/by/4.0/).
Share and Cite
Kim, E.-G.; Oh, I.-S.; So, J.-E.; Kang, J.; Le, V.N.T.; Tak, M.-K.; Lee, D.-W. Estimating Cervical Vertebral Maturation with a Lateral Cephalogram Using the Convolutional Neural Network. J. Clin. Med. 2021, 10, 5400. https://doi.org/10.3390/jcm10225400
Kim E-G, Oh I-S, So J-E, Kang J, Le VNT, Tak M-K, Lee D-W. Estimating Cervical Vertebral Maturation with a Lateral Cephalogram Using the Convolutional Neural Network. Journal of Clinical Medicine. 2021; 10(22):5400. https://doi.org/10.3390/jcm10225400
Chicago/Turabian StyleKim, Eun-Gyeong, Il-Seok Oh, Jeong-Eun So, Junhyeok Kang, Van Nhat Thang Le, Min-Kyung Tak, and Dae-Woo Lee. 2021. "Estimating Cervical Vertebral Maturation with a Lateral Cephalogram Using the Convolutional Neural Network" Journal of Clinical Medicine 10, no. 22: 5400. https://doi.org/10.3390/jcm10225400
APA StyleKim, E.-G., Oh, I.-S., So, J.-E., Kang, J., Le, V. N. T., Tak, M.-K., & Lee, D.-W. (2021). Estimating Cervical Vertebral Maturation with a Lateral Cephalogram Using the Convolutional Neural Network. Journal of Clinical Medicine, 10(22), 5400. https://doi.org/10.3390/jcm10225400