
CT Texture Analysis of Pulmonary Neuroendocrine Tumors—Associations with Tumor Grading and Proliferation

 ,
,
Abstract
:1. Introduction
2. Material and Methods
2.1. Study Design
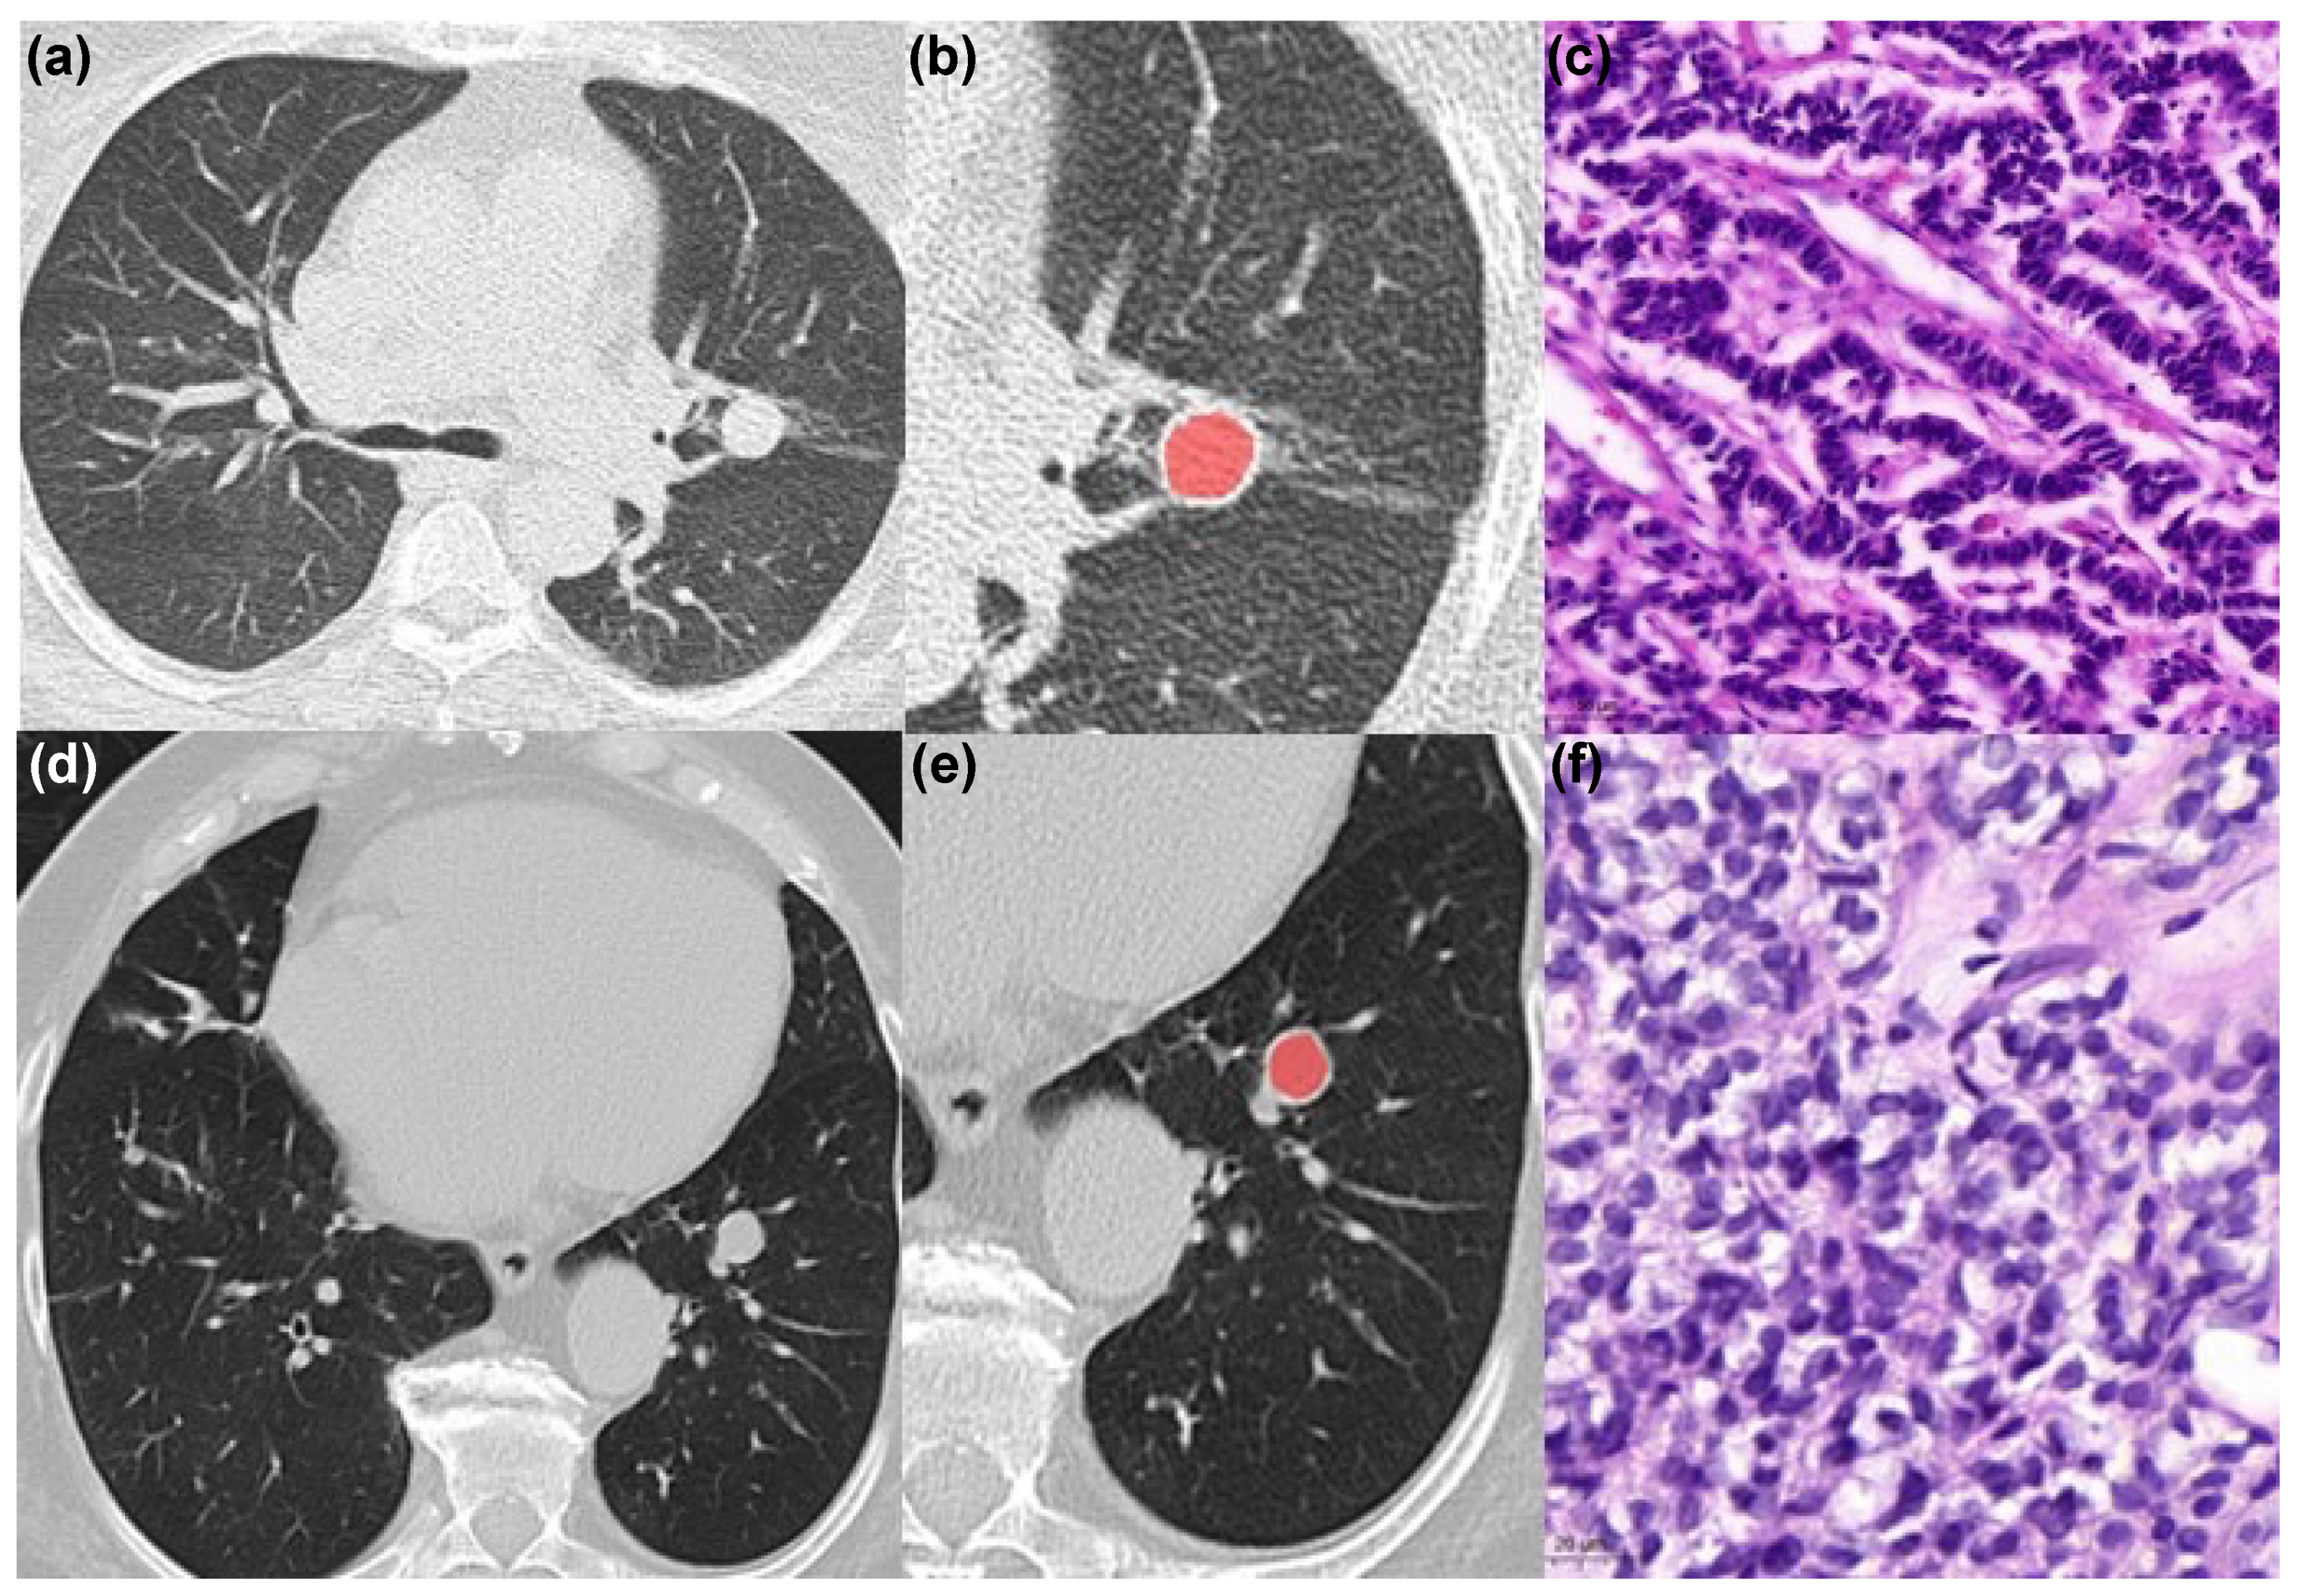
2.2. Image Analysis
2.3. Texture Analysis
2.4. Histopathology Analysis
2.5. Statistical Analysis
3. Results
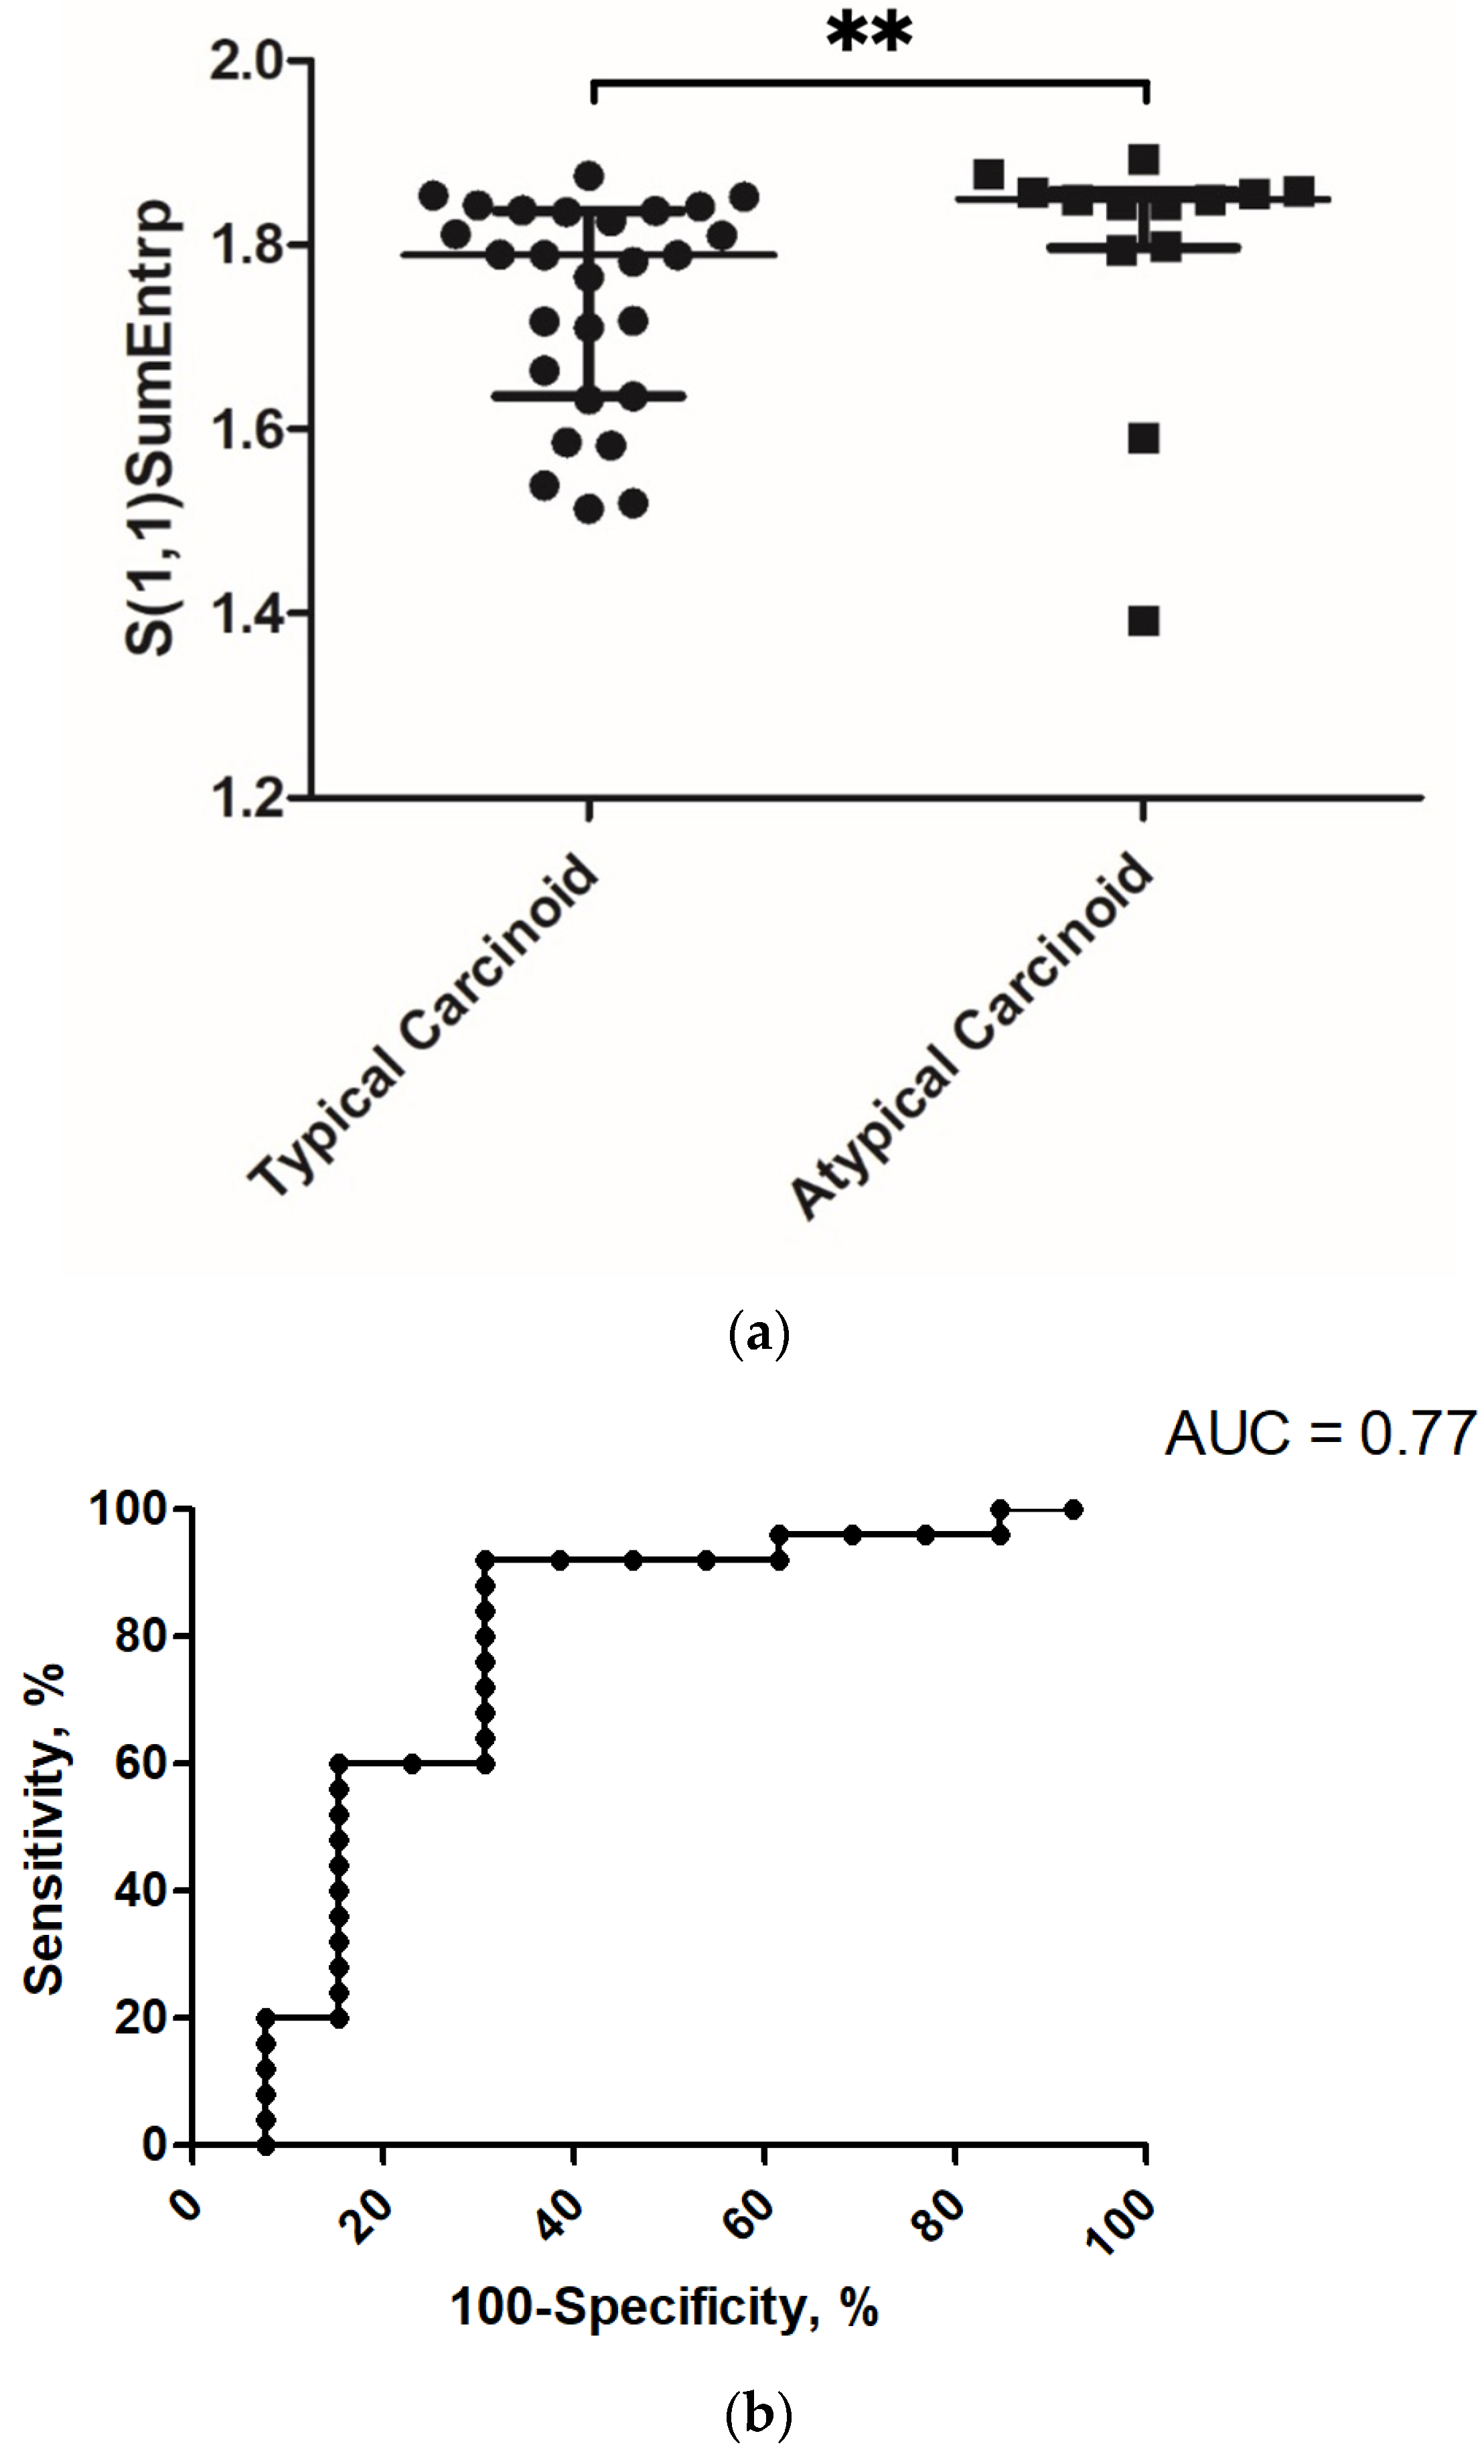
3.1. Correlation and Discrimination Analysis with Grading
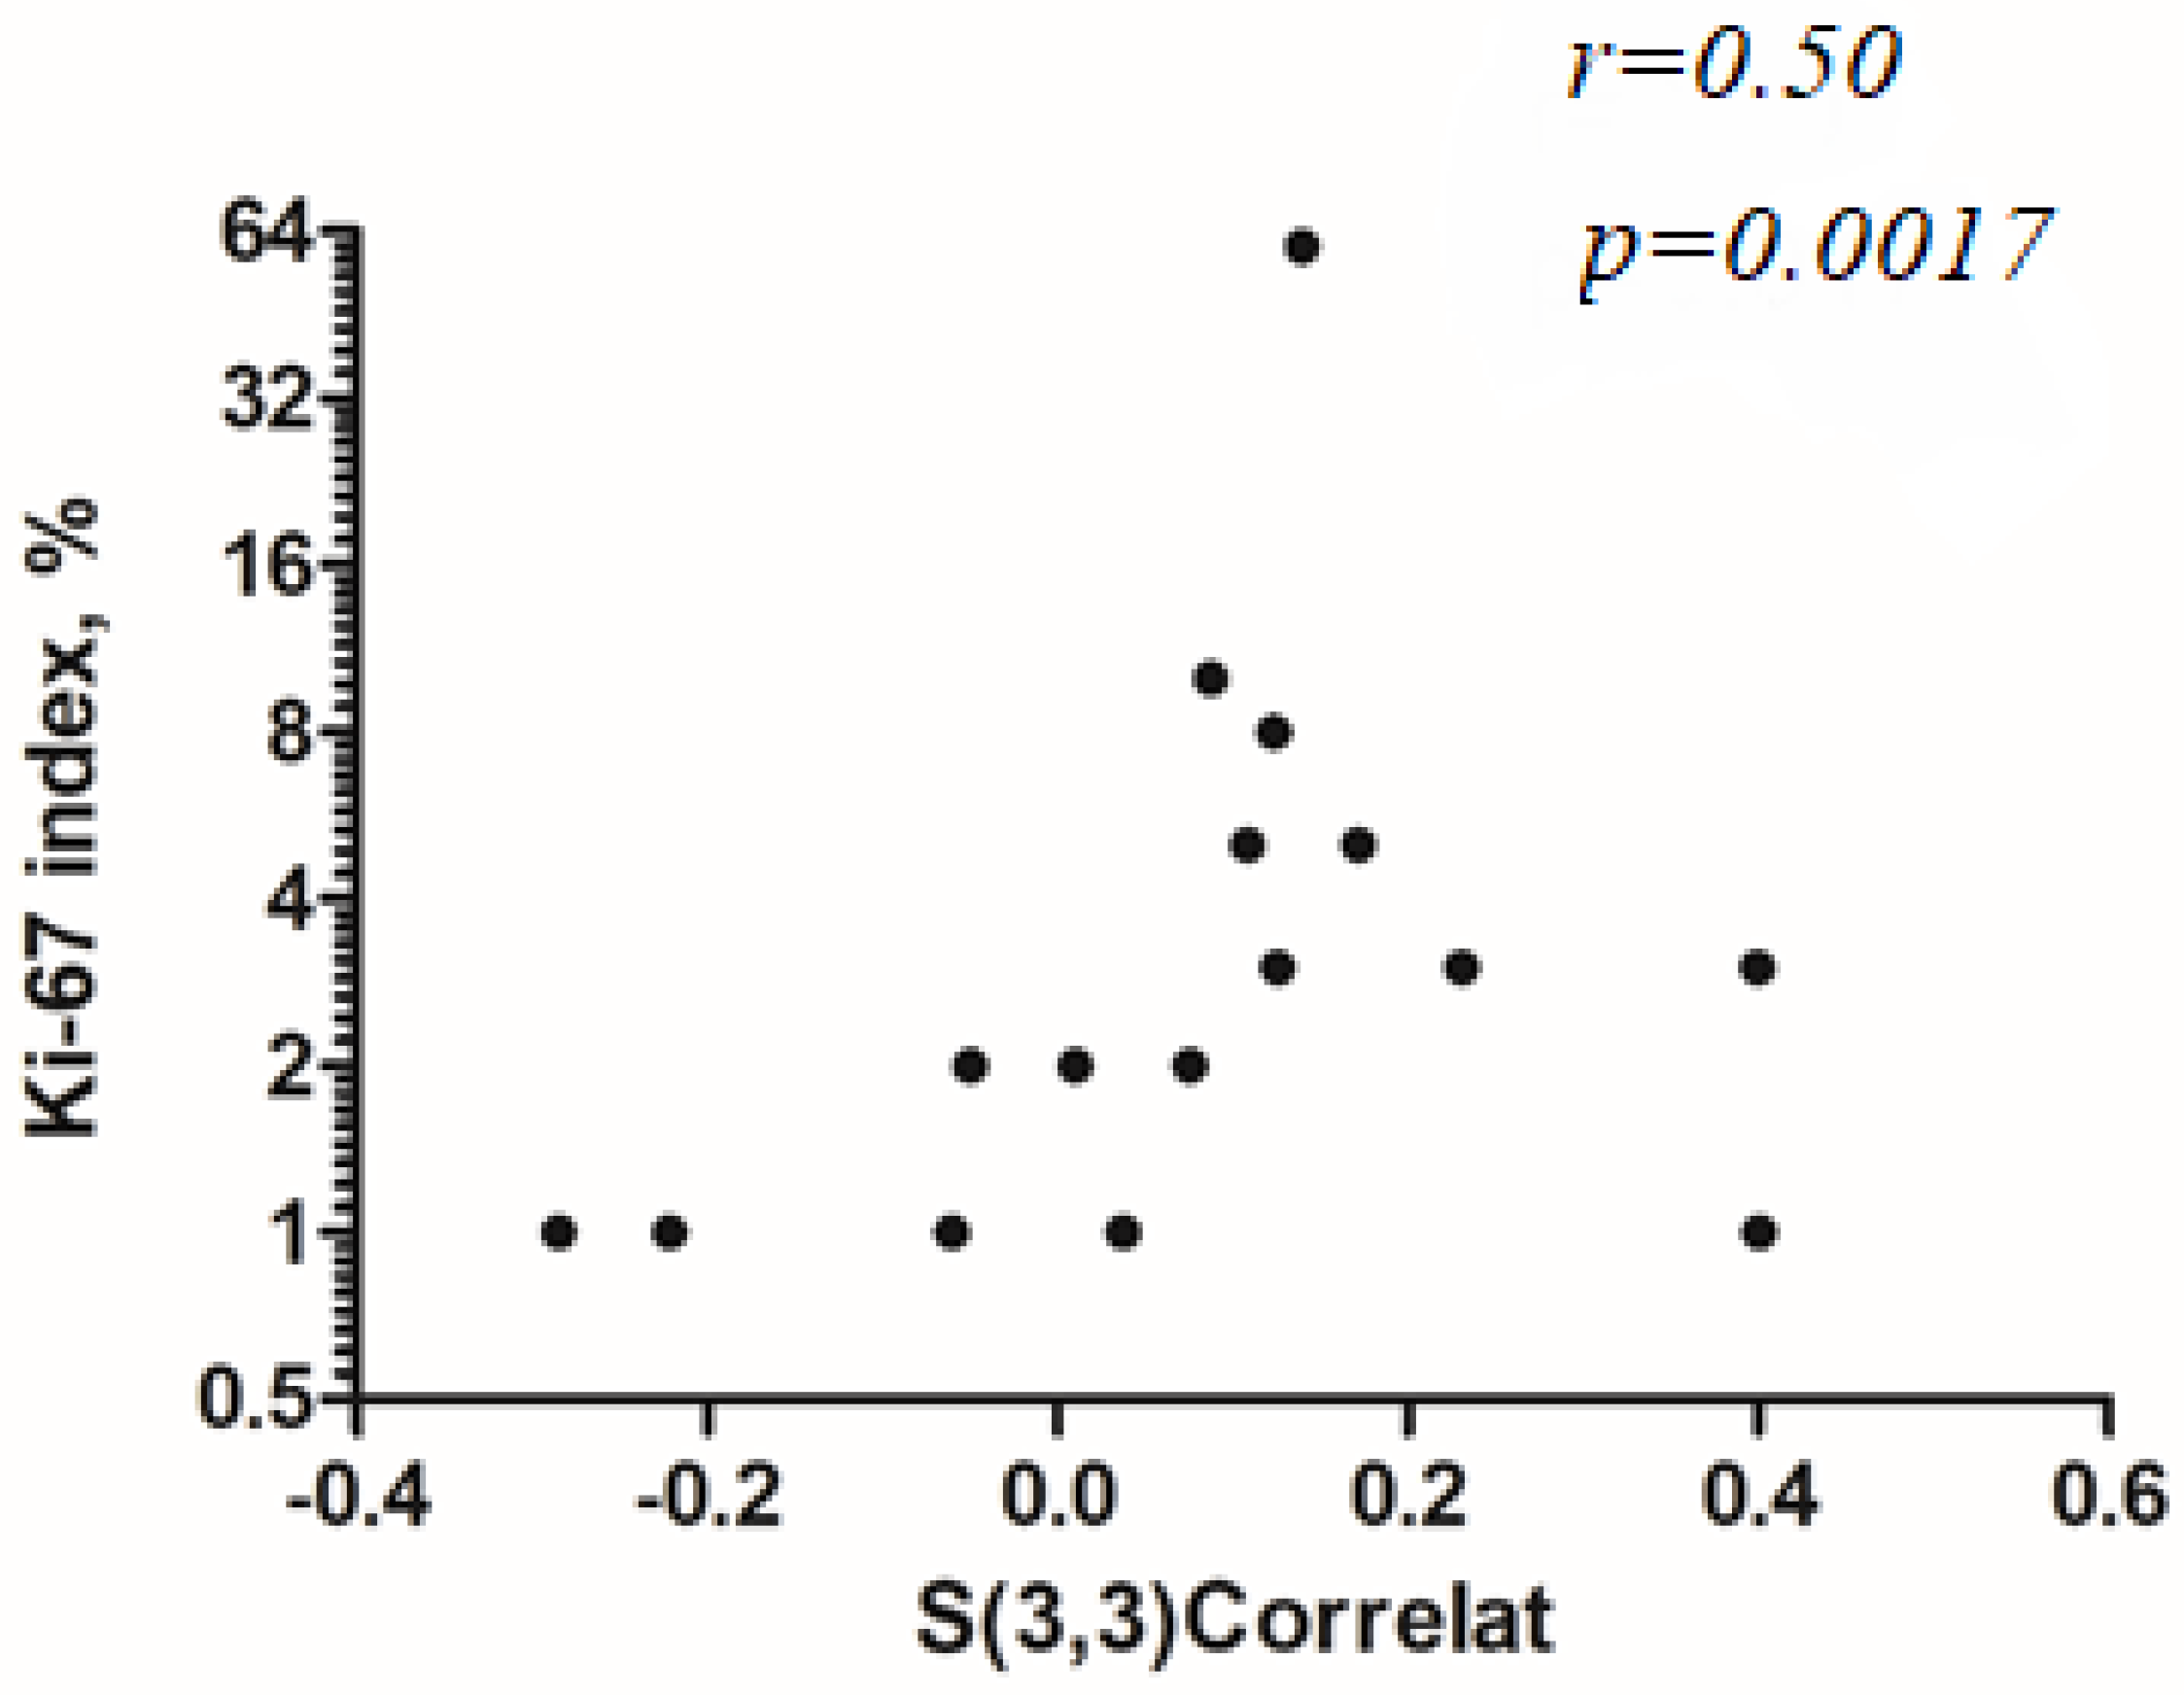
3.2. Correlation Analysis with Ki-67 Index
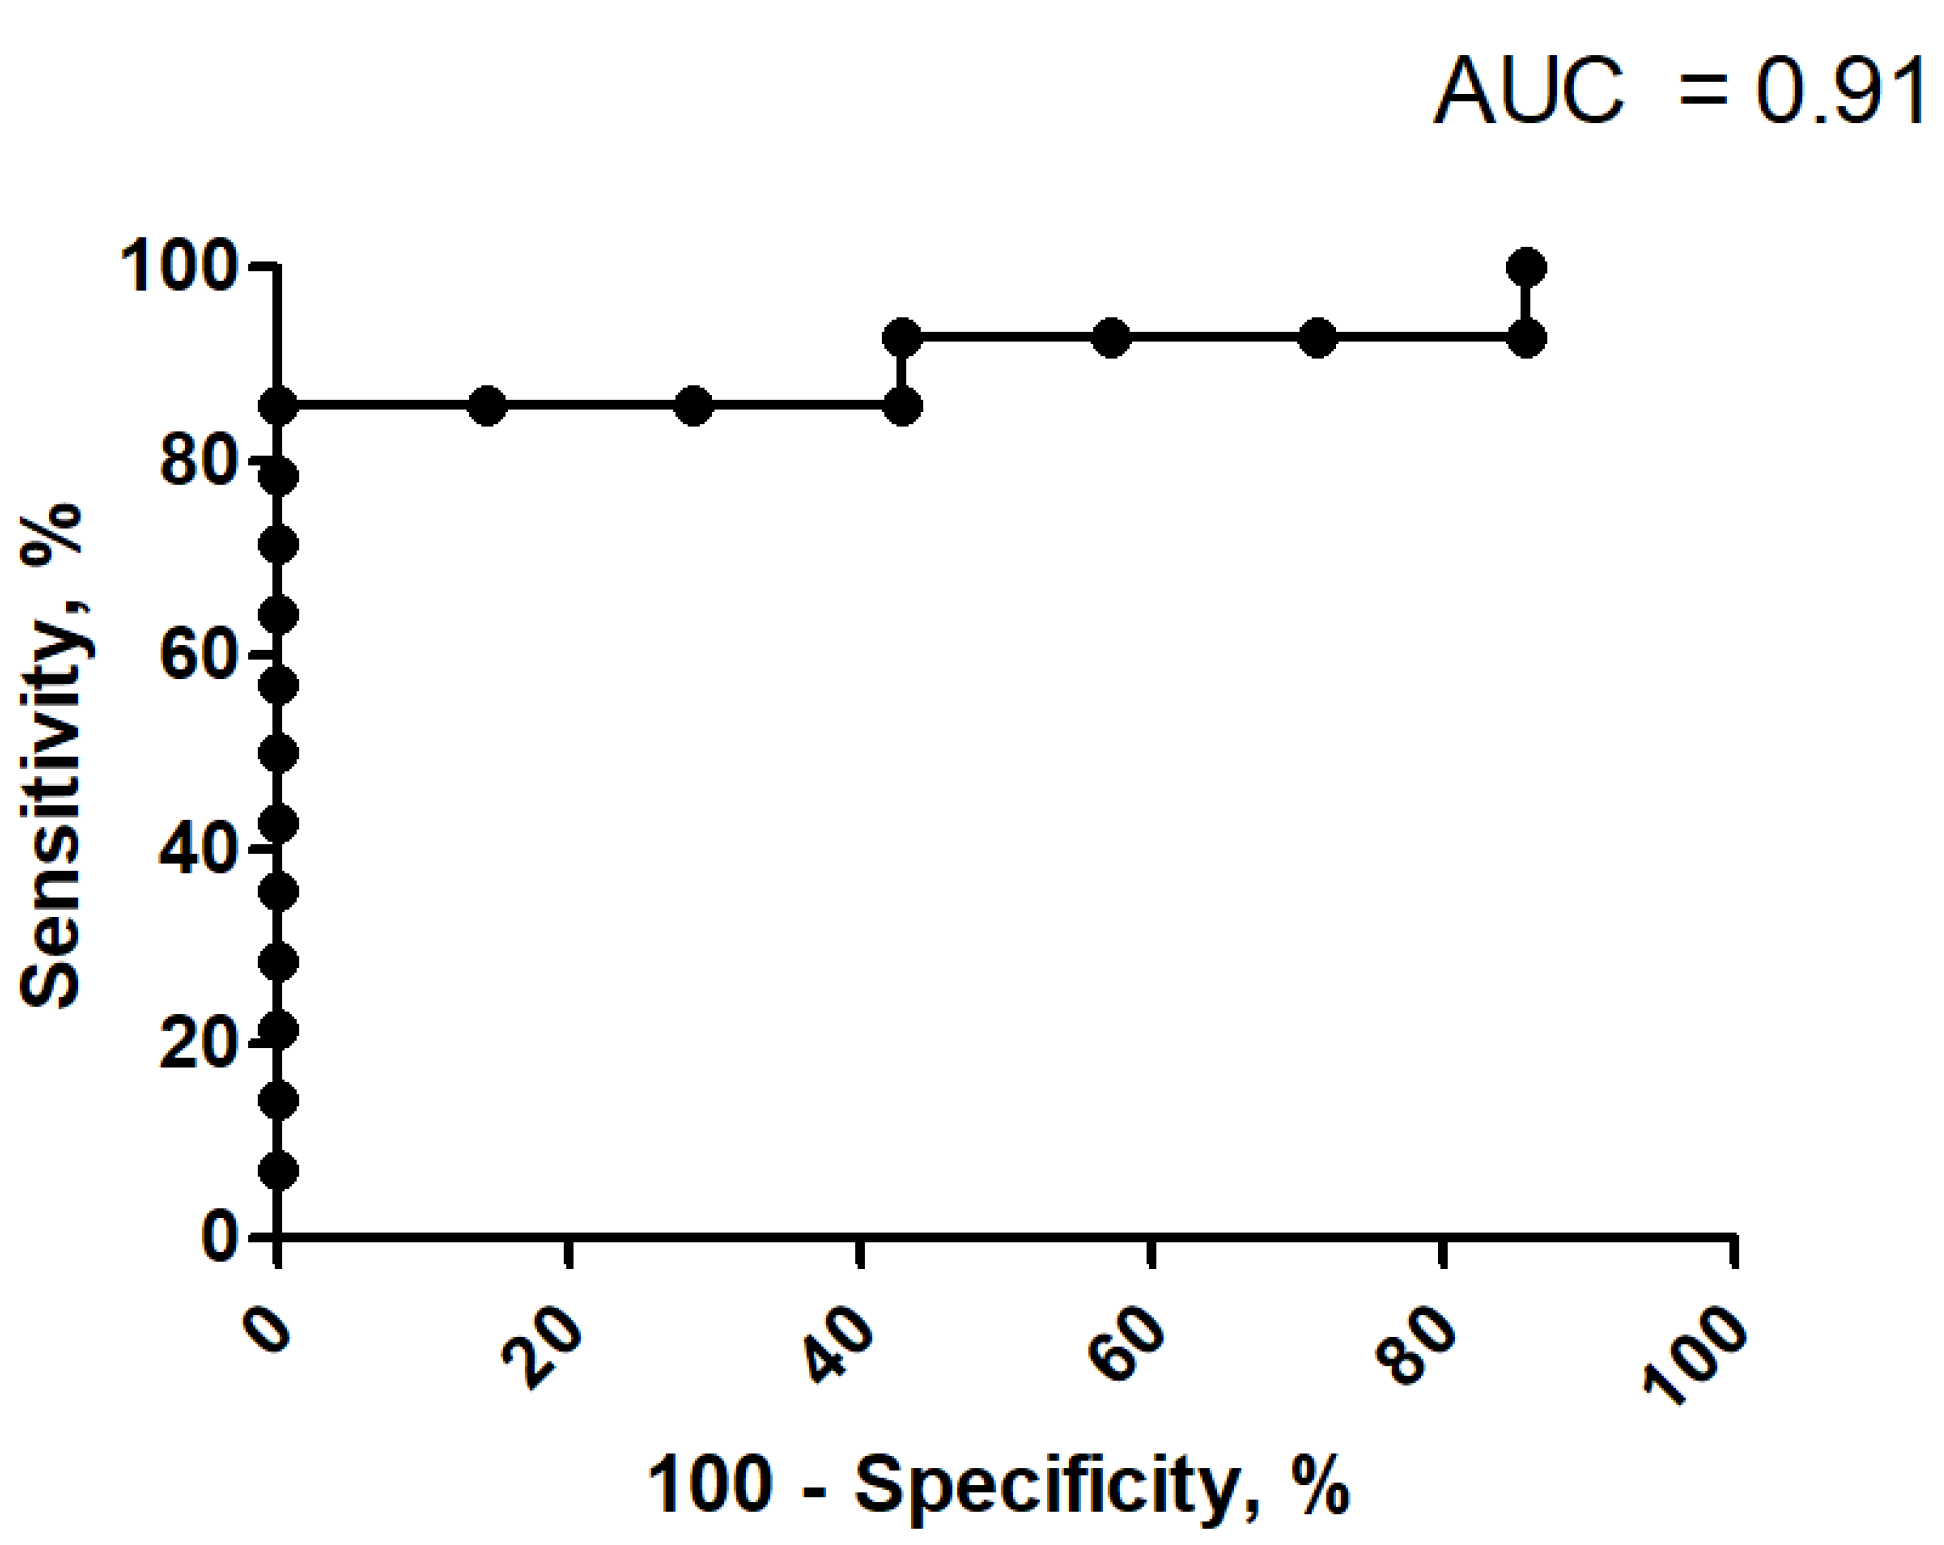
3.3. Discrimination Analysis for Ki-67 Index
3.4. Correlation Analysis between Localization and Lesion Size
4. Discussion
Author Contributions
Funding
Institutional Review Board Statement
Informed Consent Statement
Data Availability Statement
Acknowledgments
Conflicts of Interest
Abbreviations
References
- Incoronato, M.; Aiello, M.; Infante, T.; Cavaliere, C.; Grimaldi, A.M.; Mirabelli, P.; Monti, S.; Salvatore, M. Radiogenomic Analysis of Oncological Data: A Technical Survey. Int. J. Mol. Sci. 2017, 18, 805. [Google Scholar] [CrossRef] [Green Version]
- Wu, G.; Jochems, A.; Refaee, T.; Ibrahim, A.; Yan, C.; Sanduleanu, S.; Woodruff, H.C.; Lambin, P. Structural and functional radiomics for lung cancer. Eur. J. Nucl. Med. Mol. Imaging 2021, 48, 3961–3974. [Google Scholar] [CrossRef] [PubMed]
- Just, N. Improving tumour heterogeneity MRI assessment with histograms. Br. J. Cancer 2014, 111, 2205–2213. [Google Scholar] [CrossRef] [PubMed] [Green Version]
- Cao, J.; Wang, G.R.; Wang, Z.W.; Jin, Z.Y. CT Texture Analysis: A Potential Biomarker for Evaluating KRAS Mutational Status in Colorectal Cancer. Chin. Med. Sci. J. 2020, 35, 306–314. [Google Scholar] [PubMed]
- Yi, X.; Xiao, M.Q.; Zeng, F.; Yin, H.; Li, Z.; Qian, C.; Wang, C.; Lei, G.; Xu, Q.; Li, C.; et al. Computed Tomography Radiomics for Predicting Pathological Grade of Renal Cell Car-cinoma. Front. Oncol. 2021, 10, 570396. [Google Scholar] [CrossRef] [PubMed]
- An, H.; Wang, Y.; Wong, E.M.F.; Lyu, S.; Han, L.; Perucho, J.A.U.; Cao, P.; Lee, E.Y.P. CT texture analysis in histological classification of epithelial ovarian carcinoma. Eur. Radiol. 2021, 31, 5050–5058. [Google Scholar] [CrossRef] [PubMed]
- Meyer, H.-J.; Hamerla, G.; Höhn, A.K.; Surov, A. CT Texture Analysis—Correlations With Histopathology Parameters in Head and Neck Squamous Cell Carcinomas. Front. Oncol. 2019, 9, 444. [Google Scholar] [CrossRef] [PubMed] [Green Version]
- Meyer, H.J.; Schob, S.; Höhn, A.K.; Surov, A. MRI Texture Analysis Reflects Histopathology Parameters in Thyroid Can-cer—A First Preliminary Study. Transl. Oncol. 2017, 10, 911–916. [Google Scholar] [CrossRef]
- Nakanishi, R.; Oki, E.; Hasuda, H.; Sano, E.; Miyashita, Y.; Sakai, A.; Koga, N.; Kuriyama, N.; Nonaka, K.; Fujimoto, Y.; et al. Radiomics Texture Analysis for the Identification of Colorectal Liver Metastases Sensitive to First-Line Oxaliplatin-Based Chemotherapy. Ann. Surg. Oncol. 2021, 28, 2975–2985. [Google Scholar] [CrossRef]
- Vosshenrich, J.; Zech, C.J.; Heye, T.; Boldanova, T.; Fucile, G.; Wieland, S.; Heim, M.H.; Boll, D.T. Response prediction of hepatocellular carcinoma undergoing transcatheter arterial chemoembolization: Unlocking the potential of CT texture analysis through nested decision tree models. Eur. Radiol. 2021, 31, 4367–4376. [Google Scholar] [CrossRef]
- Aerts, H.J.W.L.; Velazquez, E.R.; Leijenaar, R.T.H.; Parmar, C.; Grossmann, P.; Carvalho, S.; Bussink, J.; Monshouwer, R.; Haibe-Kains, B.; Rietveld, D.; et al. Decoding tumour phenotype by noninvasive imaging using a quantitative radiomics approach. Nat. Commun. 2014, 5, 4006. [Google Scholar] [CrossRef] [PubMed]
- Caplin, M.E.; Baudin, E.; Ferolla, P.; Filosso, P.; Garcia-Yuste, M.; Lim, E.; Oberg, K.; Pelosi, G.; Perren, A.; Rossi, R.E.; et al. Pulmonary neuroendocrine (carcinoid) tumors: European Neuroendocrine Tumor Society expert consensus and recommendations for best practice for typical and atypical pulmonary carcinoids. Ann. Oncol. 2015, 26, 1604–1620. [Google Scholar] [CrossRef] [PubMed]
- Rindi, G.; Klimstra, D.S.; Abedi-Ardekani, B.; Asa, S.L.; Bosman, F.T.; Brambilla, E.; Busam, K.J.; De Krijger, R.R.; Dietel, M.; El-Naggar, A.K.; et al. A common classification framework for neuroendocrine neoplasms: An International Agency for Research on Cancer (IARC) and World Health Organization (WHO) expert consensus proposal. Mod. Pathol. 2018, 31, 1770–1786. [Google Scholar] [CrossRef] [PubMed]
- Dermawan, J.K.T.; Farver, C.F. The Role of Histologic Grading and Ki-67 Index in Predicting Outcomes in Pulmonary Car-cinoid Tumors. Am. J. Surg. Pathol. 2020, 44, 224–231. [Google Scholar] [CrossRef] [PubMed]
- Volante, M.; Mete, O.; Pelosi, G.; Roden, A.C.; Speel, E.J.M.; Uccella, S. Molecular Pathology of Well-Differentiated Pulmonary and Thymic Neuroendocrine Tumors: What Do Pathologists Need to Know? Endocr. Pathol. 2021, 32, 154–168. [Google Scholar] [CrossRef] [PubMed]
- WHO. WHO Classification of Tumours Editorial Board, 5th ed.; WHO Classification of Tumours Series; Thoracic Tumours; International Agency for Research on Cancer: Lyon, France, 2021; Volume 5. [Google Scholar]
- Strzelecki, M.; Szczypiński, P.; Materka, A.; Klepaczko, A. A software tool for automatic classification and segmentation of 2D/3D medical images. Nucl. Instruments Methods Phys. Res. Sect. A Accel. Spectrometers Detect. Assoc. Equip. 2013, 702, 137–140. [Google Scholar] [CrossRef]
- Szczypiński, P.M.; Strzelecki, M.; Materka, A.; Klepaczko, A. MaZda—A software package for image texture analysis. Comput. Methods Programs Biomed. 2009, 94, 66–76. [Google Scholar] [CrossRef]
- Fruehwald-Pallamar, J.; Czerny, C.; Holzer-Fruehwald, L.; Nemec, S.F.; Mueller-Mang, C.; Weber, M.; Mayerhoefer, M. Texture-based and diffusion-weighted discrimination of parotid gland lesions on MR images at 3.0 Tesla. NMR Biomed. 2013, 26, 1372–1379. [Google Scholar] [CrossRef]
- Jeung, M.-Y.; Gasser, B.; Gangi, A.; Charneau, D.; Ducroq, X.; Kessler, R.; Quoix, E.; Roy, C. Bronchial Carcinoid Tumors of the Thorax: Spectrum of Radiologic Findings. Radiographics 2002, 22, 351–365. [Google Scholar] [CrossRef]
- Meisinger, Q.C.; Klein, J.S.; Butnor, K.J.; Gentchos, G.; Leavitt, B.J. CT Features of Peripheral Pulmonary Carcinoid Tumors. Am. J. Roentgenol. 2011, 197, 1073–1080. [Google Scholar] [CrossRef]
- Zhang, N.; E, L.; Wu, S.; Wu, Z. CT texture analysis in differential diagnosis of benign and malignant solitary pulmonary nodule. Chin. J. Med. Imaging Technol. 2020, 34, 1211–1215. [Google Scholar]
- Sun, R.; Limkin, E.J.; Vakalopoulou, M.; Dercle, L.; Champiat, S.; Han, S.R.; Verlingue, L.; Brandao, D.; Lancia, A.; Ammari, S.; et al. A radiomics approach to assess tumour-infiltrating CD8 cells and response to anti-PD-1 or anti-PD-L1 immunotherapy: An imaging biomarker, retrospective multicohort study. Lancet Oncol. 2018, 19, 1180–1191. [Google Scholar] [CrossRef]
- Bae, J.M.; Jeong, J.Y.; Lee, H.Y.; Sohn, I.; Kim, H.S.; Son, J.Y.; Kwon, O.J.; Choi, J.Y.; Lee, K.S.; Shim, Y.M. Pathologic stratification of operable lung adenocarcinoma using radiomics features extracted from dual energy CT images. Oncotarget 2016, 8, 523–535. [Google Scholar] [CrossRef] [PubMed] [Green Version]
- Liu, Y.; Liu, S.; Qu, F.; Li, Q.; Cheng, R.; Ye, Z. Tumor heterogeneity assessed by texture analysis on contrast-enhanced CT in lung adenocarci-noma: Association with pathologic grade. Oncotarget 2017, 8, 53664–53674. [Google Scholar] [CrossRef] [PubMed]
- Danti, G.; Berti, V.; Abenavoli, E.; Briganti, V.; Linguanti, F.; Mungai, F.; Pradella, S.; Miele, V. Diagnostic imaging of typical lung carcinoids: Relationship between MDCT, 111In-Octreoscan and 18F-FDG-PET imaging features with Ki-67 index. La Radiol. Med. 2020, 125, 715–729. [Google Scholar] [CrossRef] [PubMed]
- Thuillier, P.; Liberini, V.; Rampado, O.; Gallio, E.; De Santi, B.; Ceci, F.; Metovic, J.; Papotti, M.; Volante, M.; Molinari, F.; et al. Diagnostic Value of Conventional PET Parameters and Radiomic Features Extracted from 18F-FDG-PET/CT for Histologic Subtype Classification and Characterization of Lung Neuroendocrine Neo-plasms. Biomedicines 2021, 9, 281. [Google Scholar] [CrossRef] [PubMed]
- Martini, I.; Polici, M.; Zerunian, M.; Panzuto, F.; Rinzivillo, M.; Landolfi, F.; Magi, L.; Caruso, D.; Eid, M.; Annibale, B.; et al. CT texture analysis of liver metastases in PNETs versus NPNETs: Correlation with histopathological findings. Eur. J. Radiol. 2020, 124, 108812. [Google Scholar] [CrossRef]
- Gu, Q.; Feng, Z.; Liang, Q.; Li, M.; Deng, J.; Ma, M.; Wang, W.; Liu, J.; Liu, P.; Rong, P. Machine learning-based radiomics strategy for prediction of cell proliferation in non-small cell lung cancer. Eur. J. Radiol. 2019, 118, 32–37. [Google Scholar] [CrossRef] [PubMed]
- Wu, H.; Han, X.; Wang, Z.; Mo, L.; Liu, W.; Guo, Y.; Wei, X.; Jiang, X. Prediction of the Ki-67 marker index in hepatocellular carcinoma based on CT radiomics features. Phys. Med. Biol. 2020, 65, 235048. [Google Scholar] [CrossRef]
- Rekhtman, N. Lung neuroendocrine neoplasms: Recent progress and persistent challenges. Mod. Pathol. 2021, 1–15. [Google Scholar] [CrossRef]
- Metovic, J.; Barella, M.; Bianchi, F.; Hofman, P.; Hofman, V.; Remmelink, M.; Kern, I.; Carvalho, L.; Pattini, L.; Sonzogni, A.; et al. Morphologic and molecular classification of lung neuroendocrine neoplasms. Virchows Arch. 2021, 478, 5–19. [Google Scholar] [CrossRef]
- Bianconi, F.; Fravolini, M.; Palumbo, I.; Pascoletti, G.; Nuvoli, S.; Rondini, M.; Spanu, A.; Palumbo, B. Impact of Lesion Delineation and Intensity Quantisation on the Stability of Texture Features from Lung Nodules on CT: A Reproducible Study. Diagnostics 2021, 11, 1224. [Google Scholar] [CrossRef]
- Jensen, L.; Kim, D.; Elgeti, T.; Steffen, I.; Hamm, B.; Nagel, S. Stability of Radiomic Features across Different Region of Interest Sizes—A CT and MR Phantom Study. Tomography 2021, 7, 238–252. [Google Scholar] [CrossRef] [PubMed]
- Denzler, S.; Vuong, D.; Bogowicz, M.; Pavic, M.; Frauenfelder, T.; Thierstein, S.; Eboulet, E.I.; Maurer, B.; Schniering, J.; Gabryś, H.S.; et al. Impact of CT convolution kernel on robustness of radiomic features for different lung diseases and tissue types. Br. J. Radiol. 2021, 94, 20200947. [Google Scholar] [CrossRef] [PubMed]
- Liu, C.; Ma, C.; Duan, J.; Qiu, Q.; Guo, Y.; Zhang, Z.; Yin, Y. Using CT texture analysis to differentiate between peripheral lung cancer and pulmonary inflammatory pseudotumor. BMC Med Imaging 2020, 20, 1–10. [Google Scholar] [CrossRef] [PubMed]
- Caruso, D.; Zerunian, M.; Pucciarelli, F.; Bracci, B.; Polici, M.; D’Arrigo, B.; Polidori, T.; Guido, G.; Barbato, L.; Polverari, D.; et al. Influence of Adaptive Statistical Iterative Reconstructions on CT Radiomic Features in Oncologic Patients. Diagnostics 2021, 11, 1000. [Google Scholar] [CrossRef]


| Typical Carcinoid (%) | Atypical Carcinoid (%) | Total Amount (%) | |
|---|---|---|---|
| Total amount | 25 (66) | 13 (34) | 38 (100) |
| Lung lobe | |||
| right upper lobe | 0 | 4 | 4 (11) |
| middle lobe | 3 | 0 | 3 (8) |
| right lower lobe | 7 | 2 | 9 (24) |
| left upper lobe | 5 | 2 | 7 (18) |
| left lower lobe | 6 | 5 | 11 (29) |
| endobronchial | 4 | 0 | 4 (10) |
| Localization | |||
| central (>2 cm distance from pleura) | 14 | 7 | 21 (55) |
| peripheral (≤2 cm distance from pleura) | 11 | 6 | 17 (45) |
| Size in mm (mean ± SD) range | 20.2 ± 16.3 5.5–74.3 | 23.4 ± 19.4 10–84.1 |
Publisher’s Note: MDPI stays neutral with regard to jurisdictional claims in published maps and institutional affiliations. |
© 2021 by the authors. Licensee MDPI, Basel, Switzerland. This article is an open access article distributed under the terms and conditions of the Creative Commons Attribution (CC BY) license (https://creativecommons.org/licenses/by/4.0/).
Share and Cite
Meyer, H.-J.; Leonhardi, J.; Höhn, A.K.; Pappisch, J.; Wirtz, H.; Denecke, T.; Frille, A. CT Texture Analysis of Pulmonary Neuroendocrine Tumors—Associations with Tumor Grading and Proliferation. J. Clin. Med. 2021, 10, 5571. https://doi.org/10.3390/jcm10235571
Meyer H-J, Leonhardi J, Höhn AK, Pappisch J, Wirtz H, Denecke T, Frille A. CT Texture Analysis of Pulmonary Neuroendocrine Tumors—Associations with Tumor Grading and Proliferation. Journal of Clinical Medicine. 2021; 10(23):5571. https://doi.org/10.3390/jcm10235571
Chicago/Turabian StyleMeyer, Hans-Jonas, Jakob Leonhardi, Anne Kathrin Höhn, Johanna Pappisch, Hubert Wirtz, Timm Denecke, and Armin Frille. 2021. "CT Texture Analysis of Pulmonary Neuroendocrine Tumors—Associations with Tumor Grading and Proliferation" Journal of Clinical Medicine 10, no. 23: 5571. https://doi.org/10.3390/jcm10235571