
The Diagnostic Value of Pulsar Perimetry, Optical Coherence Tomography, and Optical Coherence Tomography Angiography in Pre-Perimetric and Perimetric Glaucoma

 , , , and
Abstract
:1. Introduction
2. Materials and Methods
2.1. Study Design, Inclusion, and Exclusion Criteria
2.2. Study Participants
2.3. Examination Instruments
2.3.1. Functional Parameters: Standard Automated Perimetry (SAP) and Pulsar Perimetry (PP)
2.3.2. Structural Parameters: Optical Coherence Tomography (OCT)
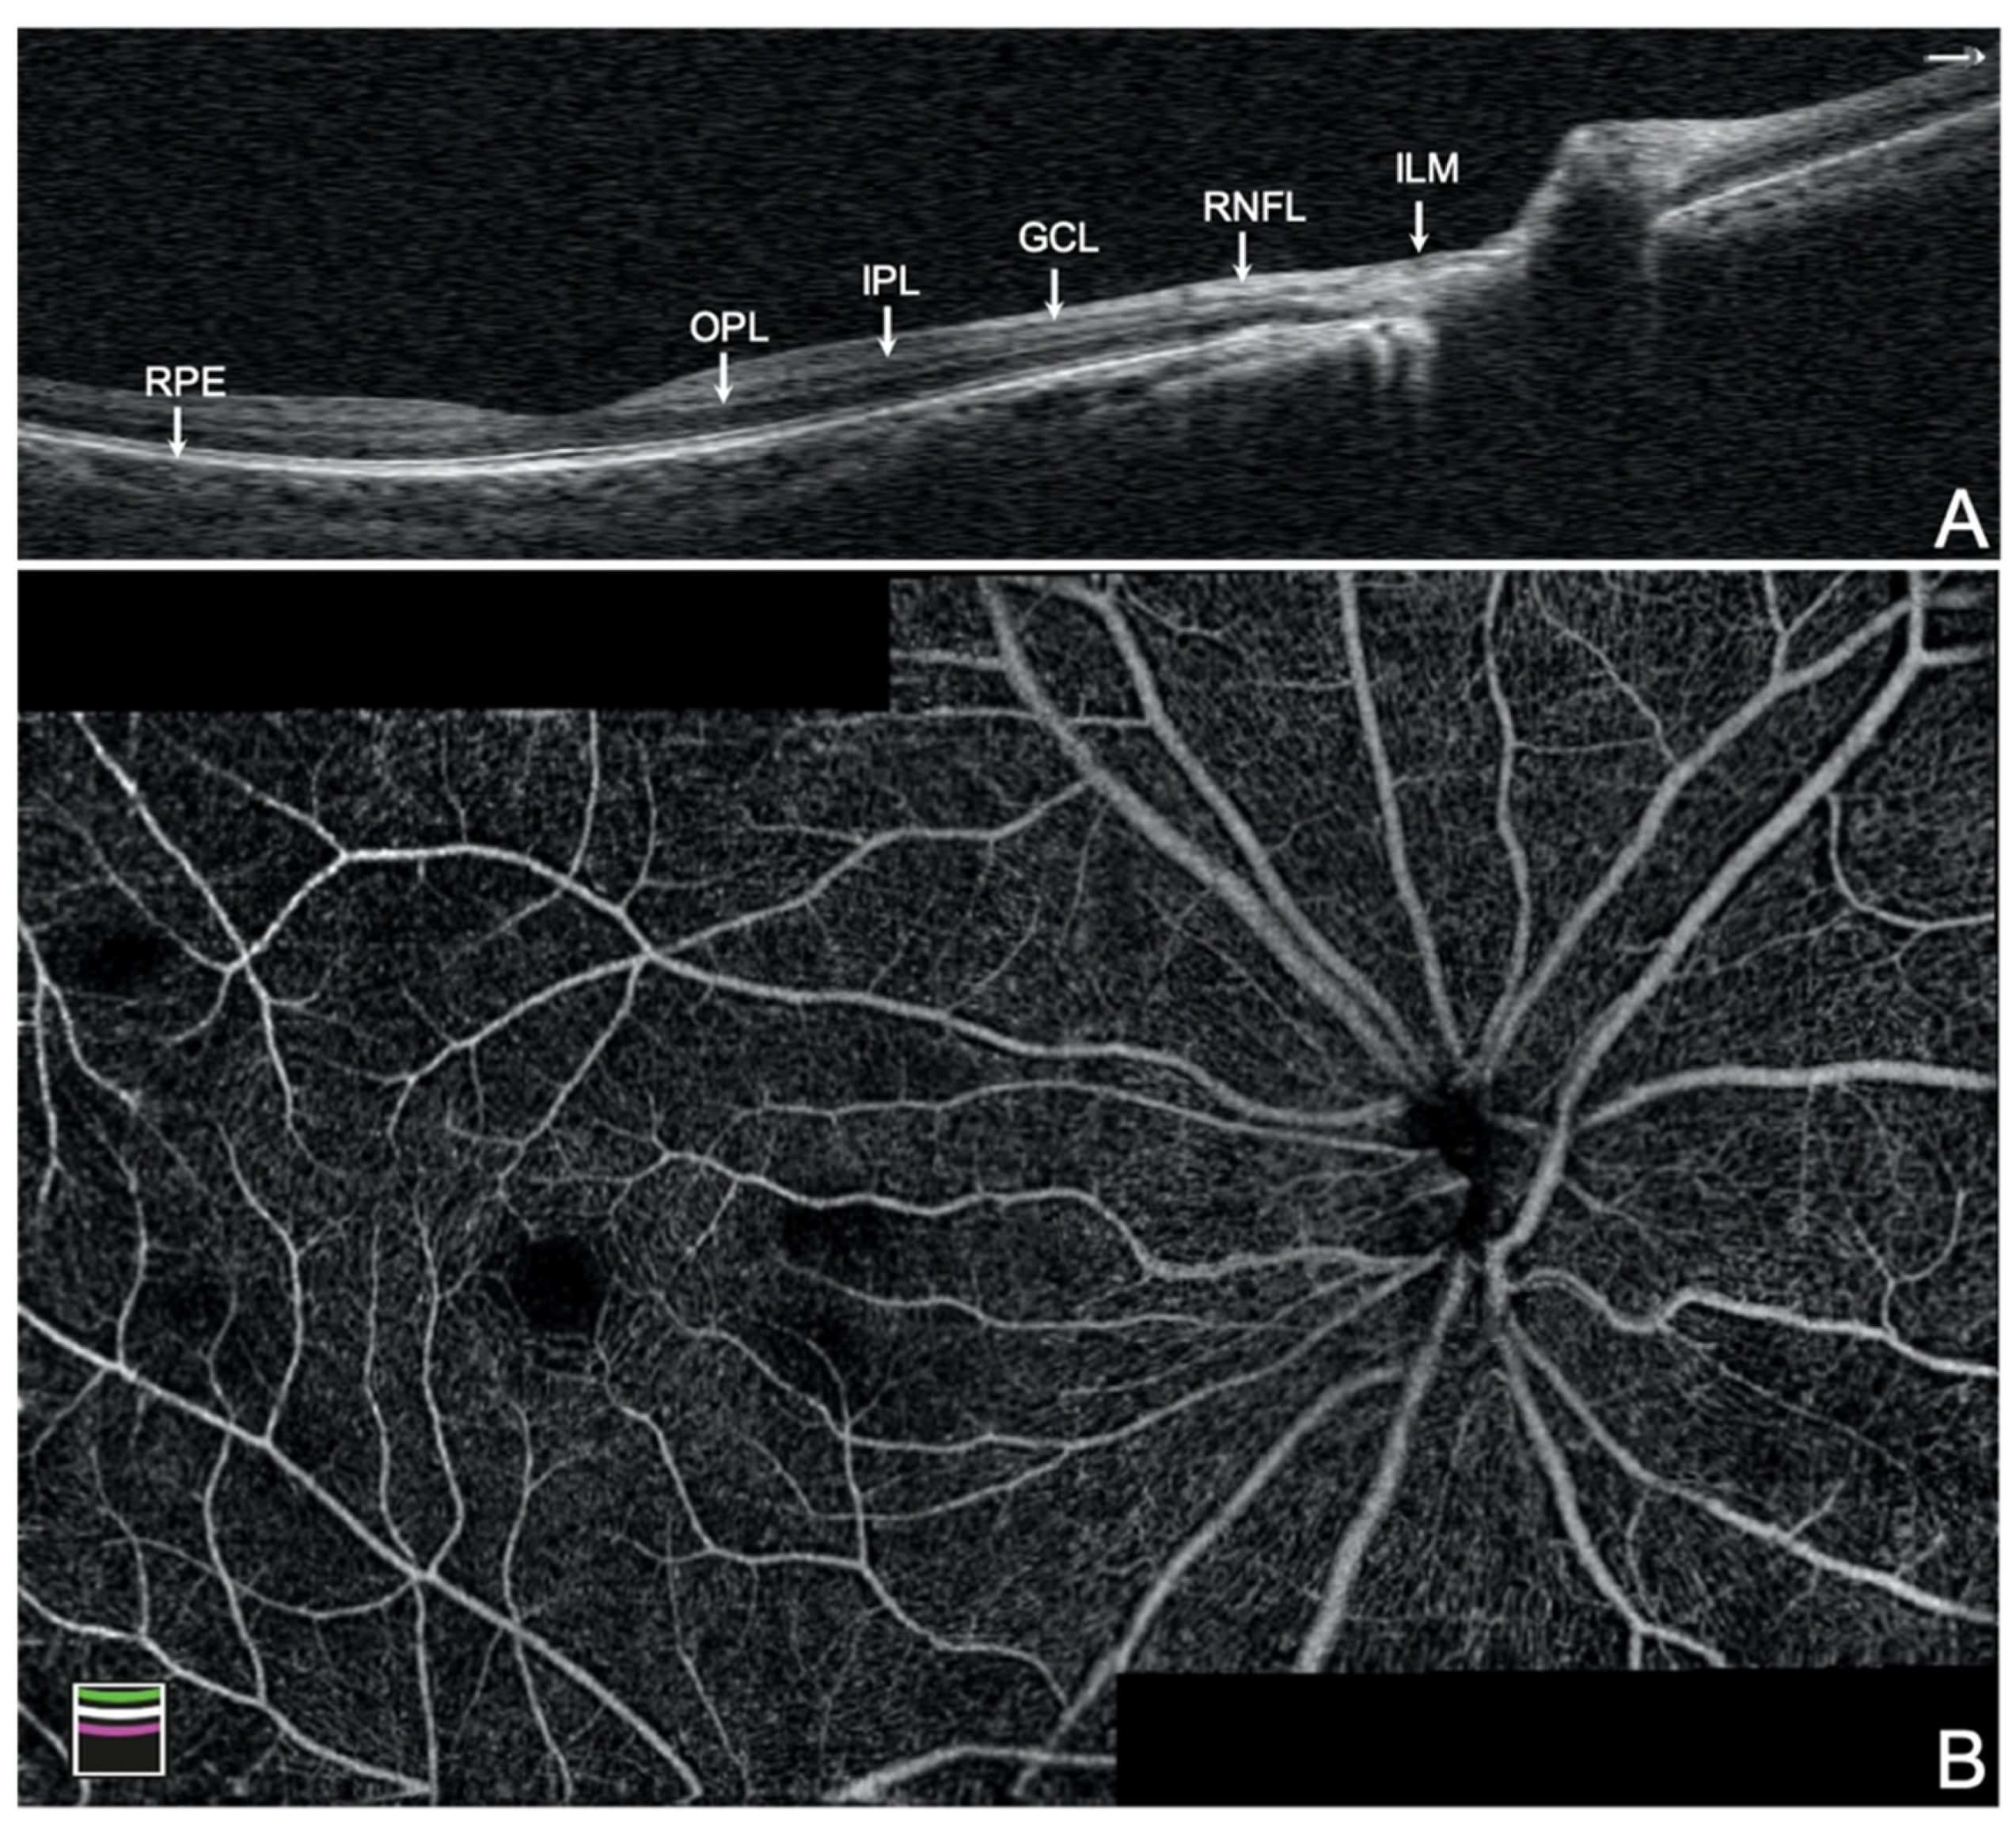
2.3.3. Vascular Parameters: Optical Coherence Tomography Angiography (OCTA)
2.4. Statistical Analysis
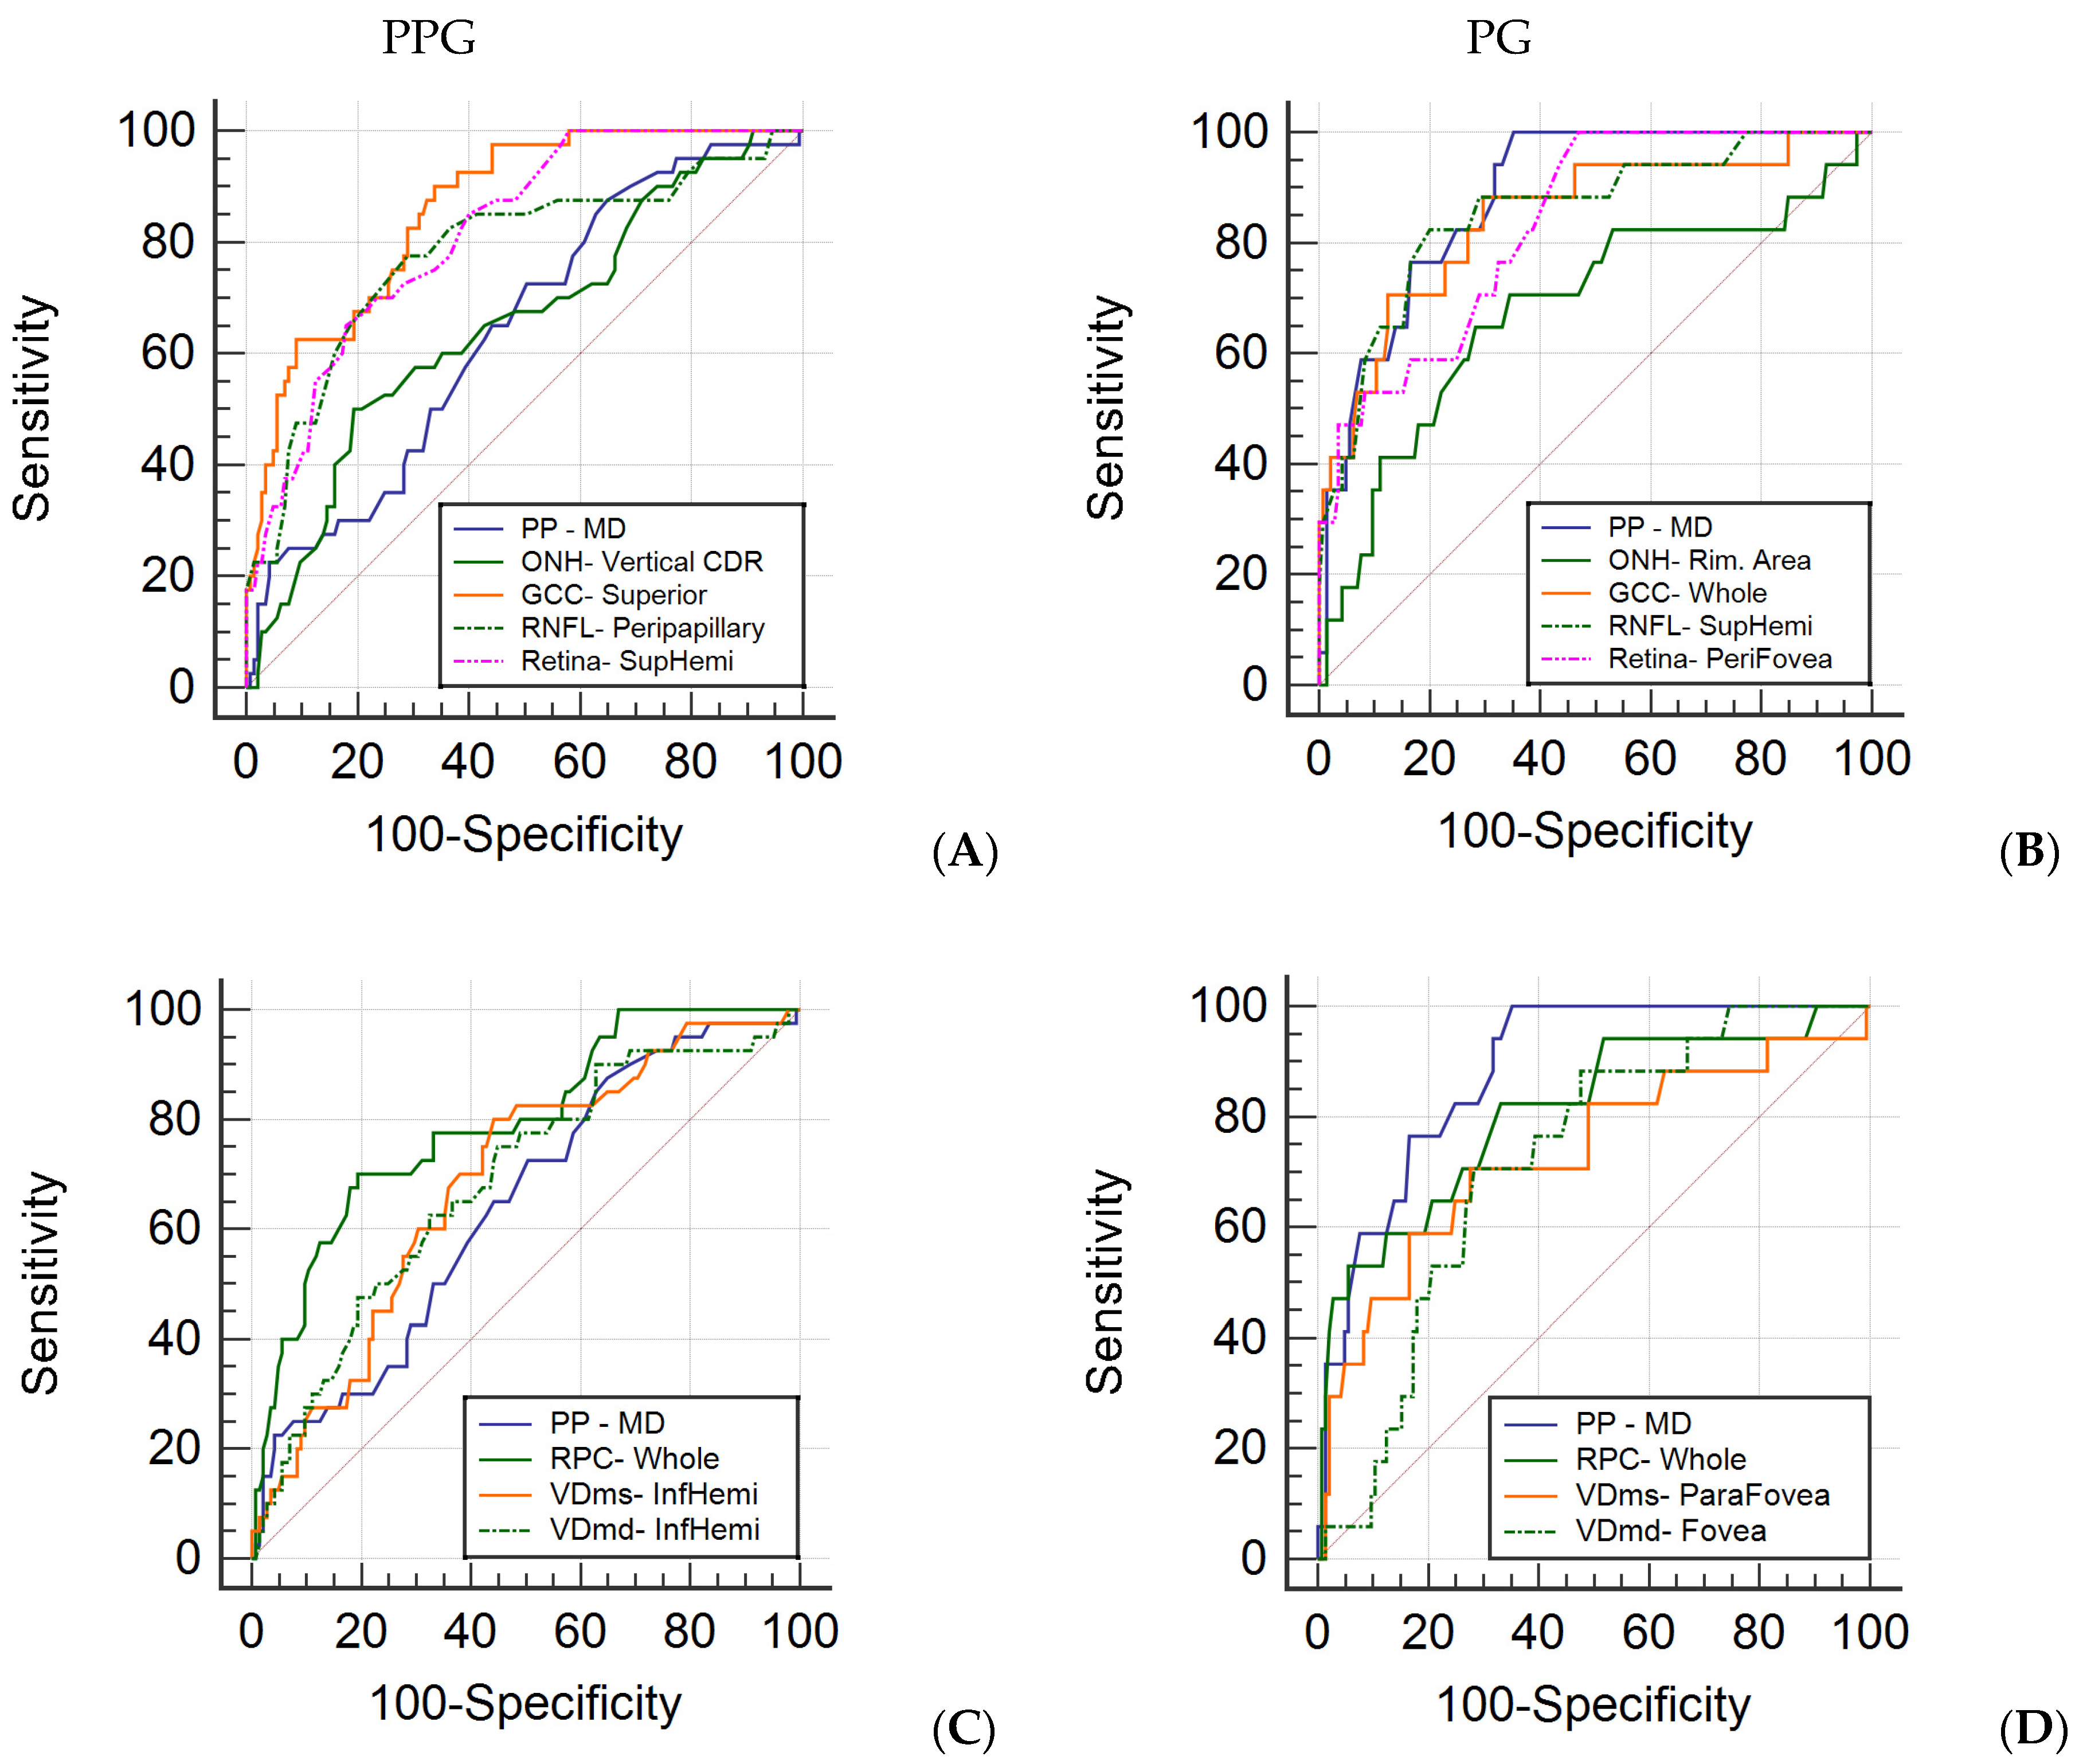
3. Results
4. Discussion
5. Conclusions
Author Contributions
Funding
Institutional Review Board Statement
Informed Consent Statement
Data Availability Statement
Conflicts of Interest
References
- Quigley, H.A.; Broman, A.T. The number of people with glaucoma worldwide in 2010 and 2020. Br. J. Ophthalmol. 2006, 90, 262. [Google Scholar] [CrossRef] [PubMed] [Green Version]
- Coleman, A.L. Glaucoma. Lancet 1999, 354, 1803–1810. [Google Scholar] [CrossRef]
- Quigley, H.A. Glaucoma. Lancet 2011, 377, 1367–1377. [Google Scholar] [CrossRef]
- Chauhan, B.C.; McCormick, T.A.; Nicolela, M.T.; LeBlanc, R.P. Optic disc and visual field changes in a prospective longitudinal study of patients with glaucoma: Comparison of scanning laser tomography with conventional perimetry and optic disc photography. Arch. Ophthalmol. 2001, 119, 1492–1499. [Google Scholar] [CrossRef] [Green Version]
- Caprioli, J.; Nouri-Mahdavi, K.; Law, S.K.; Badalà, F. Optic disc imaging in perimetrically normal eyes of glaucoma patients with unilateral field loss. Trans. Am. Ophthalmol. Soc. 2006, 104, 202–211. [Google Scholar]
- Tan, O.; Chopra, V.; Lu, A.T.; Schuman, J.S.; Ishikawa, H.; Wollstein, G.; Varma, R.; Huang, D. Detection of macular ganglion cell loss in glaucoma by Fourier-domain optical coherence tomography. Ophthalmology 2009, 116, 2305–2314. [Google Scholar] [CrossRef] [PubMed] [Green Version]
- Nakano, N.; Hangai, M.; Nakanishi, H.; Mori, S.; Nukada, M.; Kotera, Y.; Ikeda, H.O.; Nakamura, H.; Nonaka, A.; Yoshimura, N. Macular ganglion cell layer imaging in preperimetric glaucoma with speckle noise-reduced spectral domain optical coherence tomography. Ophthalmology 2011, 118, 2414–2426. [Google Scholar] [CrossRef] [PubMed] [Green Version]
- Rolle, T. Ganglion cell complex and retinal nerve fiber layer measured by fourier-domain optical coherence tomography for early detection of structural damage in patients with preperimetric glaucoma. Clin. Ophthalmol. 2011, 5, 961. [Google Scholar] [CrossRef] [PubMed] [Green Version]
- Quigley, H.A.; Addicks, E.M.; Green, W.R. Optic nerve damage in human glaucoma. III. Quantitative correlation of nerve fiber loss and visual field defect in glaucoma, ischemic neuropathy, papilledema, and toxic neuropathy. Arch. Ophthalmol. 1982, 100, 135–146. [Google Scholar] [CrossRef]
- Mikelberg, F.S.; Yidegiligne, H.M.; Schulzer, M. Optic nerve axon count and axon diameter in patients with ocular hypertension and normal visual fields. Ophthalmology 1995, 102, 342–348. [Google Scholar] [CrossRef]
- Bagga, H.; Feuer, W.J.; Greenfield, D.S. Detection of psychophysical and structural injury in eyes with glaucomatous optic neuropathy and normal standard automated perimetry. Arch. Ophthalmol. 2006, 124, 169–176. [Google Scholar] [CrossRef] [PubMed] [Green Version]
- Horn, F.K.; Mardin, C.Y.; Bendschneider, D.; Jünemann, A.G.; Adler, W.; Tornow, R.P. Frequency doubling technique perimetry and spectral domain optical coherence tomography in patients with early glaucoma. Eye 2011, 25, 17–29. [Google Scholar] [CrossRef]
- Gonzalez-Hernandez, M.; de la Rosa, M.G.; de la Vega, R.R.; Hernandez-Vidal, A. Long-term fluctuation of standard automatic perimetry, pulsar perimetry and frequency-doubling technology in early glaucoma diagnosis. Ophthalmic Res. 2007, 39, 338–343. [Google Scholar] [CrossRef] [PubMed]
- Salvetat, M.L.; Zeppieri, M.; Tosoni, C.; Parisi, L.; Brusini, P. Non-conventional perimetric methods in the detection of early glaucomatous functional damage. Eye 2010, 24, 835–842. [Google Scholar] [CrossRef] [Green Version]
- Zeppieri, M.; Brusini, P.; Parisi, L.; Johnson, C.A.; Sampaolesi, R.; Salvetat, M.L. Pulsar perimetry in the diagnosis of early glaucoma. Am. J. Ophthalmol. 2010, 149, 102–112. [Google Scholar] [CrossRef]
- Salvetat, M.L.; Zeppieri, M.; Parisi, L.; Johnson, C.A.; Sampaolesi, R.; Brusini, P. Learning effect and test-retest variability of pulsar perimetry. J. Glaucoma 2013, 22, 230–237. [Google Scholar] [CrossRef]
- Alnawaiseh, M.; Hömberg, L.; Eter, N.; Prokosch, V. Comparison between the Correlations of retinal nerve fiber layer thickness measured by spectral domain optical coherence tomography and visual field defects in standard automated white-on-white perimetry versus pulsar perimetry. J. Ophthalmol. 2017, 2017, 8014294. [Google Scholar] [CrossRef] [Green Version]
- Hirasawa, K.; Takahashi, N.; Matsumura, K.; Kasahara, M.; Shoji, N. Diagnostic capability of Pulsar perimetry in pre-perimetric and early glaucoma. Sci. Rep. 2017, 7, 3293. [Google Scholar] [CrossRef] [Green Version]
- Gonzalez-Hernandez, M.; Garcia-Feijo, J.; Sanchez Mendez, M.; Gonzalez de la Rosa, M. Combined spatial, contrast, and temporal functions perimetry in mild glaucoma and ocular hypertension. Eur. J. Ophthalmol. 2004, 14, 514–522. [Google Scholar] [CrossRef]
- Gonzalez de la Rosa, M.; Gonzalez-Hernandez, M.; Lozano Lopez, V.; Perera Sanz, D. Topographical spatial summation in glaucoma. Eur. J. Ophthalmol. 2007, 17, 538–544. [Google Scholar] [CrossRef]
- Gonzalez de la Rosa, M.; Gonzalez-Hernandez, M.; Sanchez-Mendez, M.; Medina-Mesa, E.; Rodriguez de la Vega, R. Detection of morphological and functional progression in initial glaucoma. Br. J. Ophthalmol. 2010, 94, 414–418. [Google Scholar] [CrossRef] [PubMed]
- Sihota, R.; Shakrawal, J.; Azad, S.V.; Kamble, N.; Dada, T. Circumpapillary optical coherence tomography angiography differences in perimetrically affected and unaffected hemispheres in primary open-angle glaucoma and the preperimetric fellow eye. Indian J. Ophthalmol. 2021, 69, 1120–1126. [Google Scholar] [PubMed]
- Hohberger, B.; Lucio, M.; Schlick, S.; Wollborn, A.; Hosari, S.; Mardin, C. OCT-angiography: Regional reduced macula microcirculation in ocular hypertensive and pre-perimetric glaucoma patients. PLoS ONE 2021, 16, e0246469. [Google Scholar] [CrossRef] [PubMed]
- Wang, Y.; Xin, C.; Li, M.; Swain, D.L.; Cao, K.; Wang, H.; Wang, N. Macular vessel density versus ganglion cell complex thickness for detection of early primary open-angle glaucoma. BMC Ophthalmol. 2020, 20, 17. [Google Scholar] [CrossRef] [PubMed] [Green Version]
- Lu, P.; Xiao, H.; Liang, C.; Xu, Y.; Ye, D.; Huang, J. Quantitative analysis of microvasculature in macular and peripapillary regions in early primary open-angle glaucoma. Curr. Eye Res. 2020, 45, 629–635. [Google Scholar] [CrossRef] [PubMed]
- Chang, P.Y.; Wang, J.Y.; Wang, J.K.; Yeh, S.C.; Chang, S.W. Asymmetry analysis of optical coherence tomography angiography macular perfusion density measurements in preperimetric and perimetric glaucoma. Sci. Rep. 2020, 10, 14781. [Google Scholar] [CrossRef]
- Hou, H.; Moghimi, S.; Zangwill, L.M.; Shoji, T.; Ghahari, E.; Penteado, R.C.; Akagi, T.; Manalastas PI, C.; Weinreb, R.N. Macula vessel density and thickness in early primary open-angle glaucoma. Am. J. Ophthalmol. 2019, 199, 120–132. [Google Scholar] [CrossRef]
- Hou, H.; Moghimi, S.; Zangwill, L.M.; Shoji, T.; Ghahari, E.; Manalastas, P.I.C.; Penteado, R.C.; Weinreb, R.N. Inter-eye asymmetry of optical coherence tomography angiography vessel density in bilateral glaucoma, glaucoma suspect, and healthy eyes. Am. J. Ophthalmol. 2018, 190, 69–77. [Google Scholar] [CrossRef]
- Mansoori, T.; Sivaswamy, J.; Gamalapati, J.S.; Balakrishna, N. Radial Peripapillary capillary density measurement using optical coherence tomography angiography in early glaucoma. J. Glaucoma 2017, 26, 438–443. [Google Scholar] [CrossRef]
- Cennamo, G.; Montorio, D.; Velotti, N.; Sparnelli, F.; Reibaldi, M.; Cennamo, G. Optical coherence tomography angiography in pre-perimetric open-angle glaucoma. Graefe’s Arch. Clin. Exp. Ophthalmol. 2017, 255, 1787–1793. [Google Scholar] [CrossRef]
- Akil, H.; Huang, A.S.; Francis, B.A.; Sadda, S.R.; Chopra, V. Retinal vessel density from optical coherence tomography angiography to differentiate early glaucoma, pre-perimetric glaucoma and normal eyes. PLoS ONE 2017, 12, e0170476. [Google Scholar] [CrossRef]
- Bak, E.; Kim, Y.W.; Ha, A.; Kim, Y.K.; Park, K.H.; Jeoung, J.W. Pre-perimetric Open Angle Glaucoma with Young Age of Onset: Natural Clinical Course and Risk Factors for Progression. Am. J. Ophthalmol. 2020, 216, 121–131. [Google Scholar] [CrossRef] [PubMed]
- Göbel, K.; Erb, C. Sensitivity and specificity of flicker perimetry with Pulsar. Comparison with achromatic (white-on-white) perimetry in glaucoma patients. Ophthalmologe 2013, 110, 141–145. [Google Scholar] [CrossRef] [PubMed]
- Vidal-Fernández, A.; García Feijoó, J.; González-Hernández, M.; González De La Rosa, M.; García Sánchez, J. Initial findings with pulsar perimetry in patients with ocular hypertension. Arch. Soc. Esp. Oftalmol. 2002, 77, 321–326. [Google Scholar] [PubMed]
- Cennamo, G.; Montorio, D.; Romano, M.R.; Cardone, D.M.; Minervino, C.; Reibaldi, M.; Cennamo, G. Structure-functional parameters in differentiating between patients with different degrees of glaucoma. J. Glaucoma 2016, 25, e884–e888. [Google Scholar] [CrossRef] [PubMed]
- Shin, H.Y.; Park, H.Y.; Jung, K.I.; Park, C.K. Glaucoma diagnosis optic disc analysis comparing Cirrus spectral domain optical coherence tomography and Heidelberg retina tomograph II. Jpn. J. Ophthalmol. 2013, 57, 41–46. [Google Scholar] [CrossRef] [PubMed]
- Weinreb, R.N.; Friedman, D.S.; Fechtner, R.D.; Cioffi, G.A.; Coleman, A.L.; Girkin, C.A.; Liebmann, J.M.; Singh, K.; Wilson, M.R.; Wilson, R.; et al. Risk assessment in the management of patients with ocular hypertension. Am. J. Ophthalmol. 2004, 138, 458–467. [Google Scholar] [CrossRef]
- Susanna, R., Jr.; Vessani, R.M. Staging glaucoma patient: Why and how? Open Ophthalmol. J. 2009, 3, 59–64. [Google Scholar] [CrossRef]
- Rao, H.L.; Pradhan, Z.S.; Weinreb, R.N.; Riyazuddin, M.; Dasari, S.; Venugopal, J.P.; Puttaiah, N.K.; Rao DA, S.; Devi, S.; Mansouri, K.; et al. Vessel density and structural measurements of optical coherence tomography in primary angle closure and primary angle closure glaucoma. Am. J. Ophthalmol. 2017, 177, 106–115. [Google Scholar] [CrossRef]
- Kraus, M.F.; Potsaid, B.; Mayer, M.A.; Bock, R.; Baumann, B.; Liu, J.J.; Hornegger, J.; Fujimoto, J.G. Motion correction in optical coherence tomography volumes on a per A-scan basis using orthogonal scan patterns. Biomed. Opt. Express 2012, 3, 1182–1199. [Google Scholar] [CrossRef] [Green Version]
- Takusagawa, H.L.; Liu, L.; Ma, K.N.; Jia, Y.; Gao, S.S.; Zhang, M.; Edmunds, B.; Parikh, M.; Tehrani, S.; Morrison, J.C.; et al. Projection-resolved optical coherence tomography angiography of macular retinal circulation in glaucoma. Ophthalmology 2017, 124, 1589–1599. [Google Scholar] [CrossRef]
- Yarmohammadi, A.; Zangwill, L.M.; Diniz-Filho, A.; Saunders, L.J.; Suh, M.H.; Wu, Z.; Manalastas PI, C.; Akagi, T.; Medeiros, F.A.; Weinreb, R.N. Peripapillary and macular vessel density in patients with glaucoma and single-hemifield visual field defect. Ophthalmology 2017, 124, 709–719. [Google Scholar] [CrossRef] [Green Version]
- Chen, C.L.; Bojikian, K.D.; Wen, J.C.; Zhang, Q.; Xin, C.; Mudumbai, R.C.; Johnstone, M.A.; Chen, P.P.; Wang, R.K. Peripapillary retinal nerve fiber layer vascular microcirculation in eyes with glaucoma and single-hemifield visual field loss. JAMA Ophthalmol. 2017, 135, 461–468. [Google Scholar] [CrossRef]
- Pradhan, Z.S.; Dixit, S.; Sreenivasaiah, S.; Rao, H.L.; Venugopal, J.P.; Devi, S.; Webers, C.A.B. A sectoral analysis of vessel density measurements in perimetrically intact regions of glaucomatous eyes: An optical coherence tomography angiography study. J. Glaucoma 2018, 27, 525–531. [Google Scholar] [CrossRef] [PubMed]
- Hood, D.C.; Raza, A.S.; de Moraes, C.G.; Liebmann, J.M.; Ritch, R. Glaucomatous damage of the macula. Prog. Retin. Eye Res. 2013, 32, 1–21. [Google Scholar] [CrossRef] [PubMed] [Green Version]
- Zhang, M.; Hwang, T.S.; Campbell, J.P.; Bailey, S.T.; Wilson, D.J.; Huang, D.; Jia, Y. Projection-resolved optical coherence tomographic angiography. Biomed. Opt. Express 2016, 7, 816–828. [Google Scholar] [CrossRef] [Green Version]
- Campbell, J.P.; Zhang, M.; Hwang, T.S.; Bailey, S.T.; Wilson, D.J.; Jia, Y.; Huang, D. Detailed vascular anatomy of the human retina by projection-resolved optical coherence tomography angiography. Sci. Rep. 2017, 7, 42201. [Google Scholar] [CrossRef] [PubMed] [Green Version]
- Patel, R.C.; Wang, J.; Hwang, T.S.; Zhang, M.; Gao, S.S.; Pennesi, M.E.; Bailey, S.T.; Lujan, B.J.; Wang, X.; Wilson, D.J.; et al. Plexus-specific detection of retinal vascular pathologic conditions with projection-resolved OCT angiography. Ophthalmol. Retina 2018, 2, 816–826. [Google Scholar] [CrossRef]

| Parameters | (A) Control (n = 145) | (B) PPG (n = 40) | (C) PG (n = 17) | p Value | |||||
|---|---|---|---|---|---|---|---|---|---|
| Mean | SD | Mean | SD | Mean | SD | (A)–(B) | (A)–(C) | (B)–(C) | |
| Age (years) | 41.2 | 9.6 | 46.2 | 8.1 | 49.8 | 9.1 | 0.002 * | 0.002 * | 0.215 |
| Sex (M:F) | 26:119 | 9:31 | 1:16 | 0.514 | 0.310 | 0.253 | |||
| VA (LogMAR) | 0.036 | 0.044 | 0.026 | 0.032 | 0.041 | 0.036 | 0.203 | 0.602 | 0.212 |
| IOP (mmHg) | 15.0 | 3.2 | 14.3 | 3.3 | 14.5 | 3.0 | 0.216 | 0.491 | 0.876 |
| CCT (μm) | 551.8 | 41.9 | 541.7 | 58.2 | 542.9 | 44.6 | 0.220 | 0.450 | 0.930 |
| SE (D) | −372.9 | 298.7 | −506.3 | 359.2 | −423.5 | 389.4 | 0.020 | 0.537 | 0.372 |
| SAP MS (dB) | 28.3 | 2.0 | 28.0 | 1.2 | 24.1 | 2.8 | 0.255 | <0.001 * | <0.001 * |
| SAP MD (dB) | −0.6 | 1.3 | −0.2 | 1.1 | 3.1 | 2.5 | 0.058 | <0.001 * | <0.001 * |
| SAP sLV (dB) | 1.6 | 0.6 | 1.7 | 0.5 | 3.0 | 0.8 | 0.700 | <0.001 * | <0.001 * |
| Parameters | (A) Control (n = 145) | (B) PPG (n = 40) | (C) PG (n = 17) | p Value | |||||
|---|---|---|---|---|---|---|---|---|---|
| Mean | SD | Mean | SD | Mean | SD | (A)–(B) | (A)–(C) | (B)–(C) | |
| Pulsar perimetry | |||||||||
| MD (src) | 0.5 | 2.0 | 1.7 | 2.5 | 4.2 | 2.6 | 0.004 * | <0.001 * | <0.001 * |
| sLV (src) | 1.9 | 0.7 | 2.3 | 0.7 | 2.8 | 0.8 | 0.001 * | <0.001 * | 0.021 |
| OCT-ONH analysis | |||||||||
| Vertical CDR | 0.5 | 0.2 | 0.6 | 0.1 | 0.6 | 0.2 | 0.006 * | 0.063 | 0.939 |
| Horizontal CDR | 0.6 | 0.2 | 0.7 | 0.2 | 0.7 | 0.1 | 0.156 | 0.190 | 0.774 |
| Rim. Area (mm2) | 1.4 | 0.4 | 1.3 | 0.3 | 1.2 | 0.4 | 0.133 | 0.034 | 0.337 |
| OCT-GCC thickness (μm) | |||||||||
| Whole Image | 98.0 | 5.2 | 91.0 | 5.0 | 89.3 | 7.5 | <0.001 * | <0.001 * | 0.285 |
| Superior | 98.1 | 5.3 | 90.5 | 4.8 | 92.3 | 6.8 | <0.001 * | <0.001 * | 0.247 |
| Inferior | 98.0 | 5.5 | 90.8 | 5.2 | 86.9 | 10.4 | <0.001 * | <0.001 * | 0.023 |
| OCTA (Disc)-RNFL thickness (μm) | |||||||||
| Peripapillary | 116.1 | 11.1 | 105.0 | 11.8 | 99.1 | 12.7 | <0.001 * | <0.001 * | 0.078 |
| Superior-Hemi | 116.5 | 12.8 | 104.6 | 12.6 | 99.7 | 10.9 | <0.001 * | <0.001 * | 0.186 |
| Inferior-Hemi | 115.6 | 11.3 | 105.4 | 12.6 | 98.6 | 18.6 | <0.001 * | <0.001 * | 0.059 |
| OCTA (Macular)-Retina thickness (μm) | |||||||||
| Whole Image | 282.8 | 10.8 | 269.9 | 9.6 | 267.9 | 11.2 | <0.001 * | <0.001 * | 0.522 |
| Superior-Hemi | 285.5 | 10.9 | 271.9 | 9.9 | 272.6 | 10.2 | <0.001 * | <0.001 * | 0.802 |
| Inferior-Hemi | 280.0 | 11.2 | 267.7 | 10.3 | 263.2 | 13.8 | <0.001 * | <0.001 * | 0.172 |
| Fovea | 247.9 | 19.1 | 241.4 | 15.8 | 246.7 | 18.3 | 0.049 | 0.804 | 0.318 |
| ParaFovea | 318.9 | 15.3 | 307.2 | 12.9 | 307.5 | 10.8 | <0.001 * | 0.003 * | 0.928 |
| PeriFovea | 280.9 | 11.0 | 267.8 | 10.4 | 265.1 | 11.7 | <0.001 * | <0.001 * | 0.393 |
| OCTA (Disc)-RPC (%) | |||||||||
| Whole Image | 49.3 | 3.3 | 46.5 | 2.6 | 45.4 | 3.9 | <0.001 * | <0.001 * | 0.244 |
| Inside Disc | 51.2 | 5.9 | 50.4 | 5.6 | 48.5 | 7.7 | 0.432 | 0.073 | 0.269 |
| Peripapillary | 52.3 | 2.7 | 48.7 | 3.7 | 48.2 | 4.9 | <0.001 * | <0.001 * | 0.592 |
| Superior-Hemi | 52.4 | 3.0 | 48.8 | 4.2 | 48.3 | 5.0 | <0.001 * | <0.001 * | 0.666 |
| Inferior-Hemi | 52.2 | 2.8 | 48.5 | 3.8 | 48.0 | 6.1 | <0.001 * | <0.001 * | 0.568 |
| OCTA (Macular)-VDms (%) | |||||||||
| Whole Image | 47.7 | 3.4 | 45.4 | 3.8 | 44.1 | 5.1 | <0.001 * | <0.001 * | 0.202 |
| Superior-Hemi | 47.9 | 3.5 | 45.6 | 4.0 | 44.6 | 4.7 | 0.001 * | 0.001 * | 0.319 |
| Inferior-Hemi | 47.5 | 3.4 | 45.2 | 3.7 | 43.5 | 6.0 | 0.001 * | <0.001 * | 0.119 |
| Fovea | 19.7 | 6.8 | 16.7 | 5.9 | 14.8 | 5.7 | 0.010 | 0.004 * | 0.329 |
| ParaFovea | 48.8 | 4.6 | 46.5 | 4.9 | 44.5 | 5.8 | 0.007 * | <0.001 * | 0.144 |
| PeriFovea | 48.6 | 3.5 | 46.2 | 3.8 | 45.0 | 5.0 | <0.001 * | <0.001 * | 0.244 |
| OCTA (Macular)-VDmd (%) | |||||||||
| Whole Image | 45.0 | 5.5 | 41.8 | 5.5 | 41.4 | 6.2 | 0.001 * | 0.011 | 0.823 |
| Superior-Hemi | 45.1 | 5.6 | 42.1 | 5.8 | 42.2 | 6.2 | 0.003 * | 0.046 | 0.945 |
| Inferior-Hemi | 44.9 | 5.7 | 41.4 | 5.5 | 40.6 | 6.5 | 0.001 * | 0.003 * | 0.606 |
| Fovea | 35.4 | 7.3 | 32.9 | 6.4 | 30.6 | 6.0 | 0.055 | 0.009 * | 0.255 |
| ParaFovea | 51.7 | 4.7 | 49.3 | 4.8 | 49.8 | 5.8 | 0.004 * | 0.109 | 0.726 |
| PeriFovea | 45.6 | 6.2 | 41.9 | 6.1 | 41.3 | 6.7 | 0.001 * | 0.008 * | 0.769 |
| Parameters | AUC | SE | p Value | Best Cut-Off | Se | Sp | Se at 80% Sp | Se at 90% Sp |
|---|---|---|---|---|---|---|---|---|
| Pulsar perimetry | ||||||||
| MD (src) | 0.642 | 0.048 | 0.003 * | >−0.7 | 87.5 | 35.2 | 30.0 | 25.0 |
| sLV (src) | 0.673 | 0.046 | <0.001 * | >1.6 | 85.0 | 44.8 | 43.0 | 20.0 |
| OCT-ONH analysis | ||||||||
| Vertical CDR | 0.652 | 0.050 | 0.002 * | >0.59 | 50.0 | 80.7 | 50.0 | 22.8 |
| Horizontal CDR | 0.566 | 0.051 | 0.195 | >0.65 | 55.0 | 57.2 | 31.3 | 16.3 |
| Rim. Area (mm2) | 0.623 | 0.048 | 0.010 | ≤1.25 | 67.5 | 58.6 | 37.5 | 8.1 |
| OCT-GCC thickness (μm) | ||||||||
| Whole Image | 0.836 | 0.033 | <0.001 * | ≤95 | 77.5 | 73.1 | 65.0 | 55.0 |
| Superior | 0.860 | 0.030 | <0.001 * | ≤96 | 90.0 | 66.2 | 67.5 | 62.5 |
| Inferior | 0.822 | 0.035 | <0.001 * | ≤92 | 60.0 | 86.9 | 62.5 | 50.0 |
| OCTA (Disc)-RNFL thickness (μm) | ||||||||
| Peripapillary | 0.780 | 0.046 | <0.001 * | ≤109 | 77.5 | 71.0 | 66.7 | 47.5 |
| Superior-Hemi | 0.768 | 0.044 | <0.001 * | ≤109 | 75.0 | 71.0 | 55.0 | 44.7 |
| Inferior-Hemi | 0.739 | 0.050 | <0.001 * | ≤106 | 67.5 | 77.9 | 61.9 | 41.3 |
| OCTA (Macular)-Retina thickness (μm) | ||||||||
| Whole Image | 0.814 | 0.036 | <0.001 * | ≤276 | 77.5 | 71.0 | 62.5 | 48.8 |
| Superior-Hemi | 0.817 | 0.034 | <0.001 * | ≤275 | 65.0 | 82.1 | 66.5 | 41.7 |
| Inferior-Hemi | 0.794 | 0.040 | <0.001 * | ≤270 | 70.0 | 75.9 | 63.8 | 45.0 |
| Fovea | 0.615 | 0.047 | 0.014 | ≤242 | 60.0 | 64.1 | 27.5 | 10.0 |
| ParaFovea | 0.736 | 0.043 | <0.001 * | ≤313 | 75.0 | 62.8 | 49.5 | 30.8 |
| PeriFovea | 0.803 | 0.038 | <0.001 * | ≤276 | 80.0 | 65.5 | 62.5 | 50.6 |
| OCTA (Disc)-RPC (%) | ||||||||
| Whole Image | 0.791 | 0.041 | <0.001 * | ≤47.4 | 70 | 80.7 | 70 | 51.3 |
| Inside Disc | 0.543 | 0.051 | 0.397 | ≤51.9 | 62.5 | 51.0 | 22.5 | 12.5 |
| Peripapillary | 0.781 | 0.043 | <0.001 * | ≤48.8 | 55 | 87.6 | 60 | 50.4 |
| Superior-Hemi | 0.749 | 0.046 | <0.001 * | ≤49.0 | 52.5 | 89.7 | 55.6 | 51.3 |
| Inferior-Hemi | 0.775 | 0.043 | <0.001 * | ≤50.2 | 70 | 74.5 | 62.5 | 40 |
| OCTA (Macular)-VDms (%) | ||||||||
| Whole Image | 0.684 | 0.046 | <0.001 * | ≤47.2 | 70.0 | 62.8 | 38.1 | 24.4 |
| Superior-Hemi | 0.678 | 0.047 | <0.001 * | ≤45.7 | 57.5 | 77.9 | 50.0 | 16.3 |
| Inferior-Hemi | 0.686 | 0.046 | <0.001 * | ≤47.7 | 80.0 | 55.9 | 32.5 | 25.6 |
| Fovea | 0.635 | 0.048 | 0.005 * | ≤20.6 | 77.5 | 47.6 | 27.5 | 22.5 |
| ParaFovea | 0.642 | 0.046 | 0.002 * | ≤51.1 | 90.0 | 40.0 | 27.5 | 12.5 |
| PeriFovea | 0.681 | 0.047 | <0.001 * | ≤47.3 | 65.0 | 70.3 | 37.5 | 27.5 |
| OCTA (Macular)-VDmd (%) | ||||||||
| Whole Image | 0.673 | 0.050 | <0.001 * | ≤40.0 | 52.5 | 79.3 | 50.0 | 27.5 |
| Superior-Hemi | 0.655 | 0.052 | 0.003 * | ≤42.0 | 60.0 | 69.7 | 42.5 | 31.3 |
| Inferior-Hemi | 0.682 | 0.048 | <0.001 * | ≤43.8 | 75.0 | 55.2 | 47.5 | 27.5 |
| Fovea | 0.622 | 0.045 | 0.007 * | ≤37.5 | 82.5 | 44.1 | 27.5 | 7.5 |
| ParaFovea | 0.646 | 0.050 | 0.004 * | ≤52.9 | 85.0 | 40.7 | 37.5 | 25.0 |
| PeriFovea | 0.682 | 0.049 | <0.001 * | ≤46.2 | 85.0 | 46.9 | 45.0 | 27.5 |
| Parameters | AUC | SE | p Value | Best Cut-Off | Se | Sp | Se at 80% Sp | Se at 90% Sp |
|---|---|---|---|---|---|---|---|---|
| Pulsar perimetry | ||||||||
| MD (src) | 0.885 | 0.033 | <0.001 * | >0.9 | 100.0 | 64.8 | 76.5 | 58.8 |
| sLV (src) | 0.810 | 0.056 | <0.001 * | >2.2 | 76.5 | 74.5 | 68.2 | 50.0 |
| OCT-ONH analysis | ||||||||
| Vertical CDR | 0.631 | 0.077 | 0.087 | >0.51 | 70.6 | 57.2 | 41.2 | 23.5 |
| Horizontal CDR | 0.558 | 0.075 | 0.439 | >0.52 | 94.1 | 25.5 | 29.4 | 17.7 |
| Rim. Area (mm2) | 0.681 | 0.080 | 0.023 | ≤1.14 | 64.7 | 71.7 | 47.1 | 35.3 |
| OCT-GCC thickness (μm) | ||||||||
| Whole Image | 0.847 | 0.056 | <0.001 * | ≤95 | 88.2 | 70.3 | 70.6 | 52.9 |
| Superior | 0.768 | 0.071 | <0.001 * | ≤96 | 82.4 | 66.2 | 52.9 | 41.2 |
| Inferior | 0.832 | 0.051 | <0.001 * | ≤95 | 82.4 | 64.8 | 58.8 | 52.9 |
| OCTA (Disc)-RNFL thickness (μm) | ||||||||
| Peripapillary | 0.841 | 0.057 | <0.001 * | ≤104 | 76.5 | 87.6 | 76.5 | 63.2 |
| Superior-Hemi | 0.856 | 0.052 | <0.001 * | ≤105 | 82.4 | 80.0 | 82.4 | 62.5 |
| Inferior-Hemi | 0.783 | 0.073 | <0.001 * | ≤107 | 76.5 | 75.2 | 70.6 | 47.1 |
| OCTA (Macular)-Retina thickness (μm) | ||||||||
| Whole Image | 0.825 | 0.047 | <0.001 * | ≤281 | 94.1 | 58.6 | 57.1 | 52.9 |
| Superior-Hemi | 0.801 | 0.046 | <0.001 * | ≤285 | 100.0 | 51.7 | 52.9 | 45.1 |
| Inferior-Hemi | 0.827 | 0.055 | <0.001 * | ≤262 | 58.8 | 93.8 | 67.7 | 58.8 |
| Fovea | 0.553 | 0.067 | 0.432 | ≤260 | 94.1 | 28.3 | 19.6 | 8.8 |
| ParaFovea | 0.730 | 0.052 | <0.001 * | ≤321 | 100.0 | 44.1 | 47.1 | 17.7 |
| PeriFovea | 0.833 | 0.046 | <0.001 * | ≤280 | 100.0 | 53.1 | 58.8 | 52.9 |
| OCTA (Disc)-RPC (%) | ||||||||
| Whole Image | 0.809 | 0.063 | <0.001 * | ≤48.3 | 82.4 | 66.9 | 61.8 | 52.9 |
| Inside Disc | 0.611 | 0.083 | 0.184 | ≤43.8 | 35.3 | 89.7 | 41.2 | 29.4 |
| Peripapillary | 0.752 | 0.083 | 0.002 * | ≤48.2 | 58.8 | 91.0 | 64.7 | 58.8 |
| Superior-Hemi | 0.734 | 0.088 | 0.008 * | ≤47.2 | 64.7 | 94.5 | 64.7 | 64.7 |
| Inferior-Hemi | 0.697 | 0.086 | 0.022 | ≤47.4 | 47.1 | 94.5 | 58.8 | 47.1 |
| OCTA (Macular)-VDms (%) | ||||||||
| Whole Image | 0.715 | 0.077 | 0.005 * | ≤46.4 | 70.6 | 70.3 | 52.9 | 35.3 |
| Superior-Hemi | 0.716 | 0.076 | 0.005 * | ≤46.3 | 70.6 | 72.4 | 47.1 | 29.4 |
| Inferior-Hemi | 0.714 | 0.075 | 0.004 * | ≤46.8 | 76.5 | 64.8 | 47.1 | 35.3 |
| Fovea | 0.714 | 0.064 | <0.001 * | ≤20.4 | 88.2 | 47.6 | 47.1 | 29.4 |
| ParaFovea | 0.731 | 0.076 | 0.002 * | ≤46.3 | 70.6 | 72.4 | 58.8 | 47.1 |
| PeriFovea | 0.714 | 0.075 | 0.004 * | ≤48.2 | 76.5 | 63.5 | 41.2 | 41.2 |
| OCTA (Macular)-VDmd (%) | ||||||||
| Whole Image | 0.669 | 0.081 | 0.037 | ≤39.0 | 52.9 | 86.2 | 52.9 | 47.1 |
| Superior-Hemi | 0.636 | 0.082 | 0.096 | ≤39.6 | 47.1 | 83.5 | 47.1 | 29.4 |
| Inferior-Hemi | 0.686 | 0.080 | 0.020 | ≤38.3 | 52.9 | 89.0 | 52.9 | 47.1 |
| Fovea | 0.721 | 0.056 | <0.001 * | ≤32.8 | 70.6 | 71.7 | 47.1 | 11.8 |
| ParaFovea | 0.609 | 0.084 | 0.194 | ≤47.0 | 47.1 | 85.5 | 47.1 | 23.5 |
| PeriFovea | 0.679 | 0.076 | 0.018 | ≤38.3 | 47.1 | 89.0 | 47.1 | 38.2 |
| Parameters | ONH- Rim. Area | GCC-Whole | RNFL- Peripapillary | Retina-Whole | RPC-Whole | VDms-Whole | VDmd-Whole |
|---|---|---|---|---|---|---|---|
| GCC-Whole | 0.132(0.061) | 1 | |||||
| RNFL-Peripapillary | 0.274(<0.001 *) | 0.427(<0.001 *) | 1 | ||||
| Retina-Whole | 0.067(0.346) | 0.795(<0.001 *) | 0.345(<0.001 *) | 1 | |||
| RPC-Whole | 0.226(0.001 *) | 0.205(0.003 *) | 0.337(<0.001 *) | 0.166(0.018) | 1 | ||
| VDms-Whole | 0.049(0.488) | 0.386(<0.001 *) | 0.175(0.013) | 0.307(<0.001 *) | 0.226(<0.001 *) | 1 | |
| VDmd-Whole | −0.014(0.839) | 0.180(0.010) | 0.018(0.802) | 0.141(0.046) | 0.159(0.024) | 0.525(<0.001 *) | 1 |
| PP-MD | 0.031(0.657) | −0.146(0.039) | −0.153(0.030) | −0.169(0.016) | −0.187(0.008 *) | −0.223(0.001 *) | −0.217(0.002 *) |
| SAP-MD | −0.064(0.365) | −0.186(0.008 *) | −0.156(0.026) | −0.145(0.039) | −0.153(0.030) | −0.217(0.002 *) | −0.144(0.041) |
Publisher’s Note: MDPI stays neutral with regard to jurisdictional claims in published maps and institutional affiliations. |
© 2021 by the authors. Licensee MDPI, Basel, Switzerland. This article is an open access article distributed under the terms and conditions of the Creative Commons Attribution (CC BY) license (https://creativecommons.org/licenses/by/4.0/).
Share and Cite
Chen, H.-C.; Chou, M.C.-Y.; Lee, M.-T.; Lee, C.-Y.; Yang, C.-N.; Liu, C.-H.; Chao, S.-C. The Diagnostic Value of Pulsar Perimetry, Optical Coherence Tomography, and Optical Coherence Tomography Angiography in Pre-Perimetric and Perimetric Glaucoma. J. Clin. Med. 2021, 10, 5825. https://doi.org/10.3390/jcm10245825
Chen H-C, Chou MC-Y, Lee M-T, Lee C-Y, Yang C-N, Liu C-H, Chao S-C. The Diagnostic Value of Pulsar Perimetry, Optical Coherence Tomography, and Optical Coherence Tomography Angiography in Pre-Perimetric and Perimetric Glaucoma. Journal of Clinical Medicine. 2021; 10(24):5825. https://doi.org/10.3390/jcm10245825
Chicago/Turabian StyleChen, Hung-Chih, Michael Chia-Yen Chou, Ming-Tsung Lee, Chia-Yi Lee, Che-Ning Yang, Chin-Hsin Liu, and Shih-Chun Chao. 2021. "The Diagnostic Value of Pulsar Perimetry, Optical Coherence Tomography, and Optical Coherence Tomography Angiography in Pre-Perimetric and Perimetric Glaucoma" Journal of Clinical Medicine 10, no. 24: 5825. https://doi.org/10.3390/jcm10245825