Abstract
This study aimed to investigate the role of a panel of salivary cytokines as biomarkers for early detection oral squamous cell carcinoma (OSCC), comparing their levels among healthy individuals, patients with oral leukoplakia (OL), and malignant lesions. Cytokine profiling analysis performed in a minimally invasive sample was correlated with clinicopathological variables in our patient cohorts. Unstimulated saliva was obtained from subjects with OSCC at early (n = 33) and advanced (n = 33) disease, OL with homogeneous (n = 33) and proliferative verrucous (n = 33) clinical presentations, and healthy controls (n = 25). Salivary IL-1α, IL-6, IL-8, IP-10, MCP-1, TNF-α, HCC-1, and PF-4 levels were analyzed by a sensitive bead-based multiplex immunoassay. Mean levels of IL-6, IL-8, TNF-α, HCC-1, MCP-1, and PF-4 differed significantly between OSCC, OL, and control saliva (p < 0.05). We found notably higher IL-6 and TNF-α in advanced compared to early OSCC stages. The area under the curve (AUC) for OSCC vs. control was greater than 0.8 for IL-6, IL-8, TNF-α, and HCC-1, and greater than 0.7 for PF-4. The presence of neck metastases (NM) was associated with increased IL-6 and TNF-α levels. Our findings suggest that salivary IL-6, IL-8, TNF-α, HCC-1, and PF-4 may discriminate between OSCC, OL, and healthy controls. IL-6 and TNF-α may indicate OSCC progression, being distinctive in the presence of NM.
1. Introduction
Oral squamous cell carcinoma (OSCC) is the most prevalent malignant neoplasia of the oral cavity that accounts for more than 90% of all head and neck (HNC) cancers [1]. It usually affects elderly people over the age of 50. Nevertheless, the occurrence among young adults between 18 and 44 years ranges from 0.4 to 3.6%, with a rising tendency [2]. Oral cancer is a complex multifactorial disease involving personal lifestyle, genetic and environmental factors. Tobacco smoking, betel chewing, excessive alcohol consumption, and exposure to ultraviolet and ionizing radiation, infection with human papillomavirus (HPV), and human immunodeficiency virus (HIV) have long been implicated as major risk factors [2]. The gold standard for diagnosis remains histopathological assessment of an incisional tissue biopsy taken from the suspected area. Specific biomarkers are as yet unavailable and regular tests for the detection of pre-malignant lesions remain scarce in routine clinical settings. Some OSCCs are preceded by clinically visible but otherwise often asymptomatic lesions of the oral mucosa, summarized as precancerous and considered as oral potentially malignant disorders (OPMD) according to the World Health Organization (WHO) [3]. Among them, oral leukoplakia (OL) is the most common representative, considered to have the highest risk of malignant transformation reaching up to 17% [3,4]. The latter exhibits different subtypes out of which the non-homogeneous proliferative verrucous leukoplakia (PVL) presents a higher tendency for cancerous conversion than the homogeneous clinical form according to follow-up studies [5,6]. Immunological analysis of OL specimens revealed the presence of different inflammatory cells in connective tissue, suggesting chronic inflammation [7]. The relation between oral cancer/precancer and chronic inflammation has been proved by the imbalance in local and systemic immunomodulatory cytokine levels that may promote tumor growth and proliferation [7,8]. Cytokines including interleukins (IL), chemokines, interferons (IFNs), and tumor necrosis factors (TNFs) are involved in the regulation of the innate and adaptive immune responses [9,10]. Pro-inflammatory cytokines such as IL-1, IL-6, IL-8, IFN-γ, TNF-α, on one side are responsible for the growth and proliferation of immune and tumor cells, while on the other hand, increase tumor immune surveillance programs. In contrast, anti-inflammatory factors like IL-1 receptor antagonist (IL-1ra) IL-4, IL-10, IL-13, neutralize the proliferative potential of their pro-inflammatory counterparts and, at once, negatively regulate the anti-tumor immune response [11,12]. Functionally classified as inflammatory and homeostatic, chemokines are involved in chemotaxis in inflammation and angiogenesis, as well important members of the tumor microenvironment, mediating the recruitment of immune cells in it [13]. Pathway intercommunications are of major importance, as single or a combination of several cytokines can contribute to up- or down-regulation of others, and certain ones can have both properties. It has been suggested that overexpression of pro-inflammatory cytokines promotes tumor cell growth and survival [13,14]. Literature highlights the altered production of nuclear factor kappa-light-chain-enhancer of activated B cells (NF-κB) dependent modulators such as IL-1, IL-6, IL-8, IL-10, IL-13, and TNF-α by OSCC cells [14,15,16,17]. Besides, the NF-κB family of transcription factors modulates the transcription of angiogenic and tumorigenic chemokine genes, in part. Overall, altered chemokine function in cancer promotes cell survival, enhances proliferation, neovascularization, motility, and metastasis in multiple tumor types [15]. Although most of the investigations have addressed OSCC immune deregulation by using serum as a cytokine source [18,19], sometimes, saliva may be preferred to blood or other body fluids, due to its continuous contact with the oral lesions, offering less invasive collection, processing, and storage methods [20]. In laboratory practices, immunoassays are commonly utilized for the evaluation of cytokine expression because of their specificity and sensitivity [21]. To date, no study has analyzed differences in salivary cytokines between early and advanced OSCC stages, comparing the results with two OL subgroups as potential pre-cancer disorders: one with the lowest risk, being homogeneous leukoplakia (HL), and one with the highest risk of malignant transformation, being PVL. The main purpose of this study was to investigate a panel of salivary cytokines as putative biomarkers to discriminate oral cancer from the two OL subtypes and controls, focusing on discernment between early OSCC and the non-malignant cases analyzed. In addition, we intended to study if any of the target biomarkers could indicate the group of cases with neck metastasis within the cancer patients.
2. Materials and Methods
2.1. Study Participants and Sample Collection
Samples were obtained at the Service of Stomatology and Maxillofacial Surgery and analyzed in the Molecular Oncology laboratory of the University General Hospital of Valencia (HGUV) between 2017 and 2020. The 157 volunteers enrolled in the study were distributed in five groups after established case-control inclusion criteria. Group 1 and 2 consisted of 33 patients each, of early (Tis, I and II) and advanced (III and IV) OSCC stages, respectively. The diagnosis was based on histopathological analysis from a tissue biopsy and staged according to the TNM classification system [22]. Group 3 was composed of 33 HL and Group 4 of 33 PVL cases. The diagnosis of OL was done according to the Van der Waal criteria [23,24]. Like OSCC, OL patients were not currently undergoing or having undergone any form of treatment for these lesions. The control group (group 5) included 25 age and sex-matched healthy individuals, without visible oral lesions and any acute or chronic inflammatory conditions. Oral health and periodontal status were recorded for all the volunteers recruited in the different groups and those presenting oral significant periodontal disease were not considered for analysis. We could not identify any systemic diseases (such as autoimmune disorders) in our groups that may have influenced our salivary findings. We have not analysed the presence of HPV infection in our cases in the different groups. Therefore, we had no information available on their HPV-status.
All the participants were asked to refrain from eating, drinking, smoking, and using oral hygiene products for at least 1 h prior to sample collection, done by expectoration into 15 mL sterile tubes for 5 min. Unstimulated whole saliva was immediately centrifuged at 3000 rpm for 15 min at 4 °C, clarified supernatant was separated and frozen at −80 °C until further use [25]. Specimens with visible blood traces were discarded from the study.
2.2. Multiplex Immunoassay
Samples were thawed on ice and centrifuged at 1500 rpm at 4 °C for 10 min. For cytokine quantification, samples were diluted in assay buffer (1:2) to reduce viscosity. IL-1α, IL-6, IL-8, IP-10, MCP-1, TNF-α, HCC-1, and PF-4 concentrations were determined using MILLIPLEX MAP Human Cytokine/Chemokine assay kits (EMD Millipore, Burlington, MA, USA), as per manufacturer’s protocols. The IL-1α, IL-6, IL-8, IP-10, MCP-1, TNF-α, and HCC-1 standard curves ranged from 0 to 10,000 pg/mL and the lower limits of detection were 9.4 pg/mL, 0.9 pg/mL, 0.4 pg/mL, 8.6 pg/mL, 1.9 pg/mL, and 0.7 pg/mL, and 2.0 pg/mL, respectively. The PF-4 standard curve ranged from 0 to 150 ng/mL with a minimum detectable dose of 0.005 ng/mL. The analysis was carried out on a Luminex® 200 (Austin, TX, USA) instrument, while a digital processor managed data output and XPONENT® software (Luminex® 200) returned data as Median Fluorescence Intensity (MFI), analyzed using a 5-parameter logistic (5 PL) method for calculating cytokine concentrations in pg/mL per each sample. All samples were assayed in duplicate.
2.3. Statistical Analysis
The demographic variables were presented as simple descriptive statistics calculating median and standard deviation (SD) of numerical data-like age. Because the cytokine variables did not follow a normal distribution, the comparisons with categorical variables were conducted using the non-parametric Mann–Whitney U-test. p values ≤ 0.05 were accepted as statistically significant. The performance of each parameter in the prediction of disease vs. control status was evaluated by means of the receiver operating characteristic (ROC) curve, and the area under the curve (AUC) was measured. Differences between ROC AUCs were estimated according to the DeLong method [26] and binomial exact confidence intervals (CI) for the AUCs were calculated. The best cut-off value was selected using the Youden index [27]. Pearson’s correlation test was carried out to evaluate potential relationships among the cytokines. FDR adjusted p-value < 0.05 was considered significant with CI of 95%. The Bayesian hypothesis testing was used to estimate conditional probabilistic relationships between cytokine levels and patients’ clinical phenotypes. Statistical computing was conducted on GraphPad Prism version 6.0 (San Diego, CA, USA), MedCalc version 19.6 (Ostend, Belgium), and R version 4. 0. 2 (The R Foundation, Vienna, Austria).
3. Results
3.1. Salivary Cytokine Levels in OL, OSCC Patients, and Healthy Controls
The demographic and clinical characteristics of control individuals, HL, PVL, and OSCC patients are shown in Table 1. There were no significant differences in age and sex, among patients and controls (p > 0.05). The mean concentrations (pg/mL) of the eight salivary biomarkers are presented in Table 2. We found that patients with HL and PVL have significantly higher salivary IL-6, IL-8, MCP-1, TNF-α, and HCC-1 than their healthy counterparts (Table 2). No important differences were estimated in the expression of the target proteins between the two leukoplakia clinical forms. Further comparisons revealed notable elevations of IL-6, IL-8, TNF-α, HCC-1, and PF-4 levels in OSCC collated to OL sample cohorts (Figure 1), with increases traceable from early oral cancer stages (Table 2). The optimal predictive models based on these cytokines to distinguish OSCC from OL lesions yielded significant AUCs greater than 0.7 (Figure 1), the diagnostic utility of which is described in Table 3. Comparison of individual ROC AUCs showed no significant differences (p > 0.05, DeLong et al.) between IL-6, TNF-α, and PF-4, as well as among IL-8, PF-4, and HCC-1, outlining them as evenly suitable biomarker candidates. The multi-marker ROC curve of all five cytokines yielded an AUC of 0.884 (74.24% sensitivity and 80.30% specificity) (Figure 1). We also found the levels of six biomarkers including IL-6, IL-8, MCP-1, TNF-α, HCC-1, and PF-4 considerably increased in OSCC compared to control saliva (Figure 2), with elevation detectable from early disease onset (Table 2). No appreciable differences were assessed in IL-1α and IP-10 levels among the collated groups. ROC curve analysis showed AUCs greater than 0.8 for IL-6, IL-8, TNF-α, and HCC-1, and 0.710 for PF-4 (Figure 2). The potential diagnostic utility of those factors is presented in Table 3B. No significant differences were found between IL-6, TNF-α, and HCC-1 AUCs, as well as between IL-6, IL-8, and HCC-1 suggesting them as equally valuable biomarker candidates. The cut-off value for IL-6 that best distinguishes OSCC patients from controls was 15.038 pg/mL (81.82% sensitivity and 96% specificity), for IL-8 was 923.78 pg/mL (75.76%sensitivity and92% specificity), for TNF-α was 17.01 pg/mL (86.36% sensitivity and 100% specificity), and for HCC-1 was 112.90 pg/mL (83.33% sensitivity and 92% specificity) selected by the Youden index. The optimal predictive model based on the six cytokines together, to classify OSCC and control subjects, yielded an AUC of 0.980 (95.45% sensitivity and 88% specificity) (Figure 2).

Table 1.
Demographic characteristics of control subjects (n = 25), homogeneous leukoplakia (HL) (n = 33), proliferative verrucous leukoplakia (PVL) (n = 33) and oral squamous cell carcinoma (OSCC) patients at early (n = 33) and advanced (n = 33) stages.
Table 2.
Cytokine concentrations (pg/mL) in saliva samples of (A) control subjects, patients with HL and PVL, and (B) at early and advanced OSCC stages; values are expressed as the arithmetic mean ± standard error of the mean (SEM).
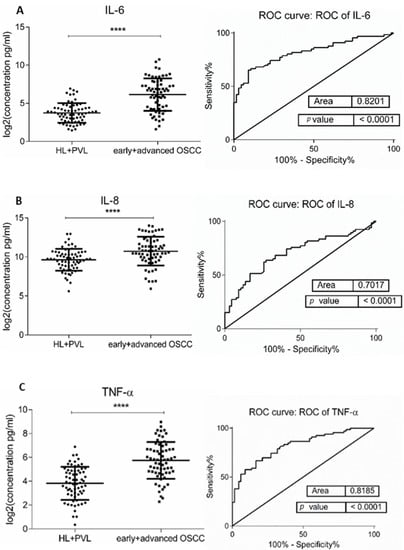
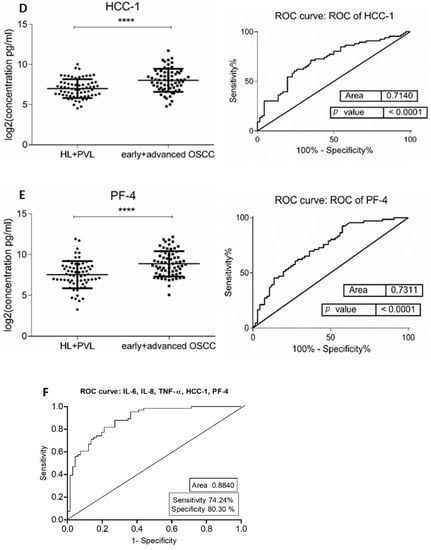
Figure 1.
Comparison of salivary cytokine levels between OL (HL + PVL) and OSCC (early +advanced stages) patients. Dot plot of significantly different log2 levels (pg/mL) (left) and ROC curve (right) of (A) IL-6, (B) IL-8, (C) TNF-α, (D) HCC-1, and (E) PF-4 (**** p ≤ 0.0001, 0.0001, 0.0001, 0.0001, and 0.0001, respectively). (F) ROC curve combining multiple markers including IL-6, IL-8, TNF-α, HCC-1, and PF-4. Values represent mean ± SD of n = 66 for OL and OSCC groups, where n is an average of two technical replicates.
Table 3.
Diagnostic utility of salivary cytokines to distinguish (A) OSCC from OL patients and (B) OSCC from control individuals.
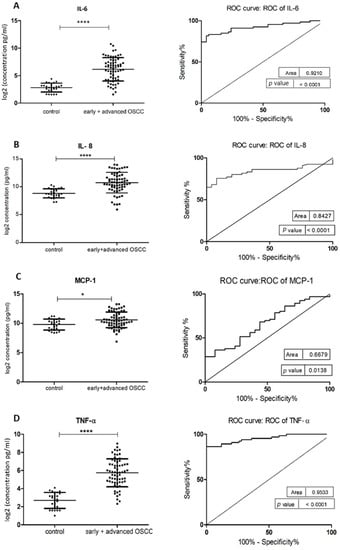
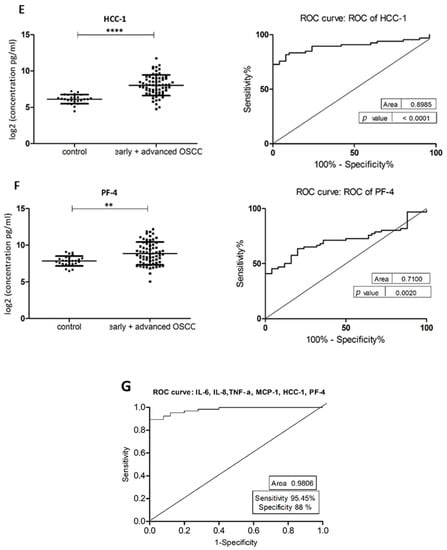
Figure 2.
Comparison of salivary cytokine levels between control individuals and OSCC patients. Dot plot of significantly different log2 levels (pg/mL) (left) and ROC curve (right) of (A) IL-6, (B) IL-8, (C) MCP-1, (D) TNF-α, (E) HCC-1 and (F) PF-4 (p ≤ 0.0001 ****, 0.0001 ****, 0.01 *, 0.0001 ****, 0.0001 **** and 0.002 **, respectively). (G) ROC curve combining multiple markers, including IL-6, IL-8, TNF-α, MCP-1, HCC-1, and PF-4. Values represent mean ± SD of n = 25 (control) and n = 66 (early + advanced OSCC stages), where n is an average of two technical replicates.
In addition, IL-6 and TNF-α levels marked considerable growth in patients at advanced compared to early OSCC clinical stages (Table 2) with AUCs of 0.694 (95%CI: 0.595–0.802) and 0.684 (95%CI: 0.558–0.793), respectively.
3.2. Correlation among Salivary Cytokine Levels and Association with Clinicopathological Characteristics of OSCC Patients
To find potential correlations among cytokine levels within the control and OSCC groups, Pearson’s correlation test was performed. In the control cohort (Table 4), IL-1α was positively correlated with IL-8 and TNF-α. IL-6 showed a positive association with IL-8, MCP-1, TNF-α, and HCC-1. IL-8 with HCC-1 and TNF-α. A positive relationship was also found between TNF-α and HCC-1, as well as among HCC-1 and PF-4. Across the early OSCC group (Table 4), positively correlated were IL-1α with MCP-1, and TNF-α, also IL-6 with IL-8 and TNF-α. As well as IL-8 with MCP-1, TNF-α, HCC-1, and PF-4. MCP-1 was positively associated with TNF-α, and the latter with HCC-1. Within the advanced OSCC group (Table 4), IL-6 was positively correlated with IP-10 and TNF-α. IL-8 with MCP-1, HCC-1, and PF-4. Additionally, MCP-1 with HCC-1 and PF-4. All of the aforementioned correlations were statistically significant (p ≤ 0.05). Besides, logistic regression analysis revealed a significant correlation of TNF-α and IL-6 with advanced OSCC (p ≤ 0.001 and 0.008, respectively). Bayesian statistics based on the interpretation of conditional probability were utilized to find potential associations between cytokine levels and OSCC patients’ clinical characteristics. A direct relationship between OSCC, IL-6, and TNF-α expressions was observed with the likelihood to indicate advanced disease higher than 70% (p = 0.76, 0.77, respectively) (Table 5). Besides, the probability of association between IL-6 and the presence of neck metastases exceeded 80% (p = 0.81) (Table 5). No significant correlation was found among patients’ sex, smoking habits, lesion/tumor location, clinical form, and cytokine expression.
Table 4.
Pearson’s pairwise correlation among salivary cytokines in (A) control, (B) early OSCC and (C) advanced OSCC groups. Correlation is significant when p ≤ 0.05 (*), p ≤ 0.01 (**) and p ≤ 0.001 (***).
Table 5.
Conditional concentration ranges of salivary cytokines (pg/mL) that maximize the probability of association with (A) advanced OSCC and (B) the presence of neck metastases in OSCC patients (early + advanced stages).
4. Discussion
The lack of symptoms at initial OSCC stages often results in late diagnosis, emphasizing the need for a practical and simple method for early detection to be used for definitive diagnosis, as well as for screening programs. Since inflammation has been linked to the pathogenesis of OSCC, the research to date indicates the possibility of using pro- and anti-inflammatory factors as screening tools for those patients [16,17]. It is now well recognized that altered cytokine responsiveness is tightly related to the development of oral cancer. Besides, it has also been associated with premalignant lesions such as OL [28,29]. The multiplex cytokine test was efficient in the detection and quantification of cytokine levels in the saliva of patients with HL PVL, at different clinical stages of OSCC, and their healthy counterparts. Six biomarkers with significantly different expression in OSCC than in controls were found in our study: IL-6, IL-8, TNF-α, MCP-1, HCC-1, and PF-4 (Figure 2), being discriminately increased from early disease stages. Among them, IL-6 and TNF-α marked a considerable growth towards the OSCC evolution, indicating potential involvement in disease progression and severity. Our results are consistent with previous findings where increased levels of NF-κB associated IL-6, IL-8, and TNF-α in oral cancer saliva have been reported, suggesting that OSCC progression is likely enhanced by continued expression of pro-inflammatory and pro-angiogenic cytokines [30,31,32,33]. However, there is a scarcity of studies describing cytokine responsiveness at different OSCC clinical stages. Lee et al. [33] found significantly upregulated IL-6, IL-8, and TNF-α levels in early OSCC (I+II stages) compared to control subjects, but no distinction between early and advanced disease (III+IV stages). Similarly, Dineshkumar et al. [34] stated no significant difference in salivary IL-6 based on OSCC clinical staging. Krishnan et al. [35] revealed important TNF-α overexpression in the sputum of OSCC patients at stage IV compared to clinical stages I, II, and III. According to our estimations, no differential IL-1α levels were seen between controls, early and advanced OSCC, corroborating the findings of Lee et al. [33] and Babiuch et al. [29]. Chemokines are secreted in response to signals such as pro-inflammatory members of the IL-1 family, TNFs, and interferon-c (IFN-c), and thus playing an important role in selectively recruiting monocytes, neutrophils, and lymphocytes [36]. Besides, their functions are multifaceted including inflammation and/or immune response [37]. The complex relationship among these immune modulators in OSCC was demonstrated by Pearson’s correlation analysis displaying multiple significant positive interconnections between the investigated markers (Table 4). Studies have implicated several chemokines and their receptors in squamous cell cancers of the HNC, arguing that tumor-related changes in chemokine composition are detectable in oral fluid [38,39]. Indeed, our results showed considerable overexpression of inflammatory MCP-1 along with homeostatic HCC-1 and PF-4 in the saliva of patients at early OSCC stages compared to normal controls (Table 2). Monocyte chemoattractant protein 1 (MCP-1) or CCL2, regulates monocyte migration and is frequently expressed as tumor cell-associated chemokine [40]. Increased MCP-1 in OSCC with metastatic lymph nodes has been detected by Ferreira and co-workers [41] while its expression in HNC has been associated with tumor invasion in esophageal SCC [42]. HCC-1 or hemofiltrate C-C motif chemokine 14 (CCL14) is a homeostatic chemokine found to promote angiogenesis and tumor progression [43]. Its involvement in oral carcinogenesis has been reported by Feng et al. [44] exhibiting differentially expressed long non-coding RNA (lncRNA) HCC-1 transcript in oral mucosal samples from OSCC patients. Platelet factor 4 (PF-4) or CXCL14, also known as BRAK is a highly conserved homeostatic chemokine, responsible for immune cell recruitment, maturation, and its influence on epithelial cell motility is thought to be a key modulatory factor in cancer. Dysregulated PF-4 was shown to limit critical antitumor immune regulation and to correlate to poor patient prognosis [45]. Notably increased PF-4 concentration in OSCC saliva was firstly described in the current research. In contrast, decreased PF-4 expression has been found in OSCC cells and its induced up-regulation resulted in suppressed activity toward oral cancer tumor progression in vivo [46,47].
The present outcomes revealed higher IP-10 levels in OSCC than in control saliva, yet, this was not statistically significant. Elevated IP-10 levels have previously been detected in serum from HNSCC patients [48], as well as in tissue and peripheral blood of individuals with nasopharyngeal carcinoma [49]. Besides, it has been suggested as a potential marker for radiotherapy response and overall survival in patients with tongue SCC [50].
It is now well known that many OSCC cases have arisen from preceding oral potentially malignant disorders (OPMDs), such as leucoplakia [51,52]. Although cytokine modulations in those patients have been researched in diverse samples, there is a lack of studies considering more than one cytokine when comparing distinct leukoplakia manifestation forms. To the best of our knowledge, we firstly described considerable elevation of IL-6, IL-8, TNF-α, IP-10, HCC-1, and PF-4 levels in OSCC compared to OL patients (Figure 1), being detectable from early cancer stages. Besides, all of the listed analytes, except PF-4, were significantly higher in HL and PVL than in subjects without oral lesions (controls) (Table 2). Whereas the premalignant microenvironment suggests eliciting pro-inflammatory cytokine production, the tumor microenvironment seems more immune-stimulatory. It could be assumed that malignant transformation of HL and PVL may be influenced by the continuous exposure to the overexpression of these pro-inflammatory, proangiogenic mediators. The fact that the same molecules were remarkably elevated in OSCC and OL may have a prognostic significance for the malignant potential of leukoplakia lesions. A few studies have addressed the potential of routine cytokine measurements in OSCC screening. Rhodus et al. [15] reported significantly higher salivary levels of IL-6, IL-8, and TNF-α in patients with OSCC compared to ones with oral preneoplastic lesions. In accordance, other authors observed elevated IL-6 [34], IL-8 [53,54], and TNF- α [35] in OSCC saliva compared to OL and normal controls. Salivary MCP-1, IP-10, HCC-1, and PF-4 expressions in OL patients have been characterized and compared to the ones in OSCC, primarily in this study. The significant increase marked by HCC-1 and PF-4 in OSCC, compared to OL, being detectable from the early onset of this malignancy brings new insights into the identification of prognostic, liquid biopsy-derived candidate biomarkers for oral cancer.
The discriminatory efficacy of the studied markers to discern OSCC from OL and individuals without oral lesions (controls) we assessed by the means of ROC curve analysis. According to our data, IL-6, TNF-α, and PF-4 demonstrated the highest potential in discrimination of OSCC from OL patients, while IL-6, TNF-a, IL-8, and HCC-1 appeared effective in classifying OSCC and controls. Superior sensitivity of IL-6 and IL-8 in oral cancer detection has also been evaluated in two large-scale studies [7] and [34], respectively. Furthermore, a combined biomarker panel demonstrated improved sensitivity and specificity for distinguishing between patients and controls. This foundation suggests that a multi-marker signature can yield satisfactory accuracy for the detection of OSCC.
The conducted correlation analysis revealed no association between altered cytokine responsiveness and OL or OSCC patient demographics and clinical features such as sex, smoking habits, lesion location, and clinical form. We assume that the sample cohorts were not large enough to confirm the statistical significance of potential relationships. However, an association was established between advanced OSCC and increased IL-6 and TNF-α levels. Their gradual, significant growth put forward involvement in accelerating disease progression, consistent with the findings of Jablonska et al. [55]. We also found a relationship between increased IL-6 concentration and the presence of neck metastases in oral cancer patients, which is in line with studies by Riedel et al. [56] and Tartour et al. [57] revealing a significant association between positive lymph nodes in HNSCC and elevated serum IL-6 levels.
NF-κB-dependent cytokines are molecular messengers highly involved in inflammation, angiogenesis, and proliferation [7,16,29], the altered expression of which have also been reported in non-malignant oral pathologies [15,29]. Abundant expression of cytokines and chemokines has been detected in the course of periodontitis [58,59]. To avoid any potential interference, our cohorts of volunteer donors had been pre-screened to eliminate those with any local acute or chronic inflammation (including periodontal disease) in the oral cavity upon direct clinical visual exploration. With regards to cancer risk, cytokines are of particular interest as they are involved in periodontal pathogenesis but also expressed in healthy sites [60]. Nevertheless, considering that local inflammatory conditions may result in cytokine overexpression, investigators have found the contribution of OSCC to the elevation of these modulators to outweigh any potential background conferred by the host’s inflammatory condition [59,60].
5. Conclusions
Our comparative profiling analysis suggests that saliva-derived IL-6, IL-8, TNF-α, HCC-1, and PF-4 may discriminate between OSCC, OL patients, and healthy controls. These non-invasive biomarkers may serve a useful role in early disease detection, as well as for screening of patients at risk of developing oral cancer. The considerable growth of TNF-α and IL-6 concentrations towards OSCC evolution, and IL-6 being distinctive in the presence of neck metastasis suggests their potential involvement in disease progression and severity. Putative biomarkers used in combination may enhance their accuracy, so a multi-marker signature for prognosis and diagnosis needs to be elaborated to yield satisfactory precision.
Author Contributions
Conceptualization, J.B., and V.D.; methodology, V.D.; validation, J.B., and E.J.-L.; data analysis, V.D., E.J.-L.; investigation, J.B., and V.D.; resources, J.B.; writing—original draft preparation, V.D.; writing—review and editing, J.B. and E.J.-L.; supervision, J.B.; All authors have read and agreed to the published version of the manuscript.
Funding
This project has received funding from the European Union’s Horizon 2020 Research and Innovation program under the MSC Grant Agreement № 721906. Principal investigator (PI): Jose Bagan.
Institutional Review Board Statement
The study was conducted according to the guidelines of the Declaration of Helsinki and approved by the Ethics Committee of the University General Hospital of Valencia (HGUV) with approval № H1480794580696 from 12 December 2016.
Informed Consent Statement
Written informed consent was obtained from all subjects involved in the study.
Data Availability Statement
Not applicable.
Conflicts of Interest
The authors declare no conflict of interest.
References
- Bray, F.; Ferlay, J.; Soerjomataram, I.; Siegel, R.L.; Torre, L.A.; Jemal, A. Global cancer statistics 2018: GLOBOCAN estimates of incidence and mortality worldwide for 36 cancers in 185 countries. CA Cancer J. Clin. 2018. [Google Scholar] [CrossRef]
- Majchrzak, E.; Szybiak, B.; Wegner, A.; Pienkowski, P.; Pazdrowski, J.; Luczewski, L.; Sowka, M.; Golusinski, P.; Malicki, J.; Golusinski, W. Oral cavity and oropharyngeal squamous cell carcinoma in young adults: A review of the literature. Radiol. Oncol. 2014, 48, 1–10. [Google Scholar] [CrossRef]
- Amagasa, T.; Yamashiro, M.; Ishikawa, H. Oral Leukoplakia Related to Malignant Transformation. Oral Sci. Int. 2006, 3, 45–55. [Google Scholar] [CrossRef]
- Silverman, S.; Gorsky, M.; Lozada, F. Oral leukoplakia and malignant transformation. A follow-up study of 257 patients. Cancer 1984. [Google Scholar] [CrossRef]
- Bagan, J.V.; Jiménez-Soriano, Y.; Diaz-Fernandez, J.M.; Murillo-Cortés, J.; Sanchis-Bielsa, J.M.; Poveda-Roda, R.; Bagan, L. Malignant transformation of proliferative verrucous leukoplakia to oral squamous cell carcinoma: A series of 55 cases. Oral Oncol. 2011, 47, 732–735. [Google Scholar] [CrossRef]
- Bagan, J.; Murillo-Cortes, J.; Poveda-Roda, R.; Leopoldo-Rodado, M.; Bagan, L. Second primary tumors in proliferative verrucous leukoplakia: A series of 33 cases. Clin. Oral Investig. 2019. [Google Scholar] [CrossRef] [PubMed]
- Sahibzada, H.A.; Khurshid, Z.; Khan, R.S.; Naseem, M.; Siddique, K.M.; Mali, M.; Zafar, M.S. Salivary IL-8, IL-6 and TNF-α as Potential Diagnostic Biomarkers for Oral Cancer. Diagnostics 2017, 7, 21. [Google Scholar] [CrossRef] [PubMed]
- Korostoff, A.; Reder, L.; Masood, R.; Sinha, U.K. The role of salivary cytokine biomarkers in tongue cancer invasion and mortality. Oral Oncol. 2011. [Google Scholar] [CrossRef]
- Banyer, J.L.; Hamilton, N.H.R.; Ramshaw, I.A.; Ramsay, A.J. Cytokines in innate and adaptive immunity. Rev. Immunogenet. 2000, 2, 359–373. [Google Scholar] [PubMed]
- Esche, C.; Stellato, C.; Beck, L.A. Chemokines: Key players in innate and adaptive immunity. J. Investig. Dermatol. 2005. [Google Scholar] [CrossRef]
- Cavaillon, J.M. Pro- versus anti-inflammatory cytokines: Myth or reality. Cell. Mol. Biol. 2001, 47, 695–702. [Google Scholar] [PubMed]
- Ben-Baruch, A. Inflammation-associated immune suppression in cancer: The roles played by cytokines, chemokines and additional mediators. Semin. Cancer Biol. 2006. [Google Scholar] [CrossRef] [PubMed]
- Mukaida, N.; Sasaki, S.I.; Baba, T. Chemokines in cancer development and progression and their potential as targeting molecules for cancer treatment. Mediat. Inflamm. 2014. [Google Scholar] [CrossRef] [PubMed]
- Jager, A.; Sleijfer, S.; van der Rijt, C.C.D. The pathogenesis of cancer related fatigue: Could increased activity of pro-inflammatory cytokines be the common denominator? Eur. J. Cancer 2008. [Google Scholar] [CrossRef]
- Rhodus, N.L.; Ho, V.; Miller, C.S.; Myers, S.; Ondrey, F. NF-κB dependent cytokine levels in saliva of patients with oral preneoplastic lesions and oral squamous cell carcinoma. Cancer Detect. Prev. 2005. [Google Scholar] [CrossRef] [PubMed]
- Chen, Z.; Malhotra, P.S.; Thomas, G.R.; Ondrey, F.G.; Duffey, D.C.; Smith, C.W.; Enamorado, I.; Yeh, N.T.; Kroog, G.S.; Rudy, S.; et al. Expression of proinflammatory and proangiogenic cytokines in patients with head and neck cancer. Clin. Cancer Res. 1999, 5, 1369–1379. [Google Scholar] [PubMed]
- Aziz, S.; Ahmed, S.S.; Ali, A.; Khan, F.A.; Zulfiqar, G.; Iqbal, J.; Khan, A.A.; Shoaib, M. Salivary immunosuppressive cytokines IL-10 and IL-13 are significantly elevated in oral squamous cell carcinoma patients. Cancer Investig. 2015. [Google Scholar] [CrossRef]
- Khandavilli, S.D.; Ceallaigh, P.Ó.; Lloyd, C.J.; Whitaker, R. Serum C-reactive protein as a prognostic indicator in patients with oral squamous cell carcinoma. Oral Oncol. 2009. [Google Scholar] [CrossRef]
- Czerninski, R.; Basile, J.R.; Kartin-Gabay, T.; Laviv, A.; Barak, V. Cytokines and tumor markers in potentially malignant disorders and oral squamous cell carcinoma: A pilot study. Oral Dis. 2014. [Google Scholar] [CrossRef]
- Yoshizawa, J.M.; Schafer, C.A.; Schafer, J.J.; Farrell, J.J.; Paster, B.J.; Wong, D.T.W. Salivary biomarkers: Toward future clinical and diagnostic utilities. Clin. Microbiol. Rev. 2013. [Google Scholar] [CrossRef]
- Bienvenu, J.; Monneret, G.; Fabien, N.; Revillard, J.P. The clinical usefulness of the measurement of cytokines. Clin. Chem. Lab. Med. 2000. [Google Scholar] [CrossRef]
- Brierley, J.D.; Gospodarowicz, M.K.; Wittekind, C. TNM Classification of Malignant Tumors, 8th ed.; Wiley: Hoboken, NJ, USA, 2017. [Google Scholar]
- Van der Waal, I. Potentially malignant disorders of the oral and oropharyngeal mucosa; terminology, classification and present concepts of management. Oral Oncol. 2009. [Google Scholar] [CrossRef]
- Van der Waal, I. Oral leukoplakia: A diagnostic challenge for clinicians and pathologists. Oral Dis. 2018. [Google Scholar] [CrossRef]
- Navazesh, M. Methods for Collecting Saliva. Ann. N. Y. Acad. Sci. 1993. [Google Scholar] [CrossRef] [PubMed]
- DeLong, E.R.; DeLong, D.M.; Clarke-Pearson, D.L. Comparing the Areas under Two or More Correlated Receiver Operating Characteristic Curves: A Nonparametric Approach. Biometrics 1988. [Google Scholar] [CrossRef]
- Youden, W.J. Index for rating diagnostic tests. Cancer 1950. [Google Scholar] [CrossRef]
- Dikova, V.R.; Principe, S.; Bagan, J.V. Salivary inflammatory proteins in patients with oral potentially malignant disorders. J. Clin. Exp. Dent. 2019. [Google Scholar] [CrossRef]
- Babiuch, K.; Kuśnierz-Cabala, B.; Kęsek, B.; Okoń, K.; Darczuk, D.; Chomyszyn-Gajewska, M. Evaluation of Proinflammatory, NF-kappaB Dependent Cytokines: IL-1α, IL-6, IL-8, and TNF-α in Tissue Specimens and Saliva of Patients with Oral Squamous Cell Carcinoma and Oral Potentially Malignant Disorders. J. Clin. Med. 2020, 867. [Google Scholar] [CrossRef]
- Osman, T.A.; Costea, D.E.; Johannessen, A.C. The use of salivary cytokines as a screening tool for oral squamous cell carcinoma: A review of the literature. J. Oral Maxillofac. Pathol. 2012. [Google Scholar] [CrossRef]
- St. John, M.A.R.; Li, Y.; Zhou, X.; Denny, P.; Ho, C.-M.; Montemagno, C.; Shi, W.; Qi, F.; Wu, B.; Sinha, U.; et al. Interleukin 6 and interleukin 8 as potential biomarkers for oral cavity and oropharyngeal squamous cell carcinoma. Arch. Otolaryngol. Head Neck Surg. 2004. [Google Scholar] [CrossRef]
- Sahebjamee, M.; Eslami, M.; Atarbashimoghadam, F.; Sarafnejad, A. Salivary concentration of TNFα, IL1α, IL6, and IL8 in oral squamous cell carcinoma. Med. Oral Patol. Oral Cir. Bucal 2008, 13, E292–E295. [Google Scholar]
- Lee, L.T.; Wong, Y.K.; Hsiao, H.Y.; Wang, Y.W.; Chan, M.Y.; Chang, K.W. Evaluation of saliva and plasma cytokine biomarkers in patients with oral squamous cell carcinoma. Int. J. Oral Maxillofac. Surg. 2018. [Google Scholar] [CrossRef] [PubMed]
- Dineshkumar, T.; Ashwini, B.K.; Rameshkumar, A.; Rajashree, P.; Ramya, R.; Rajkumar, K. Salivary and serum interleukin-6 levels in oral premalignant disorders and squamous cell Carcinoma: Diagnostic value and clinicopathologic correlations. Asian Pac. J. Cancer Prev. 2016. [Google Scholar] [CrossRef]
- Krishnan, R.; Thayalan, D.K.; Padmanaban, R.; Ramadas, R.; Annasamy, R.K.; Anandan, N. Association of serum and salivary tumor necrosis factor-α with histological grading in oral cancer and its role in differentiating premalignant and malignant oral disease. Asian Pac. J. Cancer Prev. 2014. [Google Scholar] [CrossRef] [PubMed]
- Prasad, G.; McCullough, M. Chemokines and cytokines as salivary biomarkers for the early diagnosis of oral Cancer. Int. J. Dent. 2013. [Google Scholar] [CrossRef] [PubMed]
- Lawrence, T. The nuclear factor NF-kappaB pathway in inflammation. Cold Spring Harb. Perspect. Biol. 2009. [Google Scholar] [CrossRef]
- Yeudall, W.A.; Miyazaki, H. Chemokines and squamous cancer of the head and neck: Targets for therapeutic intervention? Expert Rev. Anticancer Ther. 2007. [Google Scholar] [CrossRef]
- Michiels, K.; Schutyser, E.; Conings, R.; Lenaerts, J.-P.; Put, W.; Nuyts, S.; Delaere, P.; Jacobs, R.; Struyf, S.; Proost, P.; et al. Carcinoma cell-derived chemokines and their presence in oral fluid. Eur. J. Oral Sci. 2009. [Google Scholar] [CrossRef]
- Tsou, C.L.; Peters, W.; Si, Y.; Slaymaker, S.; Aslanian, A.M.; Weisberg, S.P.; Mack, M.; Charo, I.F. Critical roles for CCR2 and MCP-3 in monocyte mobilization from bone marrow and recruitment to inflammatory sites. J. Clin. Investig. 2007. [Google Scholar] [CrossRef]
- Ferreira, F.O.; Ribeiro, F.L.L.; Batista, A.C.; Leles, C.R.; Alencar, R.d.G.; Silva, T.A. Association of CCL2 with lymph node metastasis and macrophage infiltration in oral cavity and lip squamous cell carcinoma. Tumor Biol. 2008. [Google Scholar] [CrossRef]
- Ohta, M.; Kitadai, Y.; Tanaka, S.; Yoshihara, M.; Yasui, W.; Mukaida, N.; Haruma, K.; Chayama, K. Monocyte chemoattractant protein-1 expression correlates with macrophage infiltration and tumor vascularity in human esophageal squamous cell carcinomas. Int. J. Cancer 2002. [Google Scholar] [CrossRef]
- Cai, Y.; Ling, Y.; Huang, L.; Huang, H.; Chen, X.; Xiao, Y.; Zhu, Z.; Chen, J. C-C motif chemokine 14 as a novel potential biomarker for predicting the prognosis of epithelial ovarian cancer. Oncol. Lett. 2020. [Google Scholar] [CrossRef]
- Feng, L.; Houck, J.R.; Lohavanichbutr, P.; Chen, C. Transcriptome analysis reveals differentially expressed lncRNAs between oral squamous cell carcinoma and healthy oral mucosa. Oncotarget 2017. [Google Scholar] [CrossRef]
- Westrich, J.A.; Vermeer, D.W.; Colbert, P.L.; Spanos, W.C.; Pyeon, D. The multifarious roles of the chemokine CXCL14 in cancer progression and immune responses. Mol. Carcinog. 2020. [Google Scholar] [CrossRef]
- Hata, R.-I. A New Strategy to Find Targets for Anticancer Therapy: Chemokine CXCL14/BRAK Is a Multifunctional Tumor Suppressor for Head and Neck Squamous Cell Carcinoma. ISRN Otolaryngol. 2012. [Google Scholar] [CrossRef] [PubMed]
- Ozawa, S.; Kato, Y.; Komori, R.; Maehata, Y.; Kubota, E.; Hata, R.I. BRAK/CXCL14 expression suppresses tumor growth in vivo in human oral carcinoma cells. Biochem. Biophys. Res. Commun. 2006. [Google Scholar] [CrossRef]
- Kaskas, N.M.; Moore-Medlin, T.; McClure, G.B.; Ekshyyan, O.; Vanchiere, J.A.; Nathan, C.A.O. Serum biomarkers in head and neck squamous cell cancer. Jama Otolaryngol. Head Neck Surg. 2014. [Google Scholar] [CrossRef] [PubMed]
- Chang, K.P.; Chang, Y.-T.; Wu, C.-C.; Liu, Y.-L.; Chen, M.-C.; Tsang, N.-M.; Hsu, C.-L.; Chang, Y.-S.; Yu, J.-S. Multiplexed immunobead-based profiling of cytokine markers for detection of nasopharyngeal carcinoma and prognosis of patient survival. Head Neck 2011. [Google Scholar] [CrossRef] [PubMed]
- Rentoft, M.; Coates, P.J.; Loljung, L.; Wilms, T.; Laurell, G.; Nylander, K. Expression of CXCL10 is associated with response to radiotherapy and overall survival in squamous cell carcinoma of the tongue. Tumor Biol. 2014. [Google Scholar] [CrossRef] [PubMed]
- Bandyopadhyay, A.; Behura, S.S.; Nishat, R.; Dash, K.C.; Bhuyan, L.; Ramachandra, S. Clinicopathological profile and malignant transformation in oral lichen planus: A retrospective study. J. Int. Soc. Prev. Community Dent. 2017. [Google Scholar] [CrossRef]
- Wang, Y.Y.; Tail, Y.-H.; Wang, W.-C.; Chen, C.-Y.; Kao, Y.-H.; Chen, Y.-K.; Chen, C.-H. Malignant transformation in 5071 southern Taiwanese patients with potentially malignant oral mucosal disorders. BMC Oral Health 2014. [Google Scholar] [CrossRef] [PubMed]
- Punyani, S.R.; Sathawane, R.S. Salivary level of interleukin-8 in oral precancer and oral squamous cell carcinoma. Clin. Oral Investig. 2013. [Google Scholar] [CrossRef]
- Rajkumar, K.; Nandhini, G.; Ramya, R.; Rajashree, P.; Kumar, A.R.; Anandan, S.N. Validation of the diagnostic utility of salivary interleukin 8 in the differentiation of potentially malignant oral lesions and oral squamous cell carcinoma in a region with high endemicity. Oral Surg. Oral Med. Oral Pathol. Oral Radiol. 2014. [Google Scholar] [CrossRef] [PubMed]
- Jablonska, E.; Piotrowski, L.; Grabowska, Z. Serum Levels of IL-lβ, IL-6, TNF-α, sTNF-RI and CRP in Patients with oral cavity cancer. Pathol. Oncol. Res. 1997. [Google Scholar] [CrossRef] [PubMed]
- Riedel, F.; Zaiss, I.; Herzog, D.; Götte, K.; Naim, R.; Hörmann, K. Serum levels of interleukin-6 in patients with primary head and neck squamous cell carcinoma. Anticancer Res. 2005, 25, 2761–2765. [Google Scholar] [PubMed]
- Tartour, E.; Deneux, L.; Mosseri, V.; Jaulerry, C.; Brunin, F.; Point, D.; Validire, P.; DuBray, B.; Fridman, W.H.; Rodriguez, J. Soluble interleukin-2 receptor serum level as a predictor of locoregional control and survival for patients with head and neck carcinoma: Results of a multivariate prospective study. Cancer 1997. [Google Scholar] [CrossRef]
- Sahingur, S.E.; Yeudall, W.A. Chemokine function in periodontal disease and oral cavity cancer. Front. Immunol. 2015. [Google Scholar] [CrossRef]
- Irani, S.; Barati, I.; Badiei, M. Periodontitis Periodontitis and oral cancer—Current concepts of the etiopathogenesis. Oncol. Rev. 2020. [Google Scholar] [CrossRef]
- Okada, H.; Murakami, S. Cytokine expression in periodontal health and disease. Crit. Rev. Oral Biol. Med. 1998. [Google Scholar] [CrossRef]


Publisher’s Note: MDPI stays neutral with regard to jurisdictional claims in published maps and institutional affiliations. |
© 2021 by the authors. Licensee MDPI, Basel, Switzerland. This article is an open access article distributed under the terms and conditions of the Creative Commons Attribution (CC BY) license (https://creativecommons.org/licenses/by/4.0/).