Abstract
High-grade Gastroenteropancreatic Neuroendocrine neoplasms (H-NENs) comprehend well-differentiated tumors (NET G3) and poorly differentiated carcinomas (NEC) with proliferative activity indexes as mitotic count (MC) >20 mitoses/10 HPF and Ki-67 >20%. At present, no specific therapy for H-NENs exists and the several evidences of microenvironment involvement in their pathogenesis pave the way for tailored therapies. Forty-five consecutive cases, with available information about T-cell, immune, and non-immune markers, from surgical pathology and clinical databases of 2 Italian institutions were immunostained for Arginase, CD33, CD163 and CD66 myeloid markers. The association between features was assessed by Spearman’s correlation coefficient. A unsupervised K-means algorithm was used to identify clusters of patients according to inputs of microenvironment features and the relationship between clusters and clinicopathological features, including cancer-specific survival (CSS), was analyzed. The H-NEN population was composed of 6 (13.3%) NET G3 and 39 (86.7%) NEC. Overall, significant positive associations were found between myeloid (CD33, CD163 and Arginase) and T/immune markers (CD3, CD4, CD8, PD-1 and HLA-I). Myeloid and T-cell markers CD3 and CD8 identified two clusters of patients from unsupervised K-means analysis. Cases grouped in cluster 1 with more myeloid infiltrates, T cell, HLA and expression of inhibitory receptors and ligands in the stroma (PD-1, PD-L1) had significantly better CSS than patients in cluster 2. Multivariable analysis showed that Ki-67 (>55 vs. <55, HR 8.60, CI 95% 2.61–28.33, p < 0.0001) and cluster (1 vs. 2, HR 0.43, CI 95% 0.20–0.93, p = 0.03) were significantly associated with survival. High grade gastroenteropancreatic neuroendocrine neoplasms can be further classified into two prognostic sub-populations of tumors driven by different tumor microenvironments and immune features able to generate the framework for evaluating new therapeutic strategies.
1. Introduction
According to World Health Organization (WHO) 2019, High-Grade Gastroenteropancreatic neuroendocrine neoplasms (H-NENs) comprehend tumors with a Ki-67 index >20% distinguished in NET-G3, when Well-Differentiated (WD), or NEC-G3, when Poorly-Differentiated (PD) [1]. Among these, NEC-G3s are characterized by the worst prognosis [2]. Accurate diagnosis of these diseases is critical for correct prognosis and clinical management. High-grade G3 NET and NEC need a complex therapeutic approach due to a lack of clinical data and low response to treatments; to date, there are no consensus guidelines for the management of these rare and aggressive neoplasms [3,4,5]. Moreover, NECs are often diagnosed at a later stage and treated with platinum-etoposide chemotherapy with fractional efficacy [6,7,8]. To the best of our knowledge, no reliable prognostic marker, able to predict clinical outcome, has been definitively validated to date. Therefore, clinical management of these neoplasms is still controversial.
The tumor microenvironment (TME) is a dynamic compartment that develops during cancer evolution, constituted by tumor, immune, stromal and inflammatory cells, cancer-associated fibroblasts (CAFs), vasculature and extracellular matrix (ECM) [9,10]. TME has been on the spotlight of cancer research in recent years for its pivotal role in tumorigenesis and cancer progression as well as in regulating the efficacy of the therapeutic response in neuroendocrine neoplasms [11,12,13,14]. In our recent work, we demonstrated that microenvironment-related immune and inflammatory markers can improve prognostic prediction in GEP-NENs, when combined with the established Ki-67 and morphology parameters [15]. The aim of this study is to further evaluate the tumor microenvironment of high-grade neuroendocrine neoplasms, by expanding the immune profiling to myeloid markers Arginase, CD33, CD163 and CD66.
2. Materials and Methods
2.1. Cases
Forty-five consecutive patients among the prospectively maintained clinical databases of 2 Italian institutions (Fondazione IRCCS Istituto Nazionale dei Tumori and Humanitas Research Hospital Rozzano) were retrospectively selected. Formalin-fixed and paraffin-embedded (FFPE) specimens collected by these patients were reviewed according to the rules described in the following paragraph. In order to correlate and investigate myeloid markers with the content of tumor microenvironment, we used data regarding T-cell (CD3, CD4, CD8), immune (PD-1, PD-L1, HLA-I, HLA-DR) and non-immune markers (COX-2, pS6, β-catenin, NGFR, α-SMA, CD31) of our previous work [15].
The study was performed according to the clinical standards of the 1975 and 1983 Declaration of Helsinki and was approved by the Ethics Committee of Fondazione IRCCS INT (No. INT 21/16, 28 January 2016).
2.2. Immunohistochemistry
Arginase, CD33, CD163 and CD66 were investigated by IHC methods. Briefly, sections 2.5/3 micron-thick were deparaffinized and rehydrated. The antigen unmasking technique was carried out using Novocastra Epitope Retrieval Solutions, pH 6 EDTA-based (Leica Biosystems, Wetzlar, Germany) in a thermostatic bath at 98° for 30 min. Sections were then brought to room temperature and washed in PBS. After neutralization of the endogenous peroxidase with 3% v/v, H2O2 and Fc blocking by a specific protein block (Novocastra, Leica Biosystems), the samples were incubated with primary antibodies listed in Supplementary Table S1. Staining was revealed using a Novolink Polymer Detection System (Novocastra) and AEC (3-Amino-9-ethylcarbazole) as a substrate-chromogen, following the manufacturer’s instructions. Slides were counterstained with Harris Hematoxylin (Novocastra, Leica Biosystems). Slides were analyzed under the Axio Scope A1 optical microscope (Zeiss Oberkochen, Germany) and microphotographs were collected through the Axiocam 503 color digital camera (Zeiss) using the Zen2 software (Supplementary Figure S1).
IHC was assessed first by two expert pathologists, one in a neuroendocrine (M.M.) and one in a microenvironment (C.T.) field. As previously described, to minimize the variability of the evaluation, IHC was evaluated with a semi-quantitative approach, by adopting a scoring system that takes into account both the intensity and extent of the staining marker (% of positive cells) [15,16]. Briefly, the intensity (I) was ranked as low (1+; fainter than internal controls), normal (2+; as faint as controls), or strong (3+; more intense than controls). The expression (E) was defined as follows: up to 25% cells, 1+; 26–50%, 2+; 51–75%, 3+; 76–100%, 4+. I and E were combined into a single score (S), calculated as I × E, ranging from 0 to 12. Specimens were directly included only in the case of full consensus by both aforementioned expert pathologists; furthermore, in cases in which consensus was not reached, a majority decision was adopted during panel consensus meetings composed of five additional pathologists (A.P.; B.B.; L.C.; P.S.; T.B.). The evaluation of myeloid markers was carried out specifically in the stromal cells and median cut-offs were used for survival analysis.
2.3. Statistical Analysis
The association between all the investigated features was assessed by Spearman’s correlation coefficient. Unsupervised K-means algorithm [17] was used to identify clusters of patients according to inputs of microenvironment stromal features. Briefly, the algorithm works first by randomly assigning centroids and then by calculating the distance of each data point to its nearest centroid using the Euclidean distance. Subsequently, it finds the new value of centroids by calculating the mean distance of all points belonging to the centroid. Each data point is grouped into a cluster with the minimum distance to the centroid of the cluster and maximum inter-cluster distance by an iterative process. The data were also subjected to principal component analysis (PCA) and a biplot was produced to investigate the relationships between two principal components and microenvironment features.
The association between morphological and immunophenotypical features and clusters was assessed using Fisher’s exact test for categorical variables and Wilcoxon’s rank sum test for continuous variables. Cancer-specific survival (CSS) was assessed from the time of the diagnosis to the time of disease-related death or last follow-up, whichever occurred first. CSS curves were drawn using the Kaplan–Meier method. The log-rank test was used to assess the survival difference between the patient groups. Cox proportional regression analysis was used to assess the association between morphological and immunophenotypical features and survival. Hazard ratios (HRs) are presented with respective 95% confidence interval (CI). Data analysis were performed using the R environment for statistical computing and graphics (R Foundation, Vienna, Austria-Version 3.6.2). All tests were two-sided and p-values <0.05 were considered statistically significant.
3. Results
3.1. Patient Characteristics and Myeloid Profile
Table 1 summarizes the clinico-pathological features of the 45 patients included in the study. Overall, the cohort comprised 28 (62.2%) males and 17 (37.8%) females with a median age of 61 years with a range 33–78. The most represented tumor site was the pancreas (n = 15, 33.3%), followed by rectum (n = 10, 22.2%), colon (n = 8, 17.8%), ileum (n= 7, 15.6%) and stomach (n = 5, 11.1%). A pathological review, using both morphology and Ki-67 55% cut-off, classified them in 6 (13.3%) NET G3, 8 (17.8%) NEC Ki-67 <55 and 31 (68.9%) NEC Ki-67 >55%.

Table 1.
Clinicopathological features of the 45 patients included in the study.
Myeloid markers CD33S, CD163S and ArginaseS expressions showed a significant positive association with T-cell markers (CD3S, CD4S, CD8S), PD-1S and HLA-IS (Figure 1). In particular, CD33S showed a strong positive association (p < 0.001) with T-cell CD3S (r = 0.48), CD4S (r = 0.63) and CD8S (r = 0.57) and PD-1S (r = 0.55) and mild (p-value from 0.05 to 0.02) with COX-2S (r = 0.31), HLA-IS (r = 0.33), HLA-DRS (r = 0.37) and PD-L1S (r = 0.33). Moreover, CD163S showed a strong positive association (p < 0.001) with CD4S (r = 0.53), while moderate associations (p-value from 0.05 to 0.002) were observed between CD163S and ArginaseS with CD3S (r = 0.35 and 0.30), CD8S (r = 0.38 and 0.35), PD-1S (r = 0.40 and 0.38) and HLA-IS (r = 0.30 and 0.32). Interestingly, we observed also a mild positive association between CD33S and CD163S with tumor PD-L1T (r = 0.34 and 0.33) and a negative association between CD66S with COX-2T (r = −0.40) expressed in neoplastic cells.
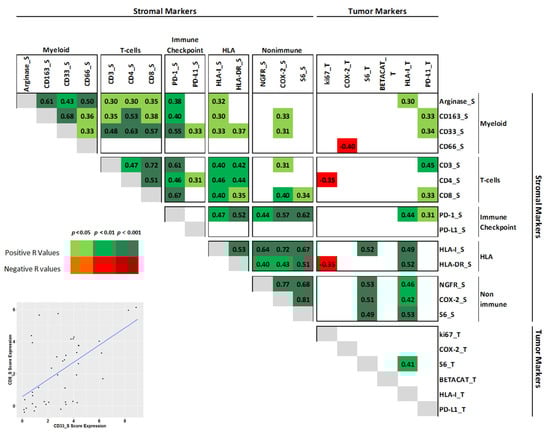
Figure 1.
Binary associations of all investigated markers by Spearman correlation analysis. Only significant r values (either positive or negative) are shown. Expression of each marker was evaluated in the tumor (superscript T) or in the stroma (superscript S). On the bottom left: a representative scatter plot of CD8S and CD33S marker expression.
3.2. Clustering
Myeloid markers (ArginaseS, CD33S and CD66S) and T-cell markers CD3S and CD8S identified two clusters of patients by unsupervised K-means analysis with different features in the tumor microenvironment (Figure 2). Specifically, cluster 1 showed both higher myeloid and T-cell markers compared to cluster 2. PCA showed that the first two components explain about 75.9% of overall variability. First principal component (PC1) explained 51.8% and was significantly correlated mainly with CD8S, CD33S and CD3S while the second (PC2) explained 24.1% and correlated mainly with ArginaseS and CD66S.
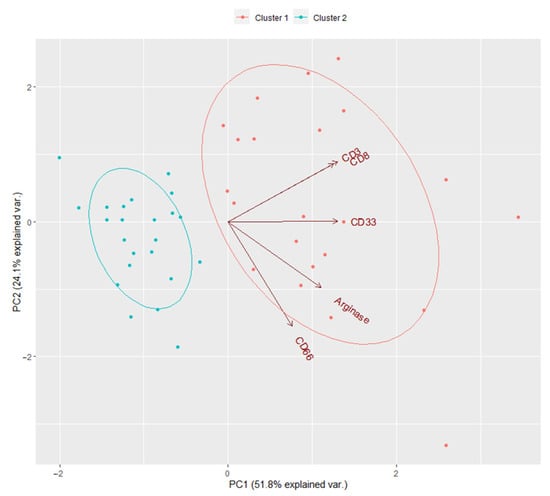
Figure 2.
The biplot of unsupervised K-means analysis for myeloid ArginaseS, CD33S and CD66S and T-cell CD3S and CD8S.
In-depth analysis of the two clusters revealed further specific differences in the expression of several markers (Figure 3, Supplementary Table S2). Cases grouped in cluster 1 included 5 (22. 7%) NET G3, 5 (22.7%) NEC Ki-67 <55 and 12 (54.6%) NEC Ki-67>55 while cluster 2 included 1 NET G3 (4.4%), 3 (13.0%) NEC Ki-67 <55 and 19 NEC Ki-67 >55 (82.6%). Overall, cases in cluster 1 showed more myeloid infiltrates, lymphoid T cell, HLA antigens and inhibitory receptors and ligands in the stroma compared to cluster 2 (Figure 3, Supplementary Table S2). Specifically, a significant increase in score estimated for myeloid ArginaseS (mean 5.95 (3–12) vs. 3.87 (0–9), p = 0.002), CD33S (mean 3.90 (1–9) vs. 1.57 (0–4), p < 0.0001) and CD163S (mean 5.64 (3–12) vs. 3.87 (2–6), p = 0.008) were observed in cluster 1. Moreover, CD66S showed an increase (mean 1.77 (0–6) vs. 0.96 (0–3) p = 0.11), but without statistical differences.
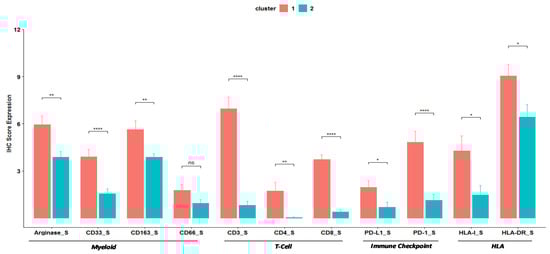
Figure 3.
Barplots of immunohistochemistry Score Expression of Myeloid, T-cells, Immune checkpoint and HLA markers. * indicates the level of significance.
A similar trend was observed in the estimated score for lymphoid T-cell, immune checkpoint and HLA markers: CD3S (6.95 (1–12) vs. 0.83 (0–4), p < 0.0001), CD4S (1.73 (0–9) vs. 0 (0–1), p = 0.001), CD8S (3.73 (1–6) vs. 0.39 (0–2), p < 0.0001), PD-L1S (1.95 (0–6) vs. 0.7 (0–6), p = 0.01), PD-1S (4.82 (0–9) vs. 1.13 (0–6), p = 0.0002), HLA-IS (4.27 (0–12) vs. 1.48 (0–9), p = 0.01) and HLA-DRS (9.05 (2–12) vs. 6.43 (0–12), p = 0.02) were enriched in cluster 1 compared to cluster 2. On the other hand, no significant changes were observed between clusters for non-immune markers in the stroma and tumor markers (Supplementary Table S2). Thus, for all significant differences, expression of the informative markers was higher in cluster 1 than in cluster 2.
3.3. Survival Analysis
In the overall cohort Median CSS (mCSS) was 10 months (95% CI 7–24) (Supplementary Figure S2). In particular, mCSS was 22 (95% CI 10–92) for cluster 1 and 7 (95% CI 5–16) for cluster 2. Kaplan–Meier analysis patients grouped in cluster 1 had significantly better survival than patients in cluster 2 (log-rank p = 0.003; Figure 4A). This suggests that the more pronounced immune infiltration observed in lesions from cluster 1 reflect an ongoing immune response that has prognostic significance. Furthermore, cases with Ki-67 <55% (both NET G3 and NEC), had a better survival compared to Ki-67 ≥55% (p = <0.0001; Figure 4B).
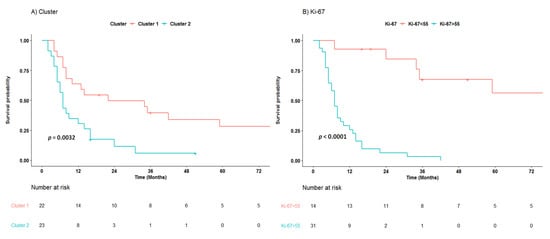
Figure 4.
Cancer-specific survival of patients with high-grade neuroendocrine neoplasms according cluster (A) and Ki-67 55% cut off (B).
Supplementary Table S3 shows results of Cox proportional regression analysis. After adjustment for tumor site, Ki-67 was strongly associated with survival (>55 vs. <55, HR 10.7, 95% CI 3.34–34.26, p < 0.001). However, interestingly, even distinct immune markers showed a prognostic significance. This included ArginaseS (4–12 vs. 0–3, HR 0.40, 95% CI 0.18–0.91, p = 0.03), CD3S (3–12 vs. 1–2, HR 0.31, 95% CI 0.15–0.64, p = 0.001), CD8S (2–12 vs. 0–1, HR 0.45, 95% CI 0.22–0.92, p = 0.03) and PD-1S (2–12 vs. 0–1, HR 0.33, 95% CI 0.15–0.71, p = 0.005). Patients in cluster 1 decreased significantly the Hazard Ratio (HR) by factor 0.30 (CI 95% 0.14–0.63, p = 0.001) compared to patients in cluster 2. Moreover, multivariable analysis showed that Ki-67 (>55 vs. <55, HR 8.60, CI 95% 2.61–28.33, p < 0.0001) and cluster (1 vs. 2, HR 0.43, CI 95% 0.20–0.93, p = 0.03) were significantly associated with survival.
4. Discussion
Patients affected by High-grade Neuroendocrine Neoplasms (H-NENs) represent an heterogeneous and poorly understood population. We demonstrated that TME markers were able to further identify among H-NENs two cohorts showing different clinical outcomes according to HLA-IT, lymphoid markers CD3S and CD8S and PD-L1S immunohistochemical expression. [15]. The current study further enriched H-NENs TME characterization through the assessment of myeloid markers Arginase, CD33, CD163 and CD66 expression. The present results showed that both myeloid and T cell markers share their expression in H-NENs. Furthermore, the aforementioned myeloid markers were capable to further describe H-NENs clinical outcome defining two well characterized H-NENs prognostic classes paving the way to propose the TME role as an independent clinical outcome predictor in H-NENs on the basis of the “hot/cold tumor” idea [18,19]. In detail, H-NENS rich in immune infiltrate should cover different immune subsets belonging to the innate (such as myeloid cells) and adaptive (such as T cells) arms of the immune system; on the contrary, cold tumors may be devoid of such an infiltrate [20].
Our results confirmed previous evidence showing that the microenvironment and immune interactions could be fundamental for a proper H-NENs prognostic and therapeutic overview. Robust T-cell infiltration was frequent in GEP-NENs and associated with improved recurrence-free and disease specific survival [12,21]. Hot immune microenvironment with abundant TILS was observed in pancreatic NECs compared to NETs although, in the latter, high intraepithelial PD-1 T cells and PD-L1 Type-II macrophages were observed according to the grade [22]. Moreover, PD-L1 was detected in 10% of H-NENs patients without correlation to progression-free survival or overall survival [23]. Present studies showed that cluster 1 is defined by a high expression of lymphoid T-cells, myeloid infiltrates, HLA antigens and expression of inhibitory receptors and ligands (both PD-1 and PD-L1) in the stroma. T-cell CD3S and CD8S, myeloid ArginaseS and PD-1S alone as well as clusters, were associated with survival. Cluster 1 included more NET G3 and NEC <55% than cluster 2. Interestingly, survival differences between the two clusters were also observed even by removing the NET G3 (log-rank p = 0.016, Supplementary Figure S3). We did not observe a prognostic role for PD-L1. Collectively, our data confirm that innate and adaptive immune cell infiltration has a fundamental role in H-NENs patients and that our cluster 1 could identify the so-called “hot lesions”: H-NENs characterized by a prevalent immune infiltrate cells. Therefore, patients in cluster 1 could potentially be responsive to immunotherapy treatment strategies while, on the contrary, patients in cluster 2, by displaying cold tumors, may less suitable for immunotherapy.
Immune–inflammatory cells represent one of the emerging hallmarks of cancer, due to their role in tumor development [24]. Among the cells of the immune system, the myeloid compartment has been at the center of attention for its role in cancer development; myeloid-derived suppressor cells (MDSCs) and M2 macrophages represent key players in the dynamic process of tumorigenesis [9]. The human MDSCs are characterized by the CD11b+CD33+HLA-DR- phenotype identifying cell populations with T-cell suppressive activity [25,26]. MDSCs have been associated with worse prognosis in various solid tumors, including gastroenteropancreatic neuroendocrine neoplasms, where MDSCs have been correlated with an advanced cancer stage and the presence of metastasis [27,28,29]. Controversially, recent evidence has shown that increased CD33+ myeloid cells were associated with better prognosis in triple negative breast cancer [30]. Moreover, work carried out by Kervarrec et al. on in Merkel Cell Carcinomas (MCC) has showed that CD33+ and CD163+ infiltrates were closely associated with CD8+ T-cell infiltrates and that MCC CD33+ CD8+ were correlated with improved outcome [31]. The authors showed that infiltrating CD33 cells expressed HLA-DR and, thus, they were not likely MDSC. Similarly, in our cohort myeloid markers showed a positive correlation with lymphoid T-cell markers CD3S and CD8S. Cluster 1 H-NENs showed the highest myeloid, HLA and lymphoid T-cell markers expression, suggesting that their role could be related to a higher cancer specific survival than patients with reduced expression. Co-expression of T cell and myeloid markers in cluster 1 tumors is in agreement with the heterogeneous immune contexture described to occur in three tumor immune subtypes defined as “would-healing”, “IFN-g dominant” and “inflammatory”(across several histologies) by Thorsson et al. [20] These evidences indicate that a “hot tumor” (a lesion where spontaneous development of immunity has occurred) is not necessarily characterized only/mainly by infiltration of potentially “anti-tumor” T cells and such tumors are also characterized by the strong presence of myeloid cells. Interestingly, clusters 1 also showed high levels of HLA-DRS, compared to cluster 2 (p = 0.02, Figure 3, Supplementary Table S2). Consequently, in high-grade neuroendocrine neoplasms, the expression of myeloid markers, associated with high levels of HLA-DRS, HLA-IS, PD-1S, PD-L1S and T-cells markers, most likely, could not have immunosuppressive effects as they identified a sub-group of patients with better survival.
We are aware that the present study could be limited by the pure IHC scoring system that, even if validated by expert pathologists (in emolymphopathology and neuroendocrine tumors), could be not able to fully describe the biological features of the interaction between microenvironment and NENs. The current clinical scenario could benefit from this excellent double tiers method with the appropriate further validations, but IHC as a gross screening tool for inquiring the microenvironment–tumor relationship could be proposed [15,32]. Furthermore, in order to deeply understand the aforesaid interaction, the precise antibody co-localization could have been better if evaluated first by digital pathology tools and then by molecular analysis. Moreover, the present results highlight that the H-NENs heterogeneity is driven also by the microenvironment role, paving the way to further distinguishing H-NENs in two clearly defined prognostic sub classes.
In conclusion, due to the aforementioned H-NENs, heterogeneity and dichotomy, microenvironment-related immune and inflammatory markers can provide helpful information to predict NEN clinical outcomes that could help to select the proper therapeutic approach and hopefully pave the way to novel ones.
Supplementary Materials
The following are available online at https://www.mdpi.com/article/10.3390/jcm10081741/s1, Table S1: Antibody sources and dilutions. Table S2: Clinicopathological, stromal and tumor markers in the two clusters. Table S3: Univariate and multivariable analysis (based on selected variables) of overall survival of patients with High-grade Neuroendocrine Neoplasms. Figure S1: IHC analyses for Arginase, CD163, CD33 and CD66 classified in low (score up to 3), moderate (score 4-8) and high (score 9-12) expression in representative neuroendocrine carcinoma cases. Figure S2: Cancer specific survival of patients with High-grade neuroendocrine neoplasms. Figure S3: Cancer specific survival of patients with poorly differentiated neuroendocrine neoplasms (NEC) according cluster
Author Contributions
Conceptualization, M.M. and C.T.; methodology, B.B., G.G., M.F.; software, G.C.; validation, G.C., V.L., A.A., C.T. and M.M.; formal analysis, G.C.; investigation, G.C., V.L., G.S., L.C., A.A., C.T., and M.M; resources, M.M.; data curation, G.C., B.B., L.C., A.P., A.A., C.T., and M.M.; writing—original draft preparation, G.C. and V.L.; writing—review and editing, A.A., C.T., A.P., V.C., A.M., M.S., L.C., G.S., A.S., P.S. T.B., S.P., N.P., and M.M.; visualization, G.C., A.M., and V.L.; supervision, A.S., A.A., C.T. and M.M; project administration, M.M.; funding acquisition, M.M. All authors have read and agreed to the published version of the manuscript.
Funding
This work was supported by Italian Ministry of Health (ERP-2017-23671129 “PMTR-pNET” Project to M.M.) and by 5 × 1000 Funds–2014 MIUR – grant “Integrative molecular analysis of lung large cell neuroendocrine carcinoma” (to M.M.). G.C. was supported by a FIRC-AIRC fellowship for Italy.
Institutional Review Board Statement
The study was conducted according to the guidelines of the Declaration of Helsinki, and approved by the Ethics Committee of Fondazione IRCCS INT (No. INT 21/16, 28 January 2016).
Informed Consent Statement
Informed consent was obtained from all subjects involved in the study according the Ethics Committee of Fondazione IRCCS INT (No. INT 21/16, 28 January 2016).
Acknowledgments
This work is dedicated to Laura Salvaterra, a courageous woman who battled against cancer and invites us to fight every day in her name, even after she was gone.
Conflicts of Interest
The authors declare no conflict of interest.
References
- Nagtegaal, I.D.; Odze, R.D.; Klimstra, D.; Paradis, V.; Rugge, M.; Schirmacher, P.; Washington, M.K.; Carneiro, F.; Cree, I.A.; The WHO Classification of Tumours Editorial Board. The 2019 WHO classification of tumours of the digestive system. Histopathology 2020, 76, 182–188. [Google Scholar] [CrossRef]
- Milione, M.; Maisonneuve, P.; Spada, F.; Pellegrinelli, A.; Spaggiari, P.; Albarello, L.; Pisa, E.; Barberis, M.; Vanoli, A.; Buzzoni, R.; et al. The clinicopathologic heterogeneity of grade 3 gastroenteropancreatic neuroendocrine neoplasms: Morphological differentiation and proliferation identify different prognostic categories. Neuroendocrinology 2017, 104, 85–93. [Google Scholar] [CrossRef]
- Kiesewetter, B.; Raderer, M. How I treat neuroendocrine tumours. ESMO Open 2020, 5, e000811. [Google Scholar] [CrossRef]
- Pellat, A.; Coriat, R. Well differentiated grade 3 neuroendocrine tumors of the digestive tract: A narrative review. J. Clin. Med. 2020, 9, 1677. [Google Scholar] [CrossRef]
- Liu, A.J.; Ueberroth, B.E.; McGarrah, P.W.; Petty, S.A.B.; Kendi, A.T.; Starr, J.; Hobday, T.J.; Halfdanarson, T.R.; Sonbol, M.B. treatment outcomes of well-differentiated high-grade neuroendocrine tumors. Oncologist 2021. [Google Scholar] [CrossRef]
- Fazio, N.; Spada, F.; Giovannini, M. Chemotherapy in gastroenteropancreatic (GEP) neuroendocrine carcinomas (NEC): A critical view. Cancer Treat. Rev. 2013, 39, 270–274. [Google Scholar] [CrossRef]
- Sorbye, H.; Baudin, E.; Borbath, I.; Caplin, M.; Chen, J.; Cwikla, J.B.; Frilling, A.; Grossman, A.; Kaltsas, G.; Scarpa, A.; et al. Unmet needs in high-grade gastroenteropancreatic neuroendocrine neoplasms (WHO G3). Neuroendocrinology 2018, 108, 54–62. [Google Scholar] [CrossRef] [PubMed]
- Garciacarbonero, R.; Sorbye, H.; Baudin, E.; Raymond, E.; Wiedenmann, B.; Niederle, B.; Sedlackova, E.; Toumpanakis, C.; Anlauf, M.; Cwikla, J.B.; et al. ENETS Consensus guidelines for high-grade gastroenteropancreatic neuroendocrine tumors and neuroendocrine carcinomas. Neuroendocrinology 2016, 103, 186–194. [Google Scholar] [CrossRef]
- Wang, M.; Zhao, J.; Zhang, L.; Wei, F.; Lian, Y.; Wu, Y.; Gong, Z.; Zhang, S.; Zhou, J.; Cao, K.; et al. Role of tumor microenvironment in tumorigenesis. J. Cancer 2017, 8, 761–773. [Google Scholar] [CrossRef] [PubMed]
- Klemm, F.; Joyce, J.A. Microenvironmental regulation of therapeutic response in cancer. Trends Cell Biol. 2015, 25, 198–213. [Google Scholar] [CrossRef] [PubMed]
- Cuny, T.; De Herder, W.; Barlier, A.; Hofland, L.J. Role of the tumor microenvironment in digestive neuroendocrine tumors. Endocr. Relat. Cancer 2018, 25, R519–R544. [Google Scholar] [CrossRef]
- Cai, L.; Michelakos, T.; Deshpande, V.; Arora, K.S.; Yamada, T.; Ting, D.T.; Taylor, M.S.; Castillo, C.F.-D.; Warshaw, A.L.; Lillemoe, K.D.; et al. Role of tumor associated macrophages in the clinical course of pancreatic neuroendocrine tumors (PanNETs). Clin. Cancer Res. 2019, 25, 2644–2655. [Google Scholar] [CrossRef]
- Zhang, W.-H.; Wang, W.-Q.; Gao, H.-L.; Yu, X.-J.; Liu, L. The tumor immune microenvironment in gastroenteropancreatic neuroendocrine neoplasms. Biochim. Biophys. Acta 2019, 1872, 188311. [Google Scholar] [CrossRef] [PubMed]
- Maggio, I.; Manuzzi, L.; Lamberti, G.; Ricci, A.D.; Tober, N.; Campana, D. Landscape and future perspectives of immunotherapy in neuroendocrine neoplasia. Cancers 2020, 12, 832. [Google Scholar] [CrossRef] [PubMed]
- Milione, M.; Miceli, R.; Barretta, F.; Pellegrinelli, A.; Spaggiari, P.; Tagliabue, G.; Centonze, G.; Paolino, C.; Mangogna, A.; Kankava, K.; et al. Microenvironment and tumor inflammatory features improve prognostic prediction in gastro-entero-pancreatic neuroendocrine neoplasms. J. Pathol. Clin. Res. 2019, 5, 217–226. [Google Scholar] [CrossRef] [PubMed]
- Milione, M.; Maisonneuve, P.; Pellegrinelli, A.; Pusceddu, S.; Centonze, G.; Dominoni, F.; Brambilla, C.; Rubino, M.; Faggiano, A.; Buzzoni, R.; et al. Loss of succinate dehydrogenase subunit B (SDHB) as a prognostic factor in advanced ileal well-differentiated neuroendocrine tumors. Endocrine 2016, 57, 512–517. [Google Scholar] [CrossRef]
- Hartigan, J.A.; Wong, M.A. Algorithm AS 136: A K-means clustering algorithm. J. R. Stat. Soc. Ser. C 1979, 28, 100. [Google Scholar] [CrossRef]
- Spranger, S.; Luke, J.J.; Bao, R.; Zha, Y.; Hernandez, K.M.; Li, Y.; Gajewski, A.P.; Andrade, J.; Gajewski, T.F. Density of immunogenic antigens does not explain the presence or absence of the T-cell–inflamed tumor microenvironment in melanoma. Proc. Natl. Acad. Sci. USA 2016, 113, E7759–E7768. [Google Scholar] [CrossRef]
- Spranger, S.; Gajewski, T.F. Impact of oncogenic pathways on evasion of antitumour immune responses. Nat. Rev. Cancer 2018, 18, 139–147. [Google Scholar] [CrossRef] [PubMed]
- Thorsson, V.; Gibbs, D.L.; Brown, S.; Wolf, D.; Bortone, D.S.; Ouyang, T.-H.; Porta-Pardo, E.; Gao, G.F.; Plaisier, C.L.; Eddy, J.A.; et al. The immune landscape of cancer. Immunity 2018, 48, 812–830.e14. [Google Scholar] [CrossRef] [PubMed]
- Katz, S.C.; Donkor, C.; Glasgow, K.; Pillarisetty, V.G.; Gönen, M.; Espat, N.J.; Klimstra, D.S.; D’Angelica, M.I.; Allen, P.J.; Jarnagin, W.; et al. T cell infiltrate and outcome following resection of intermediate-grade primary neuroendocrine tumours and liver metastases. HPB 2010, 12, 674–683. [Google Scholar] [CrossRef]
- Takahashi, D.; Kojima, M.; Suzuki, T.; Sugimoto, M.; Kobayashi, S.; Takahashi, S.; Konishi, M.; Gotohda, N.; Ikeda, M.; Nakatsura, T.; et al. Profiling the tumour immune microenvironment in pancreatic neuroendocrine neoplasms with multispectral imaging indicates distinct subpopulation characteristics concordant with WHO 2017 Classification. Sci. Rep. 2018, 8, 1–10. [Google Scholar] [CrossRef]
- Ali, A.S.; Langer, S.W.; Federspiel, B.; Hjortland, G.O.; Grønbæk, H.; Ladekarl, M.; Welin, S.; Vestermark, L.W.; Arola, J.; Osterlund, P.; et al. PD-L1 expression in gastroenteropancreatic neuroendocrine neoplasms grade 3. PLoS ONE 2020, 15, e0243900. [Google Scholar] [CrossRef] [PubMed]
- Hanahan, D.; Weinberg, R.A. Hallmarks of cancer: The next generation. Cell 2011, 144, 646–674. [Google Scholar] [CrossRef]
- Gabrilovich, D.I.; Nagaraj, S. Myeloid-derived suppressor cells as regulators of the immune system. Nat. Rev. Immunol. 2009, 9, 162–174. [Google Scholar] [CrossRef] [PubMed]
- Talmadge, J.E.; Gabrilovich, D.I. History of myeloid-derived suppressor cells. Nat. Rev. Cancer 2013, 13, 739–752. [Google Scholar] [CrossRef] [PubMed]
- Gabrilovich, D.I. Myeloid-derived suppressor cells. Cancer Immunol. Res. 2017, 5, 3–8. [Google Scholar] [CrossRef] [PubMed]
- Liu, M.; Zhang, Y.; Chen, L.; Lin, Y.; He, Q.; Zeng, Y.; Chen, M.; Chen, J. Myeloid-derived suppressor cells in gastroenteropancreatic neuroendocrine neoplasms. Endocrine 2021, 71, 242–252. [Google Scholar] [CrossRef]
- Zhang, S.; Ma, X.; Zhu, C.; Liu, L.; Wang, G.; Yuan, X. the role of myeloid-derived suppressor cells in patients with solid tumors: A meta-analysis. PLoS ONE 2016, 11, e0164514. [Google Scholar] [CrossRef]
- He, T.-F.; Yost, S.E.; Frankel, P.H.; Dagis, A.; Cao, Y.; Wang, R.; Rosario, A.; Tu, T.Y.; Solomon, S.; Schmolze, D.; et al. Multi-panel immunofluorescence analysis of tumor infiltrating lymphocytes in triple negative breast cancer: Evolution of tumor immune profiles and patient prognosis. PLoS ONE 2020, 15, e0229955. [Google Scholar] [CrossRef]
- Kervarrec, T.; Gaboriaud, P.; Berthon, P.; Zaragoza, J.; Schrama, D.; Houben, R.; Le Corre, Y.; Hainaut-Wierzbicka, E.; Aubin, F.; Bens, G.; et al. Merkel cell carcinomas infiltrated with CD33 + myeloid cells and CD8 + T cells are associated with improved outcome. J. Am. Acad. Dermatol. 2018, 78, 973–982.e8. [Google Scholar] [CrossRef] [PubMed]
- Milione, M.; Boeri, M.; Cantarutti, A.; Centonze, G.; Busico, A.; Suatoni, P.; Garzone, G.; Cattaneo, L.; Tamborini, E.; Perrone, F.; et al. Improved prognostic prediction in never-smoker lung cancer patients by integration of a systemic inflammation marker with tumor immune contexture analysis. Cancers 2020, 12, 1828. [Google Scholar] [CrossRef] [PubMed]


Publisher’s Note: MDPI stays neutral with regard to jurisdictional claims in published maps and institutional affiliations. |
© 2021 by the authors. Licensee MDPI, Basel, Switzerland. This article is an open access article distributed under the terms and conditions of the Creative Commons Attribution (CC BY) license (https://creativecommons.org/licenses/by/4.0/).