Abstract
This study aims to investigate the diagnostic ability of the contrast-enhanced 3D T1 black-blood fast spin-echo (T1 BB-FSE) sequence compared with the contrast-enhanced 3D T1-spoiled gradient-echo (CE-GRE) sequence in patients with facial neuritis. Forty-five patients with facial neuritis who underwent temporal bone MR imaging, including T1 BB-FSE and CE-GRE imaging, were examined. Two reviewers independently assessed the T1 BB-FSE and CE-GRE images in terms of diagnostic performance, and qualitative (diagnostic confidence and visual asymmetric enhancement) and quantitative analysis (contrast-enhancing lesion extent of the canalicular segment of the affected facial nerve (LEC) and the affected side-to-normal signal intensity ratio (rSI)). The AUCs of each reviewer, and the sensitivity and accuracy of T1 BB-FSE were significantly superior to those of CE-GRE (p < 0.05). Regarding diagnostic confidence and visual asymmetric enhancement, T1 BB-FSE tended to be rated greater than CE-GRE (p < 0.05). Additionally, in quantitative analysis, LEC and rSI of the canalicular segment on T1 BB-FSE were larger than those on CE-GRE (p < 0.05). The T1 BB-FSE sequence was significantly superior to the CE-GRE sequence, with more conspicuous lesion visualization in terms of both qualitative and quantitative aspects in patients with facial neuritis.
1. Introduction
Facial neuritis (Bell’s palsy) is the most common cause of unilateral peripheral facial nerve palsy [1]. Patients with facial neuritis usually present rapid unilateral facial nerve weakness/paralysis without a clear cause [2]. Although facial neuritis is considered idiopathic, the main hypothesized cause is herpes virus reactivation, supported by the detection of herpes virus DNA in the endoneural fluids of patients with facial neuritis [3,4]. Inflammation, myelin breakdown, and hemorrhage of the facial nerve, which are caused by viral infection in the narrow facial nerve canal of the temporal bone, lead to edema, compression, and ischemia [5,6,7]. This ischemia can result in degeneration and axonal destruction of the facial nerve [5,8,9].
Facial neuritis is diagnosed primarily on the basis of characteristic clinical symptoms, physical examination, magnetic resonance imaging (MRI), and electrodiagnostic testing [10,11]. Electrodiagnostic testing can also offer prognostic information about the outcomes in patients with facial neuritis [10,11].
However, electrodiagnostic testing has limitations in diagnosing the early stages of facial neuritis. For example, electroneurography cannot detect abnormalities for approximately 72 h until Wallerian degeneration from the intratemporal area reaches the extratemporal area, the distal portion of the stylomastoid foramen. Additionally, electromyography cannot detect signs of muscle degeneration due to facial nerve palsy within 10–14 days [10].
In contrast, MRI can provide significant diagnostic information on facial neuritis within one week of symptom onset, which is an important time for prognostic and recovery rate evaluation [11,12,13,14,15]. Therefore, in initial evaluations of facial neuritis, MRI can play important roles not only in the exclusion of other diseases but also in the establishment of a rapid diagnosis and the selection of an appropriate treatment.
There have been many studies focused on improving the diagnostic ability of facial neuritis using MRI over the decades. It has been revealed that the manifestation of facial neuritis on MRI is an abnormally intense enhancement in the distal intracanalicular segment and labyrinthine segment that does not appear in normal facial nerves [16,17,18]. Thus, a comparison with the symptom-free healthy side in contrast-enhanced MRI helps to distinguish it from intense enhancement of the affected side, which shows symptoms [19].
However, the facial nerve, similar to other cranial nerves, is surrounded by several layers of connective tissue represented by the endoneurium, perineurium, and epineurium and has a relatively abundant arteriovenous plexus in the connective tissue. Therefore, enhancement of the facial nerve may be normal due to pooling of the contrast agent in the blood vessels of the perineurium, but it can also be abnormal, such as when the contrast caused by destruction of the blood–nerve barrier is enhanced [20]. These findings mean that distinguishing a slight abnormal enhancement caused by disruption of the blood–peripheral nerve barrier from normal enhancement is likely to be a hindrance.
The recently developed 3D T1 black-blood fast spin-echo imaging method suppresses signals from blood flow and provides an improved contrast-to-noise ratio (CNR) compared with other sequences [21]. Consequently, some recent studies using contrast-enhanced 3D T1 black-blood fast spin-echo imaging (T1 BB-FSE) have reported improved small lesion detection rates of variable intra- and extracranial diseases [22,23,24,25,26,27,28]. However, to our best knowledge, no study has examined the diagnostic accuracy of the T1 BB-FSE sequence for facial neuritis.
Therefore, this study aimed to investigate whether the T1 BB-FSE sequence has better diagnostic ability than the contrast-enhanced 3D T1-spoiled gradient-echo with fat suppression (CE-GRE) sequence in patients clinically diagnosed with facial neuritis.
2. Materials and Method
This retrospective study was approved by the institutional review board of our institution, and the requirement for informed consent was waived.
2.1. Patients
Initially, we enrolled 63 consecutive patients with acute unilateral facial palsy who underwent temporal bone MRI within one month of symptom onset from 1 November 2019 to 31 December 2020. Of these, 13 patients were excluded for the following reasons: (1) brain stem (pons or medulla oblongata) infarction was detected in MRI (n = 5), (2) the patients were diagnosed with Ramsay-hunt syndrome (n = 5), (3) the patients had intracranial tumors on the symptomatic side (n = 1), (4) a patient showed erosion of the fallopian canal caused by cholesteatoma on temporal bone CT (n = 1), and (5) a patient was diagnosed with parotid gland adenocarcinoma by MRI and excisional biopsy (n = 1).
Of the remained 50 consecutive patients with acute facial neuritis, two were excluded because of severe dental prosthesis artifacts and one was excluded because he was younger than 18 years of age. Two patients were excluded because of the symptom onset occurring more than one month before MRI. Finally, 45 patients were included in our study. As facial neuritis is a diagnosis of exclusion, all 45 patients were finally diagnosed with unilateral facial neuritis by thorough medical history assessment; clinical examination, including otoscopy; meticulous cranial nerve assessment; and follow-up [2]. The clinical characteristics of the study population are summarized in Table 1.

Table 1.
Baseline characteristics of the study population a.
2.2. MRI Protocol
MR scans, which included the CE-GRE and T1 BB-FSE sequences, were conducted using one of two 3T scanners (Skyra or Verio; Siemens, Erlangen, Germany) with a 32-channel head coil. The CE-GRE sequence and T1 BB-FSE sequences were obtained after intravenous administration of gadobutrol (Gadovist; Bayer Schering Pharma, Berlin, Germany) at a dose of 0.1 mmol/kg of body weight. The scanning order was constant in this study, and T1 BB-FSE (time delay: 7 min) was scanned after CE-GRE (time delay: 2 min). MR imaging scans were performed in 21 and 24 patients using Skyra and Verio scanners, respectively. The detailed MRI parameters of each sequence are depicted in Table S1.
2.3. MR Image Analysis
Two neuroradiologists (reviewers) who were unaware of the patient’s clinical history, including the affected side and proportion of facial neuritis, independently evaluated the 65 temporal bone MR imaging data sets (45 of the patients with facial neuritis and 20 of the normal controls) to compare the diagnostic ability of both MR sequences. Before MRI analysis, we randomly sampled 10 cases (3 normal cases and 7 facial neuritis cases) for a training interpretation session. After the training session, the two reviewers individually interpreted the CE-GRE sequences first and then the T1 BB-FSE sequences in at least two-week intervals. Each patient in the two MRI data sets was randomly extracted and analyzed in different image analysis sessions. The following three-point rating scale was used to evaluate the diagnostic confidence based on asymmetric contrast enhancement of the facial nerve (canalicular and/or labyrinthine segment): 0, normal; 1, suspicious finding; and 2, definite finding. Furthermore, the following four-point rating scale was used to assess the visual degree of contrast enhancement of the three segments (canalicular, labyrinthine, and anterior genu) of the affected facial nerves (if any): 0, none; 1, faint; 2, moderate; and 3, intense. Regarding the anterior genu segment, we also evaluated the visual contrast enhancement degree of the contralateral anterior genu segment with no symptoms. The visual contrast enhancement degree of the affected side was subtracted from that of the normal side. The driven difference was defined as the asymmetric enhancement degree of the anterior genu segment.
2.4. Quantitative Analysis
First, the contrast-enhancing lesion extent (length and width) of the canalicular segment of the abnormal facial nerve (LEC) was measured using the ruler tool of PACS by one of two neuroradiologists. Second, the signal intensity (SI) was estimated using regions of interest (ROIs) at the three segments (canalicular, labyrinthine, and anterior genu) of the bilateral facial nerves by the same neuroradiologist. The same neuroradiologist measured the LEC and SI of each segment three times to increase the reliability of the quantitative values. These quantitative measurements were conducted on the 90 facial nerves of all 45 patients with facial neuritis. The derived mean value for quantitative analysis was used for statistical analysis. The mean value of SI was used to defined the relative signal intensity increase (rSI: affected side-to-normal signal intensity ratio) for the two MR sequences.
2.5. Statistical Analysis
We used receiver operating characteristic (ROC) curve analysis to assess the diagnostic performances of the two MR sequences in diagnosing facial neuritis. For each reviewer, we used DeLong’s test to compare the area under the curve (AUC) for the two MRI data sets. The diagnostic accuracy (sensitivity, specificity, and accuracy) of the two investigators was calculated using 2 × 2 tables and compared between each MR imaging sequence using McNemar’s test. The Wilcoxon signed-rank test was used to compare the diagnostic confidence and visual asymmetric enhancement between the two MR imaging sequences for the two reviewers. The interrater agreement was analyzed using the percentage of agreement and the intraclass correlation coefficient (ICC). We also evaluated the difference in the quantitative lesion extent and rSI between the two MR imaging sequences by using the Mann–Whitney test. The interrater agreement of qualitative measures and intra-rater agreement of the quantitative measures were evaluated by computing the intraclass correlation coefficient (ICC). All statistical analyses were performed using a statistical software program (Version 19.6.4 for Windows; MedCalc, Mariakerke, Belgium). A p value < 0.05 was accepted as statistically significant.
3. Results
3.1. Diagnostic Performance of the MR Imaging Sequences
The ROC curve analysis showed that the diagnostic accuracy of T1 BB-FSE was higher than that of CE-GRE for each reviewer. There was a statistically significant difference between the ROC curves of the two MR imaging sequences in DeLong’s test for each reviewer, and the p-values were 0.014 and 0.042. The sensitivity (97.2%) and accuracy (96.2%) of T1 BB-FSE were significantly higher than those (sensitivity, 87.8%; accuracy, 83.8%) of CE-GRE (sensitivity, p = 0.004; accuracy, p < 0.001). The specificity of T1 BB-FSE (92.5%) was higher than that of CE-GRE (75%) and approached statistical significance (p = 0.065). The diagnostic performance outcomes, including the ROC curves of the two reviewers, are provided in Figure 1 and Table 2.
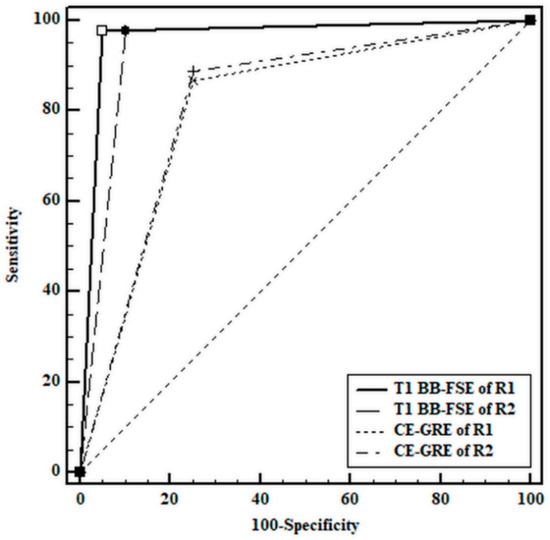
Figure 1.
Receiver operating characteristic curves for the diagnosis of facial neuritis. R1 = reviewer 1; R2 = reviewer 2.
Table 2.
Results of diagnostic accuracy of the two reviewers a.
3.2. Qualitative Analysis of the Facial Neuritis
Regarding the diagnostic confidence in the facial neuritis patient group, a higher proportion of definite findings and a lower proportion of suspicious findings were revealed with the T1 BB-FSE sequence than with the CE-GRE sequence (p < 0.001). Regarding the interrater agreement of diagnostic confidence, each MR sequence showed similar high degrees of agreement; CE-GRE showed an ICC value of 0.896 (95% CI: 0.835–0.935), and T1 BB-FSE showed an ICC value of 0.906 (95% CI: 0.851–0.942). Furthermore, visual asymmetric enhancement of the canalicular and labyrinthine segments was rated higher by each reviewer on T1-BB-FSE than on CE-GRE (p < 0.005). In contrast, no significant difference was observed between the two sequences of the anterior genu segment in visual asymmetric contrast enhancement analysis. The ICCs of visual asymmetric contrast enhancement of the three segments between the two reviewers for each MR sequence were similar, ranging from good to excellent (range: 0.64–0.78). Further detailed results of the qualitative analysis are shown in Table 3. Representative cases are shown in Figure 2, Figure 3, Figure 4 and Figure 5.
Table 3.
Results of the qualitative analysis a.
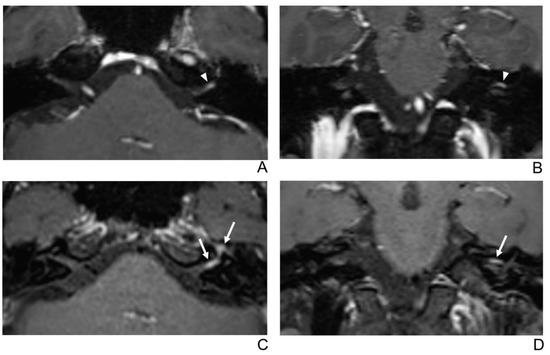
Figure 2.
A 39-year-old male patient with left facial neuritis. (A–D) Paired axial and coronal CE-GRE (A,B) and T1 BB-FSE (C,D) images of the same patient. The left distal canalicular segment of the facial nerve showed asymmetric, intense enhancement in the axial (A) and coronal (B) CE-GRE images (arrowheads). In contrast, the labyrinthine segment showed no definite enhancement, and the anterior genu segment showed moderate degree enhancement and was interpreted by reviewers 1 and 2 as left facial neuritis (2, diagnostic confidence; 3, 0, and 2, visual grades for contrast enhancement (CE) in the canalicular, labyrinthine, and anterior genu segments, respectively). The left facial nerve shows asymmetric intense enhancement in the canalicular, labyrinthine, and anterior genu segments in the axial (C) and coronal (D) T1 BB-FSE images (arrows); it was evaluated by reviewers 1 and 2 as left facial neuritis (2, diagnostic confidence; 3, 2, and 3, visual grades for CE in the canalicular, labyrinthine, and anterior genu segments, respectively). Compared to the CE-GRE images shown earlier, in the T1 BB-FSE image, it can be seen that the contrast-enhanced area in each segment of the facial nerve is longer and wider.
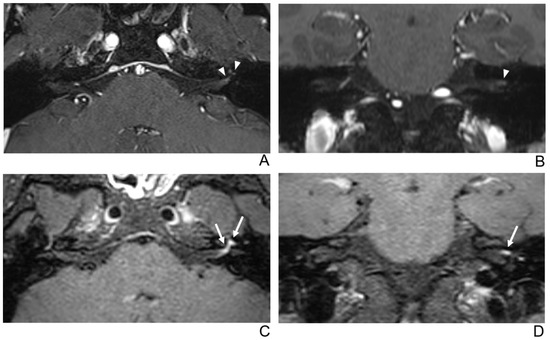
Figure 3.
A 29-year-old male patient with left facial neuritis. (A–D) Paired axial and coronal CE-GRE (A,B) and T1 BB-FSE (C,D) images of the same patient. The left distal canalicular segment of the facial nerve showed faint enhancement in the axial (A) and coronal (B) CE-GRE images (arrowheads). Those images were interpreted by reviewers 1 and 2 as suspicious left facial neuritis (1, diagnostic confidence; 1, 0, and 1, visual grades for contrast enhancement (CE) in the canalicular, labyrinthine, and anterior genu segments, respectively). In contrast, the left facial nerve shows asymmetric, intense enhancement in the canalicular, labyrinthine, and anterior genu segments in the axial (C) and coronal (D) T1 BB-FSE images (arrows); it was evaluated by reviewers 1 and 2 as left facial neuritis (2, diagnostic confidence; 3, visual grade for CE in all three segments).
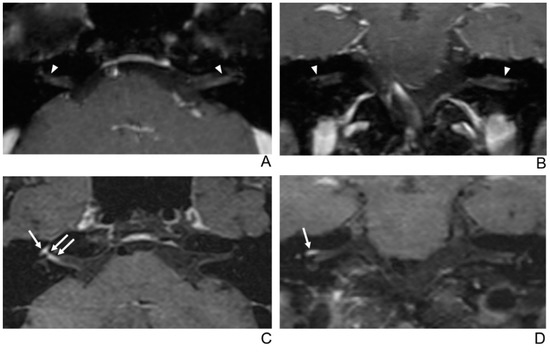
Figure 4.
A 56-year-old female patient with right facial neuritis. (A–D) Paired axial and coronal CE-GRE (A,B) and T1 BB-FSE (C,D) images of the same patient. In the axial (A) and coronal (B) CE-GRE images, no definite asymmetric enhancement was demonstrated in the bilateral facial nerves (arrowheads); thus, it was evaluated by reviewers 1 and 2 as normal facial nerves (false negative). In contrast, the right facial nerve shows asymmetric intense enhancement in the canalicular, labyrinthine, and anterior genu segments in the T1 BB-FSE axial (C) and coronal (D) images (arrows); thus, the two reviewers interpreted the enhancement as right facial neuritis (true positive; 2, diagnostic confidence; 3, 2, and 3, visual grades for CE in the canalicular, labyrinthine, and anterior genu segments, respectively).
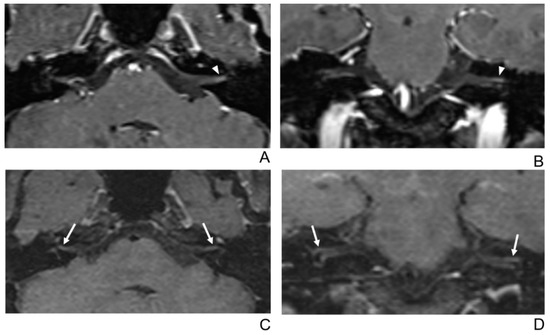
Figure 5.
A 68-year-old female without symptoms of facial palsy (normal control). (A–D) Paired axial and coronal CE-GRE (A,B) and T1 BB-FSE (C,D) images of bilateral facial nerves. The only distal canalicular segment of the left facial nerve demonstrates moderate asymmetric enhancement in the axial (A) and coronal (B) CE-GRE images (arrowheads); thus, each reviewer interpreted it as left facial neuritis (false positive; 1, diagnostic confidence; 2, visual grade for contrast enhancement in the canalicular segment). In contrast, the bilateral facial nerves showed no significantly asymmetric enhancement in the T1 BB-FSE axial (C) and coronal (D) images (arrows); two reviewers evaluated it as normal facial nerves (true negative).
3.3. Quantitative Analysis of the LEC and rSI of Facial Nerves
The mean values of the LEC measured 3 times showed significantly longer and wider enhancement in T1 BB-FSE than in CE-GRE. (p < 0.001 for length; p = 0.026 for width). The mean values of the three measurements of the rSI were significantly higher in T1 BB-FSE than in CE-GRE for the canalicular segment. However, for the labyrinthine segment and anterior genu segment, the mean values of the rSI between the two sequences showed no significant difference. The detailed LEC and rSI values of each segment of the facial nerve are summarized in Table 4. The ICC for the intra-rater reliability of the LEC and rSI of each facial nerve segment, which was measured three times, was 0.91 or above.
Table 4.
Quantitative measurements of the LEC and rSI of each segment (mean values of three time measurements).
4. Discussion
In this study, the abnormal enhancement of facial neuritis was more conspicuous on the T1 BB-FSE sequence than on the CE-GRE sequence. Additionally, the rSI of the abnormal facial nerve was higher in the T1 BB-FSE sequence than in the CE-GRE sequence. Among the facial nerve segments, the rSI of the canalicular segment in the T1 BB-FSE sequence was significantly higher than that in the CE-GRE sequence.
The 3D T1-spoiled gradient-echo (SPGR) sequence can use thin slices, which improve the diagnostic ability for facial neuritis and have been commonly used to assess facial nerves [29,30,31]. However, in a previous study that analyzed the enhancement pattern of a normal facial nerve using a 3D T1 SPGR sequence, enhancements of 15% and 5% were reported in the canalicular segment and labyrinthine segment, respectively [29]. Additionally, the SI of the facial nerve was higher in the inversion recovery prepared fast spoiled gradient-echo (IR-FSPGR) sequence before and after contrast enhancement than that in the CE 2D-SE sequence with fat suppression because of the sequence itself [32]. This finding might be caused by the higher spatial resolution of 3D IR-FSPGR than that of the CE 2D-SE sequence with fat suppression. In daily clinical practice, the 3D T1 pre-contrast image is not routinely obtained because of the limited overall acquisition time. Thus, in this clinical setting without 3D T1 pre-contrast images, hyper-SI in the canalicular and labyrinthine segments of the facial nerve observed on GRE images does not necessarily indicate inflammation of the facial nerve. The cause might be contrast pooling in the perineural arteriovenous plexus, which surrounds the normal facial nerve (Figure 4). These findings might explain the low specificity in diagnosing facial neuritis on CE-GRE in this study.
The 3D FSE sequences have the advantage of being less sensitive to susceptibility artifacts than the 3D GRE sequences; thus, better detectability of the normal facial nerve has been reported compared to using the 3D GRE sequence [30,31]. Several studies have investigated the diagnostic performances of facial neuritis using the T1 3D FSE sequence [33,34,35]. In a recent study using a T1 3D FSE sequence (VISTA), a significant difference in the contrast ratio (abnormal enhancing lesion signal intensity/normal nerve signal intensity) compared to the T1 2D turbo spin-echo (TSE) sequence was reported in patients with facial neuritis. However, the sensitivity, specificity, and accuracy between the two sequences did not reach statistical significance in this study [33]. Another previous study reported that the specificity and accuracy of the CE 3D-FLAIR sequence were higher than those of the T1 3D-SPGR sequence in diagnosing facial neuritis [34]. However, the 3D-FLAIR sequence has a longer acquisition time than the conventional T1 3D-SPGR sequence; thus, a potential limitation exists in comparing pre- and postcontrast 3D-FLAIR sequences for diagnosis. Additionally, in another recent study using the CE 3D-FLAIR sequence and CE T1 2D TSE sequence, the qualitative diagnostic performance outcomes of the CE 3D-FLAIR sequences were lower than those of the CE T1 2D TSE sequence in pediatric patients with facial neuritis [35].
Black-blood imaging, which was recently developed for the selective nullification of moving flow, has shown superior diagnostic ability compared to conventional MR sequences in the detection of small brain metastases, leptomeningeal metastases, leptomeningitis, optic neuritis, and contrast-enhancing lesions in multiple sclerosis [22,23,24,25,26,27,28]. The results of our study are in line with those of previous studies using the T1 BB-FSE sequence. The results of our study are theoretically supported by other previous studies that revealed that lesions in the SE sequence were markedly enhanced by gadolinium than those in the GRE sequence [36,37]. In addition, the contrast-to-noise ratio (CNR) is increased by the motion-sensitized driven-equilibrium (MSDE) technique, which is used to create a T1 black-blood image, and thus, lesion detection is improved [38]. Lastly, in the T1 BB-FSE sequence, the blood flow suppression effect is obtained by using a variable flip angle refocusing pulse as well as MSDE [39]. This sequence constrains image blurring from T2 decay over a long echo train and can achieve isotropic resolution in a relatively short scanning time in a clinical setting [40,41].
In our quantitative analysis, although the rSI of all three segments showed higher values on T1 BB-FSE than on CE-GRE, only the canalicular segment reached statistical significance. We speculate that the anterior genu segment, which shows contrast enhancement frequently, even in the normal facial nerve without symptoms, is an explanation of this result [29,32,42]. Additionally, the labyrinthine and anterior genu segments are relatively smaller areas, and susceptibility artifacts from the enclosed bony structures might cause low signal-to-noise ratios (SNRs) and CNRs in these regions on CE-GRE compared with those on T1 BB-FSE [43]. Therefore, we speculate that the SIs of the slight enhancement in these two segments at the asymptomatic side on T1 BB-FSE were higher than those on CE-GRE because of the smaller influence of susceptibility artifacts in T1 BB-FSE based on SE images. Finally, in terms of the pathophysiology of facial neuritis, if inflammation and edema occur in the labyrinthine and anterior genu segments surrounded by rigid temporal bone, it can lead to vascular compromise [5,6,7]. We can speculate that vascular compromise in these two segments is one of the reason why the rSIs of the two segments were lower than those of the canalicular segment.
The findings of this study are clinically meaningful in several ways. First, this is the first study to investigate the diagnostic ability of the T1 BB-FSE sequence for facial neuritis. Second, this study revealed that the T1 BB-FSE image has superior performance in terms of sensitivity, specificity, and accuracy compared to the previous sequence without comparison with pre-contrast sequences or the use of the subtraction method. Third, in terms of the interrater agreement for diagnostic confidence, the results were better than those of the preexisting sequence. Fourth, since there are various pathological conditions associated with facial nerves such as inflammatory diseases other than facial neuritis, leptomeningeal metastasis, and perineural tumor spread that can also show contrast enhancement of facial nerve on MRI [19], knowing the diagnostic accuracy of contrast enhancement lesion of the facial nerve on the novel MR sequence might be helpful in clinical practice. Lastly, as a routine clinical sequence, the scan time of the T1 BB-FSE images used in this study is acceptable.
This study has several limitations, including the intrinsic limits of its retrospective design. First, pre-contrast 3D T1WI was not performed. Thus, the absolute SI increase in the facial nerve could not be compared and the subtraction method could not be used. However, in clinical practice, when performing MRI to exclude other reasons in facial neuritis patients with atypical manifestations, pre-contrast 3D T1WI is usually not routinely used because of the limit of the overall MR acquisition time to include other multiple sequences. Second, we kept the scan orders of the two sequences consistent. Therefore, since the accumulated amount of gadolinium in the inflamed facial nerve changes as the scan time elapses, the possibility of an error when the signal intensity of the sequence is performed first is smaller than that of the sequence performed later but cannot be excluded. However, according to a previous study, it is known that the time needed for enhancement of the contrast in the 3D FSPGR sequence to reach its peak is approximately 1 min after gadolinium injection, and the maximum concentration lasts approximately 6 min [44]. In our study, the scan delays of the CE-GRE and T1 BB-FSE sequences after gadolinium injection were 2 min and 7 min, respectively. Therefore, the possibility of errors due to the scan order is expected to be small. Third, the scan time from symptom onset was between 0 and 29 days, and it is possible that this time variability influenced the LEC and rSI values. Fourth, the extent of the contrast-enhancing lesion was not measured in the labyrinthine segment. However, because the labyrinthine segment is the shortest segment of the facial nerve [45], it is too short to measure the extent of contrast enhancement accurately; thus, there is a potential risk that small changes in the measurements might be largely reflected. Lastly, we did not investigate the clinical significance of the T1 BB-FSE sequence, including the correlation with severity of symptoms, electrophysiological studies, and prognosis of patients with facial neuritis. However, the purpose of this study was primarily to determine the diagnostic ability of the T1 BB-FSE sequence in facial neuritis.
5. Conclusions
Despite some limitations, this study revealed that the T1 BB-FSE sequence could significantly improve the diagnostic ability for facial neuritis compared with the preexisting CE-GRE sequence. These results suggest that the T1 BB-FSE sequence can be used as a routine clinical sequence in the initial evaluation of facial neuritis based on the promising data and acceptable scan time. Future studies in a large patient population are needed to elucidate the correlation between the T1 BB-FSE sequence and the severity of the symptoms and prognosis of facial neuritis.
Supplementary Materials
The following are available online at https://www.mdpi.com/article/10.3390/jcm10091850/s1, Table S1: MR imaging parameters for CE-GRE and T1 BB-FSE sequences.
Author Contributions
Conceptualization, S.-W.J.; methodology, S.-W.J. and S.-A.L.; software, S.-W.J. and S.-A.L.; validation, S.-W.J. and S.-A.L.; formal analysis, S.-W.J. and S.-A.L.; investigation, S.-W.J. and S.-A.L.; resources, S.-W.J., and S.-K.C.; data curation, S.-W.J. and K.-H.K.; writing—original draft preparation, S.-W.J. and S.-A.L.; writing—review and editing, S.-K.C. and K.-H.K.; visualization, S.-W.J.; supervision, S.-K.C.; project administration, S.-W.J.; funding acquisition, S.-W.J. All authors have read and agreed to the published version of the manuscript.
Funding
This research was funded by Hallym University Research Fund 2019 (HURF-2019-65).
Institutional Review Board Statement
This study was conducted according to the guidelines of the Declaration of Helsinki and was approved by the Ethics Committee of Dongtan Sacred Heart Hospital, Hallym University Medical Center (IRB approval number: 2019-11-010-004).
Informed Consent Statement
Patient consent was waived for this retrospective study by the Institutional Review Board of Dongtan Sacred Heart Hospital, Hallym University Medical Center (IRB approval number: 2019-11-010-004).
Data Availability Statement
The data presented in this study are available upon request from the corresponding author. The data are not publicly available, as participants of this study did not agree for their data to be shared publicly.
Acknowledgments
The authors thank Seonok Kim, (Department of Clinical Epidemiology and Biostatistics, Asan Medical Center, University of Ulsan College of Medicine, Seoul, Korea) for the statistical assistance.
Conflicts of Interest
The authors declare no conflict of interest. The funders had no role in the design of the study; in the collection, analyses, or interpretation of data; in the writing of the manuscript; or in the decision to publish the results.
Abbreviations
| T1 BB-FSE | contrast-enhanced 3D T1 black-blood fast spin-echo |
| CE-GRE | contrast-enhanced 3D T1-spoiled gradient-echo |
| MRI | magnetic resonance imaging |
| CNR | contrast-to-noise ratio |
| SNR | signal-to-noise ratio |
| SPGR | 3D T1-spoiled gradient-echo |
| IR-FSPGR | inversion recovery prepared fast spoiled gradient-echo |
| SE | spin echo |
| FSE | fast spin echo |
| TSE | turbo spin echo |
| FLAIR | fluid attenuated inversion recovery |
| MSDE | motion-sensitized driven-equilibrium |
| PACS | picture archiving and communication system |
| SI | signal intensity |
| rSI | affected side-to-normal signal intensity ratio |
| LEC | contrast-enhancing lesion extent of the canalicular segment of affected facial nerve. |
References
- Peitersen, E. Bell’s palsy: The spontaneous course of 2500 peripheral facial nerve palsies of different etiologies. Acta Oto-LarynGologica Suppl. 2002, 549, 4–30. [Google Scholar] [CrossRef]
- Baugh, R.F.; Basura, G.J.; Ishii, L.E.; Schwartz, S.R.; Drumheller, C.M.; Burkholder, R.; Deckard, N.A.; Dawson, C.; Driscoll, C.; Gillespie, M.B.; et al. Clinical Practice Guideline. Otolaryngol. Neck Surg. 2013, 149, S1–S27. [Google Scholar] [CrossRef]
- Adour, K.K.; Byl, F.M.; Hilsinger, R.L.; Kahn, Z.M.; Sheldon, M.I. The True Nature of Bell’s Palsy: Analysis af 1000 Consecutive Patients. Laryngoscope 1978, 88, 787–801. [Google Scholar] [CrossRef] [PubMed]
- Murakami, S.; Mizobuchi, M.; Nakashiro, Y.; Doi, T.; Hato, N.; Yanagihara, N. Bell Palsy and Herpes Simplex Virus: Identification of Viral DNA in Endoneurial Fluid and Muscle. Ann. Intern. Med. 1996, 124, 27. [Google Scholar] [CrossRef] [PubMed]
- Owusu, J.A.; Stewart, C.M.; Boahene, K. Facial Nerve Paralysis. Med. Clin. North Am. 2018, 102, 1135–1143. [Google Scholar] [CrossRef]
- Proctor, B.; Corgill, D.A.; Proud, G. The pathology of Bell’s palsy. Trans. Sect. Otolaryngol. Am. Acad. Ophthalmol. Otolaryngol. 1976, 82, 70–80. [Google Scholar]
- Fowler, E.P. The pathologic findings in a case of facial paralysis. Trans. Am. Acad. Ophthalmol. Otolaryngol. Am. Acad. Ophthalmol. Otolaryngol. 1963, 67, 187–197. [Google Scholar] [CrossRef] [PubMed]
- Fisch, U.; Felix, H. On the Pathogenesls of Bell’s Palsy. Acta Oto-Laryngologica 1983, 95, 532–538. [Google Scholar] [CrossRef] [PubMed]
- Ulrich, J.; Podvinec, M.; Hofer, H. Histological and Ultrastructural Changes in Idiopathic Facial Palsy. ORL 1978, 40, 303–311. [Google Scholar] [CrossRef]
- Guntinas-Lichius, O.; Volk, G.F.; Olsen, K.D.; Mäkitie, A.A.; Silver, C.E.; Zafereo, M.E.; Rinaldo, A.; Randolph, G.W.; Simo, R.; Shaha, A.R.; et al. Facial nerve electrodiagnostics for patients with facial palsy: A clinical practice guideline. Eur. Arch. Oto-Rhino-Laryngol. 2020, 277, 1855–1874. [Google Scholar] [CrossRef]
- Lee, J.D.; Cho, Y.-S.; Jang, K.H.; Lee, H.K.; Kwon, K.H. Acute Inflammatory Facial Nerve Paralysis. Korean J. Otorhinolaryngol. Neck Surg. 2011, 54, 386–391. [Google Scholar] [CrossRef]
- Kress, B.P.J.; Griesbeck, F.; Efinger, K.; Solbach, T.; Gottschalk, A.; Kornhuber, A.W.; Bähren, W. Bell’s palsy: What is the prognostic value of measurements of signal intensity increases with contrast enhancement on MRI? Neuroradiology 2002, 44, 428–433. [Google Scholar] [CrossRef]
- Burmeister, H.P.; Baltzer, P.A.T.; Volk, G.F.; Klingner, C.M.; Kraft, A.; Dietzel, M.; Witte, O.W.; Kaiser, W.A.; Guntinas-Lichius, O. Evaluation of the early phase of Bell’s palsy using 3 T MRI. Eur. Arch. Oto-Rhino-Laryngol. 2011, 268, 1493–1500. [Google Scholar] [CrossRef]
- Engström, M.; Berg, T.; Stjernquist-Desatnik, A.; Axelsson, S.; Pitkäranta, A.; Hultcrantz, M.; Kanerva, M.; Hanner, P.; Jonsson, L. Prednisolone and valaciclovir in Bell’s palsy: A randomised, double-blind, placebo-controlled, multicentre trial. Lancet Neurol. 2008, 7, 993–1000. [Google Scholar] [CrossRef]
- Sullivan, F.M.; Swan, I.R.C.; Donnan, P.T.; Morrison, J.M.; Smith, B.H.; McKinstry, B.; Davenport, R.J.; Vale, L.D.; Clarkson, J.E.; Hammersley, V.; et al. Early Treatment with Prednisolone or Acyclovir in Bell’s Palsy. N. Engl. J. Med. 2007, 357, 1598–1607. [Google Scholar] [CrossRef] [PubMed]
- Tien, R.; Dillon, W.P.; Jackler, R.K. Contrast-enhanced MR imaging of the facial nerve in 11 patients with Bell’s palsy. AJNR Am. J. Neuroradiol. 1990, 11, 735–741. [Google Scholar] [CrossRef]
- Sartoretti-Schefer, S.; Wichmann, W.; Valavanis, A. Idiopathic, herpetic, and HIV-associated facial nerve palsies: Abnormal MR enhancement patterns. Am. J. Neuroradiol. 1994, 15, 479–485. [Google Scholar] [PubMed]
- Kress, B.; Griesbeck, F.; Stippich, C.; Bähren, W.; Sartor, K. Bell Palsy: Quantitative Analysis of MR Imaging Data as a Method of Predicting Outcome. Radiology 2004, 230, 504–509. [Google Scholar] [CrossRef]
- Krainik, A.; Casselman, J.W.; Hodler, J.; Kubik-Huch, R.A.; Von Schulthess, G.K. Imaging Evaluation of Patients with Cranial Nerve Disorders. In Diseases of the Brain, Head and Neck, Spine 2020–2023: Diagnostic Imaging; Hodler, J., Kubik-Huch, R.A., von Schulthess, G.K., Eds.; Springer International Publishing: Cham, Switzerland, 2020; pp. 143–161. [Google Scholar] [CrossRef]
- Saremi, F.; Helmy, M.; Farzin, S.; Zee, C.S.; Go, J.L. MRI of Cranial Nerve Enhancement. Am. J. Roentgenol. 2005, 185, 1487–1497. [Google Scholar] [CrossRef]
- Qiao, Y.; Steinman, D.A.; Qin, Q.; Etesami, M.; Schär, M.; Astor, B.C.; Wasserman, B.A. Intracranial arterial wall imaging using three-dimensional high isotropic resolution black blood MRI at 3.0 Tesla. J. Magn. Reson. Imaging 2011, 34, 22–30. [Google Scholar] [CrossRef] [PubMed]
- Oh, J.; Choi, S.; Lee, E.; Shin, D.; Jo, S.; Yoo, R.-E.; Kang, K.; Yun, T.; Kim, J.-H.; Sohn, C.-H. Application of 3D Fast Spin-Echo T1 Black-Blood Imaging in the Diagnosis and Prognostic Prediction of Patients with Leptomeningeal Carcinomatosis. Am. J. Neuroradiol. 2018, 39, 1453–1459. [Google Scholar] [CrossRef]
- Sommer, N.N.; Lucas, R.P.; Coppenrath, E.; Kooijman, H.; Galiè, F.; Hesse, N.; Sommer, W.H.; Treitl, K.M.; Saam, T.; Froelich, M.F. Contrast-enhanced modified 3D T1-weighted TSE black-blood imaging can improve detection of infectious and neoplastic meningitis. Eur. Radiol. 2020, 30, 866–876. [Google Scholar] [CrossRef]
- Thaler, C.; Schneider, T.; Sedlacik, J.; Kutzner, D.; Stellmann, J.-P.; Heesen, C.; Fiehler, J.; Siemonsen, S. T1w dark blood imaging improves detection of contrast enhancing lesions in multiple sclerosis. PLoS ONE 2017, 12, e0183099. [Google Scholar] [CrossRef] [PubMed]
- Park, J.; Kim, J.; Yoo, E.; Lee, H.; Chang, J.-H.; Kim, E.Y. Detection of Small Metastatic Brain Tumors. Investig. Radiol. 2012, 47, 136–141. [Google Scholar] [CrossRef] [PubMed]
- Park, J.; Kim, E.Y. Contrast-enhanced, three-dimensional, whole-brain, black-blood imaging: Application to small brain metastases. Magn. Reson. Med. 2010, 63, 553–561. [Google Scholar] [CrossRef] [PubMed]
- Kammer, N.N.; Coppenrath, E.; Treitl, K.M.; Kooijman, H.; Dietrich, O.; Saam, T. Comparison of contrast-enhanced modified T1-weighted 3D TSE black-blood and 3D MP-RAGE sequences for the detection of cerebral metastases and brain tumours. Eur. Radiol. 2016, 26, 1818–1825. [Google Scholar] [CrossRef]
- Riederer, I.; Sollmann, N.; Mühlau, M.; Zimmer, C.; Kirschke, J. Gadolinium-Enhanced 3D T1-Weighted Black-Blood MR Imaging for the Detection of Acute Optic Neuritis. Am. J. Neuroradiol. 2020, 41, 2333–2338. [Google Scholar] [CrossRef]
- Hong, H.S.; Yi, B.-H.; Cha, J.-G.; Park, S.-J.; Kim, D.H.; Lee, H.K.; Lee, J.-D. Enhancement pattern of the normal facial nerve at 3.0 T temporal MRI. Br. J. Radiol. 2010, 83, 118–121. [Google Scholar] [CrossRef]
- Byun, J.S.; Kim, H.-J.; Yim, Y.J.; Kim, S.T.; Jeon, P.; Kim, K.H.; Kim, S.S.; Jeon, Y.H.; Lee, J. MR Imaging of the Internal Auditory Canal and Inner Ear at 3T: Comparison between 3D Driven Equilibrium and 3D Balanced Fast Field Echo Sequences. Korean J. Radiol. 2008, 9, 212–218. [Google Scholar] [CrossRef]
- Haneda, J.; Ishikawa, K.; Okamoto, K. Better continuity of the facial nerve demonstrated in the temporal bone on three-dimensional T1-weighted imaging with volume isotropic turbo spin echo acquisition than that with fast field echo at 3.0 tesla MRI. J. Med. Imaging Radiat. Oncol. 2019, 63, 745–750. [Google Scholar] [CrossRef]
- Dehkharghani, S.; Lubarsky, M.; Aiken, A.H.; Kang, J.; Hudgins, P.A.; Saindane, A.M. Redefining Normal Facial Nerve Enhancement: Healthy Subject Comparison of Typical Enhancement Patterns—Unenhanced and Contrast-Enhanced Spin-Echo Versus 3D Inversion Recovery–Prepared Fast Spoiled Gradient-Echo Imaging. Am. J. Roentgenol. 2014, 202, 1108–1113. [Google Scholar] [CrossRef]
- Yun, S.J.; Ryu, C.-W.; Jahng, G.-H.; Kim, E.J.; Choi, W.S.; Lee, K.M.; Kim, S.M. Usefulness of contrast-enhanced 3-dimensional T1-VISTA in the diagnosis of facial neuritis: Comparison with contrast-enhanced T1-TSE. J. Neuroradiol. 2015, 42, 93–98. [Google Scholar] [CrossRef]
- Lim, H.; Lee, J.; Hyun, D.; Park, J.; Kim, J.; Lee, H.; Park, S.; Ahn, J.; Baek, J.; Choi, C. MR Diagnosis of Facial Neuritis: Diagnostic Performance of Contrast-Enhanced 3D-FLAIR Technique Compared with Contrast-Enhanced 3D-T1-Fast-Field Echo with Fat Suppression. Am. J. Neuroradiol. 2011, 33, 779–783. [Google Scholar] [CrossRef] [PubMed]
- Seo, J.H.; You, S.K.; Lee, I.H.; Lee, J.E.; Lee, S.M.; Cho, H.-H. Quantitative Analysis of the Facial Nerve Using Contrast-Enhanced Three Dimensional FLAIR-VISTA Imaging in Pediatric Bell’s Palsy. Investig. Magn. Reson. Imaging 2015, 19, 162–167. [Google Scholar] [CrossRef][Green Version]
- Brant-Zawadzki, M.; Gillan, G.D.; Nitz, W.R. MP RAGE: A three-dimensional, T1-weighted, gradient-echo sequence--initial experience in the brain. Radiology 1992, 182, 769–775. [Google Scholar] [CrossRef] [PubMed]
- Mugler, J.P.; Brookeman, J.R. Theoretical analysis of gadopentetate dimeglumine enhancement in T1-weighted imaging of the brain: Comparison of two-dimensional spin-echo and three-dimensional gradient-echo sequences. J. Magn. Reson. Imaging 1993, 3, 761–769. [Google Scholar] [CrossRef] [PubMed]
- Nagao, E.; Yoshiura, T.; Hiwatashi, A.; Obara, M.; Yamashita, K.; Kamano, H.; Takayama, Y.; Kobayashi, K.; Honda, H. 3D Turbo Spin-Echo Sequence with Motion-Sensitized Driven-Equilibrium Preparation for Detection of Brain Metastases on 3T MR Imaging. Am. J. Neuroradiol. 2011, 32, 664–670. [Google Scholar] [CrossRef]
- Sakurai, K.; Miura, T.; Sagisaka, T.; Hattori, M.; Matsukawa, N.; Mase, M.; Kasai, H.; Arai, N.; Kawai, T.; Shimohira, M.; et al. Evaluation of luminal and vessel wall abnormalities in subacute and other stages of intracranial vertebrobasilar artery dissections using the volume isotropic turbo-spin-echo acquisition (VISTA) sequence: A preliminary study. J. Neuroradiol. 2013, 40, 19–28. [Google Scholar] [CrossRef]
- Hennig, J.; Weigel, M.; Scheffler, K. Multiecho sequences with variable refocusing flip angles: Optimization of signal behavior using smooth transitions between pseudo steady states (TRAPS). Magn. Reson. Med. 2003, 49, 527–535. [Google Scholar] [CrossRef]
- Gold, G.E.; Busse, R.F.; Beehler, C.; Han, E.; Brau, A.C.S.; Beatty, P.J.; Beaulieu, C.F. Isotropic MRI of the Knee with 3D Fast Spin-Echo Extended Echo-Train Acquisition (XETA): Initial Experience. Am. J. Roentgenol. 2007, 188, 1287–1293. [Google Scholar] [CrossRef]
- Kinoshita, T.; Ishii, K.; Okitsu, T.; Okudera, T.; Ogawa, T. Facial Nerve Palsy: Evaluation by Contrast-enhanced MR Imaging. Clin. Radiol. 2001, 56, 926–932. [Google Scholar] [CrossRef] [PubMed]
- Czervionke, L.F.; Daniels, D.L.; Wehrli, F.W.; Mark, L.P.; Hendrix, L.E.; Strandt, J.A.; Williams, A.L.; Haughton, V.M. Magnetic susceptibility artifacts in gradient-recalled echo MR imaging. AJNR Am. J. Neuroradiol. 1988, 9, 1149–1155. [Google Scholar] [PubMed]
- Furutani, K.; Harada, M.; Mawlan, M.; Nishitani, H. Difference in Enhancement Between Spin Echo and 3-Dimensional Fast Spoiled Gradient Recalled Acquisition in Steady State Magnetic Resonance Imaging of Brain Metastasis at 3-T Magnetic Resonance Imaging. J. Comput. Assist. Tomogr. 2008, 32, 313–319. [Google Scholar] [CrossRef] [PubMed]
- Proctor, B.; Nager, G.T. The facial canal: Normal anatomy, variations and anomalies. I. Normal anatomy of the facial canal. Ann. Otol. Rhinol. Laryngol. Suppl. 1982, 97, 33–44. [Google Scholar] [PubMed]


Publisher’s Note: MDPI stays neutral with regard to jurisdictional claims in published maps and institutional affiliations. |
© 2021 by the authors. Licensee MDPI, Basel, Switzerland. This article is an open access article distributed under the terms and conditions of the Creative Commons Attribution (CC BY) license (https://creativecommons.org/licenses/by/4.0/).