Article

Development of a Laboratory Risk-Score Model to Predict One-Year Mortality in Acute Myocardial Infarction Survivors

1
Department of Cardiovascular Medicine, National Hospital Organization Ureshino Medical Center, Ureshino 843-0393, Japan
2
Department of Cardiovascular Medicine, Saga University, Saga 849-8501, Japan
3
Miyazaki Medical Association Hospital Cardiovascular Center, Miyazaki 880-0834, Japan
*
Author to whom correspondence should be addressed.
J. Clin. Med. 2022, 11(12), 3497; https://doi.org/10.3390/jcm11123497
Submission received: 15 May 2022 / Revised: 16 June 2022 / Accepted: 16 June 2022 / Published: 17 June 2022

Abstract

:
The high post-discharge mortality rate of acute myocardial infarction (AMI) survivors is concerning, indicating a need for reliable, easy-to-use risk prediction tools. We aimed to examine if a combined pre-procedural blood testing risk model predicts one-year mortality in AMI survivors. Overall, 1355 consecutive AMI patients who received primary coronary revascularization were divided into derivation (n = 949) and validation (n = 406) cohorts. A risk-score model of parameters from pre-procedural routine blood testing on admission was generated. In the derivation cohort, multivariable analysis demonstrated that hemoglobin < 11 g/dL (odds ratio (OR) 4.01), estimated glomerular filtration rate < 30 mL/min/1.73 m2 (OR 3.75), albumin < 3.8 mg/dL (OR 3.37), and high-sensitivity troponin I > 2560 ng/L (OR 3.78) were significantly associated with one-year mortality after discharge. An increased risk score, assigned from 0 to 4 points according to the counts of selected variables, was significantly associated with higher one-year mortality in both cohorts (p < 0.001). Receiver-operating characteristics curve analyses of risk models demonstrated adequate discrimination between patients with and without one-year death (area under the curve (95% confidence interval) 0.850 (0.756–0.912) in the derivation cohort; 0.820 (0.664–0.913) in the validation cohort). Our laboratory risk-score model can be useful for predicting one-year mortality in AMI survivors.

1. Introduction

Acute myocardial infarction (AMI) is a major cause of poor outcomes and clinical concerns worldwide [1]. Over the past two decades, in-hospital death rates from AMI have decreased dramatically, partly due to advances in the clinical management of the acute phase of AMI and guideline-directed medical therapy [2]. However, long-term prognosis of AMI survivors is still unfavorable. In this regard, post-discharge mortality remains a clinical concern [2,3]. Therefore, there is a need for reliable and easy-to-use risk prediction tools for early identification of at-risk patients, which may help with timely prevention and well-tailored treatment.
Several risk-score models to predict prognosis after acute coronary syndrome (ACS), including AMI, are currently available [4,5]. The Global Registry of Acute Coronary Events (GRACE) 2.0 score is one of the most established risk-score models for determining mortality risk in AMI patients [4]. This model was created prior to the contemporary era of optimal medical therapy and increased usage of percutaneous coronary intervention (PCI) for AMI patients [2,6]. In addition, this model requires several clinical variables: age, systolic blood pressure (BP), heart rate, creatinine, cardiac arrest at admission, ST-segment deviation, abnormal cardiac enzyme, and Killip classification. However, in the emergency setting of AMI, several variables, such as heart rate and systolic BP, often fluctuate significantly, which could compromise the prediction value of the GRACE 2.0 model, resulting in a requirement for reassessment. Unlike these clinical measurements, blood parameters can be rapidly obtained in a non-subjective fashion, even in the emergent setting of AMI, suggesting that a blood-parameter-based model may be easy to use for AMI mortality risk prediction.
Several models of combined blood variables have been used as predictive indicators of AMI mortality risk [7,8]. We have also previously reported a risk-score model combining pre-procedural laboratory variables to predict the risk of in-hospital death in ST-segment elevation myocardial infarction (STEMI), comparable to the GRACE 2.0 model [9]. However, whether combined-blood-parameter-based models could predict post-discharge mortality in AMI survivors remains largely unknown. Herein, we aimed to create a risk-score model based on a combination of pre-procedural laboratory parameters for one-year mortality after discharge in AMI survivors and compare its predictive ability with a conventional model (GRACE 2.0 model).

2. Materials and Methods

2.1. Design and Participants

This was a retrospective observational study conducted in Miyazaki Medical Association Hospital. The study population comprised 1852 consecutive patients hospitalized for ACS between Apr 2012 and Jan 2018, were included in the present study. Patients who did not undergo primary PCI, recurrent ACS or unstable angina pectoris, who died during hospitalization, lost to follow-up one year after discharge, and lack of laboratory information on admission were excluded from the analyses. Thus, 1355 patients were included in the present study. Patients were randomly classified into either derivation (n = 949) or validation cohorts (n = 406) [10,11] (Figure 1). This study was approved by the Institutional Review Board of Miyazaki Medical Association Hospital and complied with the latest Helsinki Declaration. Nevertheless, written informed consent was waived due to the retrospective of the study.

2.2. Definition of STEMI and NSTEMI

STEMI and non-ST-segment elevation myocardial infarction (NSTEMI) were diagnosed by cardiologists based on the universal definitions [12]. Treatment and management depend on the latest domestic guidelines released by the Japanese Circulation Society (Diagnosis and Treatment of Acute Coronary Syndrome).

2.3. Data Acquisition

Participants’ baseline characteristics and clinical manifestations, vital signs, medical history, usual laboratory data, high-sensitivity troponin I (hsTnI), type of AMI, Killip classification and left ventricular ejection fraction were collected on admission. Hs-TnI levels were measured on a chemiluminescence immunoassay (ARCHITECT® high sensitive troponin I (Abbott Japan, Tokyo, Japan)) with a coefficient of variation < 10% at 32 ng/L and 99th percentile reference limit < 34.2 or 15.6 ng/L (male or female). For the procedure-related parameters, clinical information on peak creatine kinase (CK), culprit lesion and mechanical support were collected during coronary procedure. Medications at discharge were also collected. Information on post-discharge death was collected by medical records or telephone calls. The estimated glomerular filtration rate (eGFR) was calculated with the revised equation for the Japanese population [13].

2.4. Statistics

Continuous variables are expressed as mean ± standard deviation for normal distribution or median [interquartile range] for non-normal distribution values. Categorical variables are shown as numbers (%). Comparisons of continuous variables between both cohorts were done with Student’s t-test or Wilcoxon test, where appropriate. Categorical variables were compared using the chi-squared test.
The laboratory variables significantly associated with post-discharge death selected by the univariate analysis were categorized based on the cutoff values reported previously [14,15,16,17,18,19,20,21] and then applied for the multivariable analysis to develop the risk-score model. Those variables were further selected using a multivariable logistic regression model using the backward factor elimination method. Finally, the remaining variables were given an equivalent point to calculate the risk score for one-year mortality. The subjects were classified into three groups based on the total scores, as follows: low risk (0–1 point), moderate risk (2 points) and high risk (3–4 points). Cochran-Armitage trend analysis was used to assess statistical trends among three risk groups. The predictive abilities of the risk models for predicting post-discharged death were assessed for their discrimination and calibration, and which were analyzed by the receiver operating characteristic curve and Hosmer–Lemeshow goodness-of-fit test, respectively. The risk score for predicting one-year mortality was also calculated using the GRACE 2.0 ACS Risk Calculator app. We estimated the area under the curve (AUC) of the GRACE 2.0 model and compared it with that of the present model derived from the validation cohort. Differences in those AUCs were appraised by the DeLong method [22]. Statistical analyses were conducted using the JMP version 15 (SAS Institute Inc., Cary, NC, USA), and statistical significance was set at p-value < 0.05 (2-tailed), except for the Hosmer–Lemeshow goodness-of-fit test.

3. Results

3.1. Baseline Demographics and Characteristics

The study population consisted of 1355 subjects (derivation 949; validation 406). Baseline demographics and characteristics of the two cohorts are listed in Table 1. There were no significant differences in the clinical information on admission and during hospitalization between the derivation and validation cohorts. Medications at discharge were comparable between the two cohorts. Post-discharge deaths were observed in 30 patients (3.2%) in the derivation cohort and 14 (3.5%) in the validation cohort.

3.2. Laboratory Parameters Associated with Post-Discharge Death

Table 2 shows the univariate analysis of blood variables between survivors and non-survivors at one-year post-discharge in the derivation cohort. Significant variables detected in the univariate analysis were subjected to a multivariable stepwise backward logistic regression analysis. In that analysis, hemoglobin level < 11 g/dL, eGFR < 30 mL/min/1.73 m2, albumin level < 3.8 mg/dL, and hs-TnI > 2560 ng/L (normal upper limit × 80) were significantly associated with post-discharge death in the derivation cohort (Table 3). The odds ratio for one-year mortality ranged from 3.37 to 4.01. Zero to four points were assigned to each patient according to the number of risk factors they had.

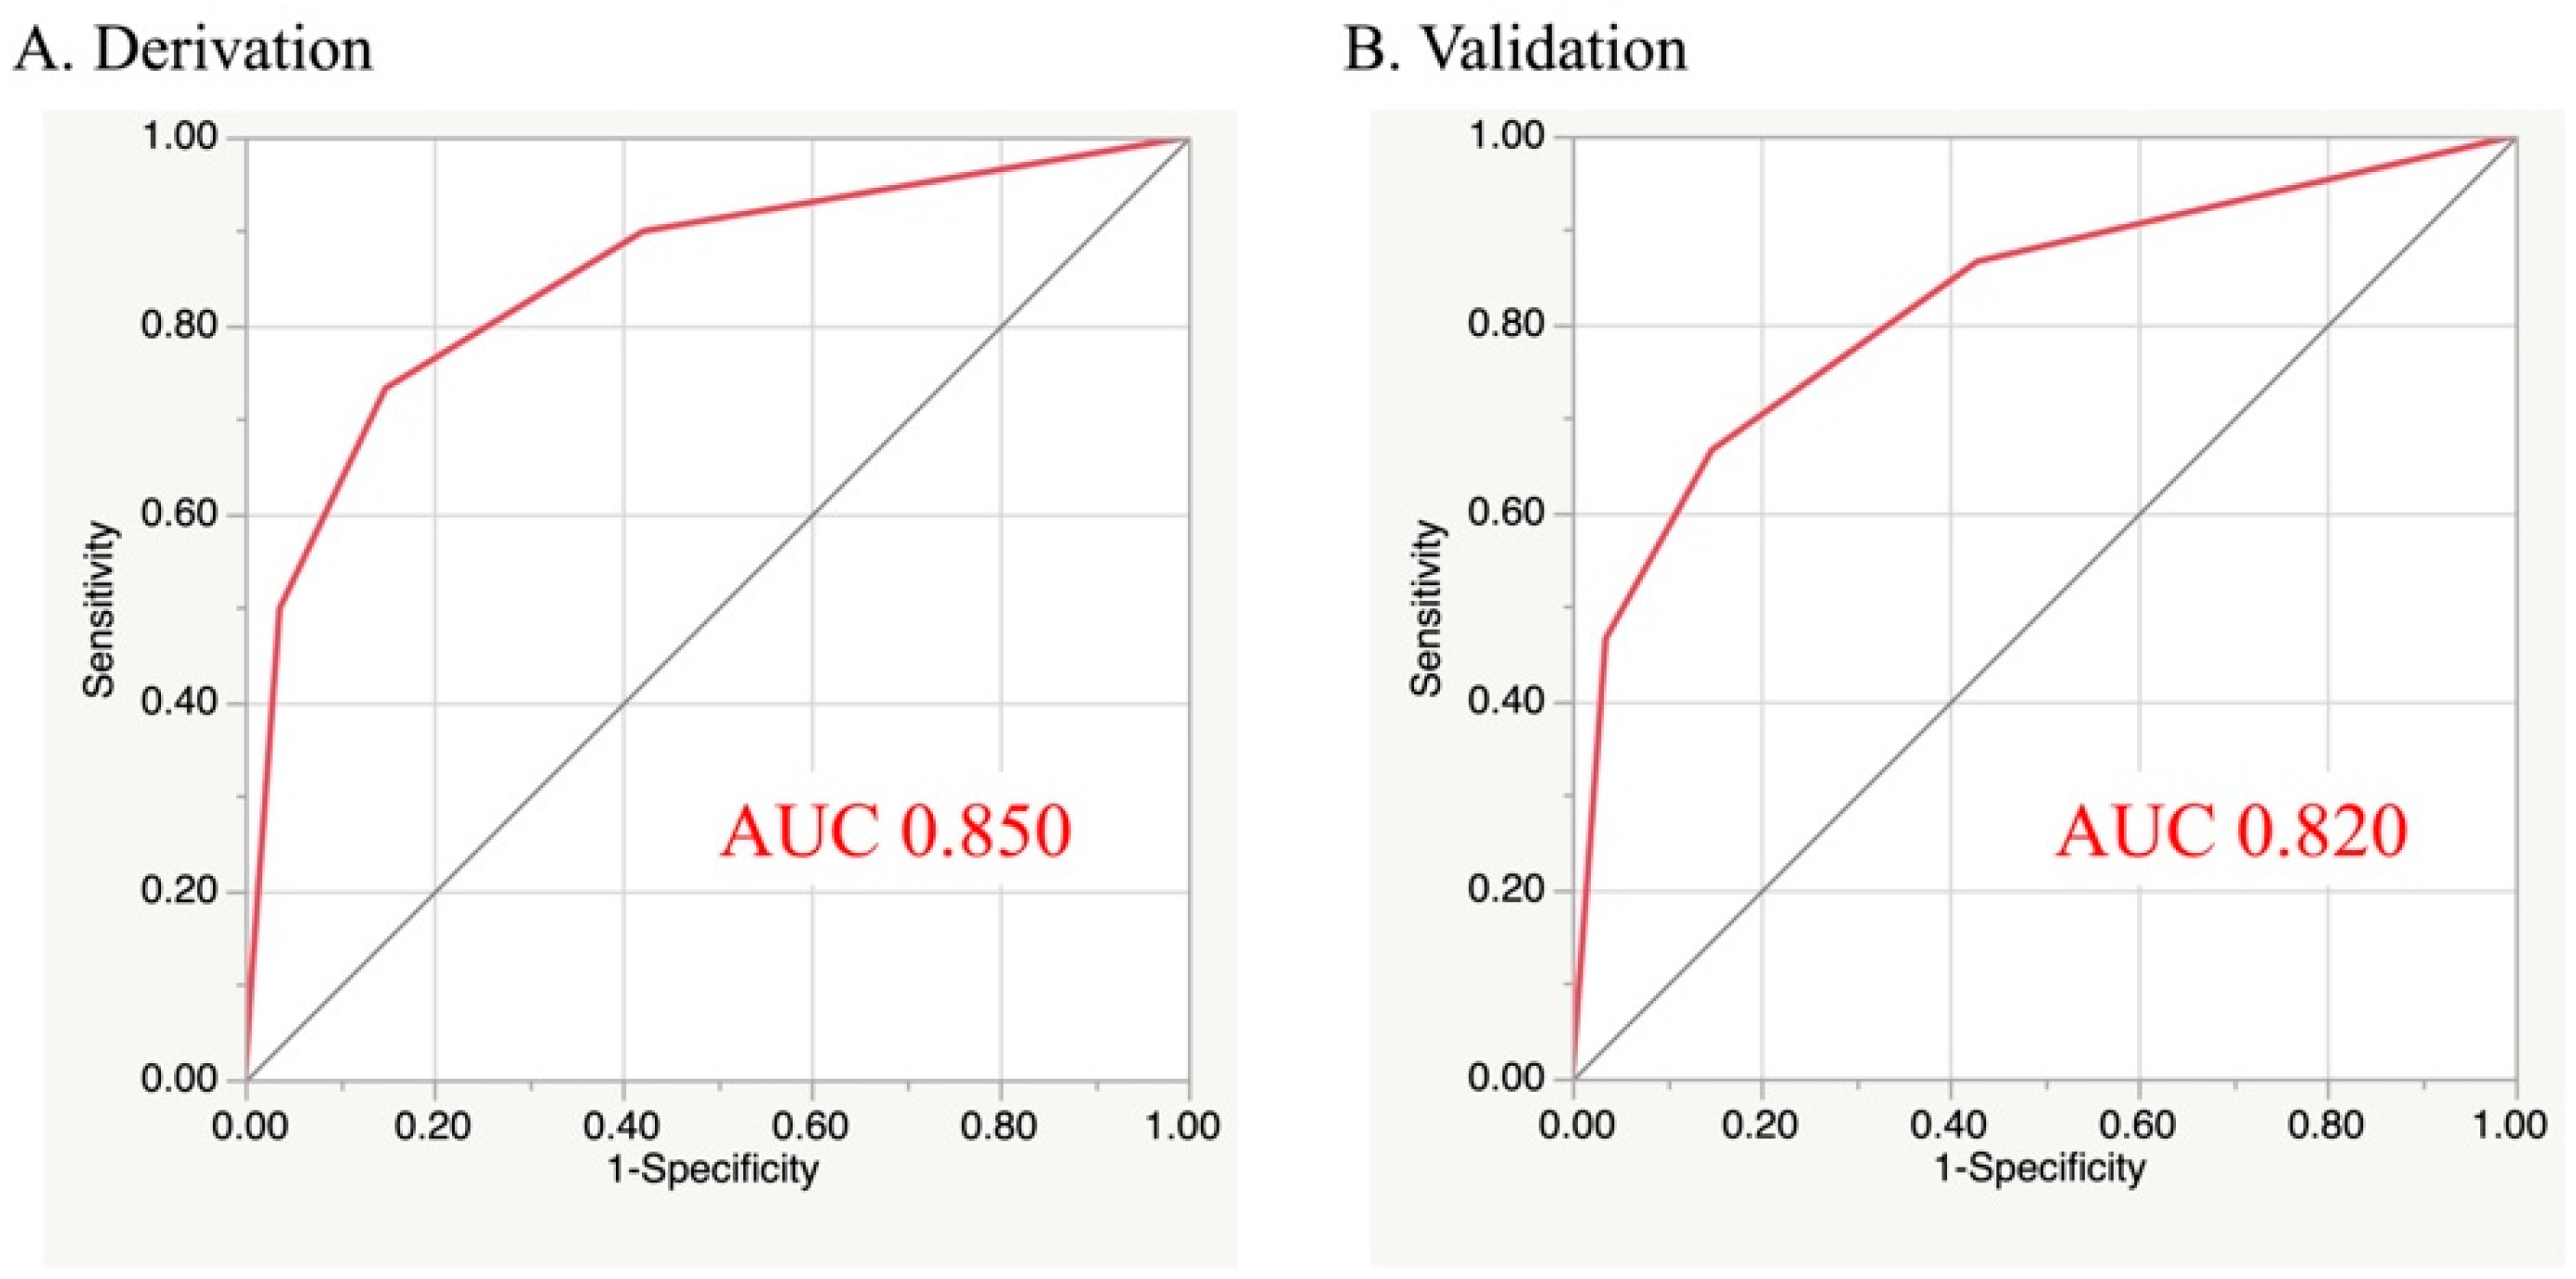
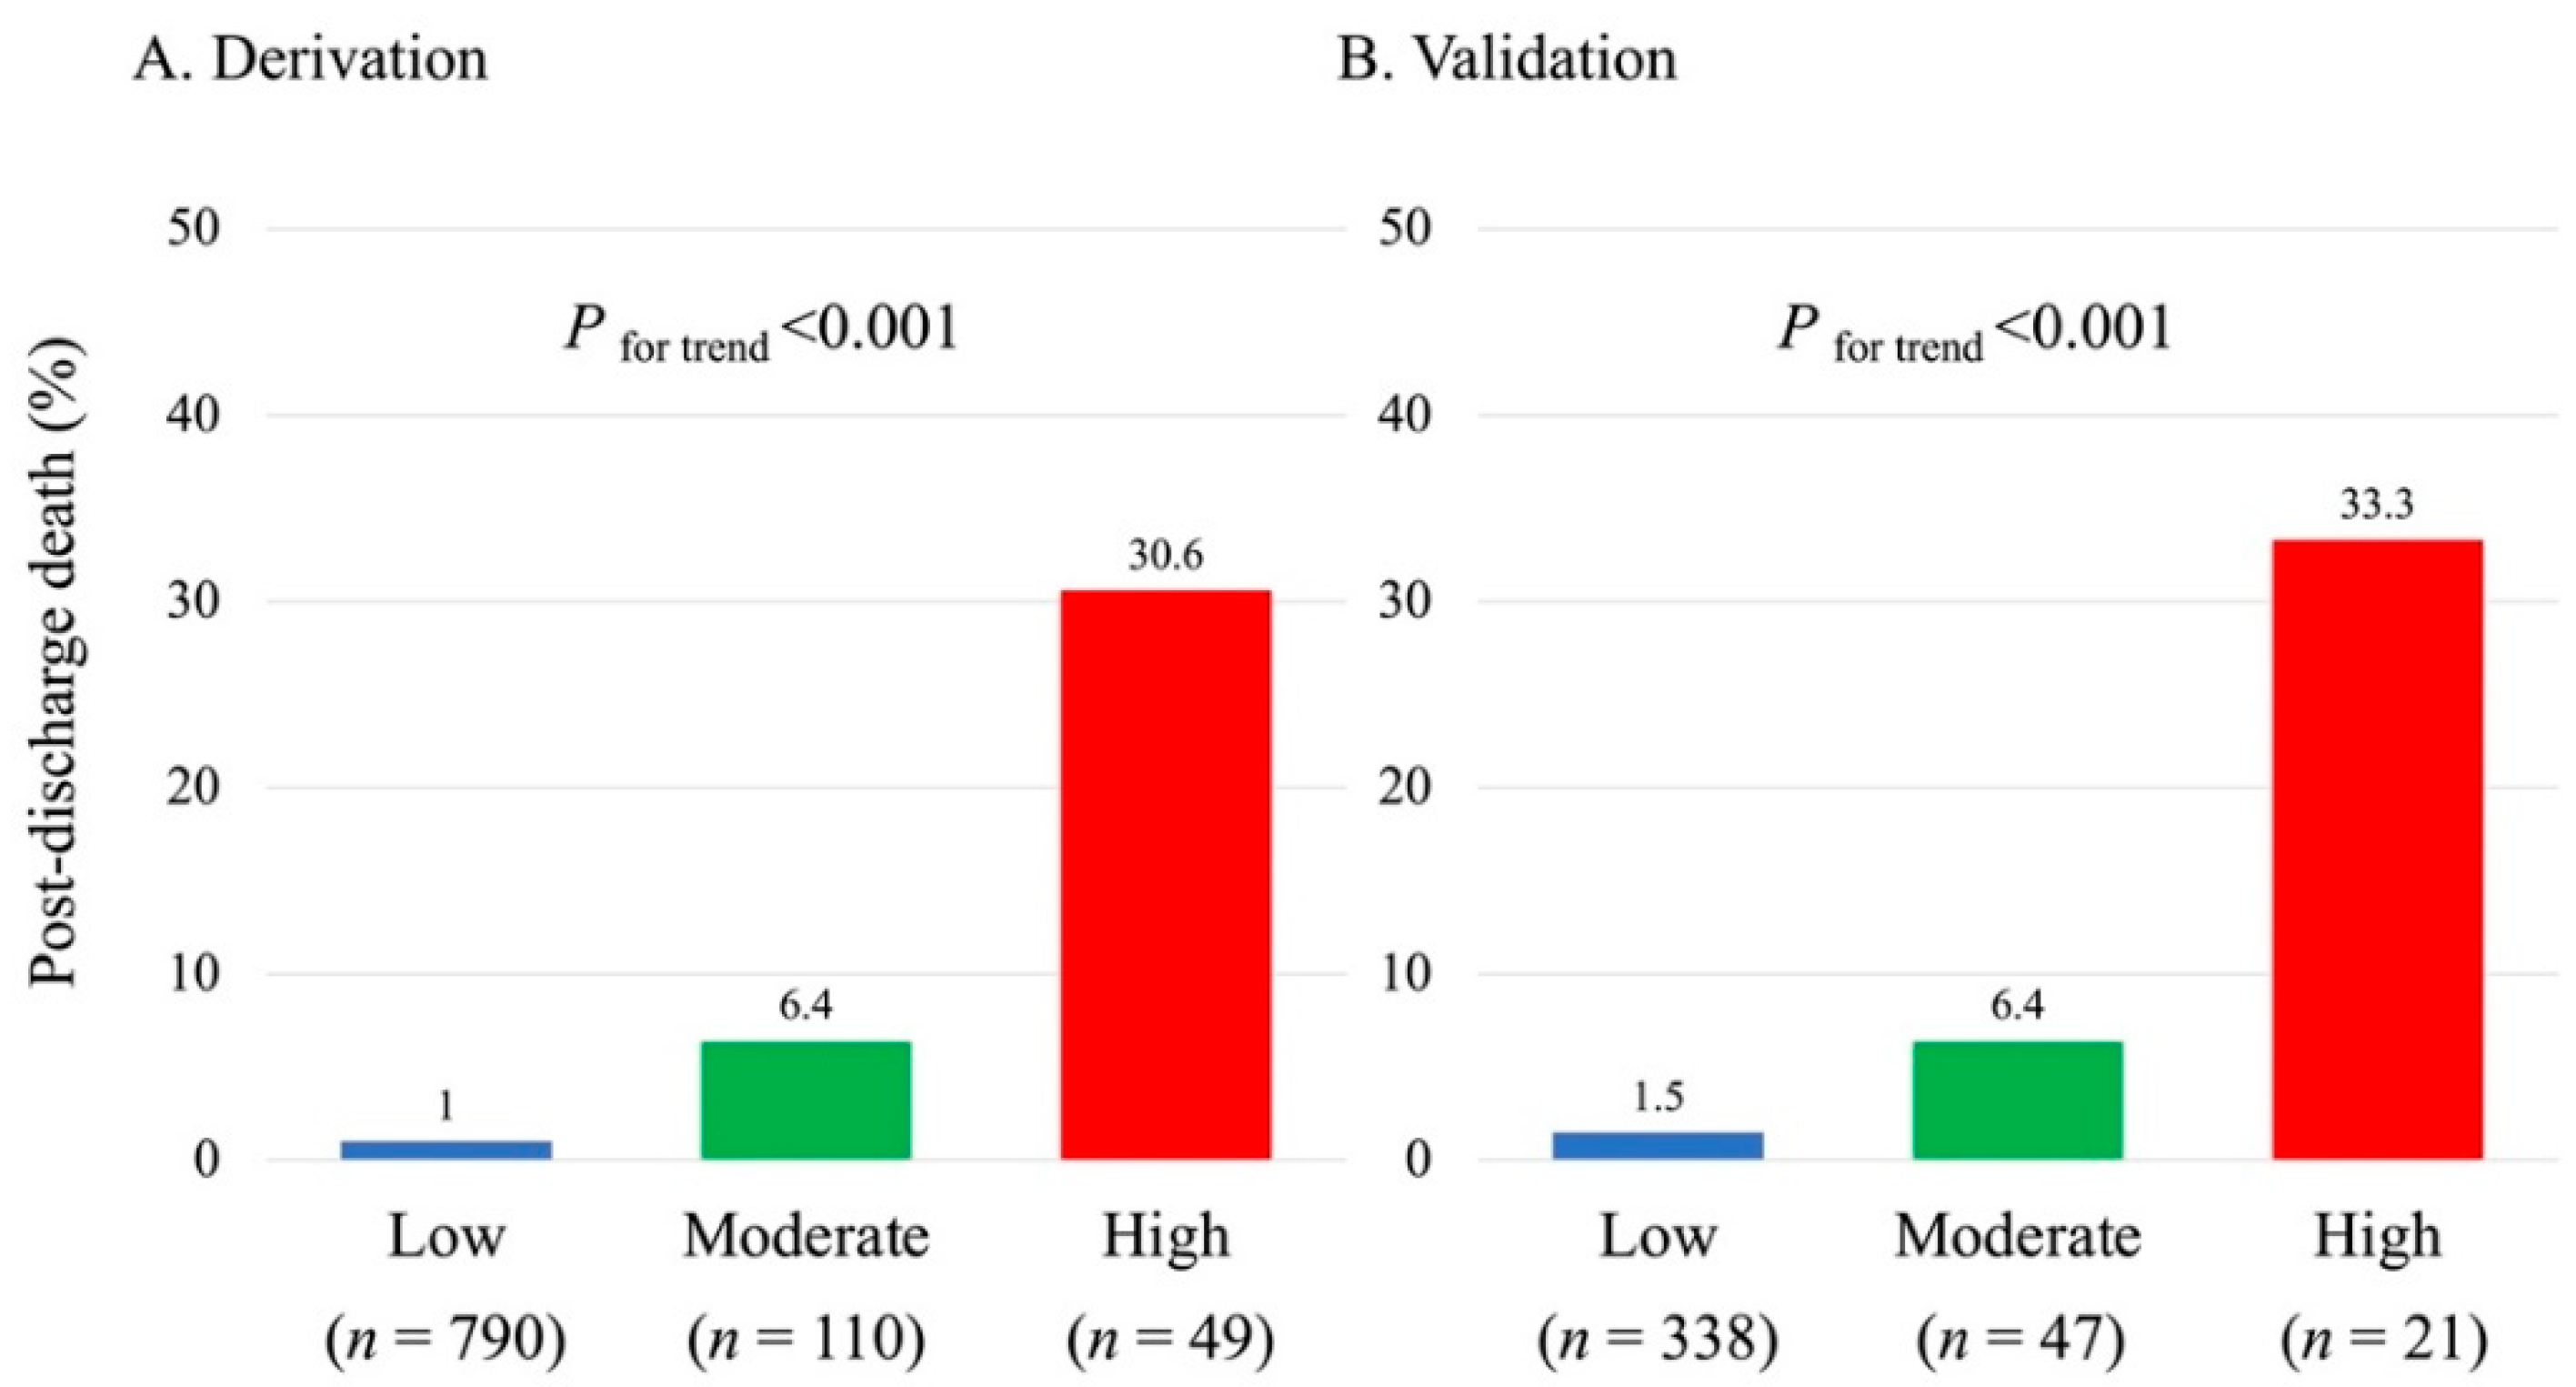
3.3. Predictive Model of Post-Discharge Death

The incidence of post-discharge death during one-year follow-up increased significantly as the total risk score elevated in both cohorts (Figure 2A,B). The risk-score model demonstrated adequate discrimination between subjects who died or not after discharge in the validation (AUC, 95% confidence interval (CI): 0.850, 0.756–0.913) and derivation (0.820, 0.664–0.913) cohorts (Figure 3). The Hosmer–Lemeshow test indicated a favorable fit in both cohorts (χ2 = 0.328, p = 0.849 for the derivation; χ2 = 0.556, p = 0.757 for the validation). When patients were further classified into three subgroups based on their risk score: 0–1 point (defined as low-risk), 2 points (moderate-risk), and 3–4 points (high-risk), a similar trend for post-discharge mortality during one-year follow-up was also observed in those subgroups (Figure 4A,B).

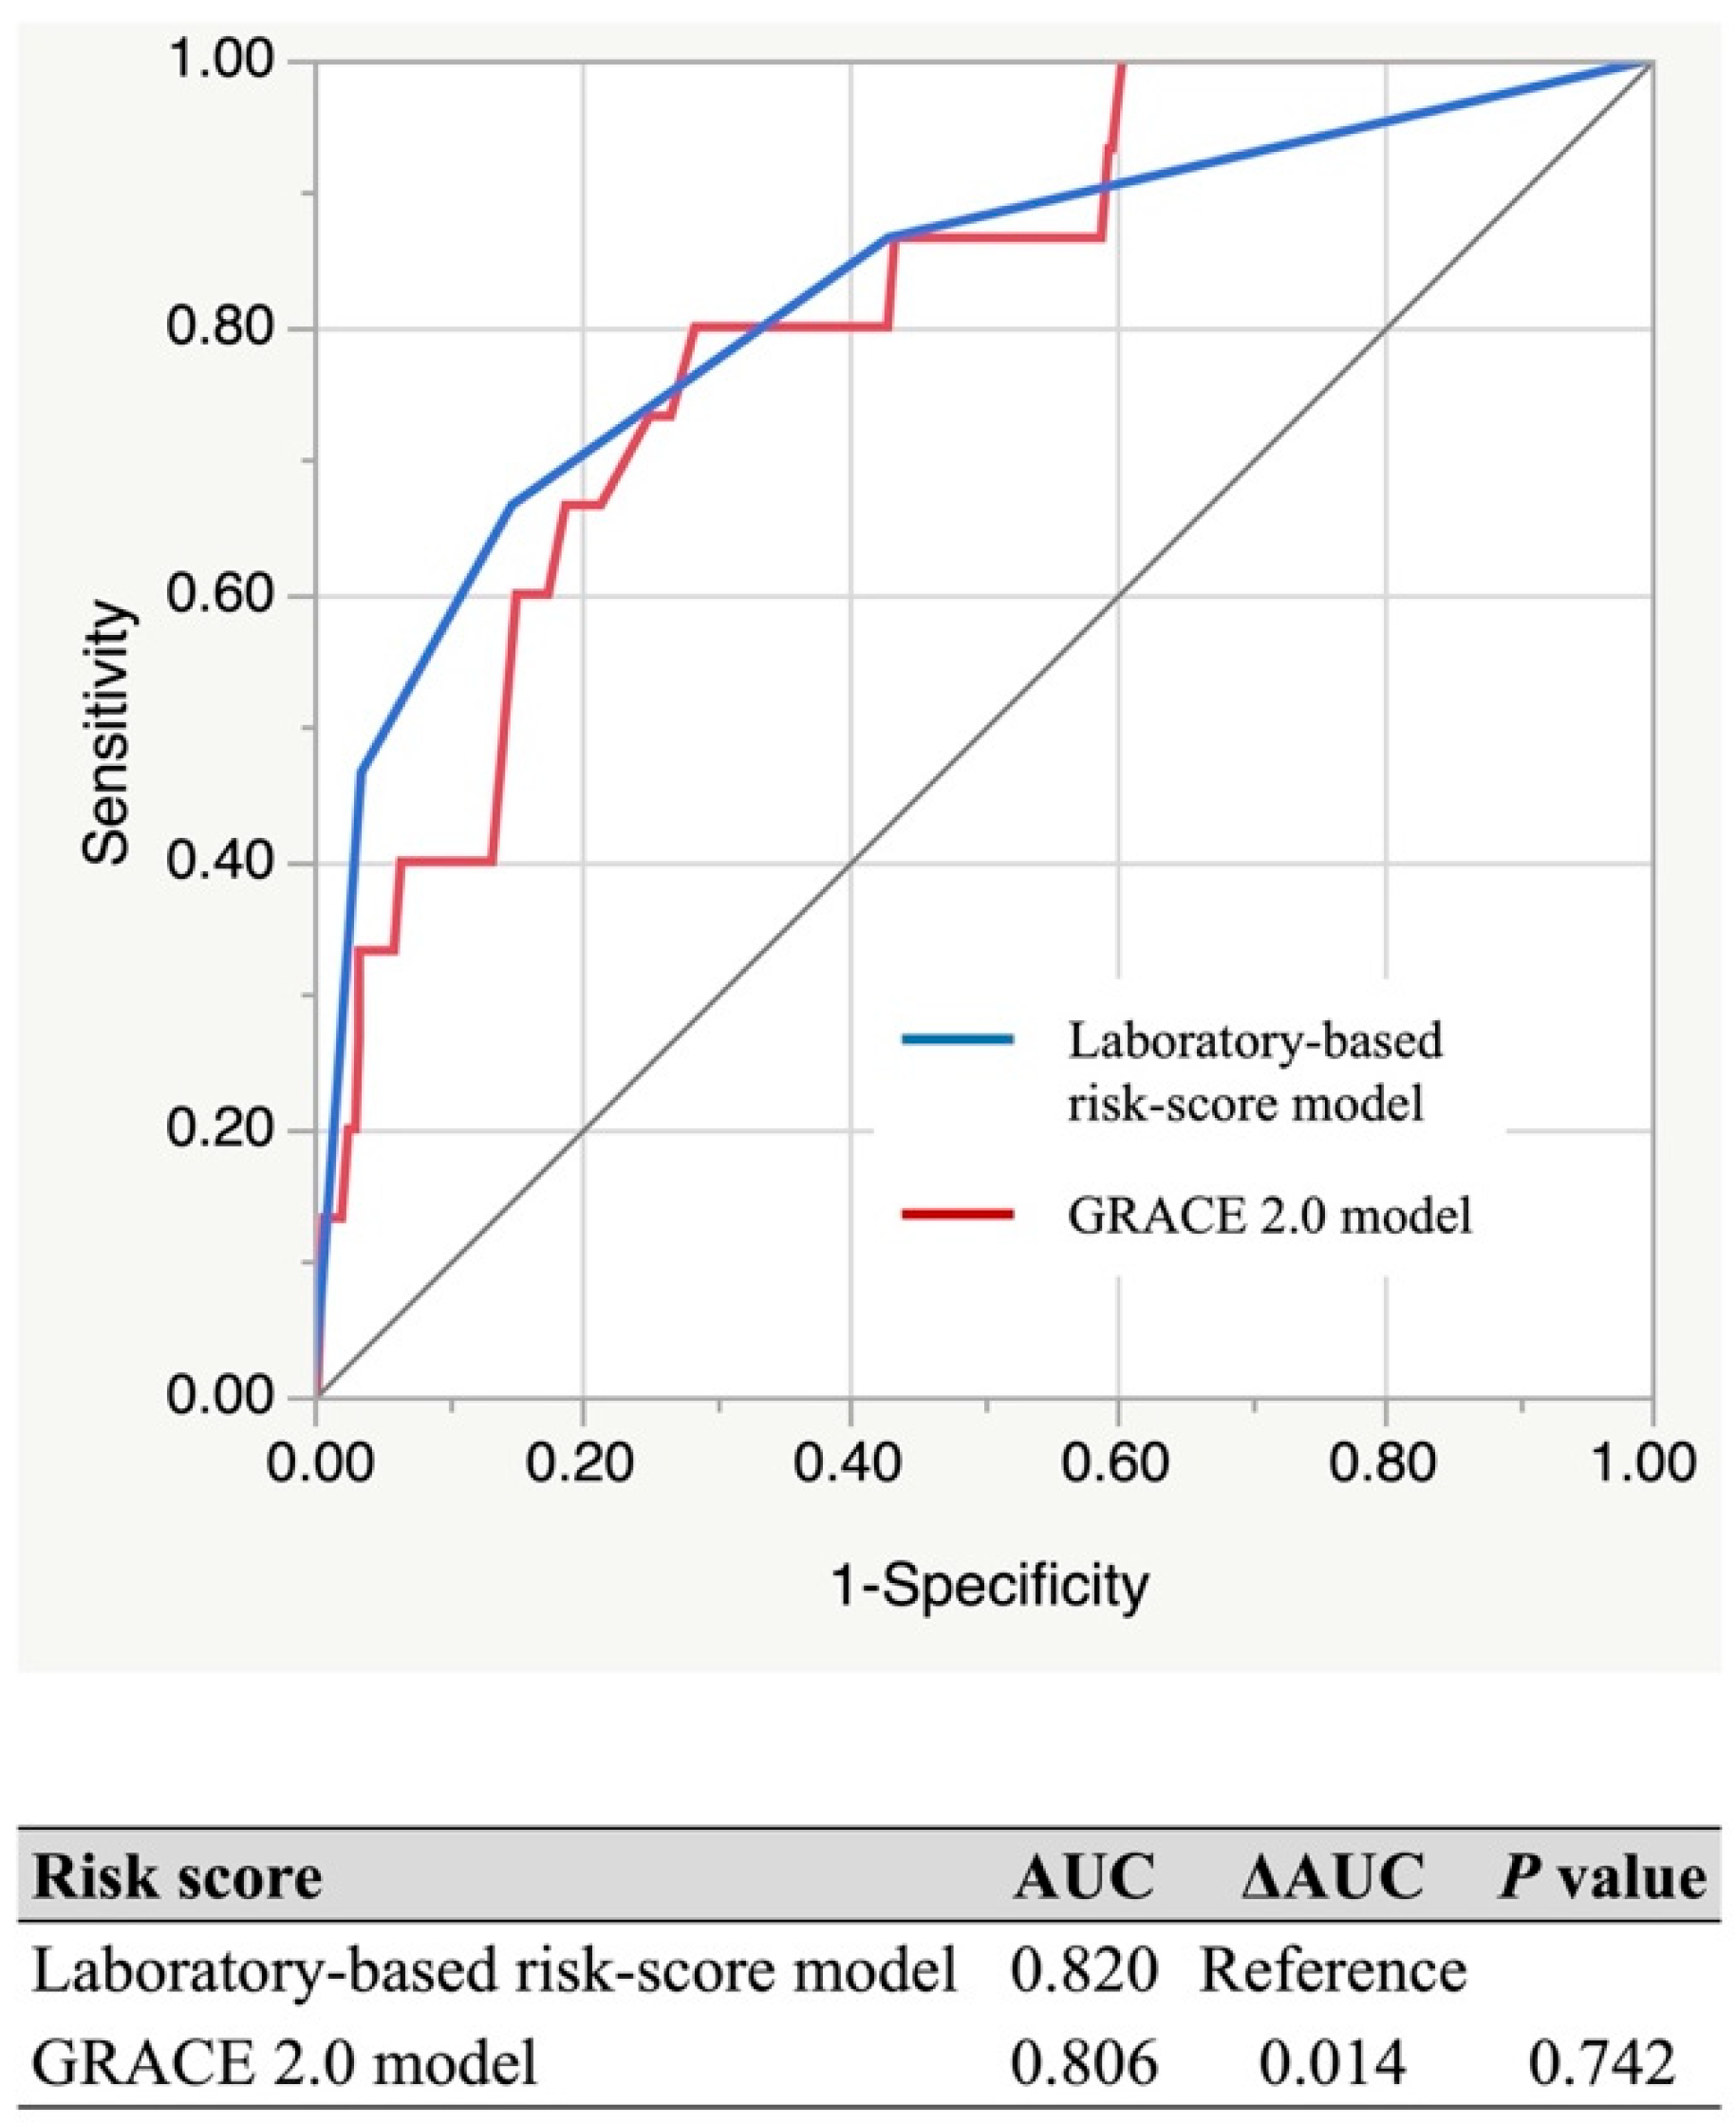
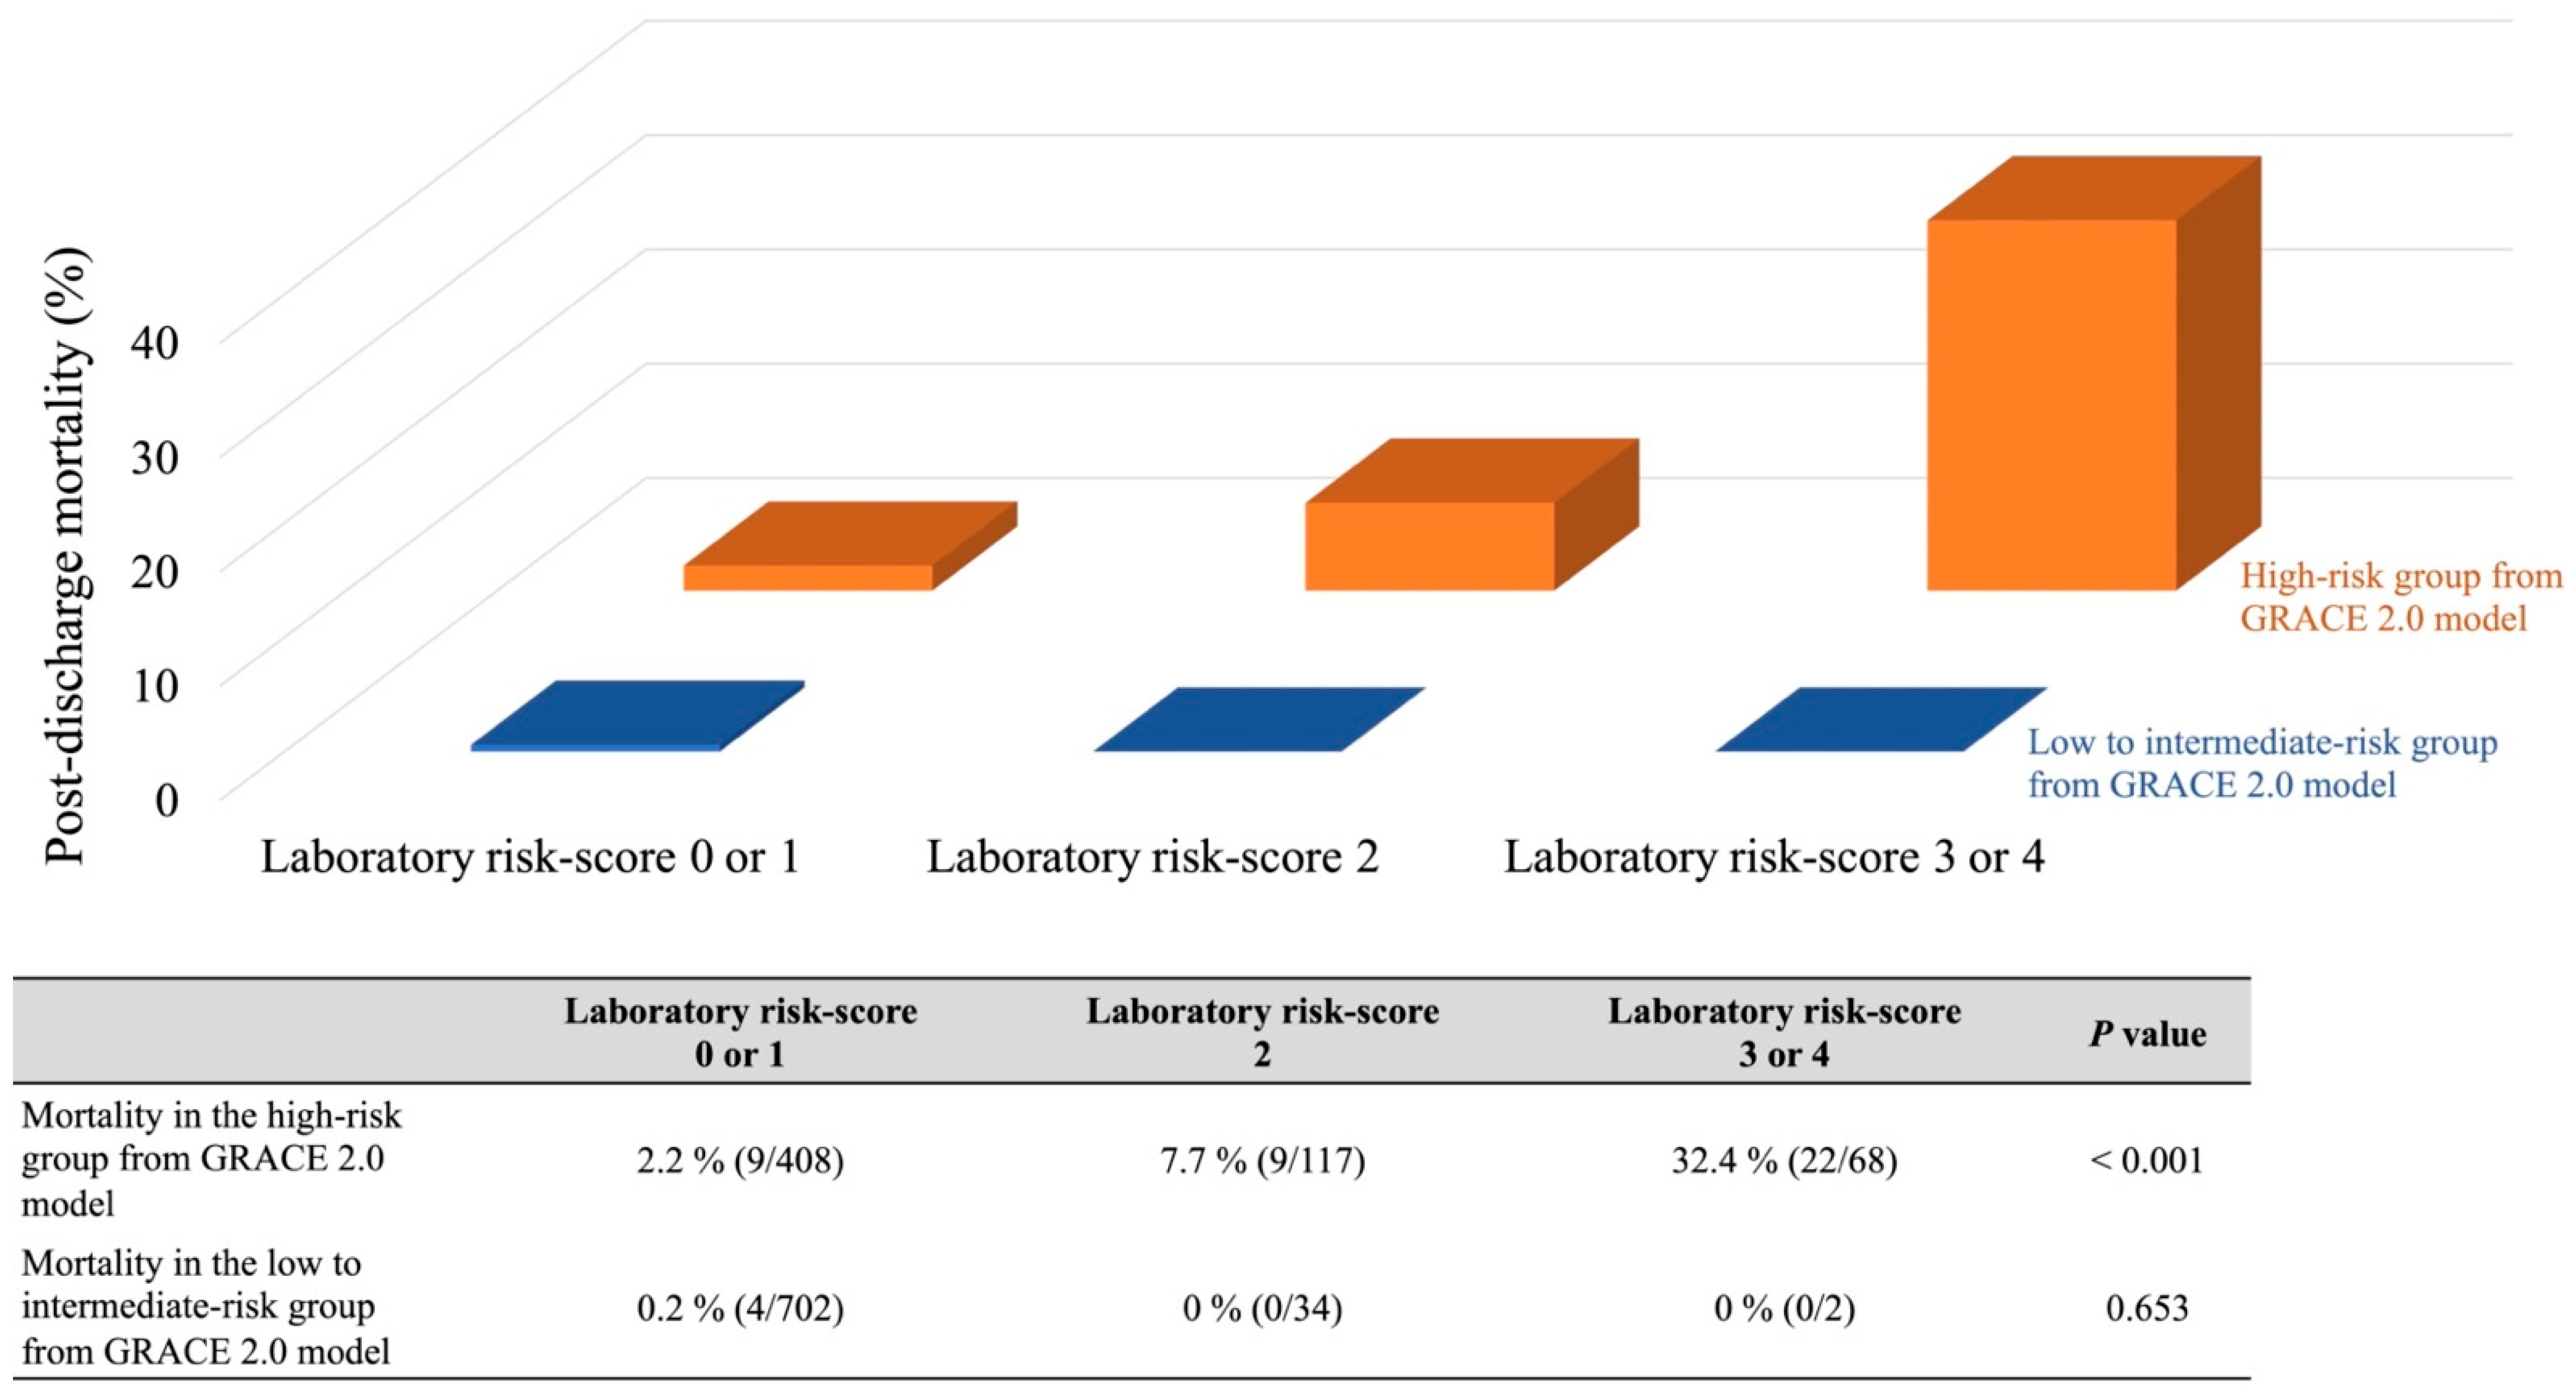
3.4. Comparison with GRACE 2.0 Model

The AUCs of the present and GRACE 2.0 models in the validation cohort were 0.820 (95% CI, 0.664–0.913) and 0.806 (95% CI, 0.681–0.890). The predictive power was similar between the two models (Figure 5). Additionally, we compared the predictive ability between these risk models based on the type of AMI and gender. In all cases, the predictive power was not significantly different between these models (Table 4). Furthermore, the laboratory model was able to stratify the possible risk of post-discharge death, especially in the high-risk subgroup from the GRACE 2.0 model (risk-score > 8.0%) [23], but not in the low–intermediate-risk groups from the GRACE 2.0 model (risk-score ≤ 8.0%) (Figure 6).

4. Discussion

The main findings of this investigation were as follows: (i) individual blood variables measured on admission (hemoglobin < 11 g/dL, eGFR < 30 mL/min/1.73 m2, albumin < 3.8 mg/dL, and hs-TnI > 2560 ng/L) were independently related with an augmented risk of post-discharge mortality rates at one-year; (ii) a simple model, using a combination of pre-procedural laboratory measures, can be useful for assessing the risk of post-discharge death at one-year follow-up; (iii) the predictive ability of our model was similar to that of the GRACE 2.0 model; and (iv) our model provided predictive power to further subdivide the high-risk population estimated by the GRACE 2.0 model. Therefore, these results may indicate that our novel model with pre-procedural laboratory parameters can help predict one-year mortality in AMI survivors.
Some risk stratification models for estimating the risk of post-discharge death rates have been developed for patients with AMI. Among these risk prediction models, the GRACE 2.0 system has been recommended for stratifying AMI mortality risk according to guidelines [24]. However, cohorts enrolled from the GRACE model were patients in the 2000s, while medical management of AMI has developed beyond the clinical surroundings of the 2000s [2]. Moreover, some of the hemodynamic statuses required to calculate the GRACE score often fluctuate widely, especially in the emergency clinical phase of AMI. Therefore, the risk estimated by the GRACE model may also vary. While the measurements of blood parameters can be performed readily and objectively, this study sought to create a laboratory-based model to estimate the risk of one-year death in AMI survivors.
Individual blood parameters considered for the risk assessment in the present study are useful markers for predicting the prognosis in patients with AMI [14,15,16,17,18,19,20,21]. In particular, the presence of anemia or renal dysfunction is a powerful predictor of poor outcomes in post-AMI patients [7,8,9,10]. Actually, several risk calculators for predicting long-term mortality need renal functional parameters and hemoglobin levels [4,5]. Besides anemia- and chronic kidney disease (CKD)-related parameters, our model found two new individual blood parameters as possible candidates to predict post-discharge death: albumin and hsTnI levels.
Albumin is a marker of nutrition, frailty, and inflammation [25], all of which have been individually reported to contribute to the cardiovascular disease prognosis [26,27]. Recently, the relationship between albumin level and post-discharge prognosis of AMI has been reported [28,29]. Thus, serum albumin levels are affected by various aspects of clinical situations and may represent a predictive marker for clinical outcomes in post-AMI patients.
Our study also demonstrated a relationship between hsTnI and one-year death rates in AMI survivors. The biological kinetics of troponin on admission due to AMI was associated with ischemic time, infarct size and death during hospitalization [21,30]. Additionally, left ventricular dysfunction and onset-to-balloon time were predictors of cardiovascular events after AMI [31]. Therefore, the severity of myocardial damage, as measured by hsTnI on admission, has the potential to predict the incidence of post-discharge death in AMI survivors. In our study, the multivariable logistic regression analysis eventually selected those four parameters and co-included them in our model, which provided the predictive power of post-discharge death in AMI survivors, similarly to the GRACE 2.0 model.
In 2015, Pocock et al. created a predictive model for one-year mortality in AMI [5]. That model comprised 12 clinical parameters and discriminated the risk of post-discharge death within one year after AMI. However, calculating risk may be complicated, because as many as 12 factors are required, hampering the dissemination to clinical practice, especially in the emergency setting. Furthermore, the predictive ability of that model in comparison with other models was also unknown. In contrast, our model is easy to calculate only with four variables immediately obtained at admission for AMI. Additionally, our model was able to predict the risk of post-AMI death one year after discharge, being comparable to that of the GRACE 2.0 model. Notably, the present model was useful for stratifying risk in the high-risk subpopulation classified by the GRACE 2.0 model. These findings suggest that our model is clinically helpful in improving the predictive value for the risk of post-discharge death after AMI, specifically in the high-risk population derived from the GRACE 2.0 model, simply and objectively.
Compared to those existing models, our study’s strengths and novelty were that we developed the risk-score model showing the predictive ability comparable to the GRACE 2.0 model by combining only four blood parameters, each of which has prognostic evidence in patients with AMI. Considering that each blood parameter can reflect different aspects of a patient’s medical conditions, combining those parameters could provide a comprehensive and integrated approach to risk stratification and predicting prognosis. Several models based on the combined blood parameters have predicted short-term clinical outcomes in patients with AMI [7,8,32]. To the best of our knowledge, we first show that a risk-score model based on the combination of blood parameters on admission for AMI can predict the mid-term prognosis in AMI survivors.
Our study has some potential limitations. Firstly, this study was not a multi-center, prospective design. Secondly, since the cohorts included only Japanese and in relatively small numbers, the generalizability of our findings to other ethnicities remains uncertain. Thirdly, the current analyses assessed the predictive power of a risk-score model composed of only pre-procedural blood parameters upon admission for AMI. In addition, our predictive model did not account for the laboratory parameters obtained at post-procedure and/or discharge. Therefore, we cannot determine whether the selected parameters dominantly reflect acutely evoked pathophysiological reactions due to AMI or the chronic clinical conditions of the patients. Fourthly, the platelet count was lower in non-survivors than in the survivors in the univariate analysis. Actually, the risk of bleeding complications may be augmented in patients with a lower level of platelet count by receiving antiplatelet therapy, adversely affecting prognosis. Conversely, the patients who underwent PCI for coronary artery disease should receive antiplatelet therapy according to the relevant guidelines to reduce the risk of stent thrombosis [33]. Accordingly, most subjects received that therapy upon discharge, and their prognoses with and without it were not compared in this study. Therefore, the possibility that the antiplatelet therapy upon discharge had affected prognosis to some extent in this study cohort cannot be excluded. Finally, the study focused only on the laboratory variables to develop the current risk-score model. Therefore, non-laboratory variables, such as age, vital signs and cardiac function, related to the prognosis after AMI were not considered to predict the risk of post-discharge death. Nevertheless, our laboratory-based model showed comparable performance to the GRACE 2.0 model in predicting post-discharge death and partly improved the risk stratification, specifically in the high-risk population derived from the conventional model. As the present study sought to create a laboratory-based model to predict one-year mortality after AMI, further research is required to assess whether our model can predict longer-term prognosis and/or other clinical outcomes after AMI.

5. Conclusions

Our findings suggest that the present risk-score model is useful for predicting one-year mortality in AMI survivors who underwent primary PCI simply and objectively.

Author Contributions

Conceptualization, Y.G., A.T. and K.N. (Koichi Node); methodology, Y.G., A.T. and G.Y.; software, Y.G.; validation, Y.G., A.T. and G.Y.; formal analysis, Y.G.; investigation, Y.G. and G.Y.; resources, Y.G., G.Y., K.N. (Kensaku Nishihira), N.K. and Y.S.; data curation, Y.G.; writing: original draft preparation, Y.G. and A.T.; writing: review and editing, all authors; visualization, Y.G. and A.T.; supervision, A.T., Y.S. and K.N. (Koichi Node); project administration, A.T. and K.N. (Koichi Node); funding acquisition, A.T. All authors have read and agreed to the published version of the manuscript.

Funding

This work was supported by the Japan Society for the Promotion of Science KAKENHI Grant Number JP21K08130 and the Takeda Science Foundation.

Institutional Review Board Statement

The study was approved by the Institutional Review Board of Miyazaki Medical Association Hospital (2019-30).

Informed Consent Statement

Written informed consent was waived because of the retrospective nature.

Data Availability Statement

The raw data for the study will not be shared.

Acknowledgments

We would like to thank Aya Yamada (Saga University) for her dedicated study support.

Conflicts of Interest

The authors declare no conflict of interest related to the study.

References

  1. Ibanez, B.; James, S.; Agewall, S.; Antunes, M.J.; Bucciarelli-Ducci, C.; Bueno, H.; Caforio, A.L.P.; Crea, F.; Goudevenos, J.A.; Halvorsen, S.; et al. 2017 ESC Guidelines for the management of acute myocardial infarction in patients presenting with ST-segment elevation: The Task Force for the management of acute myocardial infarction in patients presenting with ST-segment elevation of the European Society of Cardiology (ESC). Eur. Heart J. 2018, 39, 119–177. [Google Scholar] [PubMed] [Green Version]
  2. Puymirat, E.; Simon, T.; Cayla, G.; Cottin, Y.; Elbaz, M.; Coste, P.; Lemesle, G.; Motreff, P.; Popovic, B.; Khalife, K.; et al. Acute Myocardial Infarction: Changes in Patient Characteristics, Management, and 6-Month Outcomes over a Period of 20 Years in the FAST-MI Program (French Registry of Acute ST-Elevation or Non-ST-Elevation Myocardial Infarction) 1995 to 2015. Circulation 2017, 136, 1908–1919. [Google Scholar] [CrossRef] [PubMed]
  3. Fox, K.A.; Carruthers, K.F.; Dunbar, D.R.; Graham, C.; Manning, J.R.; De Raedt, H.; Buysschaert, I.; Lambrechts, D.; Van de Werf, F. Underestimated and under-recognized: The late consequences of acute coronary syndrome (GRACE UK-Belgian Study). Eur. Heart J. 2010, 31, 2755–2764. [Google Scholar] [CrossRef] [PubMed] [Green Version]
  4. Fox, K.A.; Fitzgerald, G.; Puymirat, E.; Huang, W.; Carruthers, K.; Simon, T.; Coste, P.; Monsegu, J.; Gabriel Steg, P.; Danchin, N.; et al. Should patients with acute coronary disease be stratified for management according to their risk? Derivation, external validation and outcomes using the updated GRACE risk score. BMJ Open 2014, 4, e004425. [Google Scholar] [CrossRef] [PubMed]
  5. Pocock, S.; Bueno, H.; Licour, M.; Medina, J.; Zhang, L.; Annemans, L.; Danchin, N.; Huo, Y.; Van de Werf, F. Predictors of one-year mortality at hospital discharge after acute coronary syndromes: A new risk score from the EPICOR (long-term follow up of antithrombotic management patterns in acute Coronary syndrome patients) study. Eur. Heart J. Acute Cardiovasc. Care 2015, 4, 509–517. [Google Scholar] [CrossRef]
  6. Simonsson, M.; Wallentin, L.; Alfredsson, J.; Erlinge, D.; Hellström Ängerud, K.; Hofmann, R.; Kellerth, T.; Lindhagen, L.; Ravn-Fischer, A.; Szummer, K.; et al. Temporal trends in bleeding events in acute myocardial infarction: Insights from the SWEDEHEART registry. Eur. Heart J. 2020, 41, 833–843. [Google Scholar] [CrossRef] [Green Version]
  7. O’Donoghue, M.L.; Morrow, D.A.; Cannon, C.P.; Jarolim, P.; Desai, N.R.; Sherwood, M.W.; Murphy, S.A.; Gerszten, R.E.; Sabatine, M.S. Multimarker Risk Stratification in Patients with Acute Myocardial Infarction. J. Am. Heart Assoc. 2016, 5, e002586. [Google Scholar] [CrossRef] [Green Version]
  8. Damman, P.; Beijk, M.A.; Kuijt, W.J.; Verouden, N.J.; van Geloven, N.; Henriques, J.P.; Baan, J.; Vis, M.M.; Meuwissen, M.; van Straalen, J.P.; et al. Multiple biomarkers at admission significantly improve the prediction of mortality in patients undergoing primary percutaneous coronary intervention for acute ST-segment elevation myocardial infarction. J. Am. Coll. Cardiol. 2011, 57, 29–36. [Google Scholar] [CrossRef] [Green Version]
  9. Goriki, Y.; Tanaka, A.; Nishihira, K.; Kawaguchi, A.; Natsuaki, M.; Watanabe, N.; Ashikaga, K.; Kuriyama, N.; Shibata, Y.; Node, K. A Novel Predictive Model for In-Hospital Mortality Based on a Combination of Multiple Blood Variables in Patients with ST-Segment-Elevation Myocardial Infarction. J. Clin. Med. 2020, 9, 852. [Google Scholar] [CrossRef] [Green Version]
  10. Tsai, T.T.; Patel, U.D.; Chang, T.I.; Kennedy, K.F.; Masoudi, F.A.; Matheny, M.E.; Kosiborod, M.; Amin, A.P.; Weintraub, W.S.; Curtis, J.P.; et al. Validated contemporary risk model of acute kidney injury in patients undergoing percutaneous coronary interventions: Insights from the National Cardiovascular Data Registry Cath-PCI Registry. J. Am. Heart Assoc. 2014, 3, e001380. [Google Scholar] [CrossRef] [Green Version]
  11. Goriki, Y.; Yoshioka, G.; Natsuaki, M.; Shinzato, K.; Nishihira, K.; Kuriyama, N.; Shimomura, M.; Inoue, Y.; Nishikido, T.; Kaneko, T.; et al. Simple risk-score model for in-hospital major bleeding based on multiple blood variables in patients with acute myocardial infarction. Int. J. Cardiol. 2022, 346, 1–7. [Google Scholar] [CrossRef]
  12. Thygesen, K.; Alpert, J.S.; White, H.D. Universal definition of myocardial infarction. J. Am. Coll. Cardiol. 2007, 50, 2173–2195. [Google Scholar] [CrossRef] [PubMed] [Green Version]
  13. Matsuo, S.; Imai, E.; Horio, M.; Yasuda, Y.; Tomita, K.; Nitta, K.; Yamagata, K.; Tomino, Y.; Yokoyama, H.; Hishida, A. Revised equations for estimated GFR from serum creatinine in Japan. Am. J. Kidney Dis. 2009, 53, 982–992. [Google Scholar] [CrossRef] [PubMed]
  14. Ducrocq, G.; Puymirat, E.; Steg, P.G.; Henry, P.; Martelet, M.; Karam, C.; Schiele, F.; Simon, T.; Danchin, N. Blood transfusion, bleeding, anemia, and survival in patients with acute myocardial infarction: FAST-MI registry. Am. Heart J. 2015, 170, 726–734.e2. [Google Scholar] [CrossRef] [PubMed]
  15. Kunadian, V.; Mehran, R.; Lincoff, A.M.; Feit, F.; Manoukian, S.V.; Hamon, M.; Cox, D.A.; Dangas, G.D.; Stone, G.W. Effect of anemia on frequency of short- and long-term clinical events in acute coronary syndromes (from the Acute Catheterization and Urgent Intervention Triage Strategy Trial). Am. J. Cardiol. 2014, 114, 1823–1829. [Google Scholar] [CrossRef] [PubMed]
  16. Saltzman, A.J.; Stone, G.W.; Claessen, B.E.; Narula, A.; Leon-Reyes, S.; Weisz, G.; Brodie, B.; Witzenbichler, B.; Guagliumi, G.; Kornowski, R.; et al. Long-term impact of chronic kidney disease in patients with ST-segment elevation myocardial infarction treated with primary percutaneous coronary intervention: The HORIZONS-AMI (Harmonizing Outcomes with Revascularization and Stents in Acute Myocardial Infarction) trial. JACC Cardiovasc. Interv. 2011, 4, 1011–1019. [Google Scholar] [PubMed] [Green Version]
  17. Kotwal, S.; Ranasinghe, I.; Brieger, D.; Clayton, P.A.; Cass, A.; Gallagher, M. The influence of chronic kidney disease and age on revascularization rates and outcomes in acute myocardial infarction—A cohort study. Eur. Heart J. Acute Cardiovasc. Care 2017, 6, 291–298. [Google Scholar] [CrossRef]
  18. Yadav, M.; Généreux, P.; Giustino, G.; Madhavan, M.V.; Brener, S.J.; Mintz, G.; Caixeta, A.; Xu, K.; Mehran, R.; Stone, G.W. Effect of Baseline Thrombocytopenia on Ischemic Outcomes in Patients with Acute Coronary Syndromes Who Undergo Percutaneous Coronary Intervention. Can. J. Cardiol. 2016, 32, 226–233. [Google Scholar] [CrossRef]
  19. Liu, R.; Hu, Y.; Yang, J.; Wang, Q.; Yang, H.; Wang, Z.; Su, S.; Yuan, J.; Yang, Y. Effect of Baseline Thrombocytopenia on Long-Term Outcomes in Patients with Acute ST-Segment Elevated Myocardial Infarction—A Large Propensity Score-Matching Analysis from the China Acute Myocardial Infarction (CAMI) Registry. Circ. J. 2021, 85, 150–158. [Google Scholar] [CrossRef]
  20. Yoshioka, G.; Tanaka, A.; Nishihira, K.; Natsuaki, M.; Kawaguchi, A.; Watanabe, N.; Shibata, Y.; Node, K. Prognostic impact of follow-up serum albumin after acute myocardial infarction. ESC Heart Fail. 2021, 8, 5456–5465. [Google Scholar] [CrossRef]
  21. Wanamaker, B.L.; Seth, M.M.; Sukul, D.; Dixon, S.R.; Bhatt, D.L.; Madder, R.D.; Rumsfeld, J.S.; Gurm, H.S. Relationship between Troponin on Presentation and in-Hospital Mortality in Patients with ST-Segment-Elevation Myocardial Infarction Undergoing Primary Percutaneous Coronary Intervention. J. Am. Heart Assoc. 2019, 8, e013551. [Google Scholar] [CrossRef] [PubMed]
  22. DeLong, E.R.; DeLong, D.M.; Clarke-Pearson, D.L. Comparing the areas under two or more correlated receiver operating characteristic curves: A nonparametric approach. Biometrics 1988, 44, 837–845. [Google Scholar] [CrossRef] [PubMed]
  23. Hung, J.; Roos, A.; Kadesjö, E.; McAllister, D.A.; Kimenai, D.M.; Shah, A.S.V.; Anand, A.; Strachan, F.E.; Fox, K.A.A.; Mills, N.L.; et al. Performance of the GRACE 2.0 score in patients with type 1 and type 2 myocardial infarction. Eur. Heart J. 2021, 42, 2552–2561. [Google Scholar] [CrossRef] [PubMed]
  24. Collet, J.P.; Thiele, H.; Barbato, E.; Barthélémy, O.; Bauersachs, J.; Bhatt, D.L.; Dendale, P.; Dorobantu, M.; Edvardsen, T.; Folliguet, T.; et al. 2020 ESC Guidelines for the management of acute coronary syndromes in patients presenting without persistent ST-segment elevation. Eur. Heart J. 2021, 42, 1289–1367. [Google Scholar] [CrossRef] [PubMed]
  25. Fanali, G.; di Masi, A.; Trezza, V.; Marino, M.; Fasano, M.; Ascenzi, P. Human serum albumin: From bench to bedside. Mol. Asp. Med. 2012, 33, 209–290. [Google Scholar] [CrossRef] [PubMed]
  26. Patel, A.; Goodman, S.G.; Yan, A.T.; Alexander, K.P.; Wong, C.L.; Cheema, A.N.; Udell, J.A.; Kaul, P.; D’Souza, M.; Hyun, K.; et al. Frailty and Outcomes after Myocardial Infarction: Insights from the CONCORDANCE Registry. J. Am. Heart Assoc. 2018, 7, e009859. [Google Scholar] [CrossRef] [PubMed] [Green Version]
  27. Cheng, Y.L.; Sung, S.H.; Cheng, H.M.; Hsu, P.F.; Guo, C.Y.; Yu, W.C.; Chen, C.H. Prognostic Nutritional Index and the Risk of Mortality in Patients with Acute Heart Failure. J. Am. Heart Assoc. 2017, 6, e004876. [Google Scholar] [CrossRef]
  28. Xia, M.; Zhang, C.; Gu, J.; Chen, J.; Wang, L.C.; Lu, Y.; Huang, C.Y.; He, Y.M.; Yang, X.J. Impact of serum albumin levels on long-term all-cause, cardiovascular, and cardiac mortality in patients with first-onset acute myocardial infarction. Clin. Chim. Acta 2018, 477, 89–93. [Google Scholar] [CrossRef]
  29. Yoshioka, G.; Tanaka, A.; Nishihira, K.; Shibata, Y.; Node, K. Prognostic impact of serum albumin for developing heart failure remotely after acute myocardial infarction. Nutrients 2020, 12, 2637. [Google Scholar] [CrossRef]
  30. Mahmoud, K.D.; Hillege, H.L.; Jaffe, A.S.; Lennon, R.J.; Holmes, D.R., Jr. Biochemical Validation of Patient-Reported Symptom Onset Time in Patients With ST-Segment Elevation Myocardial Infarction Undergoing Primary Percutaneous Coronary Intervention. JACC Cardiovasc. Interv. 2015, 8, 778–787. [Google Scholar] [CrossRef] [Green Version]
  31. Shimizu, A. What are the most useful predictors of cardiac mortality in patients post myocardial infarction? Circ. J. 2013, 77, 319–320. [Google Scholar] [CrossRef] [PubMed] [Green Version]
  32. Goriki, Y.; Tanaka, A.; Nishihira, K.; Kuriyama, N.; Shibata, Y.; Node, K. A novel prediction model of acute kidney injury based on combined blood variables in STEMI. JACC Asia 2021, 1, 372–381. [Google Scholar] [CrossRef]
  33. Kimura, K.; Kimura, T.; Ishihara, M.; Nakagawa, Y.; Nakao, K.; Miyauchi, K.; Sakamoto, T.; Tsujita, K.; Hagiwara, N.; Miyazaki, S.; et al. JCS 2018 Guideline on Diagnosis and Treatment of Acute Coronary Syndrome. Circ. J. 2019, 83, 1085–1196. [Google Scholar] [CrossRef] [PubMed] [Green Version]
Figure 1. Flow chart of study participant selection. ACS, acute coronary syndrome; PCI, percutaneous coronary intervention; UAP, unstable angina pectoris.
Jcm 11 03497 g001
Figure 2. Post-discharge death rates according to the risk-score estimated by the laboratory model.
Jcm 11 03497 g002
Figure 3. Receiver operating characteristic curves of the present model. AUC, area under the curve.
Jcm 11 03497 g003
Figure 4. Incidence of post-discharge death in the risk-based subgroups. A total risk score of 0–1 point was defined as low-risk, 2 points as moderate-risk, and 3–4 points as high-risk.
Jcm 11 03497 g004
Figure 5. Comparison of the predictive abilities for one-year mortality between the laboratory and GRACE 2.0 models. AUCs of the laboratory (blue) and GRACE 2.0 (red) models in the validation cohort were 0.820 (95% CI, 0.664–0.913) and 0.810 (95% CI, 0.681–0.890). AUC, area under the curve; GRACE, Global Registry of Acute Coronary Events.
Jcm 11 03497 g005
Figure 6. Dual-stratification by the laboratory model × the GRACE 2.0 model. All subjects from both study cohorts were stratified by the GRACE 2.0 model (high-risk > 8.0%, low to intermediate-risk ≤ 8.0%) and further subdivided into three subgroups by the laboratory model (low risk: 0–1 points, moderate risk: 2 points, and high risk: 3–4 points). The table below the graph shows the post-discharge one-year mortality for each subgroup. GRACE, The Global Registry of Acute Coronary Events.
Jcm 11 03497 g006
Table 1. Demographics and characteristics in both cohorts.
Derivation
(n = 949)
Validation
(n = 405)
p-Value
Age, years69.2 ± 12.168.6 ± 12.60.435
Female, n (%)250 (26.3)111 (27.4)0.635
Body mass index, kg/m224.0 ± 3.724.0 ± 4.10.789
Systolic blood pressure, mmHg142.1 ± 28.5141.0 ± 28.00.464
Pulse rate, bpm77.1 ± 19.777.3 ± 17.80.863
Medical history
 Hypertension, n (%)687 (72.4)277 (68.4)0.149
 Dyslipidemia, n (%)508 (53.5)211 (52.1)0.628
 Diabetes mellitus, n (%)264 (27.8)102 (25.2)0.317
 Smoking, n (%)467 (49.2)189 (46.7)0.391
 Previous myocardial infarction, n (%)70 (7.4)23 (5.7)0.274
 Peripheral artery disease, n (%)29 (3.1)13 (3.2)0.855
 Malignancy, n (%)45 (4.7)14 (3.5)0.288
Laboratory parameters
 White blood cell, ×102/μL96.4 ± 37.196.8 ± 33.30.857
 Hemoglobin, g/dL13.8 ± 2.113.8 ± 2.10.845
 Platelet, ×104/μL21.7 ± 6.222.1 ± 6.30.246
 Glycated hemoglobin A1c, %6.0 (5.7, 6.6)5.9 (5.6, 6.5)0.168
 Glucose, mg/dL148 (107, 189)141 (102, 181)0.196
 eGFR, mL/min/1.73 m266.2 ± 22.767.9 ± 24.10.899
 LDL-cholesterol, mg/dL122.8 ± 35.1123.6 ± 37.70.698
 HDL-cholesterol, mg/dL46.8 ± 12.048.8 ± 13.20.097
 Albumin, g/dL4.0 ± 0.54.0 ± 0.50.648
 Creatine kinase, U/L156 (96, 356)169 (100, 395)0.286
 hs-TnI, ng/L300 (50, 3180)380 (60, 3010)0.653
STEMI, n (%)640 (67.4)278 (68.5)0.709
Killip classification ≥ 3, n (%)64 (6.7)19 (4.7)0.146
LVEF (on admission), %52.4 ± 11.752.5 ± 10.60.550
Peak creatine kinase, IU/L1231 (358, 2950)1185 (299, 2687)0.337
IABP, n (%)93 (9.8)28 (6.9)0.086
ECMO, n (%)9 (1.0)2 (0.5)0.166
 Medication at discharge
  Antiplatelet therapy, n (%)940 (99.0)404 (99.5)0.214
  Aspirin (100 mg daily), n (%)899 (94.7)391 (96.5)0.131
  Prasugrel (3.75 mg daily), n (%)208 (21.9)73 (18.0)0.221
  Clopidogrel (75 mg daily), n (%)670 (70.6)308 (76.0)0.089
 Dual antiplatelet therapy, n (%)857 (90.3)377 (93.0)0.165
 Statin, n (%)860 (90.6)370 (91.1)0.844
 β-Blocker, n (%)424 (44.9)195 (48.0)0.326
 ACE inhibitor, n (%)390 (41.1)147 (36.2)0.091
 ARB, n (%)296 (31.2)147 (36.2)0.074
 Diuretic, n (%)177 (18.7)68 (16.8)0.401
Post-discharge death during one-year follow-up, n (%)30 (3.2)14 (3.5)0.785
Categorical variables are shown as numbers (%); data for continuous variables are shown as mean ± standard deviation for normal distribution or median (interquartile range) for non-normal distribution. ACE, angiotensin-converting enzyme; ARB, angiotensin receptor blocker; ECMO, extracorporeal membrane oxygenation; eGFR, estimated glomerular filtration rate; HDL, high-density lipoprotein; hs-TnI, high-sensitivity troponin I; IABP, intra-aortic balloon pumping; LDL, low-density lipoprotein; LVEF, left ventricular ejection fraction; STEMI, ST-segment elevation myocardial infarction.
Table 2. Univariate analysis of laboratory variables associated with post-discharge death.
SurvivorsNon-Survivors
(Post-Discharge Death)
p-Value
White blood cell, ×103/μL9.6 ± 3.59.4 ± 4.20.656
Hemoglobin, g/dL13.9 ± 2.011.7 ± 2.1<0.001
Platelet, ×104/μL21.8 ± 6.118.1 ± 7.30.001
Glycated hemoglobin A1c, %6.0 (5.4, 6.6)6.3 (5.4, 6.7)0.688
Glucose, mg/dL148 (123, 187)154 (119, 212)0.531
eGFR, mL/min/1.73 m266.9 ± 22.143.7 ± 28.1<0.001
LDL-cholesterol, mg/dL123.7 ± 34.893.9 ± 32.9<0.001
HDL-cholesterol, mg/dL47.0 ± 12.141.8 ± 10.70.020
Albumin, mg/dL4.1 ± 0.53.4 ± 0.5<0.001
Creatine kinase, U/L152 (96, 355)232 (77, 855)0.128
hs-TnI, ng/L280 (50, 2030)5900 (560, 21300)<0.001
Data for continuous variables are expressed as mean ± standard deviation for normal distribution or median (interquartile range) for non-normal distribution. See Table 1 for abbreviation definitions.
Table 3. Independent predictors for post-discharge death and given risk-score.
Odds Ratio95% Confidence Intervalp-ValueRisk-Score
Hemoglobin < 11 g/dL4.011.65–9.720.0021
eGFR < 30 mL/min/1.73 m23.751.53–9.190.0041
Albumin < 3.8 mg/dL3.371.31–8.670.0121
hs-TnI > 2560 ng/L (normal upper limit × 80)3.781.64–8.720.0021
See Table 1 for abbreviation definitions.
Table 4. Comparisons of AUCs between the two models according to AMI and sex statuses.
AUC of the Laboratory-Based Risk-Score ModelAUC of the GRACE 2.0 ModelΔAUCp-Value
Type of AMISTEMI0.8200.866−0.0460.124
NSTEMI0.8710.8550.0160.738
SexMale0.8310.861−0.0360.397
Female0.8360.840−0.0050.905
AMI, acute myocardial infarction; AUC, area under the curve; NSTEMI, non-ST-segment elevation myocardial infarction; STEMI, ST-segment elevation myocardial infarction. For other abbreviations, see Table 1.
Publisher’s Note: MDPI stays neutral with regard to jurisdictional claims in published maps and institutional affiliations.

